big data insights into energy and resource usage in the live-in lab
TRANSCRIPT

BachelorofScienceThesisKTHSchoolofIndustrialEngineeringandManagement
EnergyTechnologyEGI-2016SE-10044STOCKHOLM
BigdatainsightsintoenergyandresourceusageintheLive-inLabapartments
ElisabethDanielsson
AmandaKoskinen


AbstractThis report aims to find ways of getting insights into energy and resourceusage in a home with big data, based on the project Live-in Lab. Live-inLab is a project that aims to increase the innovation pace in the building andconstruction sector when developing environmental technology. This is doneby conducting implementation and research at the same time in a living labthat will be the home of about 300 students. The main objectives of this reportis to find out what is possible to measure in the apartments that is related toenergy, with what technologies and how the data can be analyzed to generatemaximal insight and utility. The methodology used originates from the field ofproduct realization.
A literature study was carried out to learn more about energy usage ina home, big data and state of the art of similar projects as well as availabletechnologies that can be used to collect data with. The technologies were in-vestigated in four different levels; Social data and IoT, Infrastructure mediatedsystems, Direct environment components and Wearable devices.
The result comprises eleven purposed solutions that get insights in pat-terns of water consumption, ventilation, light, movements inside and outsidethe apartment, consumption patterns among others. To be able to get max-imal insights and utility it was studied how the purposed solutions could becombined.
At the end, aspects of ethics were discussed as well as what data andinformation that possibly could be shared with a third party. Since the collecteddata might contain sensitive information about the residents the aspects ofethics and security is important.
The solutions and the report was discussed with one of the stakeholders,Schneider Electric. They were able to share some additional perspective ofbig data in living labs, such as what third parties that might be interested inLive-in Lab, what solutions that are possible to combine, the importance ofhaving a simple system of technology and the importance of maximising theinsights from the collected data instead of collecting a lot of separate data.
iii

Sammanfattning
Syftet med den här rapporten är att med hjälp av big data få inblicki energi- och resursanvändning i hemmet, baserat på projektet Live-in Lab.Live-in Lab är ett projekt med syftet att påskynda innovationstakten i bygg-nadssektorn vid utveckling av miljötekniska produkter och tjänster. Detta görsgenom att implementera och forska samtidigt i ett living lab som kommer in-nefatta lägenheter åt cirka 300 studenter. Huvudmålet med den här rapportenär att ta reda på vad som är möjligt att mäta i lägenheterna som är relaterattill energi, vilka tekniker kan användas och hur datan kan analyseras för attgenerera maximal inblick och användbarhet. Metoden som används för det härprojektet har sitt ursprung från projektutvecklings metodik.
Rapporten börjar med en litteraturstudie för att ge en bredare bild avenergianvändning i hemmet, big data, state of the art samt aktuella teknikersom kan användas för att samla data. Tekniken undersöktes i fyra olika nivå-er, Social data och IoT, Infrastructure mediated systems, Direct environmentcomponents samt Wearable devices.
Rapporten resulterade i elva förslag till lösningar som ger inblick i beteen-den kring vattenkonsumtion, ventilation, vädring, ljus, rörelsemönster inomhusoch utomhus, konsumtionsvanor med mera. För att ge maximal inblick under-söktes även hur de framtagna lösningarna går att kombinera.
Slutligen diskuteras aspekten kring etik när man samlar in och behandlarstora mängder data, samt vilken data som skulle vara av intresse för en tredjepart. Eftersom de förslagna lösningarna eventuellt kommer att innehålla känsligoch personlig information om de boende i Live-in Lab är etik och säkerhetviktiga aspekter att ta i beaktning.
Lösningarna och rapporten i sin helhet diskuterades med en av intressenter-na till Live-in Lab, Schneider Electric. De delade med sig av ytterligare aspekterkring big data i living labs; vilka ytterligare berörda parter skulle tänkas varaintresserade, vilka av lösningarna går att kombinera, vikten av att ha ett enkeltvälfungerande system samt vikten av att maximera nyttan av insamlad dataistället för att enskilt samla in olika sorters information.
iv

Acknowledgements
This report is the result of a bachelor of science thesis at the department of EnergyTechnology at Royal Institute of Technology in Sweden, at School of IndustrialEngineering and Management. The result would not have been possible withoutthe support from our supervisor and the ones involved in the Live-in Lab project.We would especially like to thank the following people:
Monika Schildknecht and Kristoffer Eldin at Schneider electric for taking thetime to give us some valuable feedback.
Niccolas Albiz, Jonas Anund Vogel and others involved in the Live-in Lab projectfor answering questions, giving valuable advice and letting us participate at meet-ings.
Last but not least we would like to thank our supervisor Omar Shafqat for beingpatient, guiding us through this whole process, providing new approaches, but alsofor reviewing this report.
Elisabeth DanielssonAmanda Koskinen
Stockholm, May, 2016
v

Contents
Abstract iii
Sammanfattning iv
Acknowledgements v
Contents vi
Nomenclature ix
1 Introduction 11.1 Background . . . . . . . . . . . . . . . . . . . . . . . . . . . . . . . . 11.2 Objective . . . . . . . . . . . . . . . . . . . . . . . . . . . . . . . . . 21.3 Methodology . . . . . . . . . . . . . . . . . . . . . . . . . . . . . . . 21.4 Limitations . . . . . . . . . . . . . . . . . . . . . . . . . . . . . . . . 31.5 Assumptions . . . . . . . . . . . . . . . . . . . . . . . . . . . . . . . 3
2 Literature study 52.1 Live-in Lab . . . . . . . . . . . . . . . . . . . . . . . . . . . . . . . . 52.2 Energy usage . . . . . . . . . . . . . . . . . . . . . . . . . . . . . . . 62.3 Big data . . . . . . . . . . . . . . . . . . . . . . . . . . . . . . . . . . 7
2.3.1 Social big data . . . . . . . . . . . . . . . . . . . . . . . . . . 92.3.2 Internet of Things . . . . . . . . . . . . . . . . . . . . . . . . 9
2.4 Devices to collect data with and systems that use big data in a home 102.4.1 Wearable devices . . . . . . . . . . . . . . . . . . . . . . . . . 112.4.2 Direct environment components . . . . . . . . . . . . . . . . . 122.4.3 Infrastructure sensors . . . . . . . . . . . . . . . . . . . . . . 17
2.5 Other smart technologies and services . . . . . . . . . . . . . . . . . 172.5.1 Geofencing . . . . . . . . . . . . . . . . . . . . . . . . . . . . 172.5.2 Mesh network . . . . . . . . . . . . . . . . . . . . . . . . . . . 182.5.3 Waste tracking . . . . . . . . . . . . . . . . . . . . . . . . . . 182.5.4 Load forecasting . . . . . . . . . . . . . . . . . . . . . . . . . 192.5.5 Smart windows . . . . . . . . . . . . . . . . . . . . . . . . . . 19
2.6 State of the art . . . . . . . . . . . . . . . . . . . . . . . . . . . . . . 19
vi

2.6.1 HSB Living Lab . . . . . . . . . . . . . . . . . . . . . . . . . 192.6.2 PlaceLab . . . . . . . . . . . . . . . . . . . . . . . . . . . . . 202.6.3 The active house in the sustainable city . . . . . . . . . . . . 212.6.4 Smart cities . . . . . . . . . . . . . . . . . . . . . . . . . . . . 212.6.5 Stockholm Royal Seaport . . . . . . . . . . . . . . . . . . . . 22
3 Development of concepts 233.1 Methodology . . . . . . . . . . . . . . . . . . . . . . . . . . . . . . . 233.2 Brainstorming . . . . . . . . . . . . . . . . . . . . . . . . . . . . . . . 243.3 Solutions . . . . . . . . . . . . . . . . . . . . . . . . . . . . . . . . . 253.4 Evaluation and aspects of security and privacy . . . . . . . . . . . . 26
4 Concepts for analyzing energy and resource usage with big datain Live-in Lab 294.1 Water consumption . . . . . . . . . . . . . . . . . . . . . . . . . . . . 294.2 Ventilation . . . . . . . . . . . . . . . . . . . . . . . . . . . . . . . . 314.3 Ventilation through windows . . . . . . . . . . . . . . . . . . . . . . 324.4 Light . . . . . . . . . . . . . . . . . . . . . . . . . . . . . . . . . . . . 344.5 Movement inside the apartment . . . . . . . . . . . . . . . . . . . . 354.6 Movements outside the apartment . . . . . . . . . . . . . . . . . . . 374.7 Consumption . . . . . . . . . . . . . . . . . . . . . . . . . . . . . . . 384.8 Social data . . . . . . . . . . . . . . . . . . . . . . . . . . . . . . . . 394.9 Summary and further analysis . . . . . . . . . . . . . . . . . . . . . . 40
5 Discussion and Conclusions 435.1 Ethics . . . . . . . . . . . . . . . . . . . . . . . . . . . . . . . . . . . 435.2 Sharing data with a third party . . . . . . . . . . . . . . . . . . . . . 445.3 Discussion of solutions . . . . . . . . . . . . . . . . . . . . . . . . . . 455.4 Conclusions . . . . . . . . . . . . . . . . . . . . . . . . . . . . . . . . 475.5 Future work . . . . . . . . . . . . . . . . . . . . . . . . . . . . . . . . 48
Bibliography 49
Appendices
A Solutions draft 1 53
B Ranking 57
C Solution 4-6 59
vii


Nomenclature
AbbreviationsAbbreviation DescriptionSEK Swedish kronorRFID Radio Frequency IdentificationWSN Wireless Sensor NetworkHSB Hyresgästernas Sparkasse- och ByggnadsföreningSMS Short Message ServiceKTH Kungliga Tekniska HögskolanGPS Global Positioning SystemUSA United States of AmericaMIT Massachusetts Institute of TechnologyIoT Internet of ThingsIFTTT "If this, then that"SWOT "Strengths", "Weaknesses", "Opportunities" and "Threats"DDDM Data Driven Decision ManagementLED Light Emitting DiodeCCTV Closed-Circuit TelevisionICT Information and communications technologyTV Television
ix


Chapter 1
Introduction
This chapter introduces the background, objective, method, limitations and assump-tions of the project.
1.1 Background
Residential and commercial buildings use a big part, 39%, of the total amount ofenergy produced in Sweden. Of those 39% about 60% goes to hot water and heatingrespectively, and the rest is for electricity usage [SP Sveriges Tekniska Forskningsin-stitut, 2011], [Energimyndigheten, 2016] [Kungl. Ingenjörsvetenskapsakademien,2008]. Therefor, decreasing the amount of energy used by this sector would havean significant impact on the energy usage in Sweden. To find new ways of reducingthe energy usage new technologies need to be developed. Another issue is that theenergy demand is concentrated to specific times of the day. These peaks of energyusage makes the renewable energy sources insufficient, which makes the fossil fuelsplay an important part of the energy supply. Since this is not desirable the en-ergy usage in homes need to be distributed more evenly during the day. Therefore,technologies need to be implemented in the homes so that the renewable energysources can meet the demands at a higher rate. Today the innovation pace in theconstruction and building sector is too slow, to be able to reach set energy goals[Sandra Backlund, et.al., 2012], [EU-upplysningen, 2016], [Kungl. Ingenjörsveten-skapsakademien, 2008]. The research project Live-in Lab aims to increase the in-novation pace. This is made by doing both research and implementation at thesame time, in a living lab. The Live-in Lab project is partly the effect of a study[Jonas Anund Vogel, Per Lundqvist, Jaime Arias, 2015] that found several barri-ers that exists when implementing new technologies in new apartment blocks andwhen renovating old ones, some of these barriers are listed in the next chapter.The lab will be the home to 300 students that will contribute to research just byliving their ordinary life at home. The behaviour and habits of the residents willbe studied with big data analysis. A quotation from the mathematical physicistand engineer William Thomson is appropriate here, “If you cannot measure it, you
1

cannot improve it.”
1.2 ObjectiveThis project aims to study the energy usage in residences with the help of bigdata analysis. What is possible to measure and with what technologies can it bemeasured? How can data be analyzed to generate maximal insight and utility?
Additional objectives• What can we learn from former or ongoing similar projects?
• How often should data be collected?
• Should some data be made available for third parties?
• Are there any concern for privacy and data security?
• In addition to “traditional energy data” what other types of data can addvalue to the data sets to bring more insight into energy behaviours.
1.3 MethodologyThe methodology used originates from the field of product realization discussed byUllman [David. G Ullman, 2009] where several steps are carried out to come upwith new products and services. This project was a iterative process as shown inFigure 1.1. The first step is about identifying the needs and then investigating them.In this project the needs from both the residents, the ones involved in Live-in Laband the researchers were identified and investigated. This was made by studyingthe energy system and usage in homes and collecting insight in what Live-in Labaims to achieve. A literature study was carried out to gather relevant information,learn about the available technology in relevant areas and identifying the needs ofreducing the energy and recourse usage. Information was found in research reports,articles and at agencies’ websites among others. After this concepts and models weredeveloped. This was done by a brainstorming, followed by evaluations and refiningof the solutions. By using insights from the literature study several aspects of thesolutions were developed such as; technologies, analysis and aspects of security andethics. To be able to get maximal insight and utility the purposed solutions werecombined and analysed. Through out the process meetings within the Live-in Labproject were attended, and interviews and study visits were done continuously tokeep up with current research and to receive inspiration and a greater perspective.
2

Figure 1.1. A product development process
1.4 LimitationsThe most significant limitation is that this Live-in Lab system is not existing, whichmakes it difficult to know about all the circumstances. No concerns are taken tothe back end such as how the big data is stored or the business aspect such as howthe cost for suggested solutions are justified. Security aspects when collecting andanalysing data are not considered during all phases, but is discussed. The mainfocus regarding security is the aspects of the privacy of the residents.
1.5 AssumptionsThis report does not take into account what legal issues there might be when col-lecting big amounts of private data from peoples everyday life. There is also anassumption that there are no limitations in accessing social data.
3


Chapter 2
Literature study
This chapter introduces the theory behind the thesis project; relevant technologies,identifies the needs of reducing the energy and recourse usage and presents similarprojects that have been done before.
2.1 Live-in Lab
Live-in Lab is a collaboration between KTH and Einar Mattsson, among others,and will produce about 300 student homes at Campus Valhallavägen at KTH. Theaim with the project is to shorten the lead time from research to implementationand increase the innovation pace in the construction and building industry, and bydoing that find new ways to decrease the consumption of resources in our currentand future homes. The Live-in Lab enable research in several fields connected toconstruction, energy and living, and the researchers are able to execute their workin a real environment. Live-in Lab origins from the result of a report, [Jonas AnundVogel, Per Lundqvist, Jaime Arias, 2015], that found several barriers, at threedifferent levels, that stands in the way when implementing new technologies whenconstructing and renovating apartment buildings. Some of the found barriers were:
Institutional framework for the two following levels.- Different incentives for the involved actors.- Not enough contact between energy user and energy producer.Building industry- Unsatisfied methods of giving and receiving feedback.- Deficient communication between the actors such as companies, organizations,and academia.- Research and development only at company levels limit possibilities of progress.Singular building projects- Poor knowledge and low interest in energy related topics.- Lack of transparency which block development in the system.- Fear of having increased operation costs and risks when new technology is intro-
5

duced.
Live-in Lab aims to integrate several actors such as the industry, academia andsociety to an open and neutral environment without competition. The hope isto distribute and reduce risks, uncertainties and costs. Products and services canbe tested and verified. Norms and regulations can be stretched, questioned andchanged. All with the object of increasing the innovation pace and finding newproducts and services. The Live-in Lab project will consist of an active part with4-6 apartments that can be rebuilt according to the current research work. The restof the apartments are passive apartments. In the passive area the focus is to collectdata and measure consumption of resources, living behaviour or other informationthat can be used to transform future construction work and increase the energyefficiency. This study will focus on the passive part of the Live-in Lab.
2.2 Energy usageThe end usage of energy in homes vary depending on unit type and building age,but on the average apartment the energy is distributed as in Figure 2.1 below. SinceLive-in Lab is aiming to develop products and services for the building and construc-tion industry it is interesting to investigate where energy is used in a home. Themost energy goes to heat losses through the ventilation and envelope of the building,and the third biggest energy user is domestic hot water. [Hossein Shahrokni, FabianLevihn, Nils Brandt, 2014] The water tank stores hot water, at least 60°C, in thetank around the clock even if it is mostly used during the mornings and evenings. Itis the light, freezer, fridge and cooking that consumes most electricity in the averagehome, but the electronic devices is steadily increasing its consumption.
Figure 2.1. The distribution of energy in the average apartment in Stockholm.
6

Commercial and residential buildings use about 39% of the total amount ofenergy produced in Sweden. [Energimyndigheten, 2016] Currently this sector isresponsible for about 15% of Sweden’s total greenhouse gas emissions. ThereforSweden is to decrease these emissions with 17% before 2020 and with 50% before2050 (compared to the levels of 2005). [EU-upplysningen, 2016] To reach these goalsbuildings need to be more energy efficient. The goal, set by the Swedish government,is to be 20% more energy efficient by 2020 compared to 2008. [Regeringen, 2016]A general estimation is that energy usage in residences can be reduced by 20% bychanging behaviours and habits [SP Sveriges Tekniska Forskningsinstitut, 2011].
On weekdays the demand of electricity, hot water and heating is highest duringthe mornings and evenings. There are also variations between the seasons. Astudy [SP Sveriges Tekniska Forskningsinstitut, 2011] found that the total amountof energy produced during January was about three times as high as the amountproduced in July. At the same time the emissions in January were 15 times as highas in July, since the seasons when the energy demand is high requires coal as thedominant fuel.
When summing up the total electricity and energy usage of all Swedish residencesthese variations makes distinct highs and lows. If the consumption were more eventhe renewable energy source could be used at a higher rate, this is called loadshifting, and would make the system more environmentally friendly [SP SverigesTekniska Forskningsinstitut, 2011]. When having these peaks of energy demandthe fossil fuels gets more important since the renewable sources can not provide thesystem enough energy during the peaks. Another solution is to make the energyusage follow the energy mix of the renewable sources. This can be made by forexample storing energy when it is not needed in batteries or sell the excess energyand for example use batteries when the renewable sources are not meeting thedemand.
2.3 Big data
From the beginning data was entered by employers by hand and the volume ofdata were manageable. When the technology evolved and the world wide web wasopened for everyone and the ones using it started to enter data themselves thevolume of data increased and also the velocity and variety of the data streamsgrew. Velocity is the frequency of incoming data that needs to be processed, andvariety is the different kinds of data such as SMS messages, Facebook status updatesor credit card swipes. The next step in the evolution of data was when machinesand sensors et cetera started to collect data and the streams become even moreunmanageable. Three V’s: volume, velocity and variety were distinguish and theterm big data was created. To this one more V has been added, veracity, whichrefers to the trustworthiness of the data. With many forms of big data, quality andaccuracy are less controllable, but the volumes often make up for the lack of qualityor accuracy.[Bernard Marr, 2015]
7

The interesting part of big data is not the large amount of data or the differentforms of data but the information that can be found from analyzing the data. Byanalyzing data in real time together with historical data, patterns can be distin-guished and insights and information of what happened and why it happened canbe realized.
In the article Big Data Analytics [Deborah Gonzalez, 2014], Oracle stated fiveapproaches when analysing big data to get insight:
Discovery Tools: The user interact with the data, that can be both structuredand unstructured and comes from different sources, to understand and display re-lationships and apply them to issues.Business Intelligence Tools: Analyze transactional business data to get infor-mation about the data. This is a much more technical approach than the previous.In-Database Analytics: Processing the data in a database to find patterns andhow different data relate to each other. This is used to conserve resources.Hadoop: A programming framework that can be used as a tool when analysingbig amounts of data and developing applications.Data Driven Decision Management (DDDM): Uses self learning, data pre-dictive models, data analysis and business rules to make decisions.
The potential of big data are endless and can be implemented in all kinds ofindustries. Products can learn, adapt to the environment and to the users needs,service themselves, and operate on their own. Advertising can be personalized andadjusted according to your mood. Additionally, in products variability is expensivesince it requires physical parts to be varied. The software in smart, connectedproducts makes variability cheaper since digital user interfaces can replace buttonsand physical applications, making it easy and less expensive to change, repair orpersonalize a product. [Michael E. Porter and James E. Heppelmann, 2015]
When gathering this large amounts of data the security becomes an issue. Whereshould the data be stored and who should get access to it? Maribel Lopes, MobileMarket Strategist, [Deborah Gonzalez, 2014] mentions three components of dataregarding security. Data in creation, data at rest and data in transit. During all ofthese phases there are problems that need to be considered regarding for examplecoding, encryption, storing data, destroying data et cetera. There are also securityand integrity aspects such as the protection needed when personal information ordata of business value is getting collected. Since the data in this report is collectedand stored, for Live-in Lab, the main security issue regards what is acceptable tomeasure from a peoples personal life. Data can be classified depending on what theneeded level of security is. Can the data be made public, is it for internal use only,is it company confidential or is it even highly confidential. By classifying data likethis it is for example easier to decide who should have access to the data. [DeborahGonzalez, 2014] What data can be made into business, what can be displayed forthe residents and what should only be available for the researchers in Live-in Lab?This report does not discuss the security and privacy in a detailed way except for
8

discussions about security and privacy regarding the purposed solutions for Live-inLab.
2.3.1 Social big dataSocial big data is another aspect of big data. Today we live in a connected worldand social big data is a term that includes information we share on social networks,social media data. Facebook, LinkedIn, Twitter and Instagram are a few examples ofapplications that generate a stream of information daily. About 400 millions tweetsare published on Twitter every day and social media data can be used as "listeningplatforms" to understand the motives behind actions [Camacho, Bello-Orgaz andJung, 2015]. University of Cambridge and Stanford University published a study in2015 about how Facebook knows you better then your friends and family [Clifton B.Parker, 2015] . Everywhere we go we leave digital traces with information that notonly include place and time. When registering the public transport pass, performinga Google search, shopping online, streaming TV, using a GPS, are on the phone etcetera. Owing to the information you share, Facebook and other technologies areable to analyse you, your mood and your patterns better than people close to you.With this information they can predict future actions and offer personalized services.Today there are many companies offering services that analyze social media. Forexample MyBuys uses over 200 million consumer profiles and 100 terabytes of datato deliver real-time product recommendations. Social big data can be used to forexample analyze the moods or needs of the residents in Live-in Lab. If "the home"can understand its habitats it can communicate with or adapt to them.
2.3.2 Internet of ThingsIoT, Internet of Things, is an other aspect of big data and is an interesting perspec-tive of this report. IoT means connecting an object to Internet and generates bigdata. With the broadband becoming a part of every city’s basic services and withthe decreasing cost of technology and connecting devices IoT becomes a bigger partof our lives. IoT can be implemented in our coffee maker as well as in an jet engineof an airplane. With this you can start the coffee maker from the bed with yoursmartphone or get an alert from the jet engine when it is in need of reparation.Or your car can have access to your calendar and know the best route to get to ameeting.
Studies indicates that by year 2020 50 billion devices will be connected to theInternet [Dave Evans, 2011] . The development of objects connected to the Internetis shown in Figure 2.2
In the Live-in Lab project IoT plays an important role in order to obtain controland be aware of the energy usage or resource consumption.
9

Figure 2.2. The development of Internet of Things.
2.4 Devices to collect data with and systems that use bigdata in a home
This report is discussing three ways of detecting the activities regarding humanactivity and energy usage in a home. A fourth one include social data and IoT andcan be used to find patterns outside the home. The hierarchy of the different waysof collecting data is visualised in Figure 2.3
Figure 2.3. The hierarchy of ways to collect data.
Wearable devices: Sensors can be attached to objects or objects that humanswear to detect for example movement. This can be done with RFID tags and read-
10

ers. Motion detectors can be used to sense the presence of people in a home orroom and their location, and switches can be used to detect the state of a door orwindow.Direct environment components: This category consists of systems that areintegrated in the home. Sensors are distributed in the home and interact with eachother. The sensors are part of a network and the collected information is used tobe able to optimize the energy usage in the home and is often displayed to the user.A smart meter measures energy, water or natural gas consumption of a buildingor home, and is connected to the Internet. Traditional meters only measure thetotal consumption, but a smart meters detects when and how much of a resourceis consumed and display the information on a in-home display. A smart energymonitor connects home appliances and electronic devices to the Wi-Fi network andallows the user to make schedules, program notifications and change their statusfrom anywhere. Smart thermostats can adjust inside temperature with the help ofsensors in all rooms, access to the outside temperature and then make the rightadjustments for optimal comfort and energy conservation.Infrastructure mediated systems: The usage of electricity and water, amongothers, can be detected by installing sensors into the existing infrastructure in ahome, e.g. plumbing.Social data and IoT: Social data and the use of IoT can give valuable informationabout for example consumption patterns of the residents. This is more about devel-oping algorithms and not specific devices, therefore it is not discussed in this section.
2.4.1 Wearable devicesRadio frequency identification and wireless sensor networks
To be able to track applications or to collect environmental data, wireless sen-sor networks, WSN, can be implemented in active radio frequency identification,RFID, tags. RFID tags make it possible to track and identify objects and send thatinformation to its readers. WSN can gather and store information such as the mea-surement of temperature, humidity, sound intensity, power-line voltage, pollutantlevels, etc. To integrate these two with each other can give real time information,alerts and warnings. [Aikaterini Mitrokotsa, Christos Douligeris, 2009] [Hai Liu,Miodrag Bolic, Amiya Nayak, Ivan Stojmenović, 2008]
Applications when integrating WSN to RFID
The WSN can detect movement and with the help of RFID it is possible to getinformation about who or what is moving. With the RFID tags for example thesettings of the light in rooms can be customized according to what the differentusers prefer, since the tags can make a system recognize who is entering a room. Ifseveral people is in the same room the settings can adjust to an average. [SajisdHussain, Scott Schaffner, Dyllon Moseychuck, 2009] RFID tags integrated to WSN
11

have also been used by the U.S Navy to be able to track the condition of storedaircraft parts. They are using battery powered sensor tags that can communicateand send information between each other. These RFID sensor-tags are able toget information about temperature, humidity, air pressure. Since the security isimportant the information is sent only when the tags are contacted from a basestation, which also has to send a security code. [Hai Liu, Miodrag Bolic, AmiyaNayak, Ivan Stojmenović, 2008]
Applications of RFID
RFID readers can also be used to monitor interaction with tagged objects. Thiswas used in the PlaceLab project which is discussed in the State of the art-section.
The SmartPlug system provides a household to keep track of their electronicsby placing a RFID reader on every power outlet on the wall and a RFID tag onevery electrical device’s plug. When a device is plugged into an outlet the readerreads the tag and sends information to a computer that can identify the applicantand its location. To monitor how electrical devises are used can help the residentsto get insight in their use of electronics, as well as send alarms when somethingunexpected happens. [Dan Ding, Rory A. Cooper, Paul F.Pasquina, Lavinia Fici-Pasquina, 2011]
Switches
Switches can be used to find out the status of for example door or windows, arethey opened or closed?
Motion detectors
Motion detectors react to motion. They can be places in for example a doorway tobe able to notice when someone is entering a room. This can be used to managelamps, thermostats or ventilation systems.
Applications of sensors in the home
A sensor system installed in a apartment can monitor how a person behaves, monitorpatterns and notice when they are changed. These kinds of data can be used toalert the resident about behaviors that may effect for example its health or effortsto save energy at home. [Healthsense, 2016]
2.4.2 Direct environment components
The range of products offering services to manage the energy usage in homes isconstantly growing. Smart meters, smart energy monitors and thermostats comesin many different shapes and below they are discussed in general and some of theavailable brands on the market are mentioned.
12

Smart meters
A smart meter measures energy, water or natural gas consumption of a buildingor home, and is connected to the Internet. Traditional meters only measures thetotal consumption, but a smart meters detects when and how much of a resource isconsumed and displays the information on a in-home display. The traditional smartmeters are smart by collecting data more often than the old electricity meters dowhich gives more detailed information about the electricity consumption. Thismakes it possible for the utility to set different prices during different times of theday and year. When the demand is high the price might be high. By doing thisthe customers can be motivated to shift their electricity usage to times when theelectricity is cheaper, which will contribute to peak shaving. Since it is connectedto the Internet there is no need for the utilities to go home to their customers to beable to read it. The new smart meters also offers a two way communication thatoffers the utilities to be informed when there is a problem, e.g. a power outage, andinformation about for example time-of-use pricing can be sent to the home.
Smart energy monitor
Residents can get insights in their energy usage with a smart energy monitor, whichgives real-time feedback on the energy usage and what it is costing. With thissystem they will know what the utility bill will be before they receive it. [KaileZhoua, Chao Fua, Shanlin Yang, 2014]
There are systems that include sensor systems that detect when someone is inthe room. This makes it easy to save energy since appliances such as lights onlyare activated when someone needs them. Some even monitors the carbon dioxideemissions to determine the carbon footprint of the activities in the home. [Efergy,2016] Apps can be downloaded to a smartphone to be able to turn lights on whenentering the house or turn a fan of when leaving the house. With the GPS functionin smartphones a smart home system can put the home in "away mode" when theresidents are leaving the house to save energy.
A smart energy monitor can help the user to manage the energy usage in severalways. First it monitors the energy usage and gives updates for example every fifthsecond, so the user instantly can see the effect of turning on for example a light. Itdisplays the daily average so that the user can see when the electricity consumptionis higher than normal and see how the average usage reduces as the user changethe way he or she does things. [Efergy, 2016] A smart energy monitor can alsohelp distributing the energy usage more evenly during a day or a week since itdisplays information about the energy usage to the user, instead of having theenergy usage peak at specific times. If the consumer gets information about itsenergy usage patterns and when the energy is cheaper this will encourage to changepatterns.[Shafik Ahmad, 2011]
WeMo is a smart energy monitor that connects home appliances and electronicdevices to the Wi-Fi network and allows the user to turn them on and off, program
13

Figure 2.4. Schedule devices with WeMo Figure 2.5. Status of connected devices
notifications and change their status from anywhere. WeMo monitors the connecteddevices and displays their electricity consumption for the user. The coffee makercan be schedule, as seen in Figure 2.4, to start at a specific time and the user canfind out if the space heater has been left on when leaving the home.
The system motivates the user to keep the electricity bills low by setting sched-ules, monitor energy usage, as seen in Figure 2.5, and displays which devices thatare used most often.
The motion sensors in the WeMo system can make the lamps go on only whensomeone is in a room. Then the user does not have to remember to turn the lightsoff. The motion sensors can also be set to only react during specific times of theday to prevent them from being turned on by for example the cat at night. Withthe integration of "If this, then that" (IFTTT) the user can connect the WeMo toJawbone UP. By doing this lights can be set according to your habits. They canbe turned on when the user wakes up in the morning, or it can be set to turn thelights on after for example 8 hours of sleep. IFTTT can also be used to turn the airconditioner of when the air in the room is at a specific temperature. By installingsmart plugs where appliances are plugged in to the wall users can get information,through an app, on how much electric power a specific product consumes and forhow long it has been used. [Dario Bonino, Fulvio Corno, Luigi De Russis, 2011]
Ventilation and air quality
There are sensors that senses the condensation, humidity and mold in a room. Byimplementing these, for example excess humidity can be found. The system that the
14

sensors belong to will be activated and turn on the fan. There are several settingsthat the user can adjust such as sensor sensitivity, humidity level and set schedulesto meet the need of ventilation in that specific room. [Leviton, 2016] Other smartsystems measure the indoor air quality and displays to the user if the air is pollutedor not. In a smartphone app it can display historical data, pollution peaks, send anotification when crossing a threshold defined by the World Health Organization andsend warnings when there are predicted pollution peaks. It detects: Volatile OrganicCompounds (including gases such as Formaldehyde, Benzene, Toluene, Ethyleneglycol, etc.), Particulate Matter, Carbon Dioxide, Carbon Monoxide, Temperatureand Humidity [The Foobot Team, 2016].
Thermostats
Thermostats are useful tools to save energy from heating and cooling systems ina home. Much of the energy used by these systems is used for space conditioningduring times when the home is unoccupied or occupants are sleeping, during thesetimes energy can be saved. The temperature at home can be adjusted by ther-mostats that have sensors in all rooms, access to the outside temperature and thenmanage the system to put the home at a comfortable temperature and save energy.The sensors also notice if any one is home at all, which rooms that are occupied andadjust the thermostat to that. Many of the available systems are connected to Wi-Fiwhich makes it possible to control the temperature from your smartphone. [ecobee,2016] In addition to the traditional manual thermostat there are programmable andself-programmable thermostats. A programmable thermostat gives the user the op-portunity to schedule the times the heating or air conditioning are turned on. Oneexample of a self-programmable thermostat is the Nest Learning Thermostat, whichdisplays the current data etc as seen in Figure 2.6.
Figure 2.6. Nest displays the current status
15

Nest’s Auto-Away setting can determine when the home is unoccupied and ad-just the temperature in the home to that. The Auto-Schedule feature learns thebehaviour of the users when they successive set the thermostat and automaticallyprograms a changeable schedule. The user can also manage the Nest with a smart-phone and get a monthly energy report. By doing this the user can see the historyof its energy usage.
Two studies [Nest labs, 2015] were carried out in Oregon and Indiana, each in-dependently funded, a third was performed by the Nest in 41 states in USA. Inthese three studies the participants were Nest users. The study compared energyusage before and after installing Nest Learning Thermostat. The results from thethree studies were similar and showed that the homes had been saving energy af-ter the Nest was installed. 10-12% of heating energy was saved and 15% of theelectricity used when cooling the homes with central air conditioning was saved.Another study [Carlyn Aarish, Matei Perussi, Andrew Rietz, Dave Korn, 2015]compared the savings between the users of Nest Learning Thermostat and pro-grammable thermostats. The results showed that the homes using Nest saved morewhen heating their homes as seen in Table 2.1 below.
Table 2.1. Savings of heating by using Nest thermostat
Test group Savings [%] Range of savings [%]Nest 10 8-11Programmable 2.5 1-4
The study contained 300 households that received a Nest thermostat, 300 house-holds received a standard programmable thermostat and a control group of 3,845households continued to use a manual thermostat.
Showertime
Showertime allows the user to monitor the amount of water used each shower. Itdisplays the current water usage, as seen in Figure 2.7, and a alarm will go off whenthe set target amount of water have been used. [Efergy, 2016]
16

Figure 2.7. The display fills up during the shower so the user can keep track of itswater consumption.
2.4.3 Infrastructure sensors
To install sensors in the already existing infrastructure in a home can give interestinginformation about gross usage and is quite cheap since it only requires a few sensors,but it does not give details of the circumstances regarding the activities that mightbe interesting. For example a study was conducted on how to detect motion ina home. Pressure sensors were installed in the existing duct work infrastructureof central heating, ventilation and air conditioning systems to sense how peoplemove in a house. By sensing the changes in pressure the system could detect aperson walking through a specific doorway or closing or opening a door. This wasmade by Patel which succeeded to measure this with 75-80% accuracy. [ShwetakN. Patel, Matthew S. Reynolds and Gregory D. Abowd, 2008] When the purposeis to manage systems in the home it is more common to use motion sensors. Byinstalling motion sensors in the home the heat and ventilation can be shut down orregulated depending on if the residents are at home and what rooms they are using.HydroSense is a system that can be installed in for example a utility sink spigotin the existing water infrastructure. The system analyzes the pressure to detectwhen and how much water that is being used. [Dan Ding, Rory A. Cooper, PaulF.Pasquina, Lavinia Fici-Pasquina, 2011]
2.5 Other smart technologies and services
2.5.1 Geofencing
Thermostats and other smart meters can use geofencing to manage their systems.Geofencing is an invisible boundary around a neighborhood that recognizes whenthe user crosses it. When the invisible line is crossed, the device communicateswith an app in the users smartphone, and act depending on if the user is leaving or
17

coming home. With this technology there is no need of learning patterns or scheduleprogramming. [thecoolist, 2016].
2.5.2 Mesh network
Instead of having sensors that control lights and other devices there are systemsthat uses bluetooth to form a mesh network. The network is connected to an appand senses where the user is at home to manage for example the lights. A plug isinstalled in the electrical socket before plugging in the appliance that the user wantsto control. This does though require that the residents carry their smartphoneswhen at home, which might not be the case today. On the other hand lights willnot be turned on when a pet enters a room [Michael Brown, 2016].
2.5.3 Waste tracking
IoT can be used to optimize waste management and make the process more person-alized and simplified for the end user. By using RFID keys the residents can keeptrack of their individual waste disposal and get information about how to recyclebetter. The information can be sent to the end user by applications and web. Another important aspect of having RFID keys is that the ones responsible for thecollection of the waste can get real time information about for example how muchwaste is dumped, which times and which materials that is sorted. They can alsodecide when people will be able to recycle if needed. [Stockholms stad and Envac,2016]. Furthermore a smart way of using IoT in waste management is as a scalesystem. By having a scale system to measure the percentage of waste in a containerthe transportation costs and emissions can be minimized. The responsible for thesystem will always be aware about the amount of waste in the containers in orderto be able to empty them only when they are full, as seen in Figure 2.8 [Stockholmsstad, 2015].
Figure 2.8. Efficient waste management
18

2.5.4 Load forecastingLoad forecasting is one important area when talking about big data in terms ofenergy. With historical load data, weather data and social factors, et cetera it ispossible to forecast the future demand of energy. There are also often similaritiesin demand between houses in the same area. With this knowledge strategies can bedeveloped to offer personalized energy services, such as help consumers develop theirenergy saving plans. Load forecasting can help to even out the energy usage withthe advantages which were mentioned in the section about Energy usage. [HeikoHahn, Silja Meyer-Nieberg, Stefan Pickl, 2009]
Time-of-use electricity pricing
Some electricity suppliers offer electricity contracts where the prises vary during theday. To take advantage of this the users can schedule their energy usage to whenit is at its cheapest. This will make the electricity demand more even during theday since the the usage will shift from on-peak to off-peak periods when possible.This will make the strain on the electricity system more even, be beneficial for theenvironment and lower the electricity bills for the users. Another idea is to useenergy from batteries when the electricity is more expensive and then re-chargethe batteries when the electricity is cheaper. This method has been used at IBM’sadministrative headquarters and they estimate that the energy costs can be reducedby 3-5%. [IBM, 2013]
2.5.5 Smart windowsSmart windows can be used to decrease the demand of heating and cooling in ahome, as well as decrease the use of lamps. The smart windows available todaycan run automatically and adjust themselves to the current state, or be controlledwith a smartphone. By admitting natural daylight and rejecting solar glare, smartwindows can lower the energy costs. The window will maximize the use of daylightand minimizing heat and glare.
2.6 State of the artIn this section similar projects are studied as well as smart cities which is an im-portant aspect to get the bigger picture of the word smart smart and IoT.
2.6.1 HSB Living LabHSB Living Lab will be the home of students at Chalmers in Gothenburg and is nowunder construction. It will be finished by June of 2016 and will also be a place whereresearch is taking place during a period of ten years to investigate what our futurehomes will look like, a living laboratory. The house will be movable and consists ofmodules that can be assembled in a short amount of time. There is one part of the
19

house that consists of 29 apartments where people can live and one part where therewill be office, show room and wash house. Their vision is to investigate what partsof a home that the residents can share, this is to decrease the consumption andmaterial flow. To do this they want to find out how people interact. This projectaims to find solutions of how to reduce the usage of energy and resources. Theyfocus on social, economical and ecological sustainability, and hope to find new smarttechnical solutions that can be used in future homes. Some examples of technicalsolutions that will be installed from the start is that the inhabitants will be able toget a message if a window is left open, turn some receptacle off with their phones,see how much electricity they use compared to their neighbours and see how muchgarbage that leaves the house. [HSB Living Lab, 2016]
2.6.2 PlaceLab
A study called PlaceLab [Beth Logan, et.al., 2007] was carried out at MIT where900 low cost sensor inputs were placed in a apartment to be able to compare theresults from different kinds of sensors. Installed sensors were wired reed switches,current and water flow inputs, object and person motion detectors and RFID tags.At the same time everything was filmed to get the absolute truth. The purpose wasto evaluate methods of activity recognition.
The study was carried out during ten weeks when a couple was living in theapartment, and during these weeks the residents had no contact with the researchers.Once a week the researchers entered the apartment and placed sensors on new thingssuch as magazines and food. From this, analysis were made and resulted in a listwith all activities taking place during these weeks, how often the activities wereperformed and for how long. They found that 10 infra-red motion detectors outper-formed the other sensors. Especially for the activities that were typically carriedout at the same location in the apartment. Since they had it all on video they couldfind the reasons for why the tags were less useful:- All activities do not involve interactions with objects, e.g. sleeping.- Some activities (e.g., dish washing) involve objects that could not be tagged sinceit is metallic.- Some activities involve objects that were too small to tag.
From this evaluation you can tell that it might would have helped to videotape activities for some time before placing the sensors. To get as realistic dataas possible, consider privacy and to make sure that the residents were living asnormal as possible the data were never observed in real time, the sensors were alsodisconnected from the Internet. A computer was sending a signal once every hourto the researchers to make sure the system was working. The participants also hadthe opportunity to look at the videos and data and delete sensitive parts, beforeletting the researchers use it.
20

2.6.3 The active house in the sustainable city
This project [Carin Torstensson, et.al. , 2014] was a living lab where a family livedduring a period of time. The aim of the project was to examine solutions that latercould be developed and integrated in 170 apartments in Stockholm Royal Seaport.The project included small and big companies as well as research organisations,from different industries. Visualisation tools were installed in the apartment, withthese the family was able to see their electricity usage, price and CO2 footprint. Inthe apartment it was possible to control and make devices interact with each other.A button was installed that could be set as home, away or asleep. When set at homeeverything was ready to be used. When set at away everything except the freezerand refrigerator was switched of. Sensors were installed that could sense if anyonewas in the room. The purpose was to save energy by switching off applicants whenno one is present. White goods often use the most electricity in a home and thereforethe goal was to make them run at times when the price was low or during times oflow CO2e-emission, or both if possible. These were not installed in the living labapartment but run in the Electrolux lab in Porcia, Italy. A schedule algorithm wasused to schedule the smart home applicants to run when the electricity is cheap andthe CO2 emission as low as possible, or it found some optimal mix of both priceand CO2 emission.
2.6.4 Smart cities
To get a bigger picture of the word smart in this context and why research andimplementations of big data is integrated in the Live-in Lab project this part of thetext focus on smart cities and an user-led approach. A study visit to Ericsson Studioat Ericsson’s Headquarter was done to get a greater perspective of IoT, Smart citiesand ICT.
A smart city is about integrating ICT, in the city and using data to optimize thecity. Some examples of things that can be improved: optimize traffic flow, improvehealth care and minimize energy usage. According to Microsoft’s project Sway, fiveaspects need to be considered when building a smart city: digitization, IoT, citizen’sexperience, a data-led approach to safer cities and digital equality.[Microsoft, 2016].
Digitization is obvious the core of building a smart city and by transforminginformation to a digital structure.
IoT is one of the keys to a smart city and is a part of many future solutions,for example by implementing IoT in cars, traffic management can be optimized.Time and fuel can be saved by using IoT as well as accidents can decrease and thecomfort for the inhabitants increase.
Citizens and visitors experience is another improvement that should be imple-mented, the well-being is crucial in a smart city. A society lives on its inhabitantsand visitors, therefore it is important to meet the people’s needs. To attract peoplethe city has to be safe, clean and easy to get around in.
Safer cities by prevent, detect, and minimize criminal and terrorist activity by
21

using ICT is another important aspect of a smart a city. Even emergency servicescould be improved this way. By analyzing digital information from sensors, videosand mobile technology this can be accomplished.
Additionally digital equality is important. It is crucial for a city to adjust to itscitizens and be aware of individual variation and work for combining social harmonyand urban development to ensure cultural and environmental sustainability.
2.6.5 Stockholm Royal SeaportAn example of a smart city is Stockholm Royal Seaport. Stockholm Royal Seaport isa urban development project located in Stockholm and it is a part of the city’s visionof a world-class Stockholm by 2030 and the plan is to build 10 000 new homes andmake 30 000 new jobs. The objectives for the project are environmental, physicalspace, economic and social [Stockholms stad, 2012]. Below are some examples ofhow Stockholm Royal Seaport work with smart technology to minimise energy andresource use.
Smart electricity grid
An intelligent electricity grid, automated heating and ventilation systems that willrun when electricity and energy usage are low will be used [Stockholms stad, 2016b].By visualizing and making the users aware of their energy usage it is estimated thata family can theoretically save up to 30% [Interactive Institute Eskilstuna, 2016].
Smart waste management
Stockholm Royal seaport is planning a well developed strategy for handling waste. Avacuum waste collecting system reduces the amount of transportation when sortingand managing the waste. Along with personnel access connected to Internet tokeep track of each apartment’s usage, by using an electronic key with RFID. Theinformation is analyzed and feedback is given back to encourage people to sortthe waste more. Furthermore food waste contributes to the production of biogas[Stockholms stad, 2015].
Smart City SRS
Smart City SRS is a part of the project Stockholm Royal Seaport and the core ofthe project is a common and shared ICT infrastructure. A shared ICT structureenables the full potential of IoT, and there is a need for a common structure. Ashared ICT structure also enable cost savings and encourage innovation growth[Stockholms stad, 2014]. An other important part of a well functioning ICT systemis information to the user. Communication and feedback to the end user to enablea understanding for the system consequences of decisions and providing greaterinsight to the impact of every day habits and actions. The aim for Smart City SRSis to enable smart decisions by using real time data [Stockholms stad, 2016a].
22

Chapter 3
Development of concepts
This chapter presents the development of concepts and solutions.
3.1 Methodology
The development of concepts was a partly iterative process where solutions werefound during a divergent session of brainstorming. This was followed by a convergentprocess where the purposed solutions were evaluated to eliminate solutions thatwere not technologically possible or did not contribute to energy related insightsinto the Live-in Lab. This was followed by a divergent process where the remainingsolutions were developed and refined to maximise their contribution to the Live-inLab. Documentation was made by making a table, Appendix A, to make sure thatall parts of all solutions were developed. The solutions that were about the samedevice or system in the home were put together. This is demonstrated by givingthem the same colour in Appendix A. The method, Figure 3.1, is common whendeveloping concepts and is described in The Mechanical Design Process [David. GUllman, 2009].
Figure 3.1. The process of developing concepts.
23

3.2 Brainstorming
During the brainstorming all ideas were welcomed and there were no limitations.The brainstorming began with a mind-map where different areas were defined andevaluated to find where big data could be implemented, Figure 3.2. This resultedin about 50 solutions or attempt to solutions which can be seen in Appendix A.
Figure 3.2. A mind map was made to distinguish areas where big data could beimplemented.
These solutions were evaluated based on the limitations and the objects of theproject and compared to the existing products on the market to be able to pickout the solutions that were most unique or useful for this report. The purposedsolutions were ranked according to the criteria below and the ranking can be seenin Appendix B and the total score is presented in Figure 3.3. The solutions arelisted below and in the next chapter the highest ranked solutions are described indetail, the rest can be found in Appendix C. It is described what is measured andhow often. The background of the solution is described, the technology used tocollect the data, some possible analysis and some thoughts regarding security andprivacy. At the end each solution is evaluated with a SWOT analysis, discussed andthe ranking is motivated.
24

3.3 Solutions1. Water consumption: Patterns of water consumption are studied.2. Ventilation: The quality of the air indoors is measured, to be able to adjustthe ventilation and to find correlations between the air quality and for examplearchitecture.3. Ventilation through windows: The aim is to track the energy loss whenwindows are opened and find patterns of how windows are used.4. Light: Lux is measured to be able to adjust architecture and lamps to thenatural light.5. Flushing the toilet: The aim is to investigate how much water that is wastedwhen flushing the toilet.6. Fridge and freezer: Patterns of electricity consumption and usage of the fridgeand freezer is studied.7. Unnecessary usage of electricity: The aim with this solution is to decreasethe electricity consumption from standby products.8. Movement inside the apartment: By collecting information about howpeople move in the apartment infrastructure systems and the architecture can beadjusted.9. Movement outside the apartment: By collecting data about how peoplemove in the common areas infrastructure systems, the architecture, recycling sta-tions among others can be adjusted. Furthermore data from movements outside theresidence can also be collected to find the transportation habits to draw conclusionsregarding the energy usage outside the home.10. Consumption: By gathering data from the credit card and chart the consump-tion, divide the information into categories and present the consumption patternsfor the user, the user could become aware of unnecessary consumption.11. Social data: With social data health, moods and interests could be charted.With this data for example social communities in a building or block could be de-veloped.
25

Figure 3.3. Diagram that shows the ranking of the solutions
3.4 Evaluation and aspects of security and privacy
Criteria
Criteria were developed to be able to see the strengths and weaknesses of the so-lutions, and also to be able to screen them. The criteria were chosen according towhat have been the focus during the development of the solutions. The ranking ismotivated in the Criteria part of each solution.Reliability Will this data collect what is needed, or will it be affected by sourcesof error? Ranking: 2Flexibility Can this data possible give insights in different areas or is it limited tojust one? Ranking: 1Independency Can this data give insights independently or does it depend onsome other source of data? Ranking: 1Energy savings potential How much energy does this solution save in relationto the amount of energy used in a home? Ranking: 3Innovative Are there any similar products on the market? Ranking: 3Technological potential Is this solution possible to carry through. Are theretechnologies available? Is it easy to implement in the existing applicants? Ranking:3
26

Ranking of the criteriaThe different criteria were ranked from 1 to 3 according to how important they areto this report. This report focuses of finding new ways of getting insights into energyusage in a home with big data. Therefore it is of high importance that the solutionsgives possibilities of saving energy, are innovative and have technological potential.The technological potential is related to the reliability of the data which because ofthat also becomes important. Least important is the flexibility and independencywhich are criteria that are not that important for the solution itself, but are criteriathat can separate the better solutions from the ones that are less useful.
SWOT analysisAll solutions were evaluated with a SWOT analysis where four aspects of eachsolution were studied. Strengths, Weaknesses, Opportunities and Threats. Thismethod of evaluating the solutions is useful to be able to compare the differentsolutions with each other. It also puts the purposed solutions in several perspectivesby asking these questions about strengths, weaknesses, opportunities and threats,the answers can be used for further discussions and identifies requirements of futurework.
Security and privacyThe security and privacy aspects of each purposed solution is discussed. What isimportant to take in account regarding the security aspect when collecting thesedata? Can the collected data somehow invade the integrity of the resident? Isit possible that the data can be used and analyzed in away that will invade theintegrity? The residents are well aware of that they are contributing to research byjust living their ordinary life. It is important though that the information is usedcarefully with respect to the resident, so that they do not feel supervised.
27


Chapter 4
Concepts for analyzing energy andresource usage with big data in Live-inLab
Purposed solutions for the Live-in Lab are listed in this section, followed by somediscussions and evaluation of each solution.
4.1 Water consumptionWhat is measured?The temperature and volume of water consumption, and the temperature and vol-ume of the unused, wasted, water. As well as when it is used. The time for thewater to adjust to the desired temperature is also measured.BackgroundWater consumption is one of the big consumers of energy in a residence, especiallyhot water. Therefore, it is interesting to investigate how the water is used, how muchis wasted and to find correlations between water consumption and other types ofenergy usage and behaviour in a home. When using hot water there is energy lostin form of heat in the water that is unused and goes back to the drain. There is alsoa lot of water wasted when opening the tap and waiting for the water to adjust tothe desired temperature, this is clean water that goes directly from the tap to thedrain.TechnologyThe total water consumption can be measured with a water flow meter where datais gathered every second. For this application, it is necessary to gather data as oftenas possible to be able to find patterns of how people use water. If they turn thewater on and off during a short period of time, or if it is left on for a longer periodof time. With thermometers and algorithms the time for the water to adjust to thedesired temperature can be found. One idea of how to measure the unused waterthat goes directly from the tap to the drain is to install a motion detector in the
29

tap.AnalysisFrom the patterns of water consumption there is a possibility of identifying theactivities that uses and wastes water. Total water usage can be compared to thevolume of unused water. The water that goes directly from the tap to the drain canbe taken care of in some way, it can be sent to for example the toilet to flush with.The infrastructure could be complemented with a second pipe for this unused andclean water. The tap could close if it has been opened for a longer period of timewith water of a constant temperature and with no motion, which indicates thatthe water is wasted. The temperature and volume of wasted water is interesting toknow to be able to decide if it is profitable to take advantage of this, now wasted,energy stored in the water. It can be used to heat up the apartments or the tankswith hot water.
The time for the water to adjust to the desired temperature is interesting to beable to examine if it is desirably to find ways of developing the technologies of thewater infrastructure in apartment buildings. If the patterns of water usage werestudied the infrastructure could also be designed to have hot water ready when it isneeded. The data can for example give insights in if the circulation of the water inthe water infrastructure is sufficient. When comparing these data between apart-ments with different placement in relation to the water tanks the data can be usedto get insights in how many and where the hot water tanks should be placed.Security and privacyThis data will not give any sensitive information regarding security directly, but itcan for example reveal when the residents usually are away from home. It will alsoreveal personal information about other habits and patterns regarding the everydaylife of the residents.Discussion and motivations of the ranking of the criteriaAccording to the evaluation table in Appendix B these suggested solutions are goodways of getting insights into energy usage with reliable data since the water systemis delimited. The water comes in a tap and goes away into the drain which makesit easy to measure. There is potential of saving energy in several ways since wateris a resource that is used often and during many of the daily activities in a home,both volume and energy can be taken care of, and systems can be developed thatoptimize the energy usage. The data is therefore also flexible and can be used tofind several correlations. The technologies used are simple sensors and conventionalwater meters, which are well developed. A SWOT analysis of the solutions is shownin Figure 4.1.
30

Figure 4.1. SWOT-analysis for Water consumption
4.2 Ventilation
What is measured?The air quality, humidity, condensation, CO2 emission, mold, temperature amongothers.BackgroundMany of today’s ventilation systems are not adjusted to people’s presence or thequality of the air. By measuring the air quality in instead of area of the apartment,the ventilation system could be adjusted and be more energy efficient. Furthermoreby collecting data correlations can be found between air quality, temperature andarchitecture or placement of electronics.TechnologyThe technology to be used is sensors that measure the air quality. WSN placedin the apartment to chart for example the CO2 emission and temperature. Themeasurements can be collected about every ten minutes.AnalysisBy analyzing the air quality, ventilation systems could be adjusted as well as warn-ings could be given from real time data if something is out of the ordinary, if itis too much CO2 or mold or something else out of ordinary. By logging data andfind information about patterns, comparisons could be made with information fromother sources such as architecture or placement of electronics and future homes canbe designed and constructed differently if needed. Together with the data from theopened windows systems can be developed to adjust the ventilation when windowsare opened. Moreover alarms can be given if something out of the ordinary happens.Security and privacyThe information about air quality would not give any sensitive information aboutthe people living in the apartments. No security aspects need to be considered re-garding the stored data.
31

Discussion and motivations of the ranking of the criteriaThe independency is high because the information alone could give great insights.The possibility to measure different aspects of air quality open up to a high gradingin flexibility, as well as the possibilities of developing both the architecture andventilation system. Since the ventilation is used everyday in every apartment thepossibilities of saving energy when optimizing this system is good. There are tech-nologies available to do these measurements. A SWOT analysis of the solutions isshown in Figure 4.2.
Figure 4.2. SWOT-analysis for Ventilation
4.3 Ventilation through windowsWhat is measured?Temperature difference between indoor and outdoor air, the time windows areopened, the size of the window and how much they are opened. Humidity andair quality is measured indoors and outdoors.BackgroundToday energy is lost due to opened windows and they are often opened more thannecessary. Heat is lost and the heaters operates unnecessarily and energy and moneyis lost. Furthermore the ventilation and heating system is not working correctly if itis disturbed by opened windows. The aim is to track the energy loss when windowsare opened and investigate how windows are used.TechnologyOn/off switches to measure the time between a window is opened and closed. Ther-mometer to measure the temperature outside and inside as well as sensor measuringthe humidity and air quality.Analysis
32
By measuring the difference between the outdoor and the indoor temperature to-gether with the time the window is opened, the total amount of lost energy can becalculated. This information compared with information about how often the win-dows are opened as well as information about the air quality, how the windows areopened during the year can be compared with how much the ventilation is workingand how much energy is lost due to this unnecessary behavior. Algorithms can bemade so that the windows could close automatically. By measuring temperatureand air quality differences in the whole apartment it could be calculated how theopened windows affect the conditions, where the window should be placed and howbig they should be. By measuring other aspects of the air, as humidity or pollution,this solution could be combined with the ventilation system and the windows couldbe opened and closed according to other aspects than temperature. The real timeaspect could be used as well and the sensor could be connected to the heating sys-tem and ventilation system, which can be turned off when the windows are openedto save energy. This technology could be placed between rooms and register dif-ferences between the rooms as well as how often the doors are opened and for howlong. This information can be used to evaluate the architecture and give insights inhow the heat and ventilation system works.Security and privacyThis data could not alone reveal any sensitive information. Information about resi-dents habits of opened window together with real time information about movementinside or outside the apartment could reveal when no one is at home.Discussion and motivations of the ranking of the criteriaThe independency is high because the information alone can give great insights inhow much energy is lost. The flexibility is high due to together with other typesof collected data even more conclusions can be made. The energy savings potentialdiffer during the year. If you open a window during the winter more heat is lost.Similar products could be obtained that connect window sensors to the heatingsystem but is not used in large scale. Furthermore this data can be analyzed whichhave not have been made. The technology exist so it is easy to install in Live-inlab. A SWOT analysis of the solutions is shown in Figure 4.3.
33

Figure 4.3. SWOT-analysis for Ventilation through windows
4.4 LightWhat is measured?Lux is measured where a lamp is placed. It is registered when the lamps are turnedon by movement or when they are on in general. Lux is also measured all aroundthe apartment.BackgroundLamps consumes 26% [Energirådgivningen, 2015] of the electricity used in a home.Therefore it is desirable to reduce the usage of lamps. It is a common way to man-age lamps by movement sensors in smart homes but this does not take in mind ifthe lamp is needed regarding the natural light. If the solution also sensed the luxthe lamps would only be turned on when someone is in the room and the light isneeded.TechnologyA sensor that detects the surrounding light is needed, which can activate the lampwhen it is to dark and someone is in the room. This data should make the lampreact in realtime. The data of how the light is in different places of the apartmentis interesting to store less often, about every 10 minutes, since it refers to measurethe natural light which do not change fast.AnalysisIf the lux is measured where the lamp is placed this can be compared to when thelamp is turned on by movement. This can be used to analyse how often lamps areused when they are not needed, how lamps should be placed in a home. The datacan also give insights into how the architecture can be developed to make use ofthe natural light and design the home so that the natural light is present where itis most needed, as for example by the desk.Security and privacyThis data will not give any sensitive information regarding security or privacy.
34

Discussion and motivations of the ranking of the criteriaThe used technology is just a simple light sensor which makes this data quite re-liable and independent. It is a quite flexible solution since it can contribute todevelopment of lamps as well as the architecture. Since lamps consumes 26% of theelectricity a decrease of this electricity usage would have a meaningful impact onthe total usage. This solution contributes to the development of lamps with a newpoint of view. A SWOT analysis of the solutions is shown in Figure 4.4.
Figure 4.4. SWOT-analysis for Light
4.5 Movement inside the apartmentWhat is measured?The inhabitants’ movements in the apartment. The movement detectors will de-tect whenever people is moving and evaluate how often and for how long there arepeople in the supervised area. Another way of collecting this information is to usewristbands or face recognition to track how people move as well as who is moving.BackgroundEnergy related measurements are not the only way of detecting patterns of energyand resource usage. By collecting information about how people move in the apart-ment infrastructure systems and the architecture can be adjusted.TechnologyTo record each person’s movement technologies it is important to separate each in-habitants patterns. Therefore technologies that can handle this must be used suchas movement sensors with algorithms that can separate people, wristbands, facerecognition, or other family database technology.AnalysisBy using sensors to detect how people move in the apartment and what they do,
35
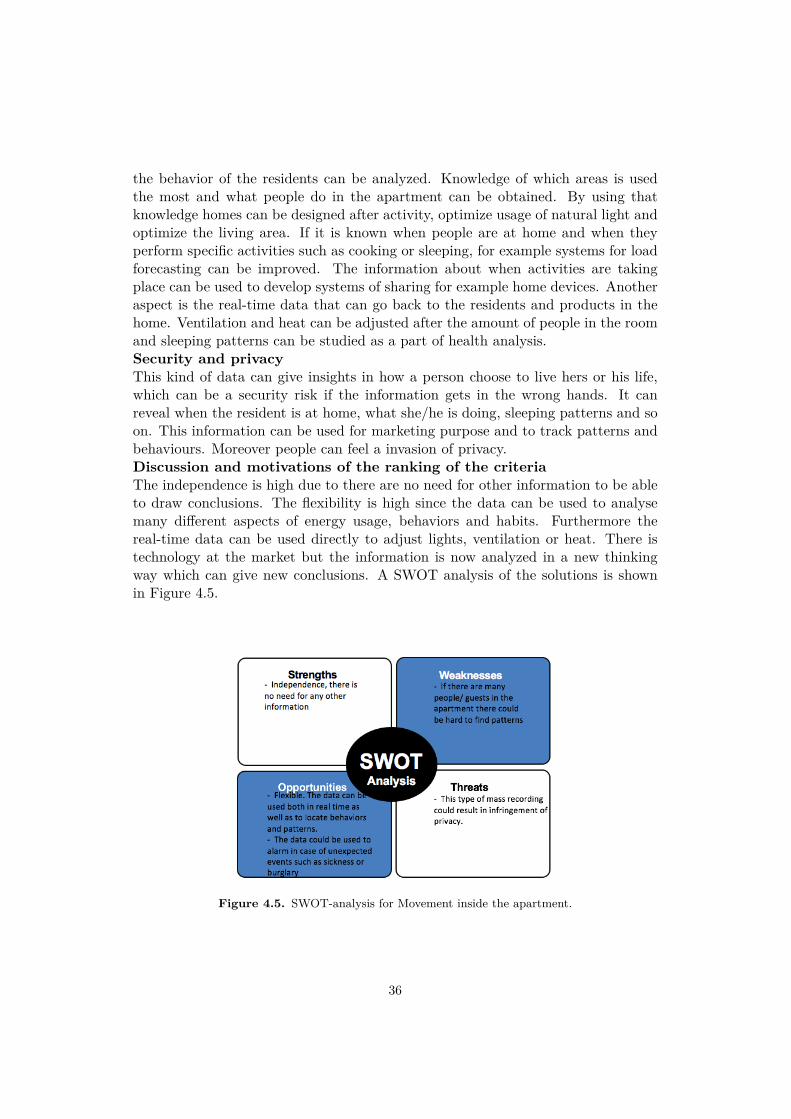
the behavior of the residents can be analyzed. Knowledge of which areas is usedthe most and what people do in the apartment can be obtained. By using thatknowledge homes can be designed after activity, optimize usage of natural light andoptimize the living area. If it is known when people are at home and when theyperform specific activities such as cooking or sleeping, for example systems for loadforecasting can be improved. The information about when activities are takingplace can be used to develop systems of sharing for example home devices. Anotheraspect is the real-time data that can go back to the residents and products in thehome. Ventilation and heat can be adjusted after the amount of people in the roomand sleeping patterns can be studied as a part of health analysis.Security and privacyThis kind of data can give insights in how a person choose to live hers or his life,which can be a security risk if the information gets in the wrong hands. It canreveal when the resident is at home, what she/he is doing, sleeping patterns and soon. This information can be used for marketing purpose and to track patterns andbehaviours. Moreover people can feel a invasion of privacy.Discussion and motivations of the ranking of the criteriaThe independence is high due to there are no need for other information to be ableto draw conclusions. The flexibility is high since the data can be used to analysemany different aspects of energy usage, behaviors and habits. Furthermore thereal-time data can be used directly to adjust lights, ventilation or heat. There istechnology at the market but the information is now analyzed in a new thinkingway which can give new conclusions. A SWOT analysis of the solutions is shownin Figure 4.5.
Figure 4.5. SWOT-analysis for Movement inside the apartment.
36

4.6 Movements outside the apartment
What is measured?The movements and habits outside the apartment, both in the common areas ofthe building and outside the building. Who is using the common areas? When arethey used and what activities are taking place? How and when does the residentstravel to and from work?BackgroundEnergy related measurements are not the only way of detecting patterns of energyand resource usage. By collecting information about how people move in the com-mon areas infrastructure systems, the architecture, recycling stations among otherscan be adjusted. Systems for sharing cars and other equipment can be developedby analyzing how people move outside the building, for example to school, work orpeople go for grocery shopping.TechnologyMovement sensors together with data from booking systems (laundry room). RFIDkeys or face recognition. GPS data from the residents’ smartphones.AnalysisBy collecting data about how people move in the common areas insights can begiven in habits, how people use the laundry room, bicycle rooms, recycle or othercommon areas as well as who is using it. By collecting data from the recycle roominsights can be given in people’s habits regarding waste. RFID keys and weightsystem can give information about recycling habits. By collecting this informationpatterns can be found and ways to avoid wastefulness can be developed. The in-formation about how much and when the residents do their laundry can be used todevelop systems that manage this usage to make the electricity usage more even, orpeople could be encourage to use the laundry room during hours when the electric-ity demand is lower. The GPS function in the smartphone can collect informationabout the residents traveling patterns. With the data from the residents GPS simi-lar patterns from the residents could be found. If people for example work or studyin the same area or go for shopping at different times common cars, carpooling,could be used. Furthermore movements outside the residence can also be collectedto find the transportation habits to draw conclusions regarding the energy usageoutside the home.Security and privacyThis information can be use for targeted marketing or other services that requiresyour location. The data can also be saved and reveal information about habits ithe everyday life. What stores you usually go to, when you are away from home,who you visit and so on. This can lead to serious consequences if the data gets inthe wrong hands. This information could be categorised as an invasion of privacy.Discussion and motivations of the ranking of the criteriaThe independency from this data depends on the technology, but in whole the in-formation alone could give great insight in behaviors in many different areas. Theinformation alone do not generates a decrease in energy usage but this source of
37

information could encourage people to save more energy unknowingly. A SWOTanalysis of the solutions is shown in Figure 4.6
Figure 4.6. SWOT-analysis for Movement outside the apartment.
4.7 ConsumptionWhat is measured?Information from credit card swipes is stored every time you swipe your card whenbuying something. Not exactly what you buy, but how often you use the card andwhere you use it.BackgroundBy collecting data of what your consumption behaviors look like, unnecessary con-sumption could be found. Excessive consumption of food, cloths and products overall leads to unnecessary use of resources and CO2 emission. Overconsumption mustdecrease to meet the future challenges of a sustainable society and one way of doingthis is to make the users aware of their behavior.TechnologyAlgorithms that categorize purchases, stories among others.AnalysisBy gathering this data and chart the consumption, divide the information into cat-egories and present the consumption patterns for the user, the user could becomeaware of unnecessary consumption. The data could be compared with waste datato compare patterns over a longer period of time. As well as compare the consump-tion patterns between different households to meet set consumption goals. Thesedata could be used together with standardized grocery shopping lists to minimizeunnecessary consumption and expenses.Security and privacy
38

This data could give great insights in people’s habits and consumption habits andbe used for target marketing and other services.Discussion and motivations of the ranking of the criteriaThe data alone could be used to track consumption behaviors which leads to a highindependency but other data sources could be used to get the bigger picture. Theflexibility of this data is low because the information could only be used to trackbehaviors linked to consumption. The energy savings potential is rather high butmostly in a long term context, since it requires behaviours to change. There aresimilar applications and banking services on the market that categorize purchasesbut from a household economy perspective. A SWOT analysis of the solutions isshown in Figure 4.7
Figure 4.7. SWOT-analysis for Consumption.
4.8 Social dataWhat is measured?Social big data is gathered from Google searches, Facebook and instagram likes andupdates, Tweets, Spotify usage, YouTube et cetera. Codewords are found that theuser use that are connected to behaviors.BackgroundAs mentioned earlier in the report Facebook knows you better than your friendsand family. By collecting and analyzing social data health, moods and interestscould be charted.TechnologyThere are several tools for analysing social data.AnalysisBy collecting social big data the behavior and habits of the residents could be ana-
39

lyzed and conclusions of what people like and like to do could be found. With thisdata social communities in a building or block could be developed. Social communi-ties and networks increase social health, collaboration which facilitates carpooling,shared tools and appliances. These applications could decrease unnecessary con-sumption and emissions of CO2. When people feel like they are a part of a biggercontext it might be easier to see that efforts of saving energy will have an effect.Analyzes of this data can be one part of health analysis and alarms could be givenif something seems to be wrong.Security and privacyBy tracking a persons social media habits great insights in people’s lives could begiven. Emotions, habits, relations, among others could be charted and which wouldinvade the integrity.Discussion and motivations of the ranking of the criteriaAnalysis from this data alone could give insights in social behavior which leads toa high ranking in independency. Furthermore the data could be compared togetherwith other information such as consumption patterns to give an other picture. Theinformation could only be used to track behaviors and indirectly decrease unnec-essary consumption or emissions. A SWOT analysis of the solutions is shown inFigure 4.8
Figure 4.8. SWOT-analysis for Social data.
4.9 Summary and further analysis
The purposed solutions for getting insights into energy and resource usage in theLive-in Lab include big data from single applicants, the infrastructure in a apart-ment and from the everyday life of the residents. Some of these solutions can be
40

combined, as seen in Figure 4.9, to generate even more insight. Examples of insightsthat can be found are listed below.
Figure 4.9. Relations between different solutions which can lead to further insights.
Patterns between electricity consumption and ventilation usage can be used tofind relations between how for example the heat generated by electronic devicesmakes the ventilation system work harder to get rid of the heat.
Patterns between the total water consumption and consumption patterns relatedto for example restaurant visits et cetera can be used to inform the resident abouttheir total water consumption. Just because the the total water consumption hasdecreased in the home does not indicate that the resident has decreased its totalwater consumption in life. To make the residents aware of their behaviour in lifewill increase the awareness of their ecological footprint. The same relations can befound by studying the patterns between electricity consumption and consumption.This is interesting to investigate to find the total ecological footprint of the resident.
How will open windows affect the electricity consumption, ventilation and heatsystems. Compare the patterns. Open windows will make the ventilation and heatsystem work less effective. Open windows will affect the indoor temperature whichwill have an impact on the freezer and fridge, this might increase their electricityconsumption.
Movements outside the apartment can manage the ventilation and light. Ifthe GPS function in the resident’s smartphone is used, algorithms can make theventilation and light turn on when the resident is on her or his way home, and turnthem off when the resident is leaving home. This can also adjust the heating ofwater, it is unnecessary to have hot water ready in the tank if no one is at home
41
using it. The data that shows the patterns of the residents habits can be stored toset schedules.
Patterns of movements inside the apartment can be used to design future homesto where activities are taking place in the home and where we spend most of ourtime. The natural light can be used as much as possible by studying the patternsof when and where lamps are turned on and by placing the windows where peoplespend most of their time. It can also be used to study where the ventilation isneeded the most.
By analyzing the consumptions patterns and chart the purchases these can becombined with information of the status of the fridge and freezer. The data of thepurchases and data of the fridge and freezer can together be analyzed and you canbe alerted if you are out of daily groceries.
Patterns of movements outside the apartment together with data from socialdata and consumption can be used to locate where you do your grocery shopping,work, go to school and perform other activities. This information can be used toarrange shared transportation, as bikes and carpooling.
If the windows are smart there is important for the windows to communicatewith the heat system and the lamps to get a comfortable temperature and level oflight without using too much energy.
Real time data from movement sensors and movement patterns can be usedtogether with data from unused electricity to turn of appliances and stand-by tominimize electricity usage. For example the TV do not need to be on if no one iswatching or the stand by do not need to be on if no one is home.
42

Chapter 5
Discussion and Conclusions
This chapter discuss the solutions as well as some further subjects that is relatedto getting insights into energy and resource usage with big data. Furthermore theconclusions are presented.
5.1 Ethics
With technology constantly surrounding us people are used to live under surveil-lance with sensors and CCTV cameras in public areas to name a few, but to becontrolled at home is something else. With a world led by statistics and algorithmsthat now is moving into our private sphere questions about ethics arise. Whathappens if something goes wrong, who is the person in charge and what is thelimit of interference you can make with big data, is it OK to combine all kinds ofdata streams to find what you look for? With big data from several sources, andthe constant development of algorithms and technology, the limit of what informa-tion that is possible to find constantly stretches. It can for example be possible toidentify someone, find someones location and get insight in real time or near realtime. [Mandy Chessell, 2014]. When collecting big data there is a ethical awarenessframework that can be used which was developed by the UK and Ireland TechnicalConsultancy Group (TCG), some examples are mentioned below.
Context – What was the original object for collecting the data? Is it used forsome other purpose now?Consent & Choice – What choices are given to the residents? Are they aware ofthat they are making a choice?Reasonable – Are the found relationships between different kinds of data reason-able for the application it is used for?Owned – Who is the owner of the information that is the result of the collecteddata? What are the owners responsible for?Considered – What consequences comes with the collection of data and the anal-ysis?
43
Accountable – What happens in case of a mistake? How are the mistakes foundand repaired?[Mandy Chessell, 2014]
Laws and regulations guide and defines what data that is acceptable to collectand what is not. But with the constant developing technology the gap betweenwhat is possible to do and what is legally to do is constantly getting bigger. Infor-mation that are sensitive and personal must be handled carefully. When collectinginformation of great range an estimation is done and aspects as intention, context,the risk for the information to be spread to a third part as well as what the infor-mation is going to be used for should be considered [Datainspektionen, 2013]. Itis important to remember that there are humans that ask the questions, interpretthe answers and results can be found that meet what they are looking for and beadjusted to their criteria.
In Live-in Lab the context and the conditions are a bit different and some difficultquestions are already answered. The project is a research project and the collecteddata and information is owned by KTH but otherwise ownership of information isan important question. Is the information own by the resident, the property owneror the company collecting the data to name a few. Regardless of who is owning thedata it is always important to be reminded of what the residents in this case signedup for. Under what terms did they agree on sharing data from their life? Whatcould happen along the way that could violate these agreements?
5.2 Sharing data with a third party
With all the data collected great value can be made. By sharing this data researchcan be done and services and products can be developed. Utility companies mightbe interested in getting information about how people use the electricity to be ableto develop services that can for example make the energy demand more even duringthe day.
The data that comes from separate devices such as the toilet, fridge and freezercan be used to develop these. Data from the infrastructure can be used to developthe design of buildings and apartments, but it can also be used to develop specificproducts. Water consumption data can be used to get better insight in how ashower or tap is used. It can also be used to study how the plumbing system couldbe developed. With all the collected data an application can be developed thatinforms the user of the total ecological footprint, by summing up the resources andenergy used in the home, consumption and transportation. The data about howpeople travel in their everyday life can be turned into information about suitablecarpooling communities in a neighborhood. When deciding what data that shouldbe collected and shared there is an option to connect the collected data to personalinformation about the resident, e.g. gender, age, ethnicity et cetera. This makes thedata more sensitive. The other way of doing it is to just collect the data from theactivity without any personal information, or to anonymize the data before sharing
44

it.
5.3 Discussion of solutions
In this part of the report some general subjects are discussed and important aspectsare considered. How could this collected data contribute to a more efficient homeand which data is the most interesting to develop and integrate into future homes?Furthermore, which data could contribute to a more energy and resource efficientconstruction of buildings. Discussion of each solution can be found in chapter 4.
One of the set goals for this report was to discuss the work with one of thestakeholders of Live-in Lab. For this Schneider Electric was chosen to give a widerperspective of the research of big data in Live-in Lab. Three main aspects werediscussed during the meeting:- Stakeholders and possible third parties interested in Live-in Lab- What solutions that are possible to combine- Functioning systems
It is important to make sure that the system of technology is as uniform aspossible, as well as separate what is nice to have versus need to have. If the systemis optimized and the analysis of the collected data are made sure to give maximalinsight the system can contain less sensors and data streams, and therefor be easierto maintain, store, and so on. To have a simple system of technology will also facil-itate in case there is some problem or if something is broken. As the preconditionslook like today only the resident have access to the apartment. What happens ifsomething goes wrong? Should the operating manager or property owner have ac-cess to the apartments and the measurement tools? The costs of maintaining thesystem need to be considered since they are proportional to the size and number ofsubsystems.
One of the objectives of this report was to decide how often measurements aresupposed to be collected. For a researcher it is desired to collect as much dataas possible while the one responsible for the costs need to consider the costs ofstoring the data. If every apartment contains several subsystems of sensors thatwill collect the data every other second or minute the amounts of data will be huge.It would therefore be optimal to make the sensors make the measurements onlywhen something has changed, e.g the temperature of the water.
Before making decisions of what to measure it would be interesting to knowmore about what analysis that have potential of saving most energy, or what wouldmake the home run as automatically as possible. The future work should aim to findsolutions that make the behaviour of the resident be as unimportant as possible.Even if the resident waste energy it would be desired to make that not matter, byfor example re-using energy.
45

This report has resulted in eleven solutions of what could be measured in ahome. Already existing solutions have not been considered and the innovative as-pect has been prioritized. As discussed earlier the important thing to have in mindis how to combine a few solutions to obtain maximal insights. With that in mind agrading system was conducted and the solutions were weighted. The result can beseen in Figure 3.3. As this figure shows the best solutions to measure are;- Ventilation through windows- Water consumption- Light- Movements inside and outside the apartment
These solutions are according to the ranking the most useful data to collect in ahome, and as mentioned in section 2.2 it has been estimated that the energy usagein residences can be reduced by 20% by changing behaviours and habits. If thesefive solutions are combined the sensors and data streams could be minimized aswell as the efficiency could be maximized. Systems of products and services can bedeveloped that will make a great impact on the energy usage of the residents sincethese solutions cover such a big area. In Figure 4.9 ways of combining data can befound.
The radar chart seen in Figure 5.1 shows the four highest ranked solutionsnamed before and the other high ranked as well as the criteria for each solution. Itmakes it easier to compare the qualities of the highest ranked solutions and givesan overview. The different criteria are not weighted in this diagram. Movementsoutside the apartment is not visible since it has the same ranking as Movementsinside the apartment. The same regards Consumption and Social data.
46

Figure 5.1. Diagram of top rated solutions
The presented solutions are from different kind of levels, some are applicable toproducts and others to infrastructure. Whether the data should be given back tothe end user or not depend on the information. Water consumption, Ventilation,Ventilation through windows, and Flushing the toilet are solutions that are moreimportant to be efficient without any involvement of the resident. These functionsthat are measured should save energy and resources by them selves without changingthe residents behavior.
Information from Movement inside the apartment and Movements outside theapartment are not interesting without any other sources of data or without chart-ing long-term habits. Furthermore, this information is in general not interesting togiveback to the end user without any additional information from an energy per-spective. Additional information could be information from the ventilation systemor the level of light in the room.
Information from Consumption and Social data should be given back to theend user to change habits. This could be helped by facilitate change of habits butunlike most of the other solutions the responsibility lies with the residents and notthe construction of the infrastructure or building.
5.4 Conclusions
The different parts of big data and energy usage in the home have been investigated,such as IoT, social data, Smart cities, living labs and different technologies that can
47

be used to collect data with or that are now used in homes. The purposed solutionswill give insights in the energy and resource usage in a home at several levels, andthey use other types of data than "traditional enegry data" that will add value. Bigdata from Water consumption, Ventilation, Movements inside the apartment andLight can be analyzed and give insights in how the infrastructure and design of thehome can be developed. The data from Flushing the toilet, Ventilation throughwindows, Water consumption and Fridge and freezer can be used to develop thesespecific products. Movements outside the apartment, Consumption and Social datacan be used to analyse how the residents use energy and resources outside the homeand give valuable information about e.g how neighbors can share cars or make useof similar habits. When people feel like they are a part of a bigger context it mightbe easier to see that efforts of saving energy will have an effect. When analysingcombinations of solutions the utility and insight is maximized.
It would be desired to find a system of solutions that are easy to combineto get maximal insight, instead of having a lot of isolated solutions. This reportpresent eleven possible solution but highlight four solutions that would make homemore energy and resource efficient. By using and combining fewer solutions themaintaining costs will be kept low and the system would be optimized.
The data can be useful for several third parties. Utilities, product developers,architects, carpool-organisations and app developers. When sharing the data it isimportant to consider ethics and security. Some of the data might only be suitableto share if it is anonymized.
5.5 Future workThe SWOT-analysis of every solution can be used to find out what needs to bedeveloped. The strengths and opportunities need to be retained, while the threatsand weaknesses need to be analyzed to find possible solutions. All solutions havebeen ranked, the ones with the highest score are suitable to start developing, thesolutions with lower scores need more work or will not contribute enough to the Live-in Lab. Figure 5.1 can be used to compare the qualities of the different solutions, itcan be helpful to make sure that the purposed solutions have a variety of qualities.It would be interesting to know more about what analysis that will save the mostenergy. There are a lot of available living labs that can be investigated to be ableto learn from and to find inspiration.
48

Bibliography
[Aikaterini Mitrokotsa, Christos Douligeris, 2009] Aikaterini Mitrokotsa, ChristosDouligeris (2009). Integrated rfid and sensor networks: Architectures and appli-cations. Chalmers University of Technology.
[Bernard Marr, 2015] Bernard Marr (2015). Why only one of the 5 vs of big datareally matters. Available from: http://www.ibmbigdatahub.com [cited 2016-02-23].
[Beth Logan, et.al., 2007] Beth Logan, et.al. (2007). A Long-Term Evaluation ofSensing Modalities for Activity Recognition.
[Camacho, Bello-Orgaz and Jung, 2015] Camacho, Bello-Orgaz and Jung (2015).Social big data: Recent achievements and new challenges. Available from:http://news.stanford.edu [cited 2016-04-04].
[Carin Torstensson, et.al. , 2014] Carin Torstensson, et.al. (2014). Aktiva huset iden hållbara staden.
[Carlyn Aarish, Matei Perussi, Andrew Rietz, Dave Korn, 2015] Carlyn Aarish,Matei Perussi, Andrew Rietz, Dave Korn (2015). Evaluation of the 2013–2014programmable and smart thermostat program.
[Clifton B. Parker, 2015] Clifton B. Parker (2015). New stanford research findscomputers are better judges of personality than friends and family.
[Dan Ding, Rory A. Cooper, Paul F.Pasquina, Lavinia Fici-Pasquina, 2011] DanDing, Rory A. Cooper, Paul F.Pasquina, Lavinia Fici-Pasquina (2011). Sensortechnology for smart homes. Maturitas.
[Dario Bonino, Fulvio Corno, Luigi De Russis, 2011] Dario Bonino, Fulvio Corno,Luigi De Russis (2011). Home energy consumption feedback: A user survey.Energy and Buildings.
[Datainspektionen, 2013] Datainspektionen (2013). Ny kameraövervakningslag från1 jul. Available from: http://www.datainspektionen.se [cited 2013-01-07].
[Dave Evans, 2011] Dave Evans (2011). The Internet of Things How the Next Evo-lution of the Internet Is Changing Everything.
49

[David. G Ullman, 2009] David. G Ullman (2009). The Mechanical Design Process.McGraw Hill Higher Education.
[Deborah Gonzalez, 2014] Deborah Gonzalez (2014). Managing Online Risk: Apps,Mobile, and Social Media Security.
[ecobee, 2016] ecobee (2016). ecobee. Available from: http://www.ecobee.com[cited 2016-03-08].
[Efergy, 2016] Efergy (2016). Efergy. Available from: http://www.efergy.com[cited 2016-03-07].
[Energimyndigheten, 2016] Energimyndigheten (2016). Energiläget. Available from:http://www.energimyndigheten.se [cited 2016-02-25].
[Energirådgivningen, 2015] Energirådgivningen (2015). Hushållsel, faktablad.Available from: http://www.energiradgivningen.se/ [cited 2016-04-29].
[EU-upplysningen, 2016] EU-upplysningen (2016). Klimatmål. Available from:http://www.eu-upplysningen.se [cited 2016-02-25].
[Hai Liu, Miodrag Bolic, Amiya Nayak, Ivan Stojmenović, 2008] Hai Liu, MiodragBolic, Amiya Nayak, Ivan Stojmenović (2008). Integration of rfid and wirelesssensor networks. University of Ottawa, Ottawa, Canada.
[Healthsense, 2016] Healthsense (2016). Health monitoring. Available from: http://www.healthsense.com [cited 2016-03-08].
[Heiko Hahn, Silja Meyer-Nieberg, Stefan Pickl, 2009] Heiko Hahn, Silja Meyer-Nieberg, Stefan Pickl (2009). Electric load forecasting methods: Tools for decisionmaking. European Journal of Operational Research.
[Hossein Shahrokni, Fabian Levihn, Nils Brandt, 2014] Hossein Shahrokni, FabianLevihn, Nils Brandt (2014). Big meter data analysis of the energy efficiencypotential in Stockholm’s building stock.
[HSB Living Lab, 2016] HSB Living Lab (2016). Följ oss på resan mot framtidensboende. Available from: http://hsb.se [cited 2016-03-02].
[IBM, 2013] IBM (2013). Smart ehningen. Available from: http://www.ibm.com[cited 2016-03-03].
[Interactive Institute Eskilstuna, 2016] Interactive Institute Eskilstuna (2016). Ac-tive house in the sustainable city. Available from: https://www.tii.se [cited2016-04-04].
[Jonas Anund Vogel, Per Lundqvist, Jaime Arias, 2015] Jonas Anund Vogel, PerLundqvist, Jaime Arias (2015). Categorizing barriers to energy efficiency in build-ings. Energy Procedia 75.
50

[Kaile Zhoua, Chao Fua, Shanlin Yang, 2014] Kaile Zhoua, Chao Fua, ShanlinYang (2014). Big data driven smart energy management: From big data tobig insights. pages 215-225. Renewable and Sustainable Energy Reviews.
[Kungl. Ingenjörsvetenskapsakademien, 2008] Kungl. Ingenjörsvetenskap-sakademien (2008). De fem vägvalen. Vägval energi.
[Leviton, 2016] Leviton (2016). Leviton. Available from: http://www.leviton.com[cited 2016-03-04].
[Mandy Chessell, 2014] Mandy Chessell (2014). Ethics for big data and analytics.IBM.
[Michael Brown, 2016] Michael Brown (2016). The zuli smartplug shrinks geo-fencing to room-fencing, for precision control of your home lighting system. Avail-able from: http://www.techhive.com [cited 2016-03-08].
[Michael E. Porter and James E. Heppelmann, 2015] Michael E. Porter and JamesE. Heppelmann (2015). How smart, connected products are transforming com-panies. Available from: https://hbr.org [cited 2016-02-23].
[Microsoft, 2016] Microsoft (2016). Microsoft citynext. Available from: https://sway.com/ [cited 2016-04-04].
[Nest labs, 2015] Nest labs (2015). Energy savings from the nest learning thermo-stat: Energy bill analysis results.
[Regeringen, 2016] Regeringen (2016). Mål för energieffektivisering. Available from:http://www.energimyndigheten.se [cited 2016-02-28].
[Sajisd Hussain, Scott Schaffner, Dyllon Moseychuck, 2009] Sajisd Hussain, ScottSchaffner, Dyllon Moseychuck (2009). Applications of Wireless Sensor Networksand RFID in a Smart Home Environment.
[Sandra Backlund, et.al., 2012] Sandra Backlund, et.al. (2012). Extending the en-ergy efficiency gap. Energy Policy.
[Shafik Ahmad, 2011] Shafik Ahmad (2011). Smart metering and home automationsolutions for the next decade. Available from: http://ieeexplore.ieee.org[cited 2016-02-23].
[Shwetak N. Patel, Matthew S. Reynolds and Gregory D. Abowd, 2008] ShwetakN. Patel, Matthew S. Reynolds and Gregory D. Abowd (2008). Detecting HumanMovement by Differential Air Pressure Sensing in HVAC System Ductwork: AnExploration in Infrastructure Mediated Sensing.
[SP Sveriges Tekniska Forskningsinstitut, 2011] SP Sveriges Tekniska Forskn-ingsinstitut (2011). Energianvändning i hemmet. Available from: https://www.sp.se [cited 2016-02-23].
51

[Stockholms stad, 2012] Stockholms stad (2012). Norra Djurgårdsstaden StockholmRoyal Seaport Hjorthagen - towards a world-class Stockholm.
[Stockholms stad, 2014] Stockholms stad (2014). Smart and sustainable solutions instockholm royal seaport. Available from: http://stockholmroyalseaport.com[cited 2016-04-04].
[Stockholms stad, 2015] Stockholms stad (2015). Sopsugsterminal mednya funktioner för minskad miljöpåverkan. Available from: http://stockholmroyalseaport.com/ [cited 2016-04-04].
[Stockholms stad, 2016a] Stockholms stad (2016a). Smart city srs - hållbara beslutgenom realtidsfeedback. Available from: http://www.stockholmroyalseaport.com [cited 2016-04-04].
[Stockholms stad, 2016b] Stockholms stad (2016b). Smarta elnät. Available from:http://www.stockholmroyalseaport.com [cited 2016-04-04].
[Stockholms stad and Envac, 2016] Stockholms stad and Envac (2016). Smart av-fallshantering. Available from: http://bygg.stockholm.se/Innovativ-stad/Utbildning-och-forskning/Sopsug-i-bostadsomrade/ [cited 2016-03-02].
[The Foobot Team, 2016] The Foobot Team (2016). Foobot - former alima, indoorair quality monitor. Available from: http://www.indiegogo.com [cited 2016-03-08].
[thecoolist, 2016] thecoolist (2016). Why “geofencing” is the next buzz word insmart home technology. Available from: http://www.thecoolist.com [cited2016-03-08].
52

Appendix A
Solutions draft 1
53

54

55

56

Appendix B
Ranking
57

Solution: 1 2 3 4 5 6 7 8 9 10 11 Ideal:
Water consu Ventilation
Ventilationthroughwindows Light
Flushing thetoilet
Fridge andfreezer
Unnecessaryusage ofelectricity
Movementinside theapartment
Movementsoutside theapartment Consumptio Social data
Criteria RankReliability 2 4 3 4 5 2 4 4 4 4 2 2 5Flexibility 1 4 4 3 3 5 2 2 4 4 3 3 5Independency 1 5 5 5 4 5 4 5 4 4 5 5 5Energy savings potenti 3 4 3 4 3 2 2 2 4 4 2 2 5Innovative 3 4 4 5 4 5 3 3 3 3 3 3 5Technological potential 3 4 4 4 5 2 4 2 5 5 5 5 5
Tot: 53 48 55 53 41 41 36 52 52 42 42 652 1 2 3 3
Rank:1 = Not so important2 = Important3 = Very important
Grade:1 = Bad2 =3 = Good4 =5 = Excellent
The ranking is motivated in the Criteria part of every solution.
58

Appendix C
Solution 4-6
59

FlushingthetoiletWhat is measured? The volume changes of the water in the toilet when someone is using it and which button that is used, these data is then stored. Background This solution aims to find out if more water than needed is used when flushing the toilet. Maybe the big button is most often used to flush the toilet, even when it is not needed. Technology A water level logger can be used to measure the change of the water level and send the data to adjust the amount of water used to flush. For this it is necessary to store the data of the total volume change from every flush session. A switch is used to sense which button that is used every time. Analysis The aim is to investigate how much water that is wasted when flushing the toilet. This is made possible by comparing the volume change of the water to the amount of water that is used depending on which button that is used. If the toilet can know how much water that is needed to flush it can adjust the water consumption itself to minimize water consumption. If storing this data it can be used as one of several parts when analyzing the health of the residents, since the change of volume tells what the resident is doing in the toilet. Motivations of the ranking of the criterias This solution will not contribute to any dramatic savings of energy, partly because the water used is cold, but it is an innovative idea that will save some water in total since there is a toilet in every home. The data can be stored to develop toilets to be more smart, or it can be used to analyze the health. This gives the solution some flexibility aspects. The measuring is not technologically advanced but the unclear amount of paper can make it more difficult to estimate the amount of water needed to flush, since the paper does not sink into the water that quickly, this can make the data unreliable. Another barrier is that it is difficult to install technology in a toilet since it is such a standardized applicant. The technology used is simple. A SWOT-analysis of the solutions is shown in Figure a Security and privacy This data will not give any sensitive information regarding security. It will give personal information about habits and patterns regarding the everyday life of the residents. It might invade the integrity and should only be used for research.
60

Figure a. SWOT-analysis for Flushing the toilet. FridgeandfreezerWhat is measured? Electricity consumption of the freezer and fridge is measured. For how long the doors are open and how often, when picking out groceries. The temperature difference between inside and outside the device. How full the freezer and fridge is and patterns of where food is placed. Background Every time the door to the freezer or fridge opens warm air is let in making the device to work harder and therefore consume more electricity. In addition a full fridge and freezer keeps a more stable temperature since there are less air that can be let out when the door is open. Technology The electricity consumption can be measured with a smart plug, and be transmitted every 30 second, according to the available technology. The data can then be sent to a central, for example a smart phone, where the history of the usage is stored and patterns can be studied. The temperature can be measured and stored with a smart thermometer, the data can be saved in the same way as for the smart plug. The temperature is interesting to measure as often as possible when the door is opened and some time after closing the door. The temperature outside the device is interesting to measure less often, every 10 minutes, since it does not change fast. The patterns of how the door are opened can be charted by using switches on the doors. These recognize which state the door is in, closed or opened. To recognize patterns of where and how much food is placed in the fridge is a technological barrier. Analysis If the total amount of used electricity is stored it can be compared to the patterns of how full the device is and how the doors are opened. Samsung [Samsung] is doing their best to for example increase the times the doors are open by installing cameras inside which shows what groceries you have. The measurement of how the freezer or fridge is affected by where food is placed and how much, the architecture of the devices can be investigated. It might be possible to find ways of adapting the device to the amount of groceries stored in it, so that
61
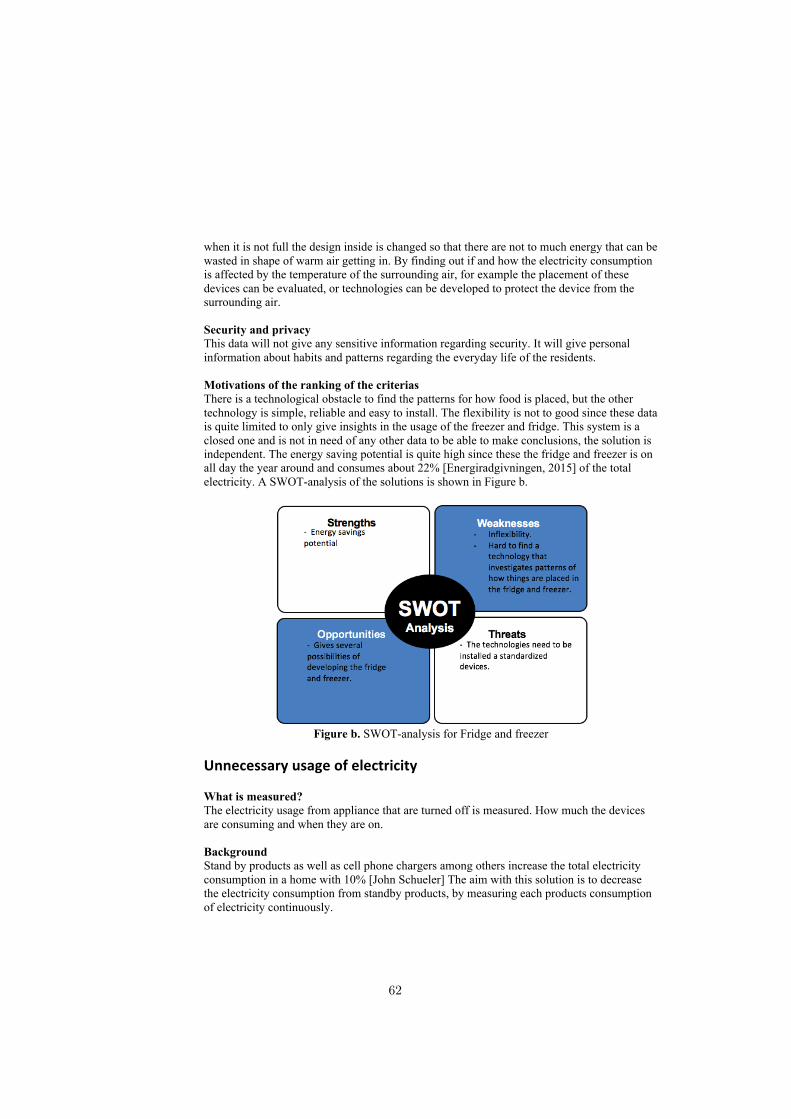
when it is not full the design inside is changed so that there are not to much energy that can be wasted in shape of warm air getting in. By finding out if and how the electricity consumption is affected by the temperature of the surrounding air, for example the placement of these devices can be evaluated, or technologies can be developed to protect the device from the surrounding air. Security and privacy This data will not give any sensitive information regarding security. It will give personal information about habits and patterns regarding the everyday life of the residents. Motivations of the ranking of the criterias There is a technological obstacle to find the patterns for how food is placed, but the other technology is simple, reliable and easy to install. The flexibility is not to good since these data is quite limited to only give insights in the usage of the freezer and fridge. This system is a closed one and is not in need of any other data to be able to make conclusions, the solution is independent. The energy saving potential is quite high since these the fridge and freezer is on all day the year around and consumes about 22% [Energiradgivningen, 2015] of the total electricity. A SWOT-analysis of the solutions is shown in Figure b.
Figure b. SWOT-analysis for Fridge and freezer
UnnecessaryusageofelectricityWhat is measured? The electricity usage from appliance that are turned off is measured. How much the devices are consuming and when they are on. Background Stand by products as well as cell phone chargers among others increase the total electricity consumption in a home with 10% [John Schueler] The aim with this solution is to decrease the electricity consumption from standby products, by measuring each products consumption of electricity continuously.
62

Technology By installing smart plugs where appliances are plugged in to the wall users can get information, through an app, on how much electric power a specific product consumes and for how long it has been on, data can be collected every 30 second. Analysis The data can be analyzed to track when appliance are on or on standby, as well as chargers, and ways can be find to decrease unnecessary usage of electricity. The solution can also be used to obtain information of the inhabitants habits linked to use of products as the TV, computers and other devices. Furthermore, the meter can predict if something is out of the ordinary by measure highs and lows and track the common behavior. Motivations of the ranking of the criterias The independency is high because it is no need for other information to draw conclusions The flexibility is medium. The solution can be used to turn off products on standby but also track the overall power consumption as well as find out if something is wrong. The savings potential is rather low but steady. There are similar technologies at the market but in this solution the technology is integrated in each outlet to track the total power intake of the apartments. A SWOT-analysis of the solutions is shown in Figure c. Security and privacy This data will not give any sensitive information of regarding security or privacy. The information that can be given is information about how much the inhabitants use different applicants in the home.
Figur c. SWOT-analysis for Unnecessary usage of electricity.
63

64