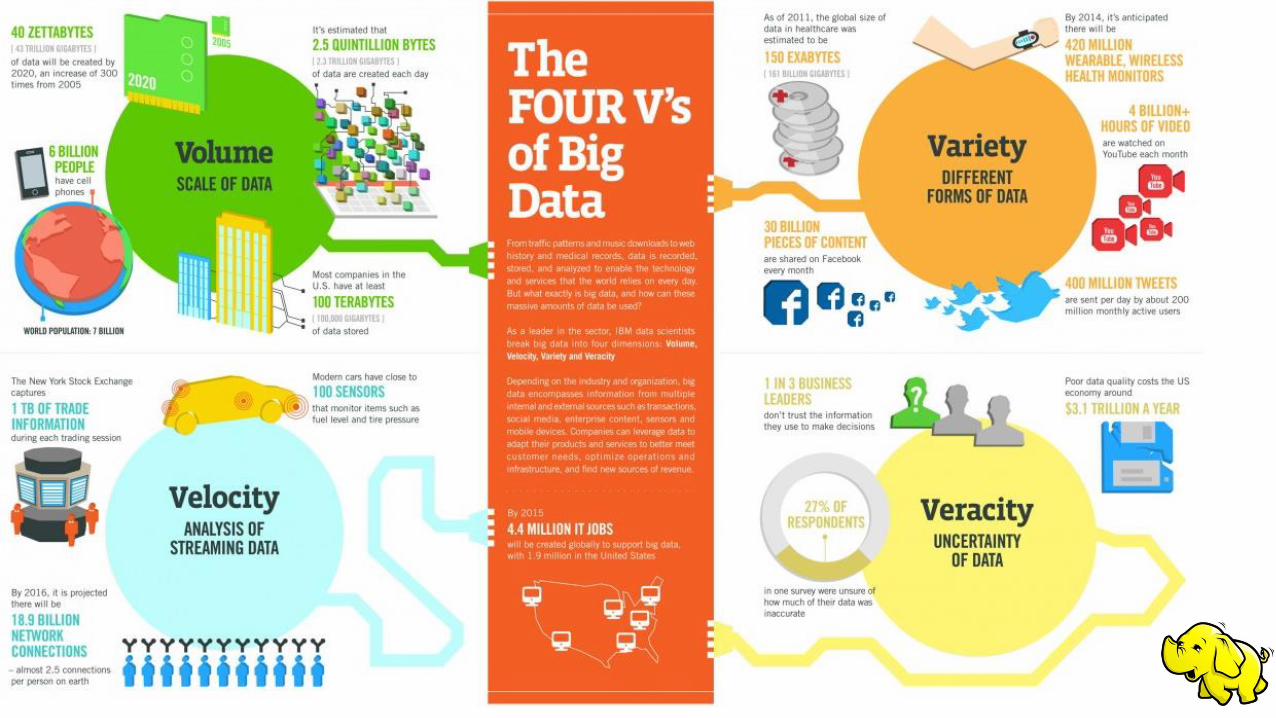
big data & hadoop
TRANSCRIPT

Big Data & HadoopGizem Akman | SoftwareInfraStructure
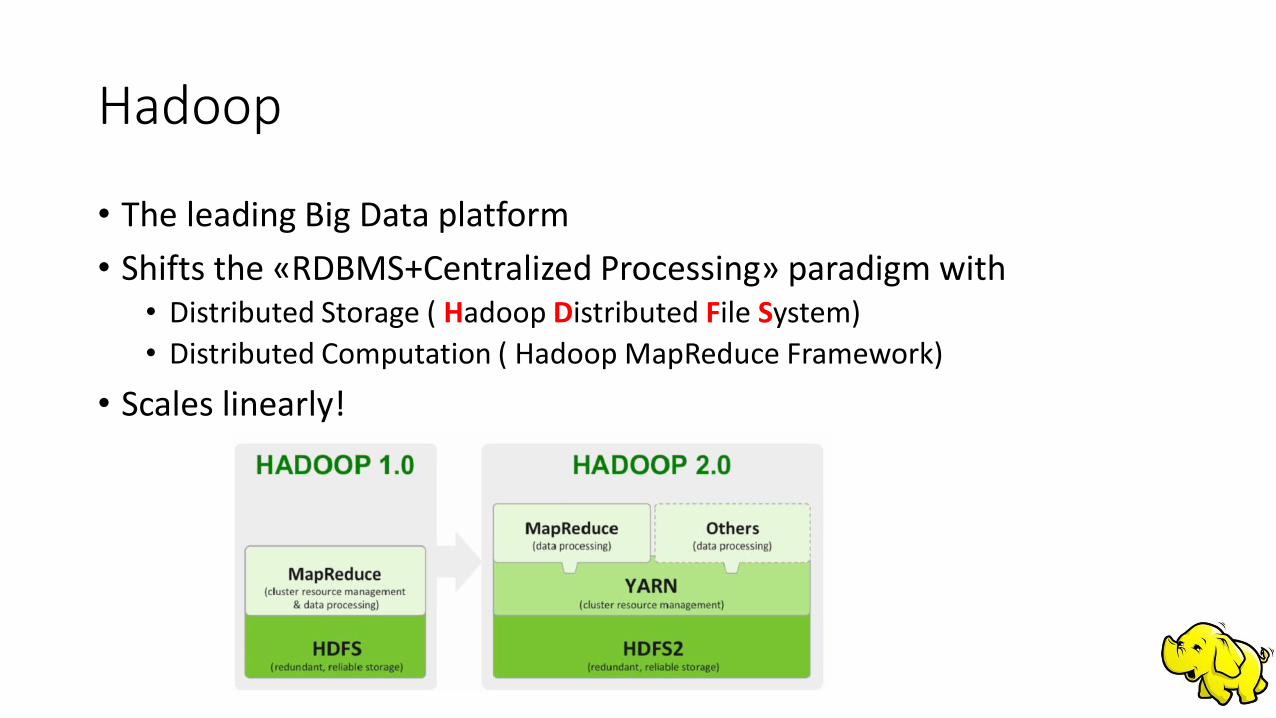
Hadoop
• The leading Big Data platform
• Shifts the «RDBMS+Centralized Processing» paradigm with• Distributed Storage ( Hadoop Distributed File System)
• Distributed Computation ( Hadoop MapReduce Framework)
• Scales linearly!
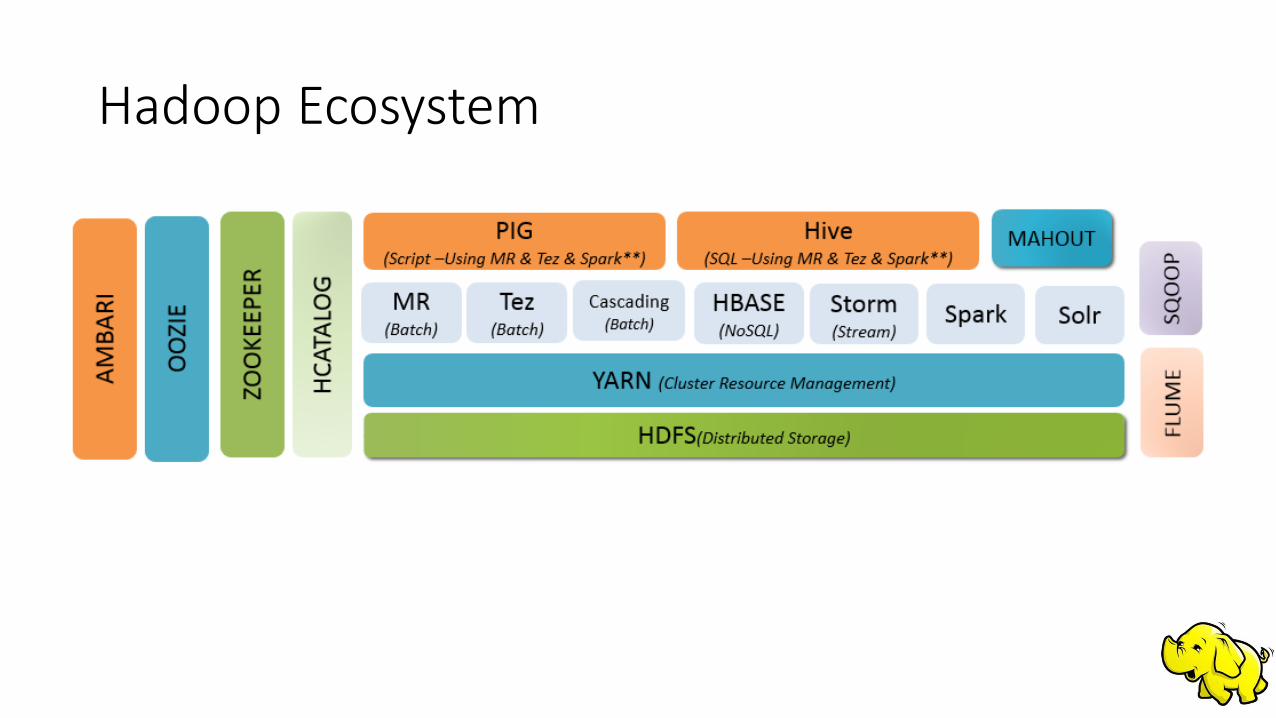
Hadoop Ecosystem

Hadoop @IBTECH/SMG
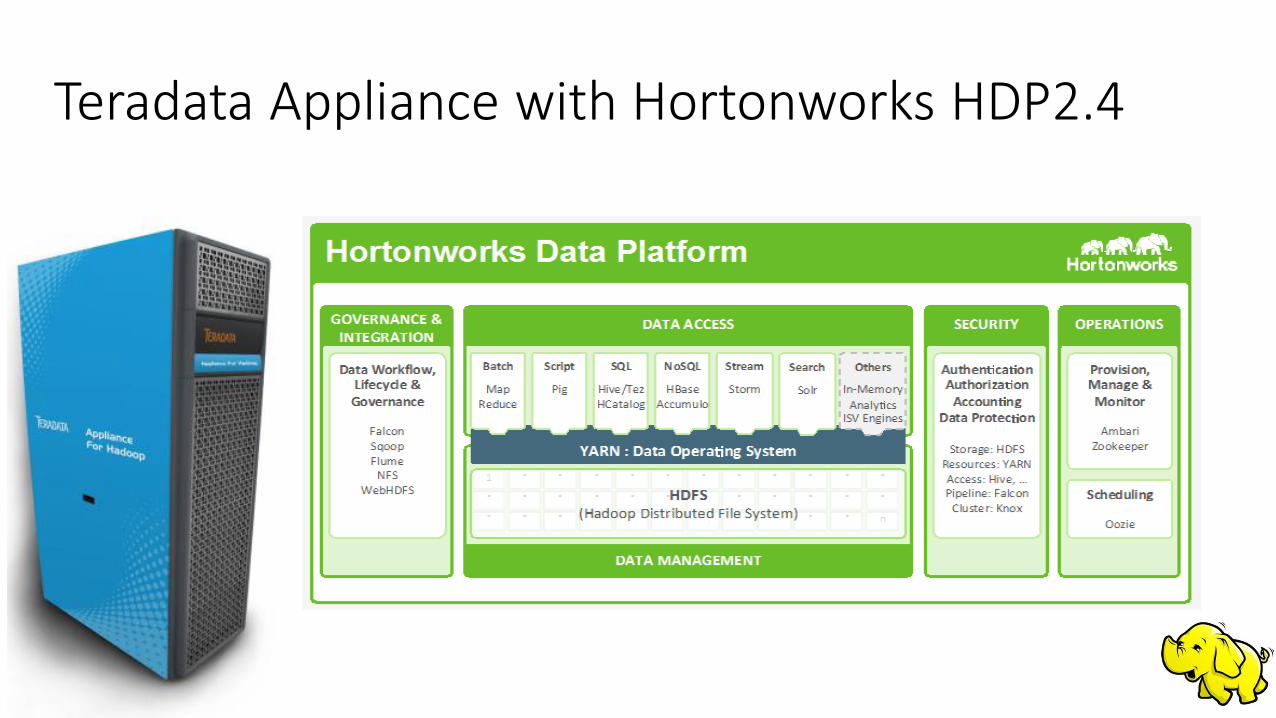
Teradata Appliance with Hortonworks HDP2.4
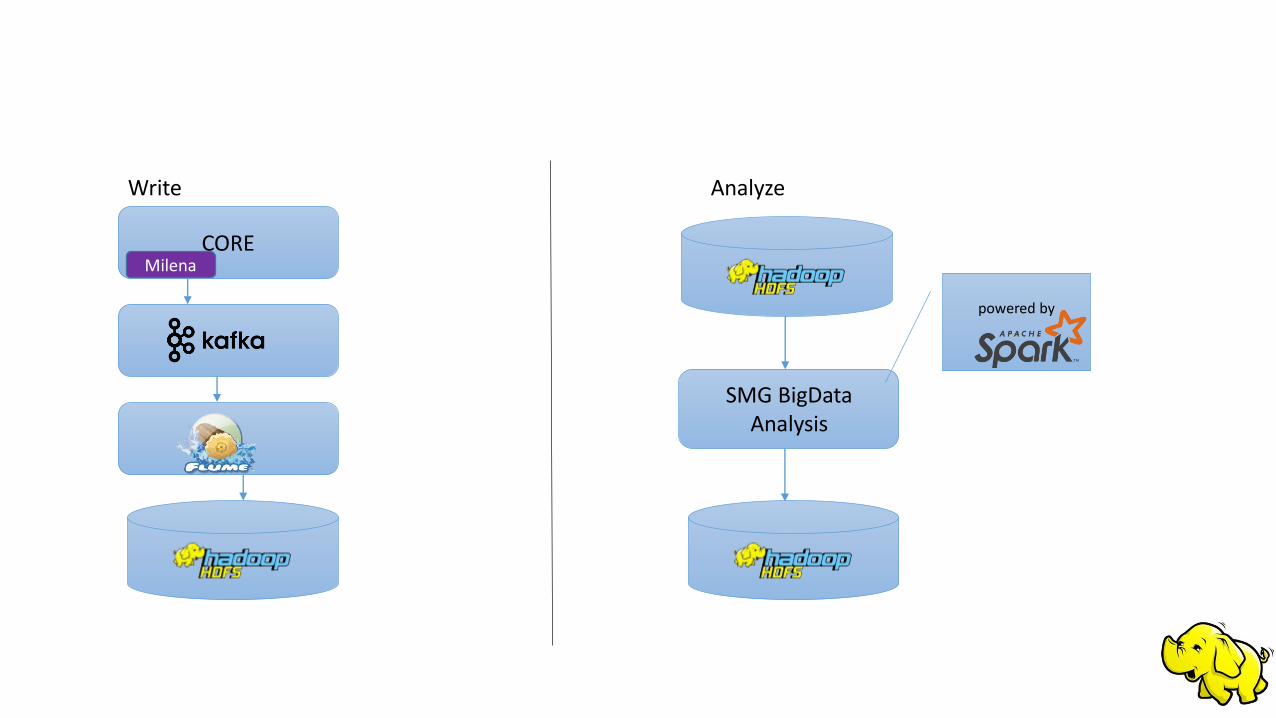
Write Analyze
COREMilena
SMG BigData Analysis
powered by
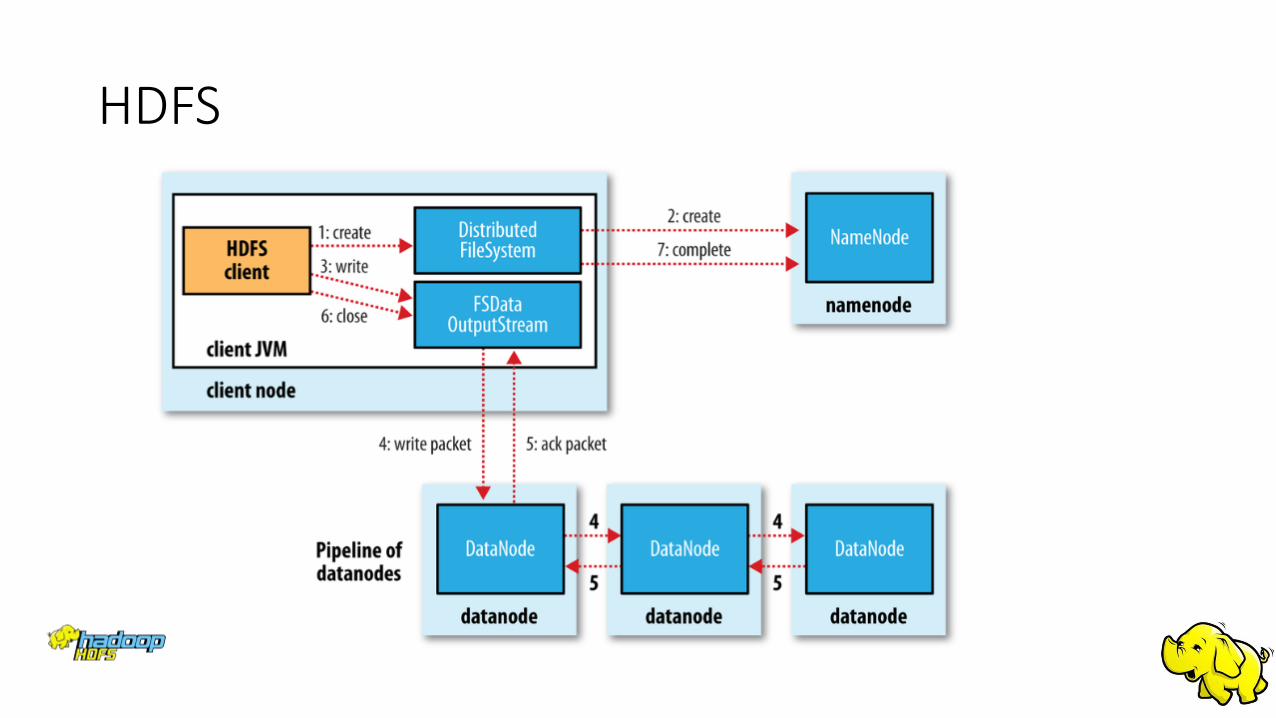
HDFS
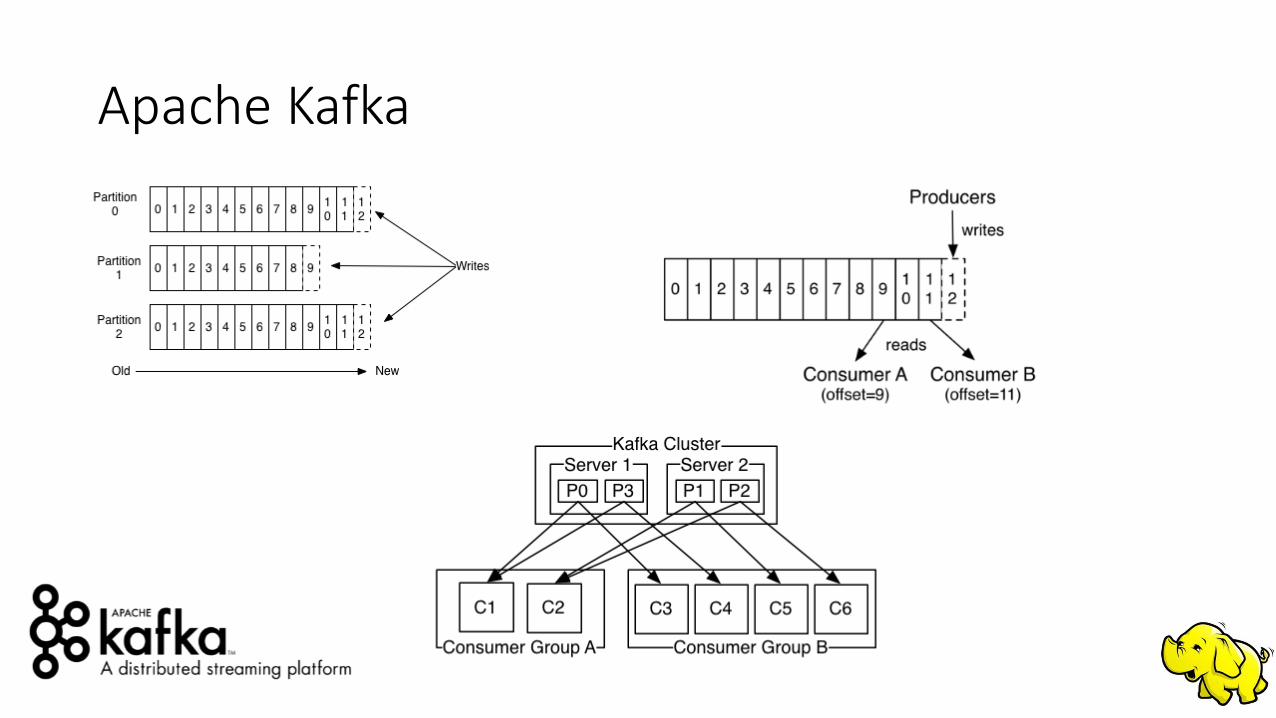
Apache Kafka
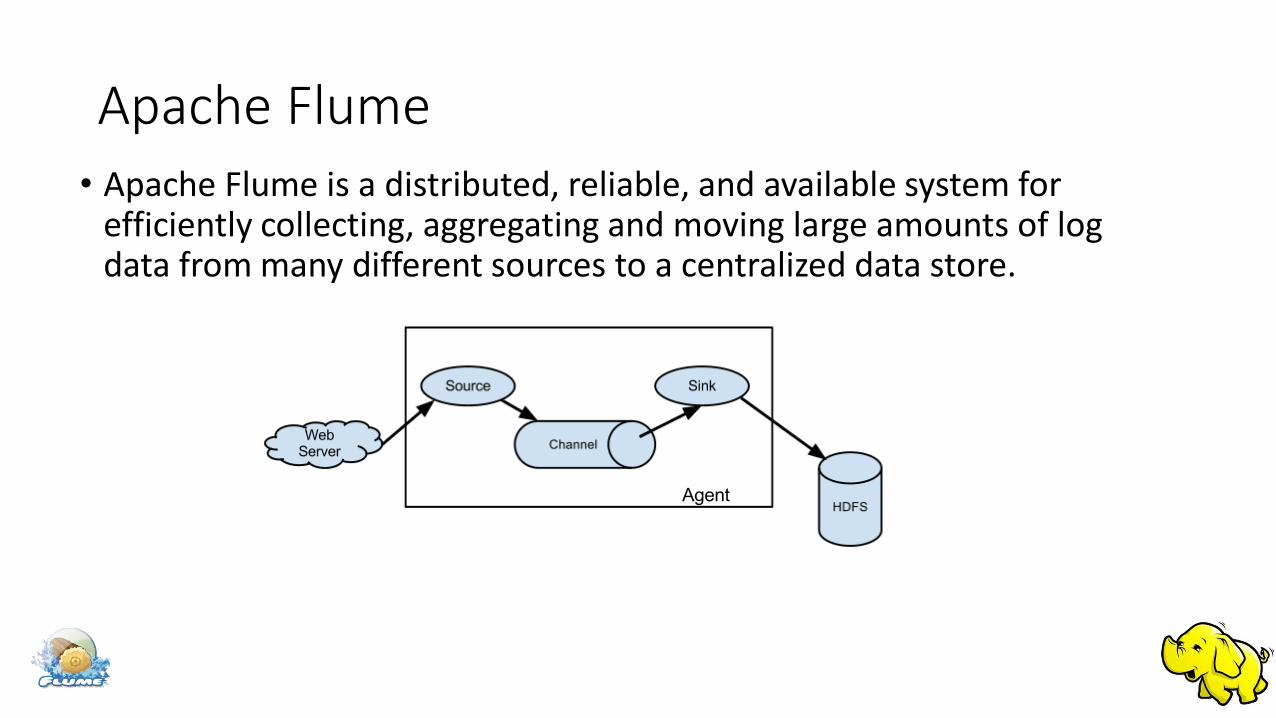
Apache Flume• Apache Flume is a distributed, reliable, and available system for
efficiently collecting, aggregating and moving large amounts of log data from many different sources to a centralized data store.
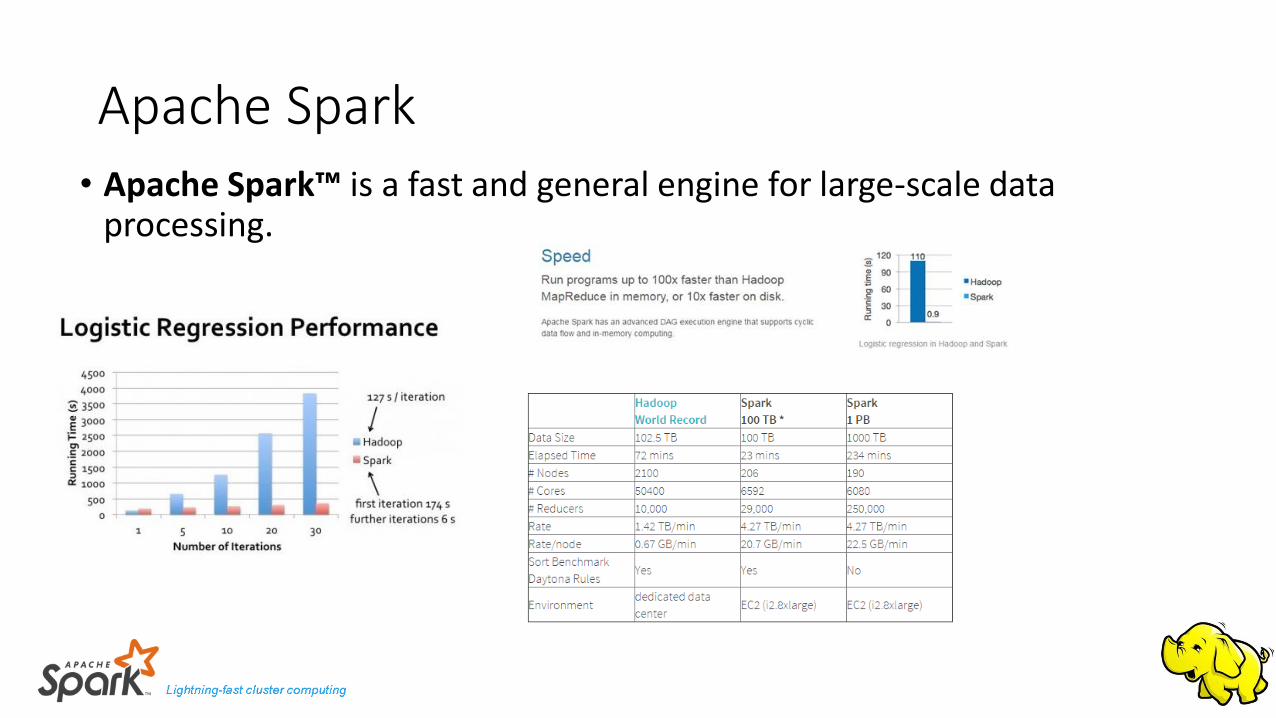
Apache Spark• Apache Spark™ is a fast and general engine for large-scale data
processing.
Sample Analysis Resultsfor 7th and 17th of October

• 29.1 GB of data collected
• 3.643.185 transactions
• 79.606.260 inner service calls
• ~22 inner service calls per transaction
Summary
• 35.25 GB of data collected
• 4.362.005 transactions
• 96.390.471 inner service calls
• ~22 inner service calls per transaction
Oct. 7,2016 Oct. 17,2016
For 32 jvms;• 931.2 GB of data• 116.581.920 transactions• 2.547.400.320 inner service calls
For 32 jvms;• 1.10 TB of data• 139.584.160 transactions• 3.084.495.072 inner service calls
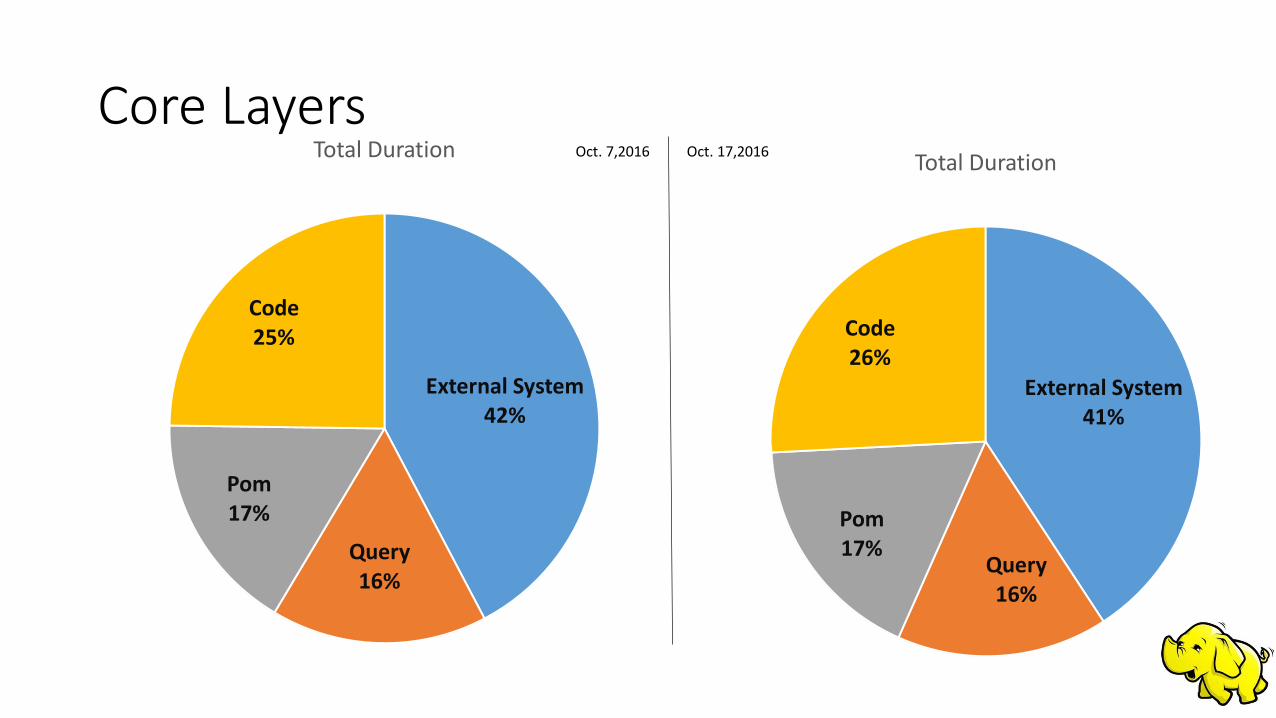
Core Layers
External System42%
Query16%
Pom17%
Code25%
Total Duration
External System41%
Query16%
Pom17%
Code26%
Total DurationOct. 7,2016 Oct. 17,2016
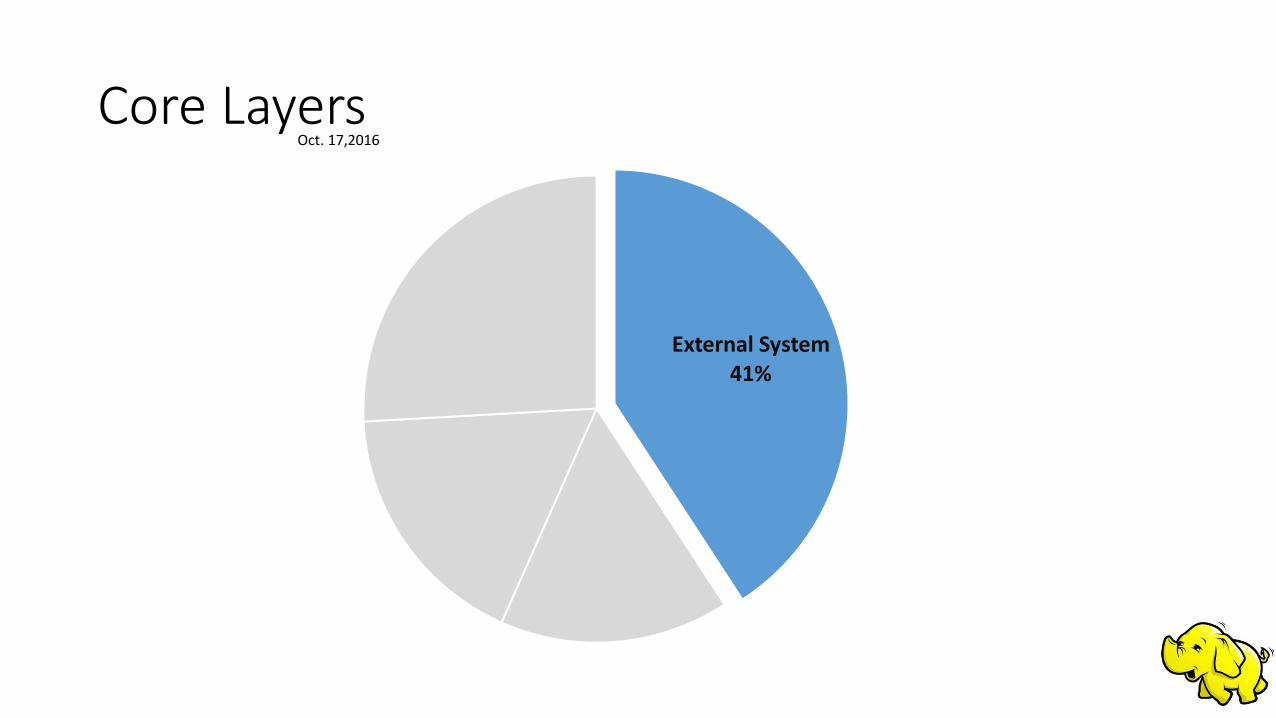
Core Layers
External System41%
Oct. 17,2016
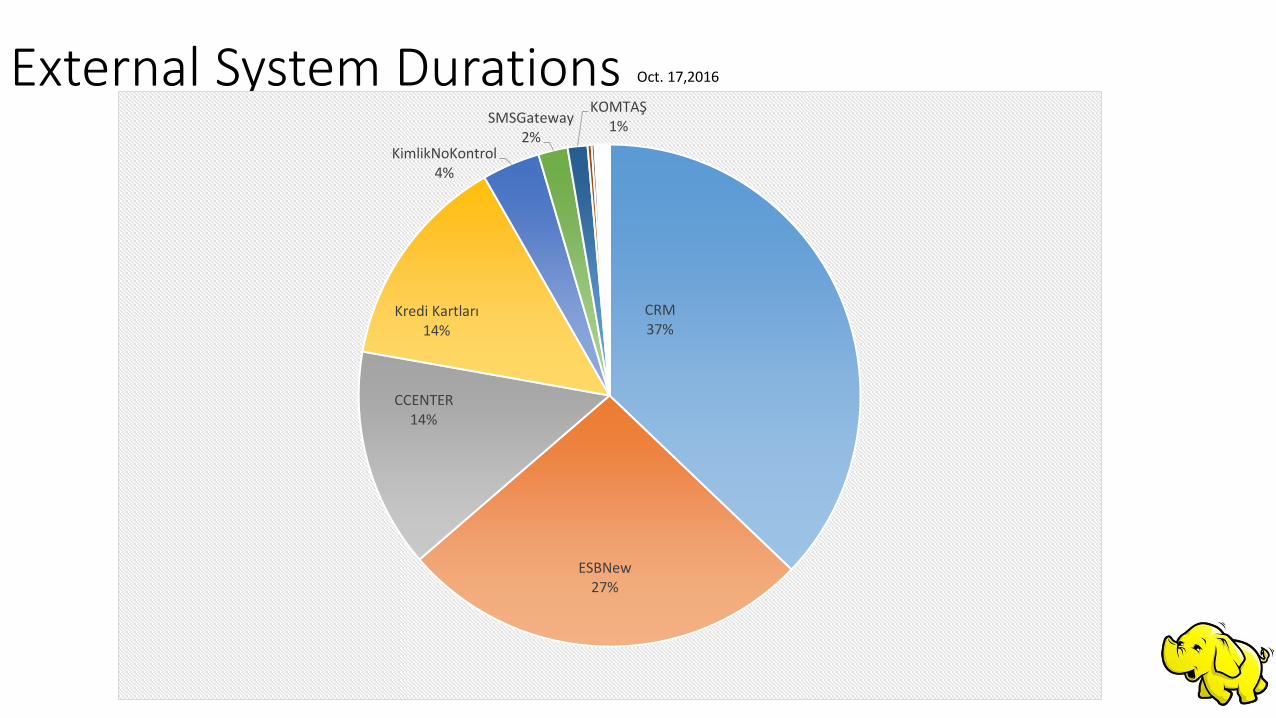
External System Durations
CRM37%
ESBNew27%
CCENTER14%
Kredi Kartları14%
KimlikNoKontrol4%
SMSGateway2%
KOMTAŞ1%
Oct. 17,2016
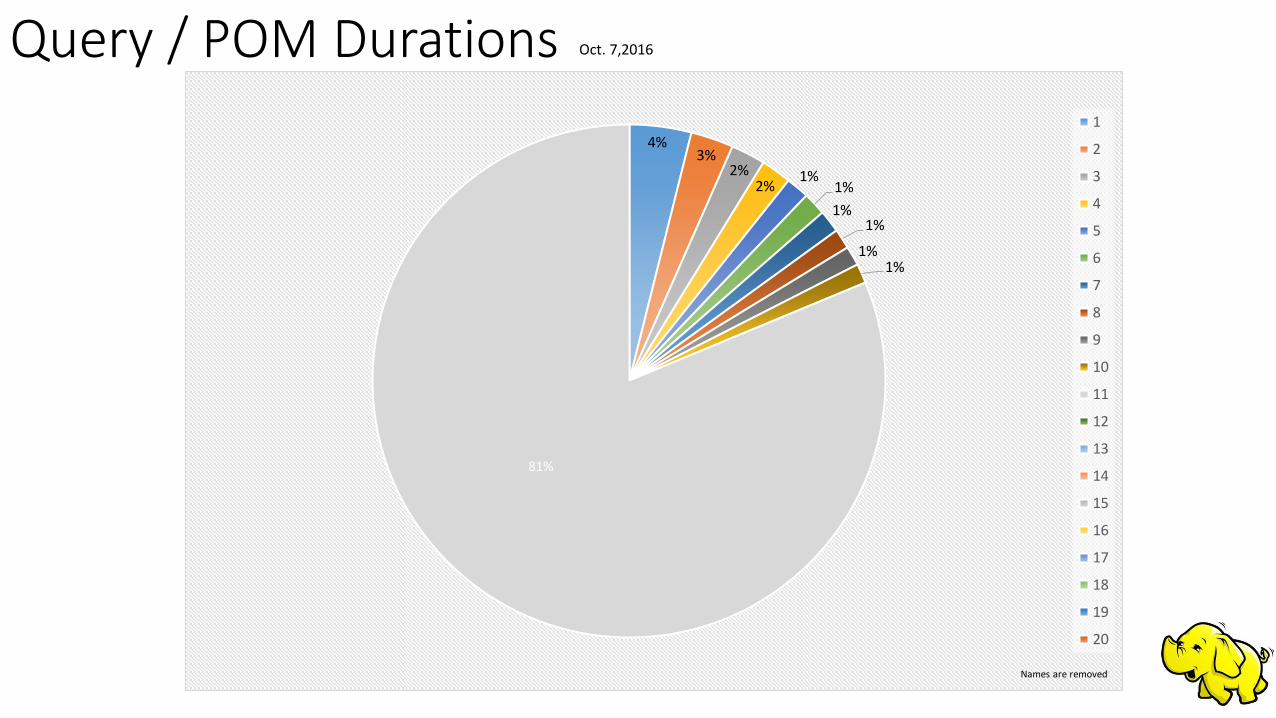
Query / POM Durations
4%3%
2%2%
1%1%
1%1%
1%1%
81%
1
2
3
4
5
6
7
8
9
10
11
12
13
14
15
16
17
18
19
20
Oct. 7,2016
Names are removed
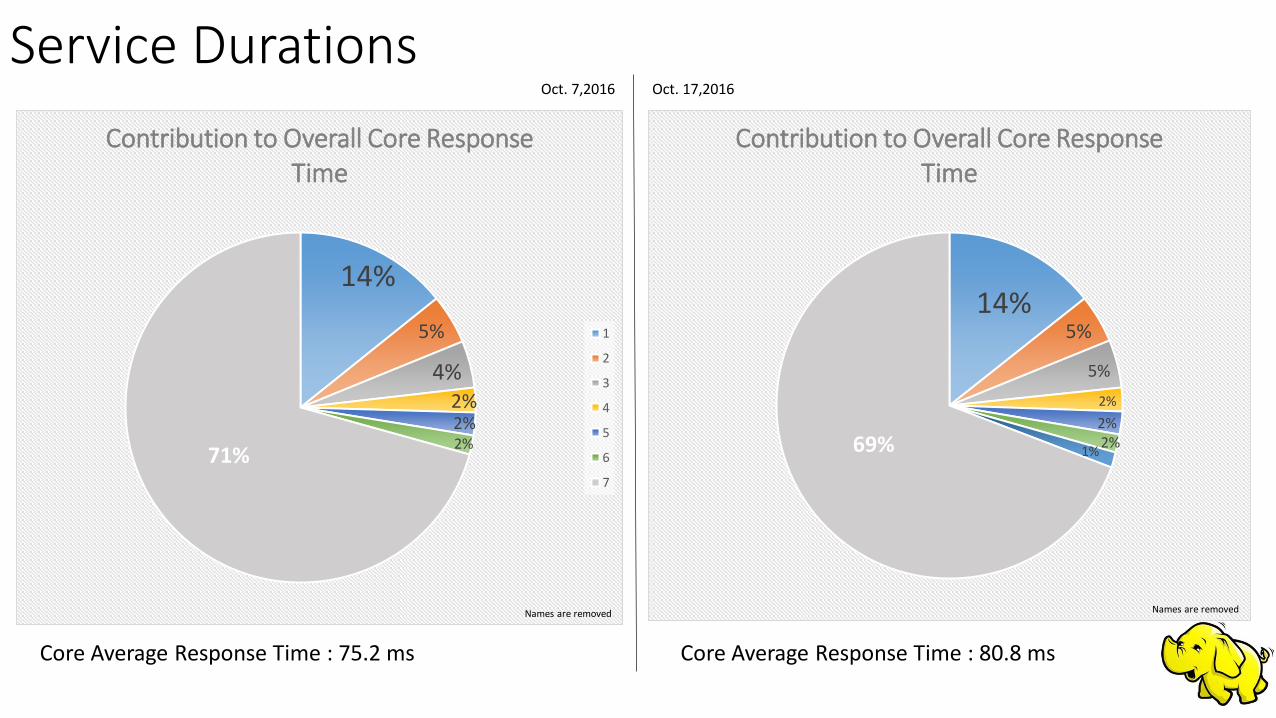
Service Durations
14%
5%
4%2%2%2%
71%
Contribution to Overall Core Response Time
1
2
3
4
5
6
7
Names are removed
14%5%
5%
2%
2%2%
1%69%
Contribution to Overall Core Response Time
Names are removed
Oct. 7,2016 Oct. 17,2016
Core Average Response Time : 75.2 ms Core Average Response Time : 80.8 ms
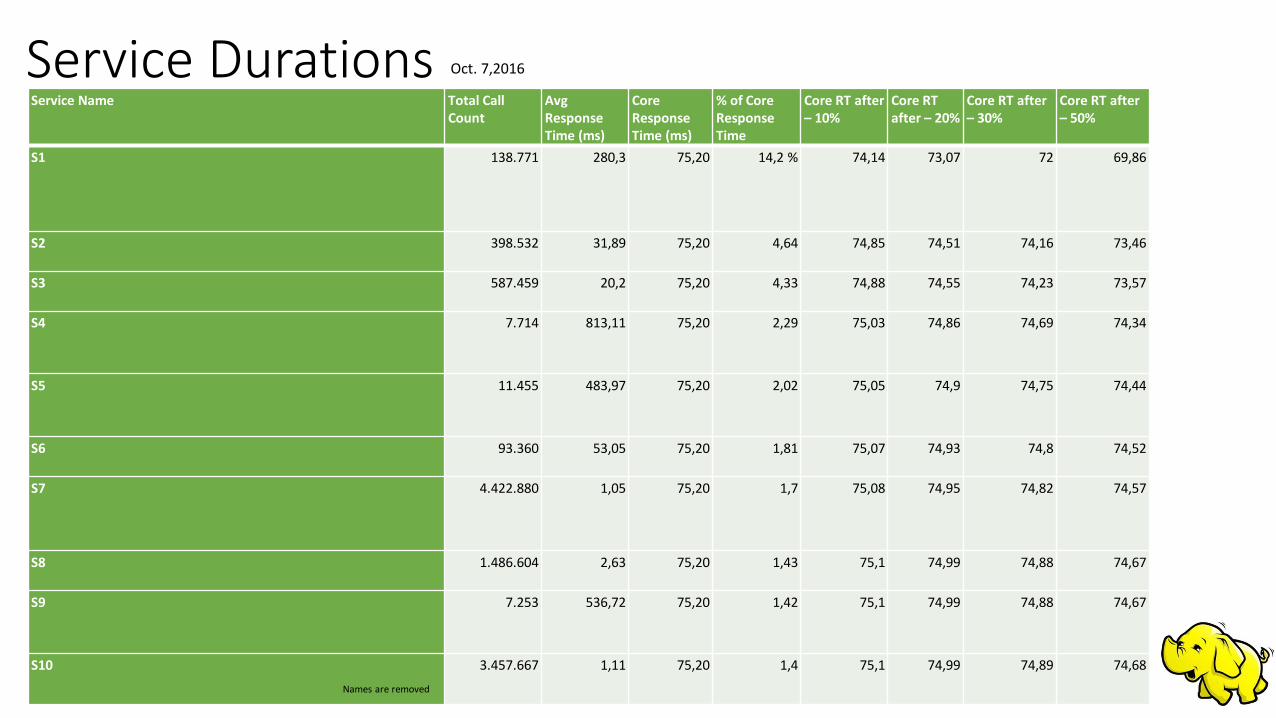
Service DurationsService Name Total Call
CountAvg Response Time (ms)
Core Response Time (ms)
% of Core Response Time
Core RT after – 10%
Core RT after – 20%
Core RT after – 30%
Core RT after – 50%
S1 138.771 280,3 75,20 14,2 % 74,14 73,07 72 69,86
S2 398.532 31,89 75,20 4,64 74,85 74,51 74,16 73,46
S3 587.459 20,2 75,20 4,33 74,88 74,55 74,23 73,57
S4 7.714 813,11 75,20 2,29 75,03 74,86 74,69 74,34
S5 11.455 483,97 75,20 2,02 75,05 74,9 74,75 74,44
S6 93.360 53,05 75,20 1,81 75,07 74,93 74,8 74,52
S7 4.422.880 1,05 75,20 1,7 75,08 74,95 74,82 74,57
S8 1.486.604 2,63 75,20 1,43 75,1 74,99 74,88 74,67
S9 7.253 536,72 75,20 1,42 75,1 74,99 74,88 74,67
S10 3.457.667 1,11 75,20 1,4 75,1 74,99 74,89 74,68
Oct. 7,2016
Names are removed
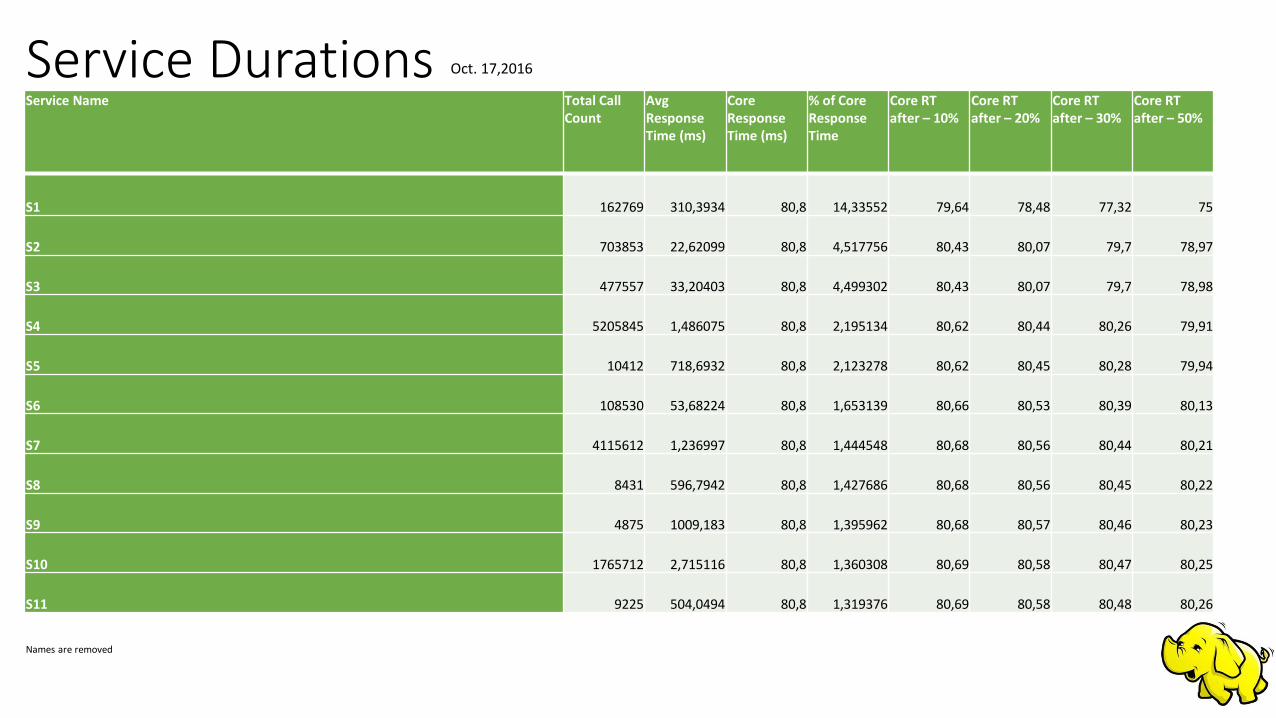
Service Name Total Call Count
Avg Response Time (ms)
Core Response Time (ms)
% of Core Response Time
Core RT after – 10%
Core RT after – 20%
Core RT after – 30%
Core RT after – 50%
S1 162769 310,3934 80,8 14,33552 79,64 78,48 77,32 75
S2 703853 22,62099 80,8 4,517756 80,43 80,07 79,7 78,97
S3 477557 33,20403 80,8 4,499302 80,43 80,07 79,7 78,98
S4 5205845 1,486075 80,8 2,195134 80,62 80,44 80,26 79,91
S5 10412 718,6932 80,8 2,123278 80,62 80,45 80,28 79,94
S6 108530 53,68224 80,8 1,653139 80,66 80,53 80,39 80,13
S7 4115612 1,236997 80,8 1,444548 80,68 80,56 80,44 80,21
S8 8431 596,7942 80,8 1,427686 80,68 80,56 80,45 80,22
S9 4875 1009,183 80,8 1,395962 80,68 80,57 80,46 80,23
S10 1765712 2,715116 80,8 1,360308 80,69 80,58 80,47 80,25
S11 9225 504,0494 80,8 1,319376 80,69 80,58 80,48 80,26
Service Durations Oct. 17,2016
Names are removed

Channel Transactions based on Finansbank Mobile & Finansbank Internet Banking
18%
14%
7%
5%4%
52%
Contribution to Overall Response Time for Channels
1
2
3
4
5
6
Names are removed
18%
13%
6%
6%4%
53%
Contribution to Overall Response Time for Channels
Oct. 7,2016 Oct. 17,2016
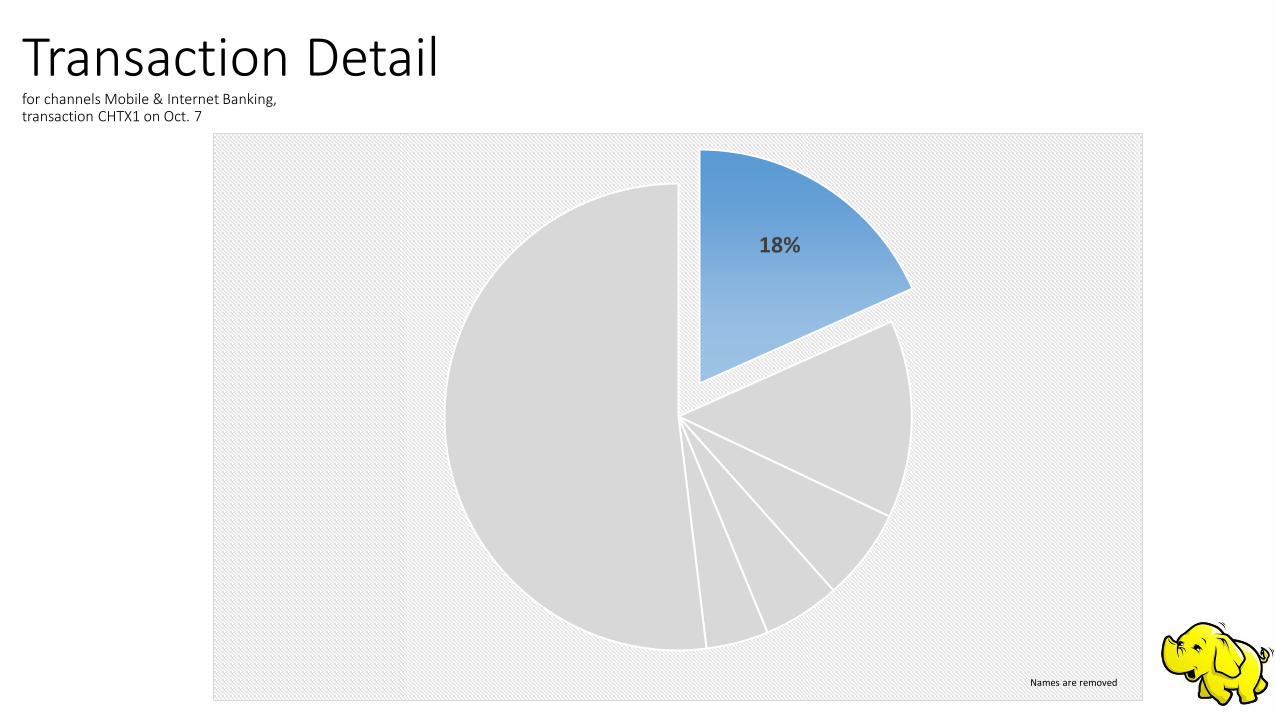
18%
Names are removed
Transaction Detailfor channels Mobile & Internet Banking, transaction CHTX1 on Oct. 7
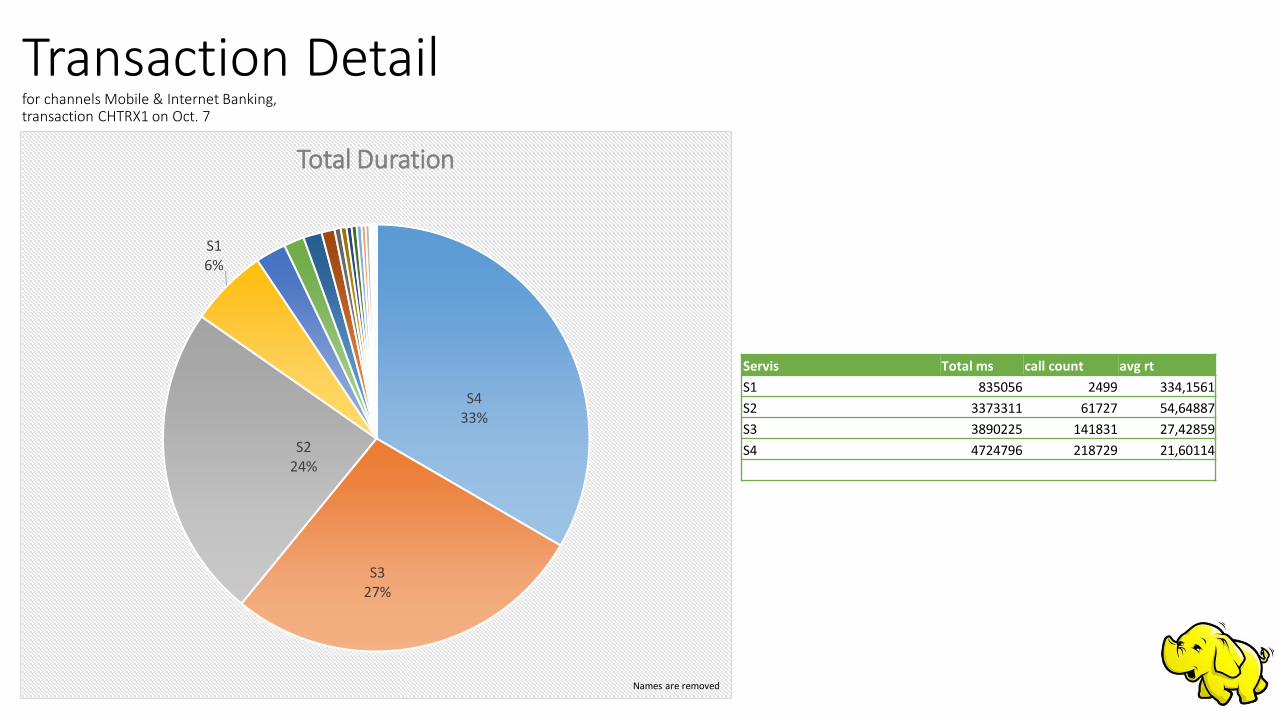
Transaction Detailfor channels Mobile & Internet Banking, transaction CHTRX1 on Oct. 7
S433%
S327%
S2 24%
S1 6%
Total Duration
Names are removed
Servis Total ms call count avg rt
S1 835056 2499 334,1561
S2 3373311 61727 54,64887
S3 3890225 141831 27,42859
S4 4724796 218729 21,60114
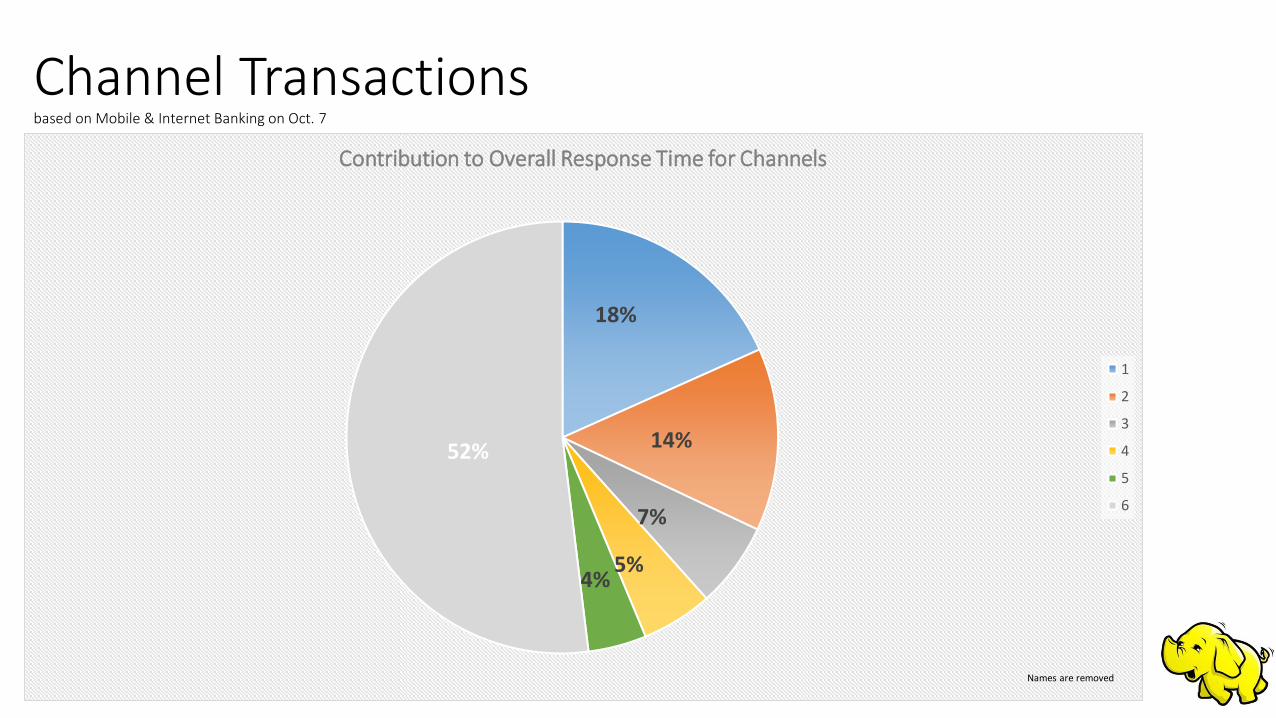
Channel Transactions based on Mobile & Internet Banking on Oct. 7
18%
14%
7%
5%4%
52%
Contribution to Overall Response Time for Channels
1
2
3
4
5
6
Names are removed
14%
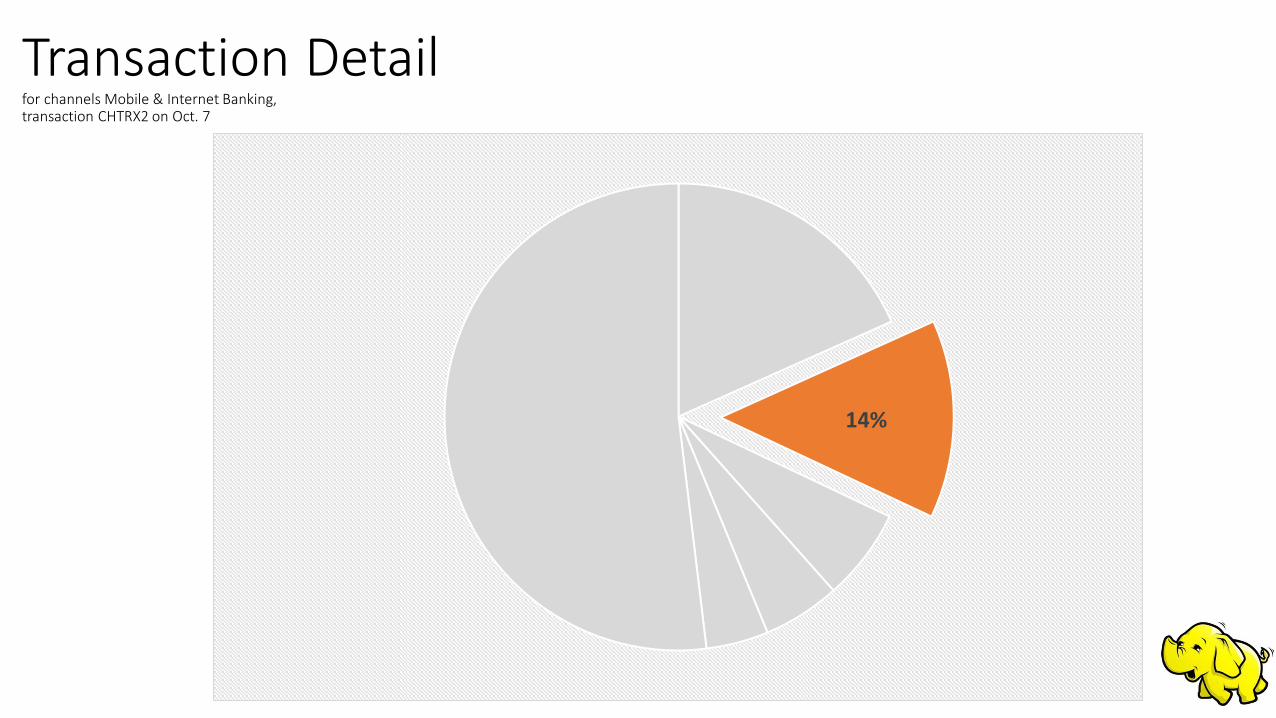
Transaction Detailfor channels Mobile & Internet Banking, transaction CHTRX2 on Oct. 7
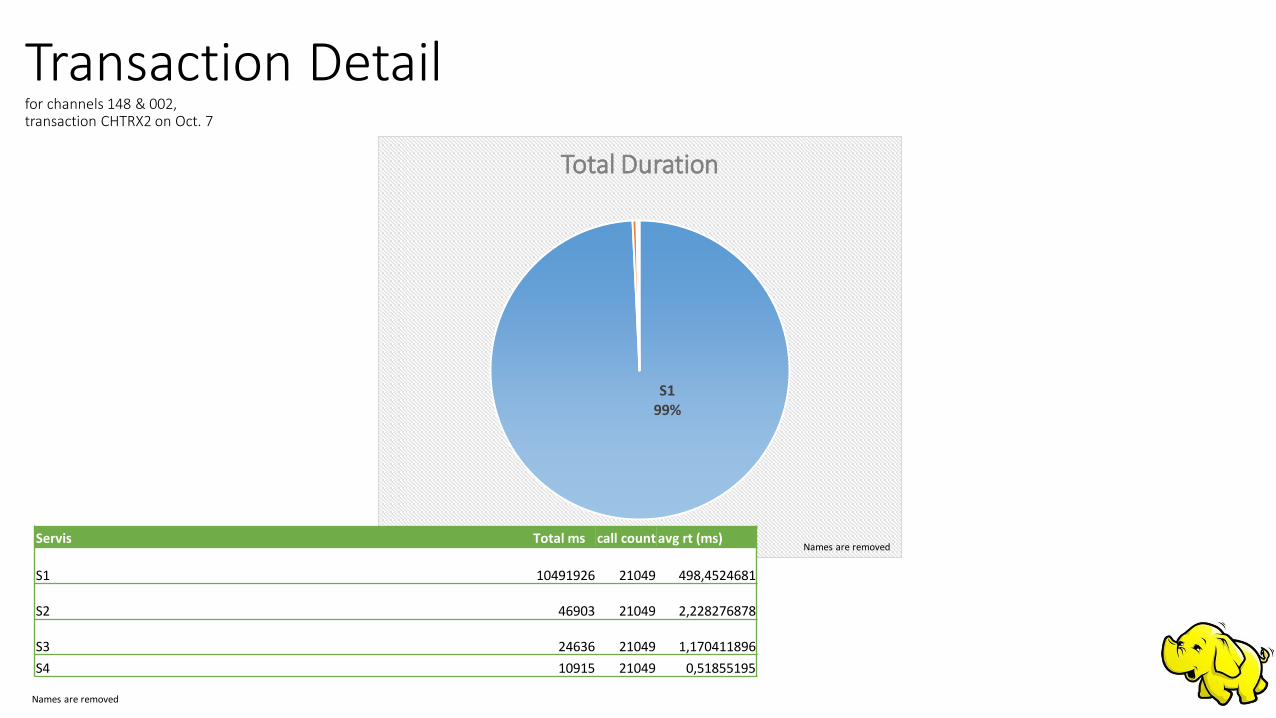
Transaction Detailfor channels 148 & 002, transaction CHTRX2 on Oct. 7
S199%
Total Duration
Names are removedServis Total ms call count avg rt (ms)
S1 10491926 21049 498,4524681
S2 46903 21049 2,228276878
S3 24636 21049 1,170411896
S4 10915 21049 0,51855195
Names are removed
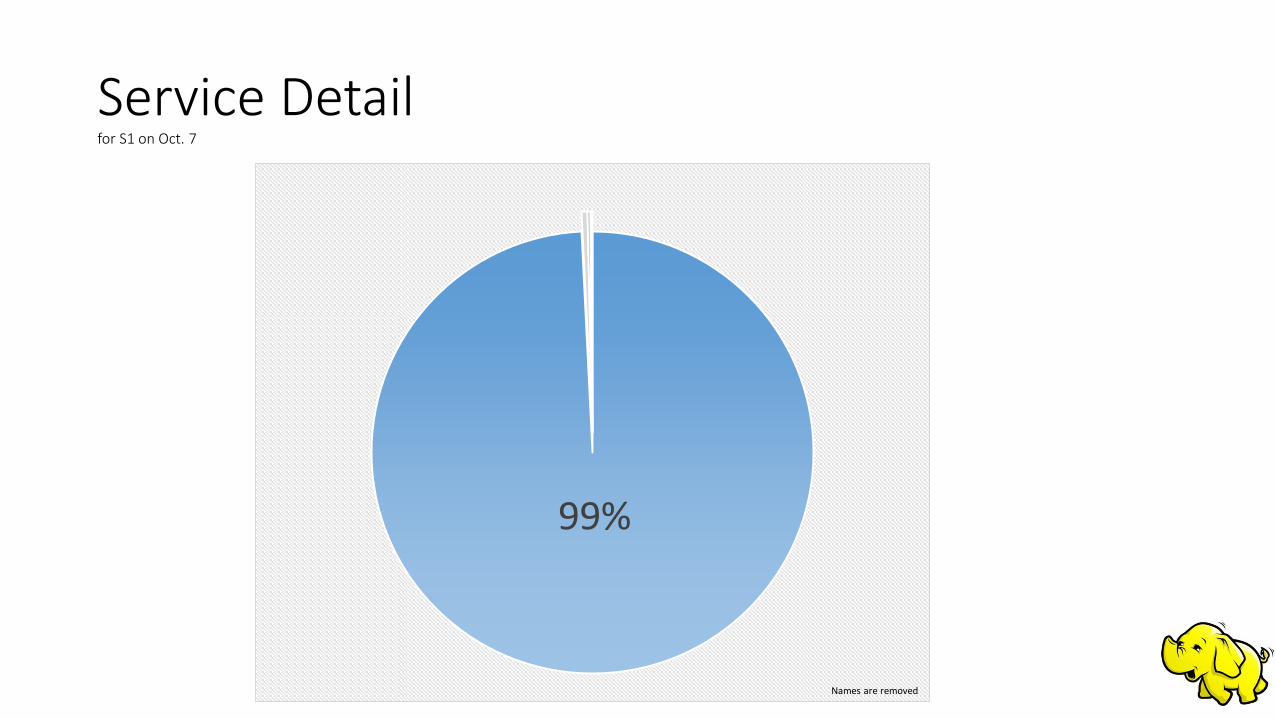
Service Detailfor S1 on Oct. 7
99%
Names are removed
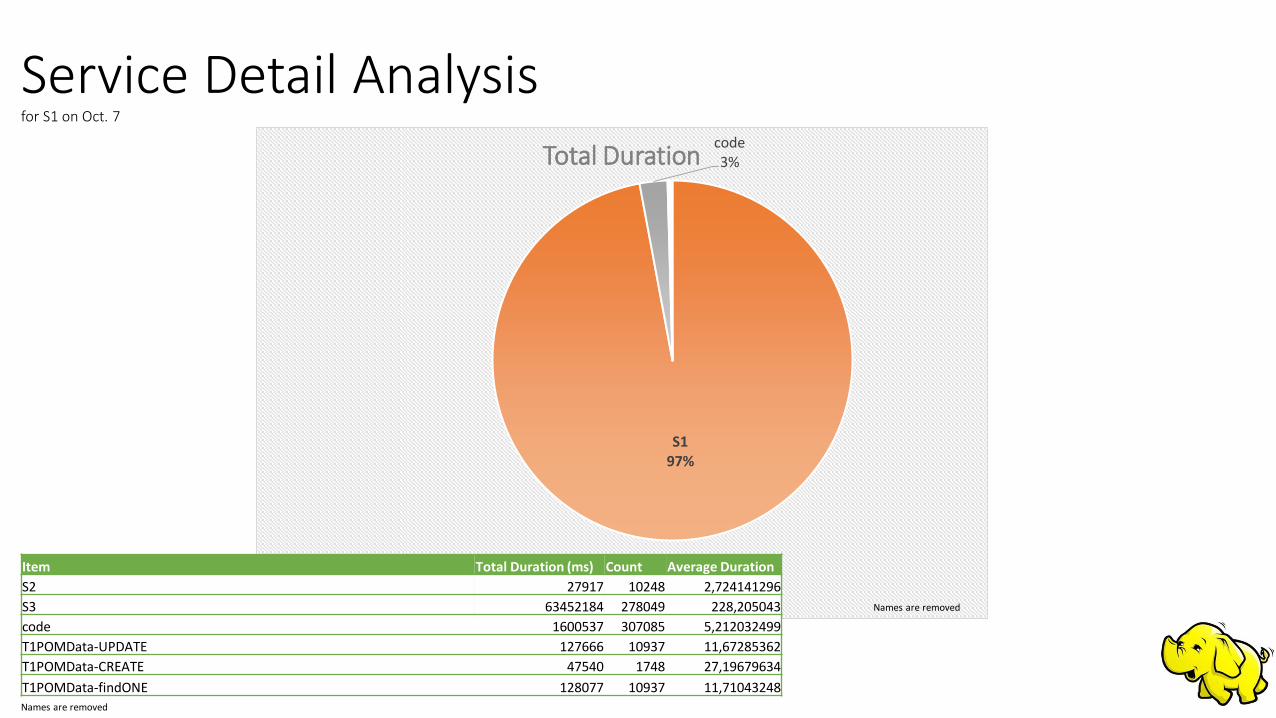
Service Detail Analysisfor S1 on Oct. 7
S197%
code3%Total Duration
Names are removed
Item Total Duration (ms) Count Average Duration
S2 27917 10248 2,724141296
S3 63452184 278049 228,205043
code 1600537 307085 5,212032499
T1POMData-UPDATE 127666 10937 11,67285362
T1POMData-CREATE 47540 1748 27,19679634
T1POMData-findONE 128077 10937 11,71043248Names are removed

Service Detail Analysisfor UI1 on Oct. 7
129%
214%
38%4
8%
58%
67%
76%
84%
93%
103%
112%
Names are removed
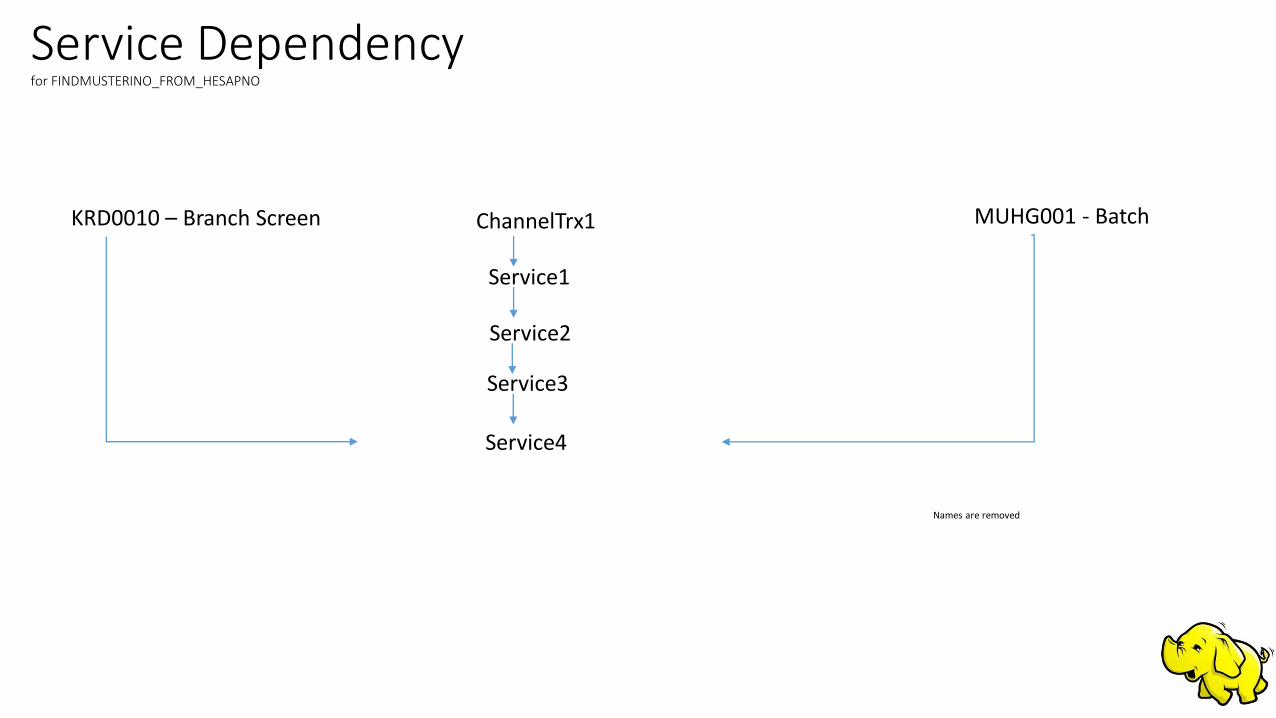
Service Dependencyfor FINDMUSTERINO_FROM_HESAPNO
ChannelTrx1
Service1
Service2
Service3
Service4
KRD0010 – Branch Screen MUHG001 - Batch
Names are removed
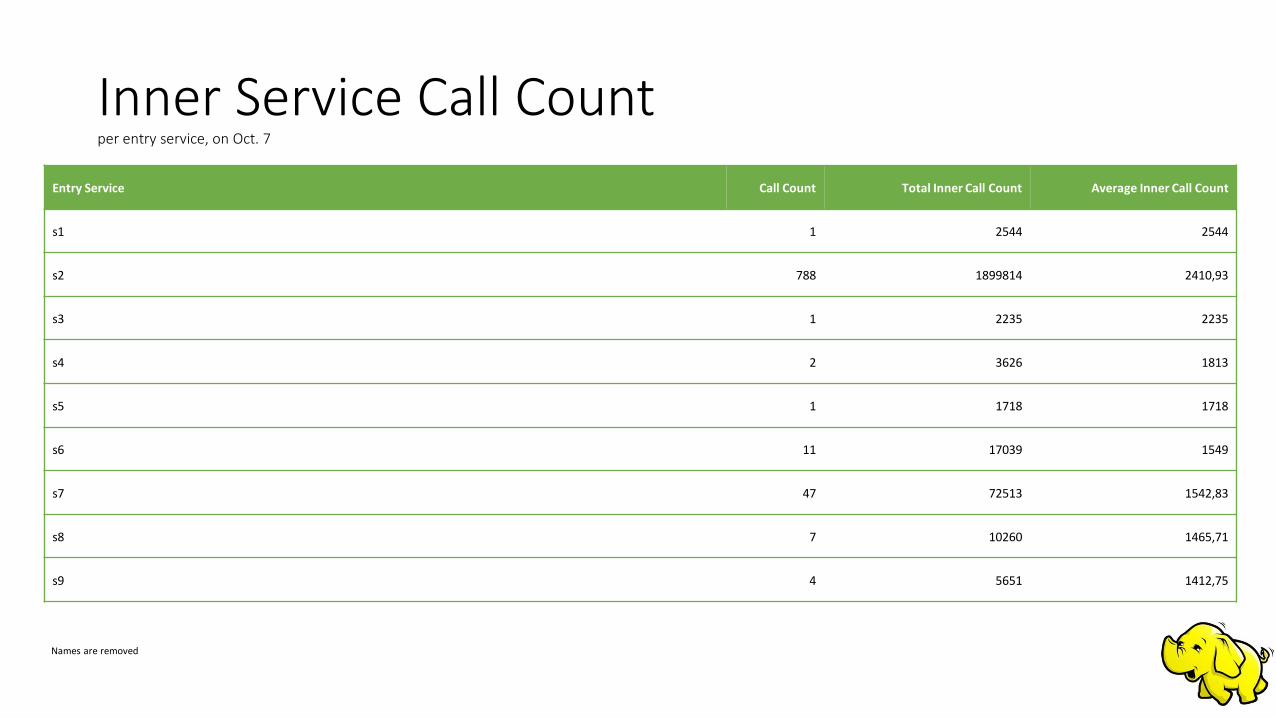
Inner Service Call Countper entry service, on Oct. 7
Entry Service Call Count Total Inner Call Count Average Inner Call Count
s1 1 2544 2544
s2 788 1899814 2410,93
s3 1 2235 2235
s4 2 3626 1813
s5 1 1718 1718
s6 11 17039 1549
s7 47 72513 1542,83
s8 7 10260 1465,71
s9 4 5651 1412,75
Names are removed
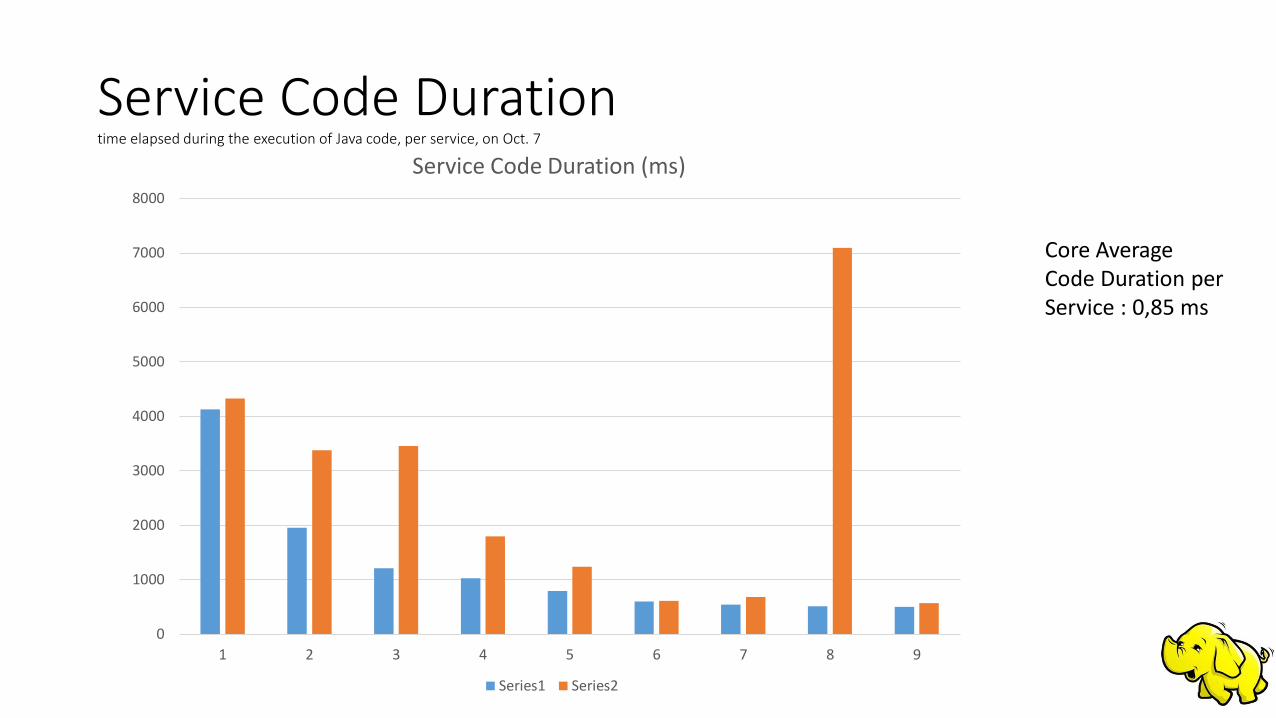
Service Code Durationtime elapsed during the execution of Java code, per service, on Oct. 7
0
1000
2000
3000
4000
5000
6000
7000
8000
1 2 3 4 5 6 7 8 9
Service Code Duration (ms)
Series1 Series2
Core Average Code Duration per Service : 0,85 ms
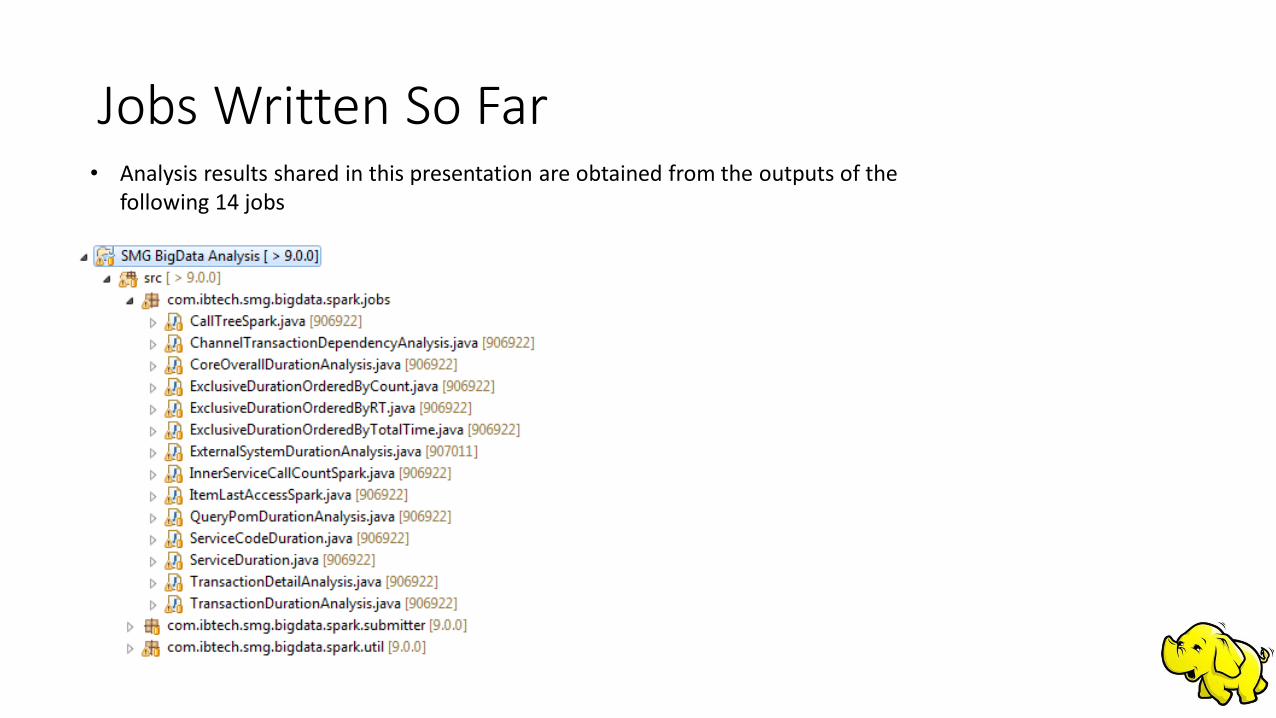
Jobs Written So Far• Analysis results shared in this presentation are obtained from the outputs of the
following 14 jobs
