big data analytics, connected vehicles and smart cities
TRANSCRIPT

Big Data Analytics, Connected Vehicles and
Smart CitiesBob McQueen, Kyra Solutions
1

Topics
• What is a smart city?
• The importance of transportation in a smart city
• What is Big data?
• What are big data analytics?
• The value of big data analytics in transportation
• Getting what you want from big data analytics: Use Cases
• Smart Data Management and how to get there
• Benefit and cost approach
2

What is a Smart City?• Wider than transportation
• Disproportionate importance of transportation
• A range of transportation services
• Connectivity
• Alignment between modes
• Optimization of transportation services
• Matching supply and demand through variations over time
• Monitoring, managing, and learning
3

What is a Smart City?• Energy
• Smart Buildings
• Smart healthcare
• Smart education
• Smart retail
• Utilities
• Manufacturing
• Urban Agriculture
• Transportation
4
https://image.slidesharecdn.com/itstrategyfinalpresentationv3-160401204326/95/cisco-smart-city-2-638.jpg?cb=1459543863

Transportation in Smart Cities
• Energy: 28% of US energy used for transportation
• Smart Buildings to live and work: accessibility
• Smart healthcare : accessibility
• Smart education : accessibility
• Smart retail : accessibility
• Manufacturing: : accessibility
• Utilities: EV charging, sensor sharing
• Urban Agriculture: farm to table chain
• Transportation: mobility, accessibility, safety, efficiency, user experience
5
CPA-I_001-v2_Anatomy City Anatomy: A Framework to support City Governance, Evaluation and Transformation Developed by Task Team - ancha 6 November 2015 http://www.cptf.cityprotocol.org/CPAI/CPA-I_001-v2_Anatomy.pdf

• Smart:
• Connected and autonomous vehicles
• Fee payment
• Sensors
• Infrastructure
• Probes
• Communications
• Fiber
• Wireless V to X
• Transportation management
• Traffic signals
• Freeway
• Transit
• Freight
• non-motorized
• Traveler information
Transportation in Smart Cities
6
Urban analytics
Urban automation
Urban delivery and logistics
User focused mobility
Strategic business
models and partnering
Transportation governance
Transportation management
Traveler information
Intelligent sensor-based infrastructure
Low cost efficient,
secure and resilient ICT
Smart grid, roadway
electrific’n and electric vehicle
Smart land use
Asset and maintenance management
Connected Vehicle
Connected, involved citizens
Integrated electronic payment

Transportation as a Single System
• What is a system?• It has clarity of purpose
• It is connected together
• We can find out its status at any given time
• It can adapt to changes in the environment
• “Single system” also includes alignment between planning, design, project delivery, operations, and maintenance
7
Paraphrased from the speech by Samuel J. Palmisano, Intelligent Transportation Society of America, 2010 Annual Meeting & Conference, Houston, Texas, May 5, 2010

Connected and Autonomous Vehicles
• The Internet of Things
• Cities will roll out more autonomous vehicles over the next five years, including First mile last mile shuttles
• Electric vehicles will outnumber gas powered cars in the next 15 years
• Crowdsourced ride-sharing services will go global (Mobility as a Service)
• Vehicles will connect to transportation systems, Ford says it will equip 20 million cars with built-in modems over five years
• City managers will have new operating systems to manage transportation, data will be integrated from multiple endpoints.
8
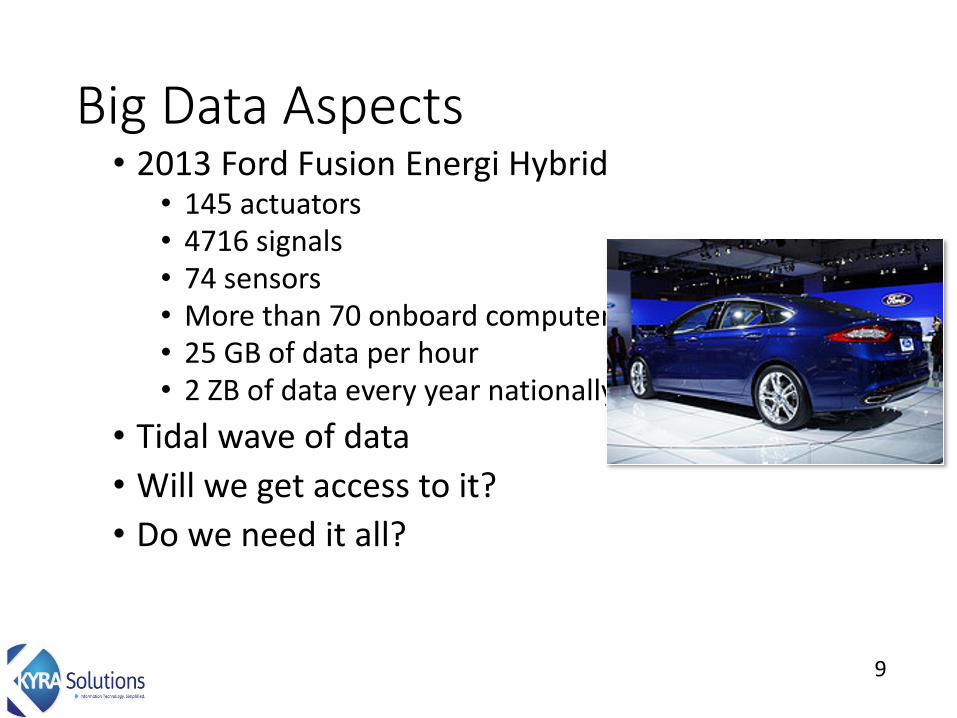
Big Data Aspects• 2013 Ford Fusion Energi Hybrid
• 145 actuators• 4716 signals• 74 sensors• More than 70 onboard computers• 25 GB of data per hour• 2 ZB of data every year nationally
• Tidal wave of data
• Will we get access to it?
• Do we need it all?
9

• Type
• Volume
• Velocity
• Variety
• Variability
• Complexity
• Veracity
What is Big Data?
10
Not New
Most big data use cases are variations on:
• Safety,
• Efficiency
• User experience
…questions that public service agencies have been addressing for years
Analytics: graph and path analytics, and analytics on new, non-relational data types (coupled with existing relational data)
Tools: uncover insights from data such as text in accident reports, or patterns in visuals, to quickly find the signal in the noise
Economics: retain, do not throw away signal timings, speed, flow and occupancy data, by leveraging “hot and cold data” storage
Architecture: hybrid ecosystem that allows both old and new tools and enables rapid discovery analytics on new data
New
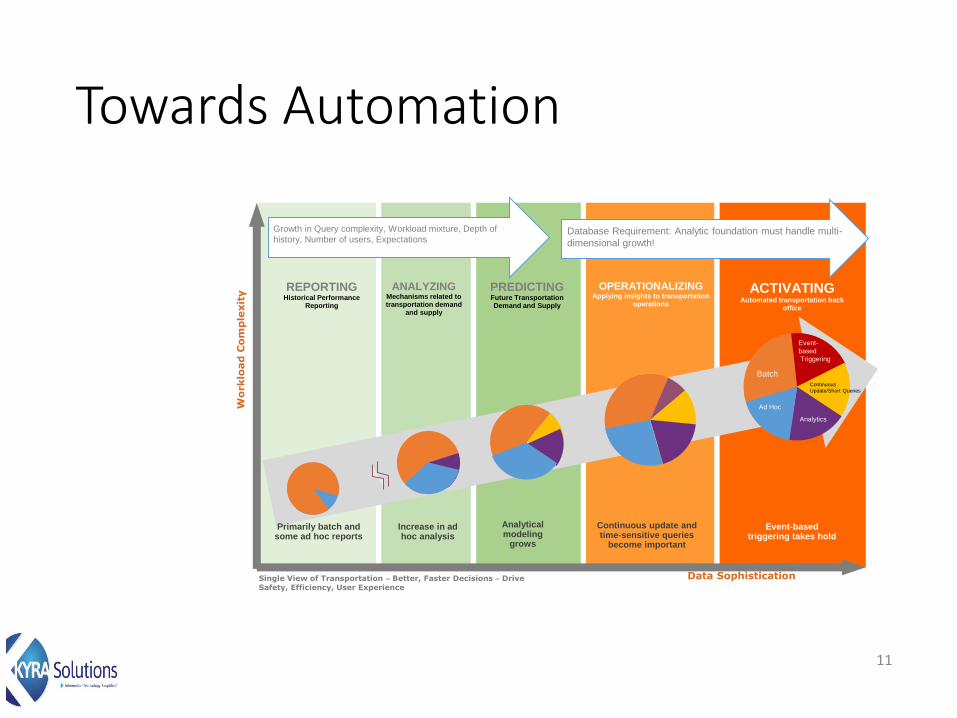
Data Sophistication
Continuous update and time-sensitive queries
become important
OPERATIONALIZINGApplying insights to transportation
operations
Event-based triggering takes hold
ACTIVATINGAutomated transportation back
office
Primarily batch and some ad hoc reports
Increase in ad hoc analysis
ANALYZINGMechanisms related to transportation demand
and supply
REPORTINGHistorical Performance
Reporting
Analytical modeling
grows
PREDICTINGFuture Transportation Demand and Supply
Single View of Transportation – Better, Faster Decisions – Drive Safety, Efficiency, User Experience
Wo
rklo
ad
Co
mp
lexit
y
Batch
Ad Hoc
Continuous
Update/Short Queries
Analytics
Event-
based
Triggering
Growth in Query complexity, Workload mixture, Depth of
history, Number of users, ExpectationsDatabase Requirement: Analytic foundation must handle multi-
dimensional growth!
Towards Automation
11
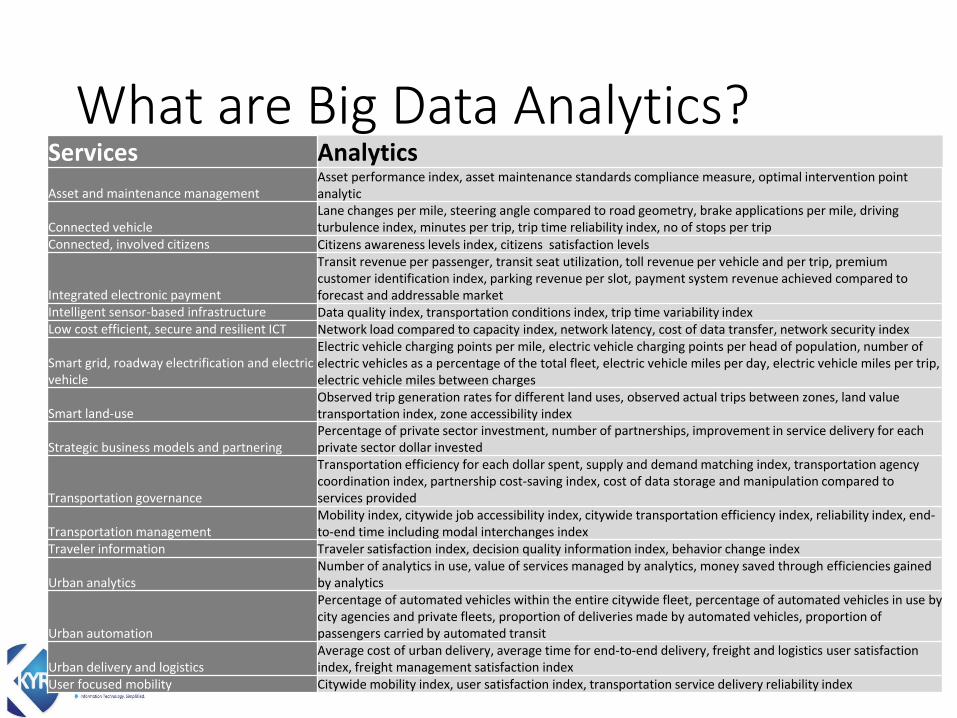
What are Big Data Analytics?
12
Services Analytics
Asset and maintenance managementAsset performance index, asset maintenance standards compliance measure, optimal intervention point analytic
Connected vehicleLane changes per mile, steering angle compared to road geometry, brake applications per mile, driving turbulence index, minutes per trip, trip time reliability index, no of stops per trip
Connected, involved citizens Citizens awareness levels index, citizens satisfaction levels
Integrated electronic payment
Transit revenue per passenger, transit seat utilization, toll revenue per vehicle and per trip, premium customer identification index, parking revenue per slot, payment system revenue achieved compared to forecast and addressable market
Intelligent sensor-based infrastructure Data quality index, transportation conditions index, trip time variability indexLow cost efficient, secure and resilient ICT Network load compared to capacity index, network latency, cost of data transfer, network security index
Smart grid, roadway electrification and electric vehicle
Electric vehicle charging points per mile, electric vehicle charging points per head of population, number of electric vehicles as a percentage of the total fleet, electric vehicle miles per day, electric vehicle miles per trip, electric vehicle miles between charges
Smart land-useObserved trip generation rates for different land uses, observed actual trips between zones, land value transportation index, zone accessibility index
Strategic business models and partneringPercentage of private sector investment, number of partnerships, improvement in service delivery for each private sector dollar invested
Transportation governance
Transportation efficiency for each dollar spent, supply and demand matching index, transportation agency coordination index, partnership cost-saving index, cost of data storage and manipulation compared to services provided
Transportation managementMobility index, citywide job accessibility index, citywide transportation efficiency index, reliability index, end-to-end time including modal interchanges index
Traveler information Traveler satisfaction index, decision quality information index, behavior change index
Urban analyticsNumber of analytics in use, value of services managed by analytics, money saved through efficiencies gained by analytics
Urban automation
Percentage of automated vehicles within the entire citywide fleet, percentage of automated vehicles in use by city agencies and private fleets, proportion of deliveries made by automated vehicles, proportion of passengers carried by automated transit
Urban delivery and logisticsAverage cost of urban delivery, average time for end-to-end delivery, freight and logistics user satisfaction index, freight management satisfaction index
User focused mobility Citywide mobility index, user satisfaction index, transportation service delivery reliability index

• Difference between reporting and analytics
• The importance of Use Cases
• Getting started, developing a roadmap, Defining the future vision
• Building bridges
• Between data science and transportation
• Between departments
• Between agencies and partners
• Using data as the “glue”
• Defining needs, issues, problems and objectives
• Reporting
• Questions predefined
• Focus on “knowing”
• Analytics
• Different questions can be defined
• Focus is on improving organizational performance by analytics applied to management
• Reporting makes you a well informed spectator
• The right analytics can make you the coach with the ability to change the performance of the team
Getting What You Want
13
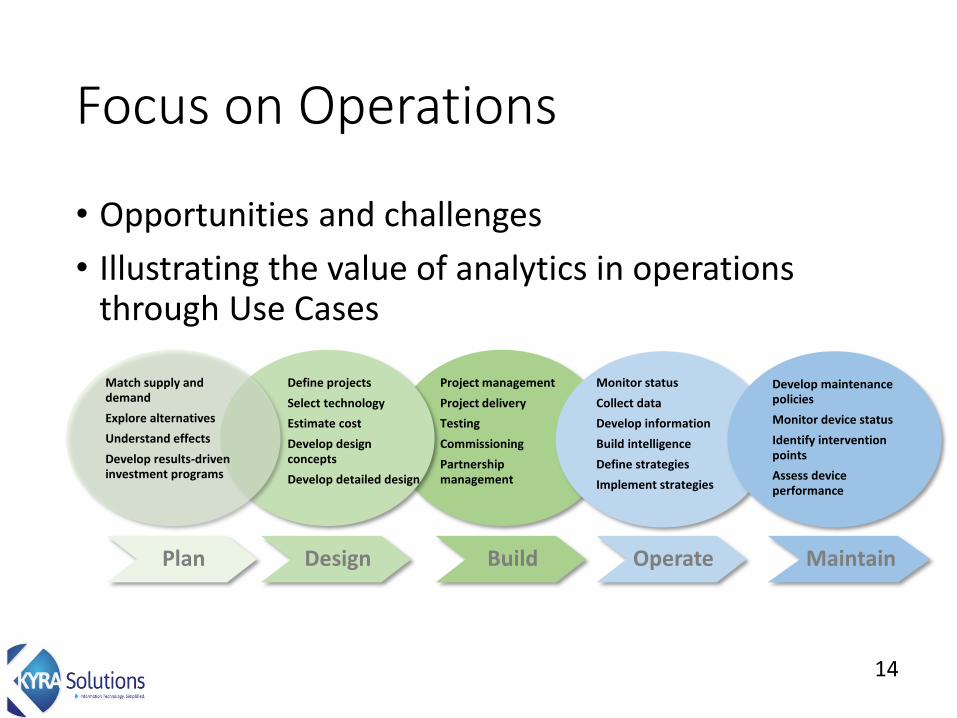
Focus on Operations
• Opportunities and challenges
• Illustrating the value of analytics in operations through Use Cases
14
Project management
Project delivery
Testing
Commissioning
Partnership management
Define projects
Select technology
Estimate cost
Develop design concepts
Develop detailed design
Monitor status
Collect data
Develop information
Build intelligence
Define strategies
Implement strategies
Develop maintenance policies
Monitor device status
Identify intervention points
Assess device performance
Design Build Operate Maintain
Match supply and demand
Explore alternatives
Understand effects
Develop results-driven investment programs
Plan

Importance of Operations• Operations as a significant data
generator
• SANDAG
• 1 TB per day
• Assumed 200 days per year operation
• 200 TB per annum
• Connected vehicle
• 2 ZB per annum
• The impact of operations on safety, efficiency, and user experience
• Coordination of planning, design, project delivery, operations, and maintenance to deliver quality services
15
Proportion of the data originating
Planning 20%Design 10%Project delivery 5%Operations 50%Maintenance 15%Total 100%
Planning
Design
Project delivery
Operations
Maintenance

Operations Challenges
16

Mobility as a service10
Transportation Operations Use Case Catalog Version 1
Traffic anomaly detection and communications
1Results driven investment
3Towing and recovery management
2
Asset management4Transportation network management
5Transportation systems management and operation impact analysis
6
Developer fee management
7Regionwide safety analysis
8Regionwide speed in bottleneck analysis
9
Connected citizens and travelers
11
Project tracking and coordination
12
Operations Use Case Examples
17

Smart Data Management
18
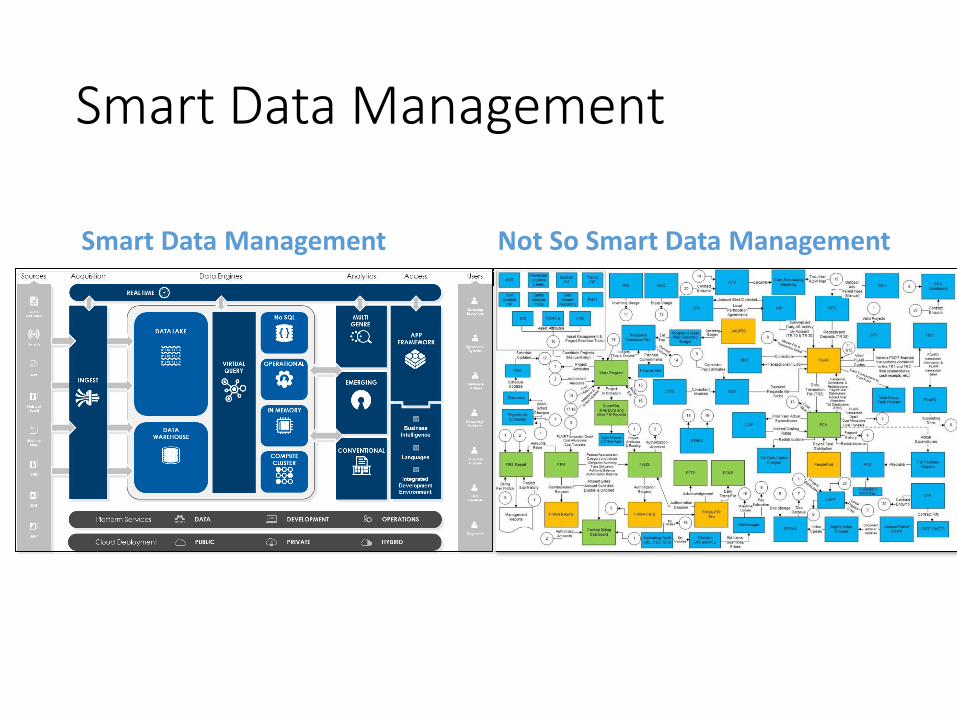
Smart Data Management
Not So Smart Data ManagementSmart Data Management

• Data, as a raw material, is perceived to be of little or no value
• This distorts benefit cost calculations with respect to data retention and management
• Consequently data is discarded
• The opportunity to convert data to information to insight to action is missed
• The misconception of little or no value of data is reinforced
Smart Data Management Challenge
20
The vicious circle
Low perception of the value of
data
Misconception that data is too
expensive to keep
Data is discarded
Opportunity to extract
information from data is lost

Roadmap Align Create Evaluate Deploy
1 2 3 4 5
Further workRecommended 1 week 2-4 weeks 1 week
Smart Data Management Approach
21
• Document use case detail• Data confirmation• Assign Insight Pod team• Assign Data Pod team• Business client role defined
Align
• Scope Document• Project Plan
Deliverable
• Analysis, Models & Code• Insight Report & Findings
Deliverable
• Load & prep data• Develop analytics &
models• Develop early insights• Iteration phases with
business• Finalize insights
Create
• Report & Presentation
Deliverable
• Final recommendations• Document ROI• Deployment plan• Report write up• Executive Presentation
Evaluate
Data Information Insight Action

Benefits summaryAnnual lifecycle benefits Lifecycle cost Benefit cost ratio
Asset and maintenance management $518,357 $5,183,571 0.1
Connected vehicle $670,460,315 $145,547,227 4.6
Connected, involved citizens $86,125,000 $12,964,286 6.6
Integrated electronic payment $430,625,000 $36,332,842 11.9
Smart grid, roadway electrification and electric vehicle $4,383,242,730 $144,597,981 30.3
Smart land use $114,790,926 $14,360,686 8.0
Transportation management $354,309,126 $13,913,643 25.5
Traveler information $86,125,000 $16,314,286 5.3
Urban automation $4,025,301,631 $268,600,049 15.0
Urban delivery and logistics $287,477,315 $15,380,667 18.7
User focused mobility $502,289,815 $55,428,571 9.1
Direct benefit services total $10,941,265,216 $728,623,810 15.0
Intelligent sensor- based infrastructure $34,557,143
Low cost efficient, secure and resilient ICT $59,000,000
Urban analytics $4,380,000
Strategic business models and partnering $2,347,210
Transportation governance $2,347,210
Indirect benefit enabler services $102,631,562
Grand totals $10,941,265,216 $831,255,372 13.2
Planning factors
• Cost benefit
• Legacy investment
• Policy priorities
• Service evolution over time, space and service quality
Evaluating the Effects
22
Thank you for your Time and Attention
• Bob McQueen• Telephone: 407-491-2842
• Email: [email protected]
• Website: www.bobmcqueenandassociates.com
• Latest book:• Big data Analytics for Connected
Vehicles and Smart Cities
• Artech House, published August 31, 2017
23