bibliometric impact assessment with r and the citan...
TRANSCRIPT

Bibliometric Impact Assessment With R
and the CITAN Package
Marek Gagolewskia,b
E-mail: [email protected]
aSystems Research Institute, Polish Academy of Sciences
ul. Newelska 6, 01-447 Warsaw, PolandbFaculty of Mathematics and Information Science, Warsaw University of Technology
pl. Politechniki 1, 00-661 Warsaw, Poland
Abstract
In this paper CITAN, the CITation ANalysis package for R statistical com-puting environment, is introduced. The main aim of the software is to sup-port bibliometricians with a tool for preprocessing and cleaning bibliographicdata retrieved from SciVerse Scopus and for calculating the most popular in-dices of scientific impact.
To show the practical usability of the package, an exemplary assessmentof authors publishing in the fields of scientometrics and webometrics is per-formed.
Keywords: data analysis software, quality control in science, citationanalysis, bibliometrics, Hirsch’s h index, Egghe’s g index, SciVerse Scopus.
This is a revised version of the paper:Gagolewski M., Bibliometric impact assessment with R and the CITAN pack-age, Journal of Informetrics 5(4), 2011, pp. 678–692.
1

1. Introduction
The introduction of the h-index by J.E. Hirsch (2005) started a very in-tensive research trend in the field of scientometrics. Numerous bibliometricimpact indices, like the g-index (Egghe, 2006b), the w-index (Woeginger,2008b), or the R-index (Jin et al., 2007) are particular instances of a wideclass of functions called aggregation operators (cf. Gagolewski and Grze-gorzewski, 2010, 2011a,b). Such operators merge several numerical valuesinto a single, representative one. They may be applied in many areas likeengineering, statistics, economy or social sciences. The theory of aggregationis a rapidly developing mathematical domain, see (Grabisch et al., 2009) forthe recent state of the art monograph.
Operators that aggregate the number of citations received by scientificpublications may support fair assessment of researchers and therefore beconceived as tools for the quality control in science. Moreover, bibliometricsuses them as tools describing the current state of various science-relateddomains of human activity (cf. e.g. Franceschini and Maisano, 2011; Norrisand Oppenheim, 2010).
In practice, we gather citation data from on-line bibliographic databases.Such services often base on information received directly from the publishers.However, as the amount of data is huge, they must use automatic or at leastsemi-automatic processing. This may lead to a number of problems like:incorrectly mapped citations, non-unique author or document representation,etc. Therefore one need to be conscious that such data are uncertain andimprecise in its very nature (cf. Gagolewski and Grzegorzewski, 2011b). It isa great challenge for current computer science and applied mathematics totry to deal with these problems (d’Angelo et al., 2011; Baneyx, 2008).
According to JISC Academic Database Assessment Tool1 and e.g. (Mehoand Rogers, 2008; Meho and Sugimoto, 2009; Vieira and Gomes, 2009; Moed,2010; González-Pereira et al., 2010) Elsevier’s SciVerse Scopus is a gen-eral bibliographic database that covers the largest number of peer-reviewedsources. However, even though it gives citation data for the documents, andis able to export a few thousand records at once to a number of file formats,it is far less often used in bibliometric analyses than the currently most pop-ular Thomson’s Web of Science. Among important reasons for this situationwe find lack of software for processing and cleaning publication information
1http://www.jisc-adat.com/adat
2

adapted for such output.Moreover, regardless of the usage of statistical methods in this type of
research, we do not find any powerful libraries integrated into statistical dataanalysis software. Such a tool could support scientometricians in performingtheir analyses.
The main aim of this paper is therefore to introduce the CITAN pack-age written in a highly programmable, platform-independent language forstatistical computing, R, which tries to overcome the two above-mentionedproblems. The presentation of software features is given in such a way thatit forms a step-by-step usage guide for the practitioners. We show how itcan be used to assess the authors by means of the most interesting indices ofscientific impact.
Unlike existing software, for example Publish or Perish (Harzing and vander Wal, 2008) together with CleanPoP (Baneyx, 2008), the open architectureof CITAN easily allows for adding and testing new functionality. What ismore, it is designed not only to process one author’s record, but also manyrecords at once.
The paper is organized as follows. In Sec. 2 we present some elementaryfacts about Scopus. Section 3 describes the most basic features of the CITAN
package. Also, a brief review of popular bibliometric impact indices is given.In Sec. 4 we show how the software may be used to perform the assess-ment of researchers publishing in scientometrics and webometrics. Section 5summarizes the paper.
2. SciVerse Scopus
Let us first present some basic facts on SciVerse Scopus as this databasewill be used as a source of bibliographic information in our software package2.
The first version of the Elsevier’s product has been launched in Novem-ber, 2004. According to JISC ADAT, on April 24, 2011 Scopus was index-ing 30,017 sources (i.e. scientific journals and conference proceedings withISSNs), of which 18,772 were active titles, from ca. 5000 international pub-lishers (e.g. Elsevier, Springer-Verlag, Kluwer Academic Publishers, John
2If not stated explicitly, information is according tohttp://www.info.sciverse.com/scopus/scopus-in-detail/facts/, last updated June 2010.
3

Wiley & Sons, IEEE). This gave a total of 44,477,066 documents (includ-ing 3.3 mil. conference papers). Generally, about 2 mil. new records areadded each year. Scopus has currently the largest source coverage of thegeneral, peer-reviewed bibliographic databases available (Meho and Rogers,2008; Meho and Sugimoto, 2009; Vieira and Gomes, 2009).
Scopus indexes sources from all geographic regions. It also includes pub-lications whose main language is not English (21% overall). The majorityof the documents published after 1996 have full bibliographies. However, ascitation information is automatically generated, we will see below that it islikely to contain errors. The most cited article has 90,933 citations3.
2.1. ASJC: Classification of sources
Each source is given one or more four-digit ASJC (All Science: JournalClassification) classification codes, which may be used to determine its mainsubject-matter.
A full list of top-level codes is presented in Tab. 1. Many of them aredivided into subcategories. For example, the top-level category 1700 (Com-puter Science) includes the following: 1701 (Miscellaneous), 1702 (ArtificialIntelligence), 1703 (Computational Theory and Mathematics), 1704 (Com-puter Graphics and Computer-Aided Design), 1705 (Computer Networks andCommunications), 1706 (Computer Science Applications), 1707 (ComputerVision and Pattern Recognition), 1708 (Hardware and Architecture), 1709(Human-Computer Interaction), 1710 (Information Systems), 1711 (SignalProcessing), and 1712 (Software).
As we will see further on, the codes may also be used to classify individualpublications.
3Laemmli, U.K. (1970), Cleavage of structural proteins during the assembly of the headof bacteriophage T4, Nature 227(525), 680–685.
4

Table 1: Top-level ASJC codes.
ASJC Description
1000 General1100 Agricultural and Biological Sciences1200 Arts and Humanities1300 Biochemistry, Genetics and Molecular Biology1400 Business, Management and Accounting1500 Chemical Engineering1600 Chemistry1700 Computer Science1800 Decision Sciences1900 Earth and Planetary Sciences2000 Economics, Econometrics and Finance2100 Energy2200 Engineering2300 Environmental Science2400 Immunology and Microbiology2500 Materials Science2600 Mathematics2700 Medicine2800 Neuroscience2900 Nursing3000 Pharmacology, Toxicology and Pharmaceutics3100 Physics and Astronomy3300 Social Sciences3400 Veterinary3500 Dentistry3600 Health Professions
5

2.2. Types of documents
In bibliometric analyses it is often very important to take the types ofdocuments into account. For example, sometimes we want to base our surveysonly on peer-reviewed publications as they — at least theoretically — shouldbe of higher quality.
Here is a list of document types used in Scopus:
• Article (ar) — presents original research or opinion, also a post-conferencepaper; in peer-reviewed journals; usually several pages in length.
• Article-in-Press (ip) — an article available on-line before official publi-cation.
• Conference paper (cp) — a publication presented at a conference orsymposium.
• Editorial (ed) — summarizes several articles or provides editorial news.• Erratum (er) — reports an error of a previously published paper in the
same journal.• Letter (le) — correspondence with the editor.• Note (no) — a short note, discussion or commentary.• Review (re) — significant review of original research; often has extensive
bibliography.• Short survey (sh) — a short review of original research; shorter in length
than a Review.
In next section we introduce the CITAN package. Also, we review themost interesting aggregation operators that may be used to assess the meritof individuals.
3. The CITAN package
3.1. Package description and installation
R (R Development Core Team, 2011) is a very popular, freely availablelanguage and environment for statistical computing and graphics. It imple-ments a large variety of statistical tools, including linear and nonlinear mod-els, time series, classification, clustering, microarray analysis, etc. For moreinformation on the software the reader is encouraged to visit its homepageat http://www.r-project.org/about.html, or refer e.g. to (Crawley, 2007).
The CITAN package (Gagolewski, 2011) is an open source (GNU LGPLv3 license) toolpack for citation analysis. It requires R version 2.10 or higher
6

and a few other packages like RSQLite (James, 2010) for an interface toSQLite (a flat file-based relational database management system), or RGtk2
(Lawrence and Temple Lang, 2010) which allows for creating the graphicaluser interface.
CITAN is available via the CRAN (The Comprehensive R Archive Network)repository, therefore it may be downloaded and installed directly from R, justas any other officially maintained package. During the installation process alldependencies should be automatically resolved. The package has been testedunder all major operating systems including Windows, Linux and MacOS.
R version 2.13.0 (2011-04-13)Copyright (C) 2011 The R Foundation for Statistical ComputingISBN 3-900051-07-0Platform: x86_64-redhat-linux-gnu (64-bit)
> install.packages("CITAN"); # download and install the package
> library("CITAN"); # load the package
Loading required package: RSQLiteLoading required package: RGtk2...
Each element of the package has been documented. We may access theuser’s manual by calling the following command.
> ?CITAN # view the manual
CITAN-package package:CITAN R DocumentationCITation ANalysis toolpack...Author(s):
Marek Gagolewski <[email protected]>
In this paper we present the most important package features so that thereader will be able to conduct his/her own bibliometric surveys. CITAN inversion 2011.05-1 is used for the illustration. However, please note that thepackage is constantly being improved and many new functions are plannedto be added in the future.
Let us first take a look at available impact functions.
7

3.2. Impact functions
Let N0 denote the set of nonnegative integers and N1,2,...0 =
⋃∞n=1 N
n0 the
set of all arbitrary-length sequences of elements in N0. In our context, eachx ∈ N
1,2,...0 represents an author’s citation record.
Definition 1. An impact function (Gagolewski and Grzegorzewski, 2010,2011a,b) in N
1,2,...0 is an aggregation operator J : N
1,2,...0 → R which:
1. is nondecreasing in each variable:
(∀n)(∀x,y ∈ Nn0 ) x ≤ y⇒ J(x) ≤ J(y),
2. is arity-monotonic, i.e. (∀n,m)(∀x ∈ Nn0 )(∀z ∈ N
m0 ) J(x) ≤ J(x, z),
3. is symmetric, i.e. (∀n)(∀x,y ∈ Nn0 ) x � y⇒ J(x) = J(y),
4. fulfills the weak lower boundary condition: infx∈N
1,2,...
0
J(x) = 0,
5. fulfills the weak upper boundary condition: supx∈N
1,2,...
0
J(x) =∞,
where for x = (x1, . . . , xn), y = (y1, . . . , yn), z = (z1, . . . , zm), we write x ≤ y
iff x1 ≤ y1, x2 ≤ y2, . . . and xn ≤ yn, (x, z) = (x1, . . . , xn, z1, . . . , zm) ∈ Nn+m0 ,
and x � y iff there exists a permutation σ such that x = (yσ(1), . . . , yσ(n)).
Such a subclass of aggregation operators (see Grabisch et al., 2009) maybe used to assess an author’s scientific output by means of citation countsreceived by his/her individual publications. A similar axiomatization forbibliometric impact indices was proposed by Woeginger (2008a,b). Moreover,it is worth noting that the proposed class of functions may be used in manyother domains. See (Gagolewski and Grzegorzewski, 2010, 2011a,b) and also(Franceschini and Maisano, 2009) for more exemplary applications.
We will now recall some popular impact functions appearing in the liter-ature. Each of them may be easily calculated with R and the CITAN package.
3.2.1. The h-index and its variants
Traditionally, scientometricians had used a few simple impact functionsto assess a researcher’s output. Among them we have the author’s produc-tivity (length(x) = |x|), the overall citation count (sum(x) =
∑|x|i=1 xi) or the
maximal citation count (max(x) = maxi xi). However, the start of intensivestudies on bibliometric indices combining both the productivity of an authorand the overall quality of the papers (see Glänzel, 2006) is due to J.E. Hirsch(2005), who proposed his so-called h-index. The introduction of the indexhad a great impact on the field; one of the researchers even divides the historyof the subject into a pre-Hirsch and a post-Hirsch period (Prathap, 2010).
8

Definition 2. The h-index is an impact function index.h such that for x ∈Nn0 we have
index.h(x) = max{
i = 0, 1, . . . , n : x(n−i+1) ≥ i}
, (1)
where x(i) denotes the ith order statistic, that is the ith smallest value of x.Moreover, for the simplicity of notation we assume x(n+1) = x(n).
Interestingly, a similar object has appeared earlier in the problem ofBonferroni-type multiple statistical significance testing, see e.g. (Benjaminiand Hochberg, 1995).
Many simple modifications of the index have been proposed. However,some of them may be expressed as the h-index of a properly transformedinput sequence. For example, the hα-index (Kosmulski, 2006) for α ≥ 1 isdefined as
max{i = 0, 1, . . . , n : x(n−i+1) ≥ iα} = index.h(x1/α)
or the hβ-index (van Eck and Waltman, 2008; Wu, 2010), β > 0, is equal to
max{i = 0, 1, . . . , n : x(n−i+1) ≥ βi} = index.h(x/β),
where the vector exponentiation and division are understood element-wisehere. Consequently, there is often no need to construct separate proceduresto calculate such functions.
The computational method for determining the h-index works in O(n)time on unsorted data (that is the number of required arithmetic oper-ations is proportional to a linear function of the input sequence length)and is due to Woeginger (2010). The procedure bases on the “median-of-medians” selection algorithm (Blum et al., 1973, see also Beliakov, 2011).Moreover, the O(logn)-time algorithm for pre-sorted data has been proposedin (Gagolewski and Grzegorzewski, 2009).
We may expect that the computational speedup gained by the usage ofthe latter procedure is insignificant in the case of small-sized samples. How-ever, our package may also be used for meso- and macro-level bibliometricstudies (e.g. assessing scientific institutes or whole countries), where such aperformance improvement may be noticeable.
9

3.2.2. The g-index
Another popular impact function is the g-index proposed by L. Egghe(2006a,b).
Definition 3. The g-index is an impact function index.g such that for x ∈Nn0 we have
index.g(x) = max
{
i = 0, 1, . . . , n :i∑
k=1
x(n−k+1) ≥ i2}
. (2)
It is worth noting that this aggregation operator may also be expressedas the h-index of a function of the input vector. Nevertheless, the trans-formation is computationally far more complex here. We have index.g(x) =index.h(
√Σx), where Σx = (x(n), x(n) + x(n−1), . . . , x(n) + x(n−1) + · · ·+ x(1)).
For modifications of the g-index see e.g. (van Eck and Waltman, 2008;Guns and Rousseau, 2009; Alonso et al., 2010). An efficient, linear-timealgorithm for computing this impact function was considered in (Woeginger,2010).
3.2.3. The rp-index
In (Gagolewski and Grzegorzewski, 2009) two interesting generalizationsof the h-index were developed. The presentation of the CITAN package isa good occasion to empirically verify their potential practical usability.
Let y ∈ Nn0 and z ∈ N
m0 . From now on, we write y E z iff n ≤ m and
y(n) ≤ z(m), y(n−1) ≤ z(m−1), . . . , and y(1) ≤ z(m−n+1). We see that E is
a partial ordering of vectors in N1,2,...0 . Moreover, let ⌈·⌉ denote the ceiling
function, i.e. the smallest integer not less than its argument.The rp-index may be expressed as follows.
Definition 4. The rp-index for p ≥ 1 is an impact function
index.rp(x, p) := sup{r > 0 : sp,r E x}, (3)
where x ∈ Nn0 and sp,r ∈ N
⌈r⌉0 , r > 0, denotes a sequence
sp,r =
(
p√rp − 0p, p
√rp − 1p, . . . , p
√
rp − ⌈r − 1⌉p)
if p <∞,(r, r, . . . , r) if p =∞.
(4)
It may be shown that the r∞-index is equivalent to the h-index and ther1-index is equal to the w-index proposed by Woeginger (2008b).
10

3.2.4. The lp-index
The rp-index may be extended as follows.
Definition 5. The lp-index, p ≥ 1, is a function that maps each x ∈ N1,2,...0
to a pair (a, b), a, b ≥ 0, such that
index.lp(x, p) = arg sup(a,b){ab : ep,a,b E x}, (5)
where x ∈ Nn0 and ep,a,b ∈ N
⌈a⌉0 , a ≥ 1, b > 0, denotes a sequence
ep,a,b =
(
p
√
bp − ( ba0)p, p√
bp − ( ba1)p, . . . , p
√
bp − ( ba⌈a− 1⌉)p
)
if p <∞,(b, b, . . . , b) if p =∞.
(6)
We see that the lp-index is a function in [0,∞)2. Hence its usage inthe impact assessment problem requires its projection to R. It may easilybe proved that e.g. l(g)p :=
√ab, where index.lp(x, p) = (a, b), is an impact
function in N1,2,...0 .
Interestingly, if index.lp(x,∞) = (a, b), then the value ab is equivalent tothe MAXPROD-index proposed by Kosmulski (2007).
In (Gagolewski and Grzegorzewski, 2009) we have asked whether thereexists an algorithm that may compute the value of the lp-index for p <∞ faster than in O(n3) time. Indeed, in an unpublished research report(Gagolewski et al., 2009), a procedure that runs in O(n) time on ordereddata was developed. It bases on the Graham’s method for determining theconvex hull of a planar set of points (Graham, 1972). Its implementation isof course included in our package.
3.3. Database model
For the purpose of storing bibliometric data for analysis we have designedthe following relational database model (for alternative approaches see e.g. Yuet al., 2008; Mallig, 2010). It has been created so as to conform with theinformation generated by Scopus. However, its level of abstraction is quitehigh and thus support for other databases may easily be added in the future.
All analyzed data are stored in a so-called local bibliometric storage
(LBS). It is currently maintained by the SQLite relational database man-agement system (see http://www.sqlite.org). This light-weight RDBMS isautomatically installed with the package and requires no configuration.
11

Fig. 1 presents an entity-relationship diagram for the database model.The reader interested in an SQL code used to create an LBS is referred tothe manual page for the lbsCreate() function.
Among the most important objects represented in an LBS are: sources
(e.g. journals, conference proceedings; identified by ISSNs), documents
(e.g. articles, reviews; identified by Scopus eids extracted from URLs) andauthors (identified by names).
Another significant feature of an LBS is the possibility of forming groupsof documents. Such — non necessarily disjoint — collections are called sur-
veys. As a consequence, there is no need to create separate LB storages fordifferent bibliometric analyses as one document may belong to many groups.
Let us then create an LBS which will be used in the next section. First,we connect to an SQLite database, stored in the local file named Scopus-biblio.db.
> conn <- lbsConnect("Scopus-biblio.db"); # connect to the database
From now on, the conn object represents the established database connectionand will be used to communicate with the RDBMS.
To create the above-described table scheme we call the following function.
> lbsCreate(conn); # create an LBS
Creating table ’Biblio_Categories’... DONE.Creating table ’Biblio_Countries’... DONE.Creating table ’Biblio_Sources’... DONE....
The process has been completed successfully. We are ready to performan exemplary analysis of bibliometric data. We will also show how CITAN
may be used to import and preprocess data retrieved from Scopus.
12

Biblio_Categories
IdCategory INTEGER
IdCategoryGroup INTEGER
Description VARCHAR(63)
Biblio_Countries
IdCountry INTEGER
Name VARCHAR(63)
Biblio_Sources
IdSource INTEGER
Title VARCHAR(255)
ISSN_Print CHAR(8)
ISSN_E CHAR(8)
IsActive BOOLEAN
IsOpenAccess BOOLEAN
Type CHAR(2)
IdCountry INTEGER
Impact REAL
1
n
Biblio_SourcesCategories
IdCategory INTEGER
IdSource INTEGER
1
n
1
n
1
n
Biblio_Surveys
IdSurvey INTEGER
Description VARCHAR(63)
FileName VARCHAR(63)
Timestamp DATETIME
Biblio_Languages
IdLanguage INTEGER
Name VARCHAR(63)
Biblio_DocumentsSurveys
IdSurvey INTEGER
IdDocument INTEGER
Biblio_AuthorsDocuments
IdDocument INTEGER
IdAuthor INTEGER
Biblio_Documents
IdDocument INTEGER
IdSource INTEGER
IdLanguage INTEGER
UniqueId VARCHAR(31)
Title VARCHAR(255)
BibEntry VARCHAR(511)
Year INTEGER
Pages INTEGER
Citations INTEGER
Type CHAR(2)
Biblio_Authors
IdAuthor INTEGER
Name VARCHAR(63)
1
n
1
n
1
n
1
n
1n
1
n
Figure 1: Local bibliometric storage model as created by the lbsCreate() function.
13

4. Exemplary analysis
Our sample consists of publications in scientometrics and webometrics.It is worth noting that we do not analyze the whole output of each scientist.Our main aim is therefore to indicate the authors of the greatest merit withinthe disciplines of concern. Such an investigation could be performed e.g. if wewere to award a group of researchers a prize for their scientific achievements.
We used the following queries to extract publication data from Scopus:
1. TITLE(index quantify individual scientific research output) — 3 documentsincluding the paper (Hirsch, 2005),
2. 795 documents citing the paper (Hirsch, 2005),
3. TITLE-ABS-KEY(bibliometric*) OR TITLE-ABS-KEY(scientometric*) ORTITLE-ABS-KEY(webometric*) — 6870 documents; a keyword-basedquery,
4. SRCTITLE(Scientometrics) OR SRCTITLE(Informetrics) OR SRCTITLE(Cybermetrics) OR SRCTITLE("Annual Review of Information Science andTechnology") OR SRCTITLE("Journal of the American Society for Infor-mation Science") — 5969 documents; a source-based query includingthe documents appearing in leading journals in the field like: Sciento-metrics, Journal of Informetrics, Journal of the American Society forInformation Science (and Technology).
The data were gathered on March 27, 2011, 13:33–14:05. We have ac-cessed Scopus via the Main Library of Warsaw University of Technology(Biblioteka Główna Politechniki Warszawskiej).
Due to the fact that Scopus limits the number of exportable items to2000 records, the queries had to be split into subgroups using the PUBYEARdirective. We used the following settings: Export format = "Comma separatedfile, .csv (e.g. Excel)" and Output = "Complete format". In result we got 10CSV files of overall size ca. 77 MB.
Please note that although the above queries do not return disjoint bibli-ographic data, we will see that CITAN easily copes with such situation.
4.1. Importing data retrieved from Scopus
Let us now import the information on all the sources covered by Scopusand their ASJC codes. The whole list is available in the CITAN package (thisdata are in public domain — information from Elsevier).
> Scopus_ImportSources(conn); # import Scopus source coverage information
14

Importing Scopus ASJC codes... OK, 334 records added.Importing country list... OK, 112 records added.Importing Scopus source list... OK, 29913 of 30017 records added;
53762 ASJC codes processed.
A few of the sources (mainly conference proceedings) have not been addeddue to incorrect or lacking ISSNs.
We are now ready to import the CSV files to our LBS. As Scopus does notfully conform to the CSV standard, in case of a few records we will get someparse errors (each of them is indicated by the Scopus_ReadCSV() function).However, they may be easily corrected using a plain text editor, e.g. Notepad.Most of them concern improperly escaped single-quote characters.
> data <- Scopus_ReadCSV("Hirsch.csv"); # read the first CSV file (Query #1)> lbsImportDocuments(conn, data, "ExampleSurvey") # import documents into LBS
Importing documents and their authors...OK, 3 of 3 records added to ExampleSurvey/Hirsch.csv.
The first CSV file has been imported. Now, let us read the results returnedby Query #2.
> data <- Scopus_ReadCSV("Hirsch_CITE.csv");> lbsImportDocuments(conn, data, "ExampleSurvey")
Importing documents and their authors...OK, 794 of 795 records added to ExampleSurvey/Hirsch_CITE.csv.
We see that one of the documents was not added because it was provided bythe first file. However, an update process was triggered here. Such a behavioris especially useful when the data are downloaded in larger time spans andthere is a possibility that the citation information has been changed. Let usproceed with the other CSV files.
> ... # read and import other CSV files
OK, 1933 of 1941 records added to ExampleSurvey/BibSciWeb_2002-2006.csv.OK, 1353 of 1452 records added to ExampleSurvey/BibSciWeb_2007n_2011.csv.OK, 1388 of 1574 records added to ExampleSurvey/BibSciWeb_2009n.csv.OK, 1903 of 1903 records added to ExampleSurvey/BibSciWeb_BEF2002.csv.OK, 1492 of 1804 records added to ExampleSurvey/5journals_1998-2005.csv.OK, 291 of 353 records added to ExampleSurvey/5journals_2006.csv.OK, 1355 of 1925 records added to ExampleSurvey/5journals_AFT2006.csv.OK, 1555 of 1887 records added to ExampleSurvey/5journals_BEF1998.csv.
The whole import process takes about 21 minutes.
15
4.2. Cleaning duplicate entries
As it was mentioned above, CITAN uses Scopus document identifiers (eids)extracted from the Link field in the CSV files and author names to identifydocuments and authors, respectively. Unfortunately, the data exported fromScopus have sometimes ambiguous representation. For example, two ver-sions of the same document may exist (e.g. an additional “in-press” copy)or Marie Salome Skłodowska-Curie may be stored in the LBS as SkłodowskaM., Skłodowska-Curie M.S., or even Skłodowska M.S.C..
In order to detect such problems, we have implemented two functionswhich indicate potential groups of objects to be corrected. The results arepresented in dialog boxes where we can easily choose the desired action onthe selected records. Afterwards, we may apply the changes to the LBSusing additional helper methods. Note that CITAN implements experimentalversions of the disambiguation search algorithms; they currently trigger toomany “nuisance alarms” and cause the process of data cleaning to be time-consuming. Their improvement is left to the further research. However, aswe shall see on the screen-shots below, the results are promising.
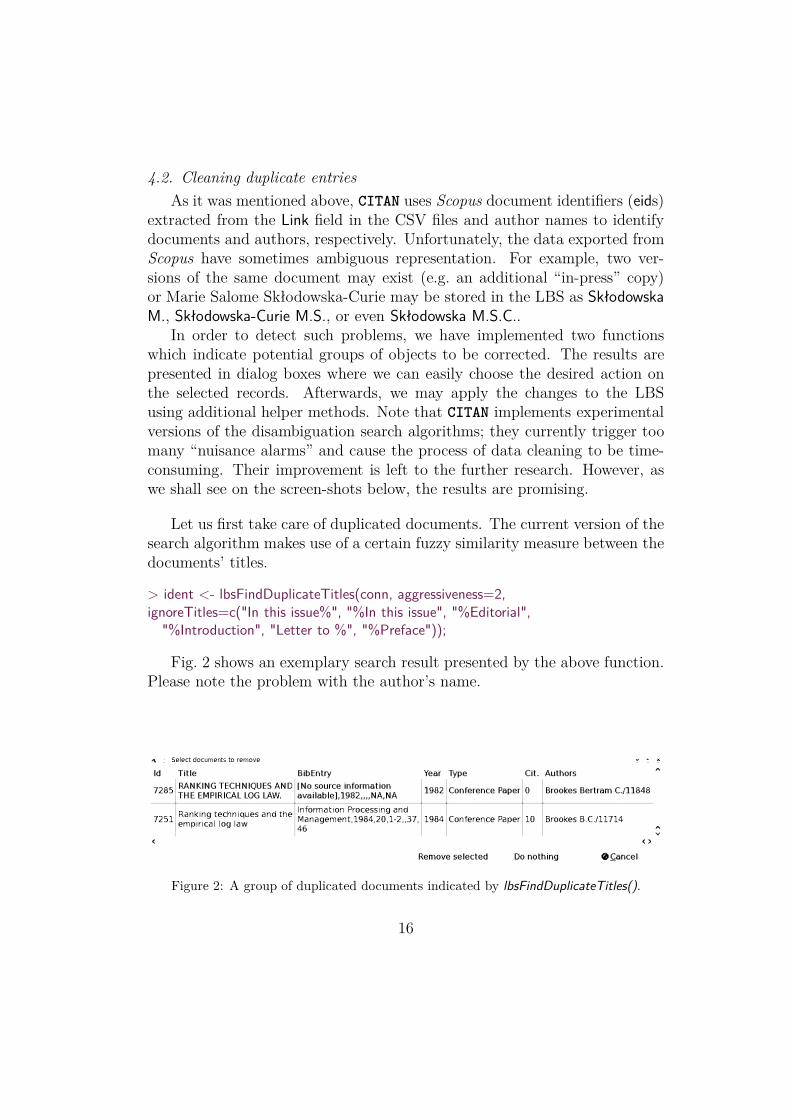
Let us first take care of duplicated documents. The current version of thesearch algorithm makes use of a certain fuzzy similarity measure between thedocuments’ titles.
> ident <- lbsFindDuplicateTitles(conn, aggressiveness=2,ignoreTitles=c("In this issue%", "%In this issue", "%Editorial",
"%Introduction", "Letter to %", "%Preface"));
Fig. 2 shows an exemplary search result presented by the above function.Please note the problem with the author’s name.
Figure 2: A group of duplicated documents indicated by lbsFindDuplicateTitles().
16

We have marked 43 documents for removal. The following function ap-plies appropriate changes to the LBS.
> lbsDeleteDocuments(conn, ident); dbCommit(conn);
We call a similar procedure for the authors.
> ident <- lbsFindDuplicateAuthors(conn, aggressiveness=2)
We have chosen 56 author groups to be merged. Two exemplary resultsare depicted in Fig. 3. To apply the changes, we then call:
> lbsMergeAuthors(conn, ident); dbCommit(conn);
Figure 3: Two groups of duplicated authors indicated by lbsFindDuplicateAuthors().
17

4.3. Descriptive statistics
The lbsDescriptiveStats() function performs basic description of the sam-ple. The graphical output is presented in Figs. 4–8.
> lbsDescriptiveStats(conn, surveyDescription="ExampleSurvey");
Number of sources in the database: 29913.Number of documents in the database: 12024.Number of authors in the database: 16282.
Data set restrictions:Survey: ExampleSurvey.Document types: <ALL>.
...
Fig. 4 presents a bar plot of document types in the LBS. To analyzeauthors’ impact we will only use the following types: ar (Article; 8353 docu-ments), re (Review; 1110), no (Note; 194), sh (Short Survey; 90). It is highlypossible that they indicate high-quality peer-reviewed publications (9747 doc-uments and 13953 authors overall).
ar re ed cp le no sh ip er bk
020
0040
0060
0080
00
Document types
Figure 4: Descriptive statistics: Document types.
Assuming that all the documents published in the same journal or con-ference proceedings have a coherent subject-matter, we may try to classifythem using the ASJC codes of their sources. Fig. 5 presents a pie chart ofthe upper-level categories. We see that the majority of the documents in our
18

sample are in computer science, the social sciences, medicine and engineer-ing. There are also some publications in mathematics and decision supportsystems.
Mathematics
Social Sci.
Decision Sci.
Medicine
Other
Engineering
Biochem., Genetics, Molec. Biol.
Computer Sci.
Categories of documents
Figure 5: Descriptive statistics: ASJC document categories.
A box-and-whisker plot of page counts per document types is presentedin Fig. 6.
ar bk cp ed er ip le no re sh
12
510
2050
200
500
Number of pages per document type
Figure 6: Descriptive statistics: Number of pages per document type.
19

Furthermore, Fig. 7 presents a box plot of citation counts per documenttype.
ar bk cp ed le no re sh
15
1050
500
Citations of cited documents per type
Figure 7: Descriptive statistics: Number of citations per document type.
Let us here verify a circulating fact (cf. Glänzel, 2008) that review papersare more often cited than ordinary articles.
First we extract citation data for all the documents of type Article.
> id_ar <- lbsSearchDocuments(conn, surveyDescription="ExampleSurvey",documentTypes="Article"); # search for appropriate documents
> info_ar <- lbsGetInfoDocuments(conn, id_ar); # get document information> cit_ar <- sapply(info_ar, function(x) x$Citations); # extract citation counts> summary(cit_ar); # descriptive statistics
Min. 1st Qu. Median Mean 3rd Qu. Max.0.000 1.000 3.000 8.716 9.000 836.000
The same should be done for Reviews.
> id_re <- lbsSearchDocuments(conn, surveyDescription="ExampleSurvey",documentTypes="Review");
> info_re <- lbsGetInfoDocuments(conn, id_re);> cit_re <- sapply(info_re, function(x) x$Citations);> summary(cit_re);
20
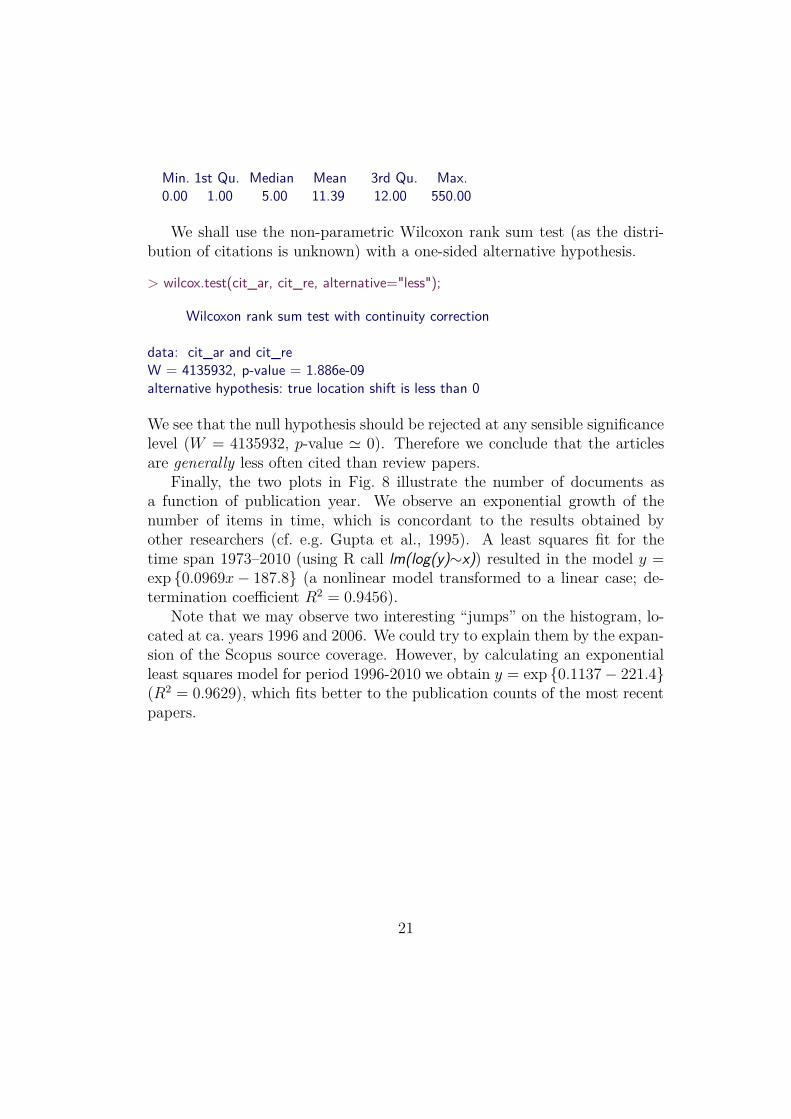
Min. 1st Qu. Median Mean 3rd Qu. Max.0.00 1.00 5.00 11.39 12.00 550.00
We shall use the non-parametric Wilcoxon rank sum test (as the distri-bution of citations is unknown) with a one-sided alternative hypothesis.
> wilcox.test(cit_ar, cit_re, alternative="less");
Wilcoxon rank sum test with continuity correction
data: cit_ar and cit_reW = 4135932, p-value = 1.886e-09alternative hypothesis: true location shift is less than 0
We see that the null hypothesis should be rejected at any sensible significancelevel (W = 4135932, p-value ≃ 0). Therefore we conclude that the articlesare generally less often cited than review papers.
Finally, the two plots in Fig. 8 illustrate the number of documents asa function of publication year. We observe an exponential growth of thenumber of items in time, which is concordant to the results obtained byother researchers (cf. e.g. Gupta et al., 1995). A least squares fit for thetime span 1973–2010 (using R call lm(log(y)∼x)) resulted in the model y =exp {0.0969x− 187.8} (a nonlinear model transformed to a linear case; de-termination coefficient R2 = 0.9456).
Note that we may observe two interesting “jumps” on the histogram, lo-cated at ca. years 1996 and 2006. We could try to explain them by the expan-sion of the Scopus source coverage. However, by calculating an exponentialleast squares model for period 1996-2010 we obtain y = exp {0.1137− 221.4}(R2 = 0.9629), which fits better to the publication counts of the most recentpapers.
21

1971 1975 1979 1983 1987 1991 1995 1999 2003 2007 2011
020
040
060
080
010
00
Publication years
1980 1990 2000 2010
020
040
060
080
010
00
Bibliometrics 1973−2010
Year
Doc
umen
ts
exp(0.0969x−187.8)exp(0.1137x−221.4)
Figure 8: Descriptive statistics: Number of documents as a function of publica-tion year (above). Below exponential least squares fits for period 1973–2010 (y =exp {0.0969x− 187.8}) and for period 1996–2010 (y = exp {0.1137− 221.4}).
22

4.4. Assessing the impact of researchers
We are ready to perform the impact assessment of the authors in our LBS.As we have already mentioned, we restrict ourselves only to 4 document typeswhich possibly indicate peer-reviewed publications.
First we generate the sequences x1,x2, . . . ,xm, where xi is a citationrecord of the ith author.
> citseq <- lbsGetCitations(conn, surveyDescription="DR",documentTypes=c("Article", "Note", "Review", "Short Survey"));
> length(citseq); # calculate m, i.e. the number of authors
[1] 13953
The whole process takes about 3.5 minutes. The citseq variable is an ob-ject of class list consisting of numeric vectors. We see that not all of the16282 authors in the survey were taken into account. This is because theirpublications did not match the documentTypes search criterion.
Let us determine the values of some impact functions for all the authors.We will use the following aggregation operators:
(a) n (productivity),(b) max (maximal citation count),(c) sum (overall citation count),(d) h (the h-index),(e) g (the g-index),(f) r1 (an rp-index; p = 1; equivalent to the w-index),
(g) l(g)1 (an lp-index projected to R; p = 1),
(h) l(g)∞ (an lp-index projected to R; p =∞),(j) Ge1 = |{xj : xj ≥ 1}| (a quasi-S-statistic, see Gagolewski and Grze-
gorzewski, 2011a),(k) Ge5 = |{xj : xj ≥ 5}| (a quasi-S-statistic),(l) SLp1 =
∑
j ln (xj + 1) (a quasi-L-statistic).
23

Function call:
> res <- lbsAssess(citseq, # a list of citation sequencesbestRanks=19, # limit results to top 19 valuesf=list(length, max, sum, # (a-c)
function(x) index.h(x), # (d)function(x) index.g(x), # (e)function(x) index.rp(x,1), # (f)function(x) sqrt(prod(index.lp(x,1))), # (g)function(x) sqrt(prod(index.lp(x,Inf))), # (h)function(x) length(x[x>=1]), # (j)function(x) length(x[x>=5]), # (k)function(x) sum(log(x+1))), # (l)
captions=c("n", "max", "sum", "h", "g", "rp1","l1", "lInf", "Ge1", "Ge5", "SLp1")
);
The calculation bases only on data stored in RAM, therefore it completesvery quickly (in less than 10 secs.). We limited the output to top 19 resultsfor each of the impact functions (this behavior is controlled via the bestRanksparameter). As a result, 42 authors’ records were printed out (see Tab. 2).
The 5 best values for each impact function are typeset in bold. We observethat 5 of the authors are distinguished in such a manner by means of at least6 criteria.
A few authors with small productivity (no more than 3 publications)
were included in the ranking due to high values of the max, l(g)1 , or l(g)∞ func-
tions. Interestingly, some of them appeared here because they co-authoreda intensively-cited review paper (Gambhir S.S., Czernin J., Schwimmer J.,Silverman D.H.S., Coleman R.E., Phelps M.E., A tabulated summary of theFDG PET literature, Journal of Nuclear Medicine 42(5), 1–93, 2001 — 550citations). Such a sensitivity for individual, highly-cited documents may beviewed as a drawback of these impact functions. On the other hand, onlythese functions were able to indicate the high impact of J.E. Hirsch on thefield of scientometrics.
24

Table 2: Results of authors’ assessment.
Autor n max sum h g r1 l(g)1 l
(g)∞ Ge1 Ge5 SLp1
Bar-Ilan J. 36 64 624 14 24 27 29.7 16.2 34 24 83.7Bordons M. 35 79 543 12 23 22 25.1 14.7 31 21 71.1Bornmann L. 42 108 597 12 24 23 24.5 15.5 35 21 76.0Braun T. 68 137 1223 19 32 36 37.2 19.9 65 51 158.5Chen H. 45 133 739 14 26 25 30.0 18.2 36 25 88.9Coleman R.E. 2 550 569 2 2 2 23.9 23.5 2 2 9.3Cronin B. 28 94 568 12 23 22 25.6 16.1 26 22 67.2Czernin J. 1 550 550 1 1 1 23.5 23.5 1 1 6.3Daniel H.-D. 34 108 575 12 23 21 24.5 15.5 29 20 68.6Egghe L. 92 195 1010 16 29 29 29.0 16.2 74 45 149.2Gambhir S.S. 1 550 550 1 1 1 23.5 23.5 1 1 6.3Garfield E. 24 327 914 10 24 18 29.0 21.7 22 15 58.0Glanzel W. 105 137 2104 25 40 48 52.6 27.8 95 78 254.7
Hirsch J.E. 3 791 903 2 3 3 30.3 28.1 3 2 12.5Jansen B.J. 15 352 796 10 15 14 27.9 19.4 14 12 43.7King D.A. 1 283 283 1 1 1 16.8 16.8 1 1 5.6Kostoff R.N. 52 147 840 16 27 32 32.0 17.3 47 38 115.8Lewison G. 39 28 423 14 18 27 27.0 14.4 35 27 80.6Leydesdorff L. 99 77 1382 21 32 42 42.2 22.3 89 69 211.9
Luwel M. 17 49 284 12 16 16 20.7 12.0 16 16 44.6McCain K.W. 18 255 497 11 18 15 19.7 16.0 15 12 41.8Meyer M. 23 62 435 12 20 21 24.2 14.7 21 19 57.2Moed H.F. 49 133 1201 19 33 37 37.8 21.2 46 40 132.7Moya-Anegon F. 38 40 262 10 14 17 17.9 10.5 32 16 59.0Newman M.E.J. 1 836 836 1 1 1 28.9 28.9 1 1 6.7Phelps M.E. 1 550 550 1 1 1 23.5 23.5 1 1 6.3Rousseau R. 91 113 1193 19 31 34 34.6 19.8 80 49 171.4
Saracevic T. 11 352 825 10 11 11 28.6 18.8 11 11 42.1Schubert A. 89 137 1563 22 36 42 42.5 22.5 79 62 197.8
Schwimmer J. 1 550 550 1 1 1 23.5 23.5 1 1 6.3Seglen P.O. 9 636 836 6 9 9 27.1 25.2 9 9 28.7Silverman D.H.S. 1 550 550 1 1 1 23.5 23.5 1 1 6.3Spink A. 25 352 1076 18 25 24 36.2 20.3 24 24 81.4Thelwall M. 86 96 1249 21 32 37 39.9 22.0 75 55 177.1
van Leeuwen T.N. 36 133 660 14 25 25 28.0 16.2 31 23 79.4van Raan A.F.J. 66 148 1512 23 37 42 43.9 23.5 59 49 164.8Vinkler P. 32 61 399 12 19 24 24.0 13.0 29 21 67.2Wenneras C. 1 222 222 1 1 1 14.9 14.9 1 1 5.4White H.D. 17 255 628 10 17 15 25.3 16.4 15 13 45.9Wilson C.S. 32 45 287 9 15 17 18.7 11.0 29 17 57.7Wold A. 1 222 222 1 1 1 14.9 14.9 1 1 5.4Wolfram D. 19 352 479 5 19 9 20.2 18.8 14 6 28.3
25

5. Conclusions
ISO 9000 defines quality as a degree to which a set of inherent charac-teristics fulfills some well-precised requirements. To maintain a high level ofoutput in any domain, specific quality control mechanisms have to be ap-plied. In particular, the very complex case of the assessment of scientificachievements often involves a proper aggregation of the number of citationsreceived by an author’s publications.
As we currently do not have any other sensible way to objectively deter-mine the significance of individual papers, we expect the citation analysis tobe still receiving much interest in the future.
It this paper we presented a package for bibliometric impact assessmentthat is integrated into a statistical computing software. We discussed howthe practitioners may use it in their own surveys. An important feature ofCITAN is the support for processing and cleaning data retrieved from Scopus,a database with currently the broadest peer-reviewed source coverage avail-able. Additionally, it may be used with the R environment in more complexanalyses in the field of scientometrics.
Future work on the package will definitely concern the creation of a moresophisticated graphical user interface, which may allow the users with verylittle knowledge of R to perform the most elementary operations on the LBS,the improvement of the documents and authors disambiguation algorithms,and the support for other bibliometric databases.
Acknowledgments. The author would like to thank his PhD adviser P. Grze-gorzewski and his student M. Debski for stimulating discussion. Also, theauthor would like to express his gratitude to anonymous referees for theirsuggestions, and K. Fokow for proof-reading of the manuscript.
References
Alonso, S., Cabrerizo, F. J., Herrera-Viedma, E., Herrera, F., 2010. hg-index:A new index to characterize the scientific output of researchers based onthe h- and g-indices. Scientometrics 82 (2), 391–400.
d’Angelo, C. A., Giuffrida, C., Abramo, G., 2011. A heuristic approach to au-thor name disambiguation in bibliometric databases for large-scale researchassessments. Journal of the American Society for Information Science andTechnology 62 (2), 257–269.
26

Baneyx, A., 2008. Publish or Perish as citation metrics used to analyze sci-entific output in the humanities: International case studies in economics,geography, social sciences, philosophy, and history. Archivum Immunolo-giae et Therapia Experimentalis 56, 363–371.
Beliakov, G., 2011. Fast Computation of Trimmed Means. Journal of Statis-tical Software, Code Snippets 39 (2), 1–6.
Benjamini, Y., Hochberg, Y., 1995. Controlling False Discovery Rate:A practical and powerful approach to multiple testing. Journal of the RoyalStatistical Society. Series B 57 (1), 289–300.
Blum, M., Floyd, R. W., Pratt, V., Rives, R. L., Tarjan, R. E., 1973. Timebounds for selection. Journal of Computer and System Sciences 7 (4), 448–460.
Crawley, M. J., 2007. The R book. Wiley.
Egghe, L., 2006a. An improvement of the h-index: the g-index. ISSI Newslet-ter 2 (1), 8–9.
Egghe, L., 2006b. Theory and practise of the g-index. Scientometrics 69 (1),131–152.
Franceschini, F., Maisano, D. A., 2009. The Hirsch index in manufacturingand quality engineering. Quality and Reliability Engineering International25, 987–995.
Franceschini, F., Maisano, D. A., 2011. Structured evaluation of the scientificoutput of academic research groups by recent h-based indicators. Journalof Informetrics 5, 64–74.
Gagolewski, M., 2011. CITAN: CITation ANalysis toolpack. R package version2011.05-1. http://www.ibspan.waw.pl/~gagolews/CITAN/
Gagolewski, M., Debski, M., Nowakiewicz, M., 2009. Efficient algorithms forcomputing “geometric” scientific impact indices. Tech. Rep. RB/1/2009,SRI PAS, Warsaw, Poland.
Gagolewski, M., Grzegorzewski, P., 2009. A geometric approach to the con-struction of scientific impact indices. Scientometrics 81 (3), 617–634.
27

Gagolewski, M., Grzegorzewski, P., 2010. Arity-monotonic extended aggrega-tion operators. In: Hüllermeier, E., Kruse, R., Hoffmann, F. (Eds.), Infor-mation Processing and Management of Uncertainty in Knowledge-BasedSystems. Springer-Verlag, pp. 693–702.
Gagolewski, M., Grzegorzewski, P., 2011a. Axiomatic characterizations of(quasi-) L-statistics and S-statistics and the Producer Assessment Prob-lem. In: Proc. Eusflat-LFA 2011. In press.
Gagolewski, M., Grzegorzewski, P., 2011b. Possibilistic analysis of arity-monotonic aggregation operators and its relation to bibliometric impactassessment of individuals. International Journal of Approximate Reason-ing. In press. doi:10.1016/j.ijar.2011.01.010
Glänzel, W., 2006. On the opportunities and limitations of the H-index.Science Focus 1 (1), 10–11.
Glänzel, W., 2008. Seven myths in bibliometrics. About facts and fictionin quantitative science studies. COLLNET Journal of Scientometrics andInformation Management 2 (1), 9–17.
González-Pereira, B., Guerrero-Bote, V.P., Moya-Anegon, F., 2010. A newapproach to the metric of journals scientific prestige: The SJR indicator.Journal of Informetrics 4 (3), 379–391.
Grabisch, M., Pap, E., Marichal, J.-L., Mesiar, R., 2009. Aggregation func-tions. Cambridge.
Graham, R. L., 1972. An efficient algorithm for determining the convex hullof a finite planar set. Information Processing Letters 1, 132–133.
Guns, R., Rousseau, R., 2009. Real and rational variants of the h-index andthe g-index. Journal of Informetrics 3 (1), 64–71.
Gupta, B. M., Sharma, L., Karisiddappa, C. R., 1995. Modelling the growthof papers in a scientific speciality. Scientometrics 33 (2), 187–201.
Harzing, A.W.K., van der Wal, R., 2008. Google Scholar as a new sourcefor citation analysis? Ethics in Science and Environmental Politics 8(1),62–71.
28

Hirsch, J. E., 2005. An index to quantify individual’s scientific research out-put. Proceedings of the National Academy of Sciences 102 (46), 16569–16572.
James, D. A., 2010. RSQLite: SQLite interface for R. R package version 0.9-4.http://CRAN.R-project.org/package=RSQLite
Jin, B., Liang, L., Rousseau, R., Egghe, L., 2007. The R- and AR-indices:Complementing the h-index. Chinese Science Bulletin 52 (6), 855–863.
Kosmulski, M., 2006. A new Hirsch-type index saves time and works equallywell as the original h-index. ISSI Newsletter 2 (3), 4–6.
Kosmulski, M., 2007. MAXPROD — A new index for assessment of thescientific output of an individual, and a comparison with the h-index. Cy-bermetrics 11 (1).
Lawrence, M., Temple Lang, D., 2010. RGtk2: A graphical user interfacetoolkit for R. Journal of Statistical Software 37 (8), 1–52.
Mallig, N., 2010. A relational database for bibliometric analysis. Journal ofInformetrics 4 (4), 564–580.
Meho, L. I., Rogers, Y., 2008. Citation counting, citation ranking, and h-index of human-computer interaction researchers: A comparison betweenScopus and Web of Science. Journal of the American Society for Informa-tion Science and Technology 59 (11), 1711–1726.
Meho, L. I., Sugimoto, C. R., 2009. Assessing the scholarly impact of in-formation studies: A tale of two citation databases — Scopus and Webof Science. Journal of the American Society for Information Science andTechnology 60 (12), 2499–2508.
Moed, H.F., 2010. Measuring contextual citation impact of scientific journals.Journal of Informetrics 4 (3), 265–277.
Norris, M., Oppenheim, C., 2010. Peer review and the h-index: Two studies.Journal of Informetrics 4, 221–232.
Prathap, G., 2010. Is there a place for a mock h-index? Scientometrics 84,153–165.
29

R Development Core Team, 2011. R: A language and environment for statis-tical computing. R Foundation for Statistical Computing, Vienna, Austria.http://www.R-project.org
van Eck, N. J., Waltman, L., 2008. Generalizing the h- and g-indices. Journalof Informetrics 2 (4), 263–271.
Vieira, E. S., Gomes, J. A., 2009. A comparison of Scopus and Web of Sciencefor a typical university. Scientometrics 81 (2), 587–600.
Woeginger, G. J., 2008a. An axiomatic analysis of Egghe’s g-index. Journalof Informetrics 2 (4), 364–368.
Woeginger, G. J., 2008b. An axiomatic characterization of the Hirsch-index.Mathematical Social Sciences 56 (2), 224–232.
Woeginger, G. J., 2010. An algorithmic comparison of three scientific impactindices. Acta Cybernetica 19, 661–672.
Wu, Q., 2010. The w-index: A measure to assess scientific impact by focusingon widely cited papers. Journal of the American Society for InformationScience and Technology 61 (3), 609–614.
Yu, H., Davis, M., Wilson, C. S., Cole, F. T. H., 2008. Object-oriented datamodelling for informetric databases. Journal of Informetrics 2 (3), 240–251.
Please cite this paper as:
Gagolewski M., Bibliometric impact assessment with R and the CITAN pack-age, Journal of Informetrics 5(4), 2011, pp. 678–692.
30