bias correction and re ned inferences for fixed e ects ... paper/rsue2016... · bias correction and...
TRANSCRIPT

Bias Correction and Refined Inferences for Fixed EffectsSpatial Panel Data Models∗
Zhenlin Yanga,, Jihai Yub, and Shew Fan Liua†
aSchool of Economics, Singapore Management University, 90 Stamford Road, Singapore 178903.
bGuanghua School of Management, Peking University, Beijing 100871, China.
August 12, 2016
Abstract
This paper first presents simple methods for conducting up to third-order bias and
variance corrections for the quasi maximum likelihood (QML) estimators of the spatial
parameter(s) in the fixed effects spatial panel data (FE-SPD) models. Then, it shows
how the bias and variance corrections lead to refined t-ratios for spatial effects and for
covariate effects. The implementation of these corrections depends on the proposed
bootstrap methods of which validity is established. Monte Carlo results reveal that (i)
the QML estimators of the spatial parameters can be quite biased, (ii) a second-order
bias correction effectively removes the bias, and (iii) the proposed t-ratios are much
more reliable than the usual t-ratios.
Key Words: Bias correction, Variance correction, Refined t-ratios, Bootstrap, Wild
bootstrap, Spatial panels, Fixed effects.
JEL Classification: C10, C13, C21, C23, C15
1 Introduction
Panel data models with spatial and social interactions have received a belated but
recently increasing attention by econometricians, since Anselin (1988).1 Spatial panel
data (SPD) models are differentiated by whether they are static or dynamic and whether
they contain random effects or fixed effects. The quasi maximum likelihood (QML) and
the generalized method of moments (GMM) are the popular methods for estimation and
inference of these models. See Lee and Yu (2010a, 2015) and Anselin et al. (2008) for
general accounts on issues related to SPD model specifications, parameter estimation, etc.
It has been recognized through the studies of spatial regression models that QML esti-
mators of the spatial parameter(s), although efficient, can be quite biased (Lee, 2004; Bao
∗We thank the Editor Daniel McMillen, two referees, and the participants of the 26th (EC)2 Conference–
Theory and Practice of Spatial Econometrics for their helpful comments. Zhenlin Yang gratefully acknowl-
edges the financial support from Singapore Management University under Grant C244/MSS14E002.†Corresponding Author: 90 Stamford Road, Singapore 178903. Phone: +65-6828-0852; Fax: +65-6828-
0833. E-mail addresses: [email protected], [email protected], among others, Baltagi et al. (2003, 2013), Kapoor et al. (2007), Yu et al. (2008, 2012), Yu and
Lee (2010), Lee and Yu (2010a,b), Baltagi and Yang (2013a,b), and Su and Yang (2015).
1
Forthcoming in Regional Science and Urban Economics

and Ullah, 2007; Bao, 2013; Yang, 2015), and more so with a denser spatial weight matrix
(Yang, 2015; Liu and Yang, 2015a). As a result the subsequent model inferences (based
on t-ratios) can be seriously affected. Methods of bias-correcting the QML estimators of
the spatial parameter(s) have been given for the spatial lag (SL) model (Bao and Ullah,
2007; Bao, 2013; Yang, 2015), the spatial error (SE) model (Liu and Yang, 2015a), and
the spatial lag and error (SLE) model (Liu and Yang, 2015b). The improved t-ratios for
the SL effect is given in Yang (2015), and improved t-ratios for the covariate effects are
given in Liu and Yang (2015b) for the SL, SE and SLE models, respectively.
Evidently, the QML estimators of the SPD models are subjected to the same issues on
the finite sample bias and finite sample performance of subsequent inferences, but these
important issues have not been addressed.2 Given the popularity of the SPD models
among the applied researchers, it is highly desirable to have a set of simple and reliable
methods for parameter estimation and model inference. In this paper, we focus on the
SPD models with fixed effects to provide methods for bias and variance corrections (up
to third-order) by extending the methods of Yang (2015),3 and then to show how the bias
and variance corrections lead to improved t-ratios for spatial and covariate effects. Lee and
Yu (2010b) investigate the asymptotic properties for the QML estimation of this model
based on direct and transformation approaches. The latter approach is more attractive as
it provides consistent estimators for all the common parameters, which is crucial in the
development of the methods for finite sample bias-corrections and refined inferences.4
We note that while the general stochastic expansions of Yang (2015) for nonlinear
estimators are applicable to different models including the SPD models considered in this
paper, the detailed developments of bias corrections, variance corrections and corrections
on t-ratio vary from one model to another. Furthermore, the transformation approach
induces errors that may no longer be independent and identically distributed (iid) even
if the original errors are. Thus, the bootstrap method proposed by Yang (2015) under
iid errors, may not be directly applicable. We demonstrate in this paper that when the
original error distribution is not far from normality, the standard iid bootstrap method can
still provide an excellent approximation, due to the fact that the transformed errors are
2The importance of bias correction for models with nonlinear parameters is seen from the large literature
on the regular dynamic panels (see, e.g., Nickell (1981), Kiviet (1995), Hahn and Kuersteiner (2002), Hahn
and Newey (2004), Bun and Carree (2005), Hahn and Moon (2006), and Arellano and Hahn (2005).3The fixed effects model has the advantage of robustness because fixed effects are allowed to depend
on included regressors. It also provides a unified model framework for different random effects models
considered in, e.g., Anselin (1988), Kapoor et al. (2007) and Baltagi et al. (2013). However, fixed effects
model encounters incidental parameter problem (Neyman and Scott, 1948; Lancaster, 2000).4Lee and Yu (2010b) observe that when conducting a direct estimation using the likelihood function
where all the common parameters and the fixed effects are estimated together, the estimate of the variance
parameter is inconsistent when T is finite while n is large. With data transformations to eliminate the fixed
effects, the incidental parameter problem is avoided, and the ratio of n and T does not affect the asymptotic
properties of estimates as the data are pooled. The QMLEs so derived are shown to be consistent, and,
except for the variance estimate, are identical to those from the direct approach.
2
Forthcoming in Regional Science and Urban Economics

homoskedastic and uncorrelated. When the original errors are extremely non-normal, we
show that the wild bootstrap method can improve the approximation. Monte Carlo results
reveal that the QMLEs of the spatial parameters can be quite biased, in particular for the
models with spatial error dependence, and that a second-order bias correction effectively
removes the bias. Furthermore, Monte Carlo results show that inferences for spatial and
covariate effects based on the regular t-ratios can be misleading, but those based on the
proposed t-ratios are very reliable. We emphasize that while corrections on the bias and
variance of a point estimator are important, it is more important to correct the t-ratios
so that practical applications of the models are more reliable. The methods presented in
this paper show a plausible way to do so. They are simple and yet quite general as the
spatial regression models are embedded as special cases.
The rest of the paper is organized as follows. Section 2 introduces the spatial panel
data model allowing both spatial lag and spatial error, and both time-specific effects and
individual-specific effects, and its QML estimation based on the transformed likelihood
function. Section 3 presents a third-order stochastic expansion for the QML estimators of
the spatial parameters, a third-order expansion for the bias, and a third-order expansion
for the variance of the QML estimators of the spatial parameters. Section 3 also addresses
issues on the bias of QMLEs of other model parameters, and on the inferences following
bias and variance corrections. Section 4 introduces the bootstrap methods for estimating
various quantities in the expansions, and presents theories for the validity of these methods.
Section 5 presents Monte Carlo results. Section 6 discusses and concludes the paper.
2 The Model and Its QML Estimation
For the spatial panel data (SPD) model with fixed effects (FE), we investigate the case
with both spatial lag and spatial error, where n is large and T could be finite or large.
We include both individual effects and time effects to have a robust specification. The
FE-SPD model under consideration is,
Ynt = λ0W1nYnt +Xntβ0 + cn0 + αt0ln + Unt, Unt = ρ0W2nUnt + Vnt, (2.1)
for t = 1, 2, . . . , T , where, for a given t, Ynt = (y1t, y2t, . . . , ynt)′ is an n × 1 vector of
observations on the response variable, Xnt is an n × k matrix containing the values of k
nonstochastic, individually and time varying regressors, Vnt = (v1t, v2t, . . . , vnt)′ is an n×1
vector of errors where vit are independent and identically distributed (iid) for all i and
t with mean 0 and variance σ20, cn0 is an n× 1 vector of fixed individual effects, and αt0 is
the fixed time effect with ln being an n× 1 vector of ones. W1n and W2n are given n× nspatial weights matrices where W1n generates the ‘direct’ spatial effects among the spatial
units in their response values Ynt, and W2n generates cross-sectional dependence among
the disturbances Unt. In practice, W1n and W2n may be the same.
3
Forthcoming in Regional Science and Urban Economics

In Lee and Yu (2010b), QML estimation of (2.1) is considered by using either a direct
approach or a transformation approach. The direct approach is to estimate the regression
parameters jointly with the individual and time effects, which yields a bias of order O(T−1)
due to the estimation of individual effects and a bias of order O(n−1) due to the estimation
of time effects. The transformation approach eliminates the individual and time effects
and then implements the estimation, which yields consistent estimates of the common
parameters when either n or T is large. In the current paper, we follow the transformation
approach so that it is free from the incidental parameter problem.
To eliminate the individual effects, define JT = (IT − 1T lT l
′T ) and let [FT,T−1,
1√TlT ]
be the orthonormal eigenvector matrix of JT , where FT,T−1 is the T × (T − 1) submatrix
corresponding to the eigenvalues of one, IT is a T × T identity matrix and lT is a T × 1
vector of ones.5 To eliminate the time effects, let Jn and Fn,n−1 be similarly defined,
and W1n and W2n be row normalized.6 For any n × T matrix [Zn1, · · · , ZnT ], define the
(n− 1)× (T − 1) transformed matrix as
[Z∗n1, . . . , Z∗n,T−1] = F ′n,n−1[Zn1, . . . , ZnT ]FT,T−1. (2.2)
This leads to, for t = 1, . . . , T − 1, Y ∗nt, U∗nt, V
∗nt, and X∗nt,j for the jth regressor. As in Lee
and Yu (2010b), let X∗nt = [X∗nt,1, X∗nt,2, . . . , X
∗nt,k], and W ∗hn = F ′n,n−1WhnFn,n−1, h = 1, 2.
The transformed model we will work on thus takes the form:
Y ∗nt = λ0W∗1nY
∗nt +X∗ntβ0 + U∗nt, U∗nt = ρ0W
∗2nU
∗nt + V ∗nt, t = 1, . . . , T − 1. (2.3)
After the transformations, the effective sample size becomes N = (n−1)(T −1). Stacking
the vectors and matrices, i.e., letting YN = (Y ∗′n1, . . . , Y∗′n,T−1)′, UN = (U∗′n1, . . . , U
∗′n,T−1)′,
VN = (V ∗′n1, . . . , V∗′n,T−1)′, XN = (X∗′n1, . . . , X
∗′n,T−1)′, and denoting WhN = IT−1⊗W ∗hn, h =
1, 2, we have the following compact expression for the transformed model:
YN = λ0W1NYN + XNβ0 + UN , UN = ρ0W2NUN + VN , (2.4)
which is in form identical to the spatial autoregressive model with autoregressive errors
(SARAR), showing that the QML estimation of the two-way fixed effects panel SARAR
model is similar to that of the linear SARAR model. The key difference is that the elements
of VN may not be independent although they are uncorrelated and homoskedastic. This
may have a certain impact on the bootstrap method (see next section for details). It is
easy to show that the transformed errors v∗it are uncorrelated for all i and t by using
the identity (V ∗′n1, . . . , V∗′n,T−1)′ = (F ′T,T−1 ⊗ F ′n,n−1)(V ′n1, . . . , V
′nT )′. Then,
E(V ∗′n1, . . . , V∗′n,T−1)′(V ∗′n1, · · · , V ∗′n,T−1) = σ2
0(F ′T,T−1 ⊗ F ′n,n−1)(FT,T−1 ⊗ Fn,n−1) = σ20IN .
5As discussed in Lee and Yu (2010b, Footnote 12), the first difference and Helmert transformation have
often been used to eliminate the individual effects. A special selection of FT,T−1 gives rise to the Helmert
transformation where Vnt are transformed to ( T−tT−t+1
)1/2[Vnt − 1T−t (Vn,t+1 + · · · + VnT )], which is of
particular interest for dynamic panel data models.6When Wjn are not row normalized, the linear SARAR representation of (2.4) for the spatial panel
model will no longer hold. In that case, a likelihood formulation would not be feasible.
4
Forthcoming in Regional Science and Urban Economics

Hence, v∗it are iid N(0, σ20) if the original errors vit are iid N(0, σ2
0).
It follows that the (quasi) Gaussian log likelihood function for (2.3) is,
`N (θ) = −N2
ln(2πσ2) + ln |AN (λ)|+ ln |BN (ρ)| − 1
2σ2V′N (ζ)VN (ζ), (2.5)
where ζ = (β′, λ, ρ)′, θ = (β′, σ2, λ, ρ)′, AN (λ) = IN − λW1N , BN (ρ) = IN − ρW2N , and
VN (ζ) = BN (ρ)[AN (λ)YN −XNβ].
Now, letting YN (λ) = AN (λ)YN and XN (ρ) = BN (ρ)XN , the constrained QMLEs
of β and σ2, given λ and ρ, can be expressed in the following simple form:
βN (λ, ρ) = [X′N (ρ)XN (ρ)]−1X′N (ρ)BN (ρ)YN (λ), (2.6)
σ2N (λ, ρ) = N−1Y′N (λ)MN (ρ)YN (λ), (2.7)
where MN (ρ) = B′N (ρ)IN−XN (ρ)[X′N (ρ)XN (ρ)]−1X′N (ρ)BN (ρ). Substituting βN (λ, ρ)
and σ2N (λ, ρ) back into (2.5) gives the concentrated log likelihood function of (λ, ρ):
`cN (λ, ρ) = −N2
(ln(2π) + 1) + ln |AN (λ)|+ ln |BN (ρ)| − N
2ln σ2
N (λ, ρ). (2.8)
Maximizing `cN (λ, ρ) in (2.8) gives the unconstrained QMLEs λN and ρN of λ and ρ, and
substituting (λN , ρN ) back into (2.6) and (2.7) gives the unconstrained QMLEs of β and
σ2 as βN ≡ βN (λN , ρN ) and σ2N ≡ σ2
N (λN , ρN ).7 Write θN = (β′N , λN , ρN , σ2N )′. Lee and
Yu (2010b) show that θN is√N -consistent and asymptotically normal under some mild
conditions. These conditions and the asymptotic variance of θN are given in Appendix
A to facilitate the subsequent developments for the higher-order results. It follows that
the QML estimators for any of the submodels discussed below will be√N -consistent and
asymptotically normal, where N can be (n− 1)(T − 1), n(T − 1), (n− 1)T , or nT .
The linear SARAR representation (2.4) has greatly facilitated the QML estimation
of the general FE-SPD model. It is also very for the subsequent developments in bias and
variance corrections. Obviously, it contains the spatial regression models as special cases.
Based on this representation, the results developed for this general model can easily be
reduced to suit simpler models. For example, setting ρ or λ to zero in (2.4) gives an
FE-SPD model with only SL dependence or an FE-SPD model with only SE dependence;
dropping either αt0 or cn0 in (2.1) (or dropping either Fn,n−1 or FT,T−1 in (2.2)) leads
to a submodel with only individual-specific effects or a submodel with only time-specific
effects; and finally, dropping both cn0 and αt0 in (2.1) leads to a panel data model with
SLE dependence. On the other hand, the spatial panel model considered in this paper
can also be extended to include more spatial lag terms in both the response and the
7Numerical maximization of `cN (λ, ρ) can be computationally demanding if N is large due to the need
for repeated calculation of the two determinants. Following simplifications help alleviate this: |AN (λ)| =|In−1 − λW ∗1n|T−1 =
(1
1−λ |In − λW1n|)T−1
=(
11−λ
∏ni=1(1− λω1i)
)T−1, where ω1i are the eigenvalues of
W1n, the middle equation from Lee and Yu (2010), and the last equation is from Griffith (1988). Similarly
the determinant of |BN (ρ)| is calculated.
5
Forthcoming in Regional Science and Urban Economics

disturbance, in particular the former.8 Software can be developed to facilitate the end
users of the methodologies developed in this paper.
3 Third-Order Bias and MSE for FE-SPD Model
3.1 Third-order stochastic expansions for nonlinear estimators
In a recent paper, Yang (2015) presents a general method for up to third-order bias and
variance corrections on a set of nonlinear estimators based on stochastic expansions and
bootstrap. The stochastic expansions provide tractable approximations to the bias and
variance of the nonlinear estimators and the bootstrap makes these expansions practically
implementable. The method is demonstrated, through a linear SL model, to be very
effective in correcting the bias and improving inferences. It was emphasized in Yang (2015)
that, in estimating a model with both linear and nonlinear parameters, the main source
of bias and the main difficulty in correcting the bias are associated with the estimation
of the nonlinear parameters, and hence, one should focus on the concentrated estimation
equation. By doing so, the dimensionality of the problem can be reduced, and more
importantly, additional variations from the estimation of linear and scale parameters are
captured in the stochastic expansions, thus making the bias and variance corrections more
effective. The method is summarized as follows.
Let δ be the vector of nonlinear parameters of a model, and δN defined as
δN = argψN (δ) = 0, (3.1)
be its√N -consistent estimator, with ψN (δ) being referred to as the concentrated esti-
mating function (CEF) and ψN (δ) = 0 the concentrated estimating equation (CEE). Let
HrN (δ) = ∇rψN (δ), r = 1, 2, 3, where the partial derivatives are carried out sequen-
tially and elementwise, with respect to δ′. Let ψN ≡ ψN (δ0), HrN ≡ HrN (δ0) and
HrN = HrN − E(HrN ), r = 1, 2, 3. Note that here and hereafter the expectation oper-
ator ‘E’ corresponds to the true model parameters θ0. Define ΩN = −[E(H1N )]−1. Yang
(2015), extending Rilstone et al. (1996) and Bao and Ullah (2007), gives a set of sufficient
conditions for a third-order stochastic expansion of δN = argψN (δ) = 0, based on a
general CEF ψN (δ), which are restated here to facilitate the development of higher-order
results for the FE-SPD model:
Assumption G1. δN solves ψN (δ) = 0 and δN − δ0 = Op(N−1/2).
Assumption G2. ψN (δ) is differentiable up to a rth order with respect to δ in a
neighborhood of δ0, E(HrN ) = O(1), and HrN = Op(N−1/2), r = 1, 2, 3.
Assumption G3. [E(H1N )]−1 = O(1), and H−11N = Op(1).
Assumption G4. ‖HrN (δ)−HrN (δ0)‖ ≤ ‖δ − δ0‖UN for δ in a neighborhood of
δ0, r = 1, 2, 3, and E |UN | ≤ c <∞ for some constant c.
8See Lee and Yu (2015, 2016) for more discussions and for the related issue on parameter identification.
6
Forthcoming in Regional Science and Urban Economics

Under these conditions, a third-order stochastic expansion for δN takes the form:
δN − δ0 = a−1/2 + a−1 + a−3/2 +Op(N−2), (3.2)
where a−s/2 represents a term of order Op(N−s/2) for s = 1, 2, 3, having the expressions
a−1/2 = ΩN ψN ,
a−1 = ΩNH1Na−1/2 + 1
2ΩNE(H2N )(a−1/2 ⊗ a−1/2),
a−3/2 = ΩNH1Na−1 + 1
2ΩNH2N (a−1/2 ⊗ a−1/2)
+12ΩNE(H2N )(a−1/2 ⊗ a−1 + a−1 ⊗ a−1/2)
+16ΩNE(H3N )(a−1/2 ⊗ a−1/2 ⊗ a−1/2),
where ⊗ denotes the Kronecker product. In moving from the stochastic expansion given
in (3.2) to third-order expansions for the bias, MSE and variance of δN , it is assumed that
E(ψN ) = O(N−1) and that a quantity bounded in probability has a finite expectation. The
latter is a simplifying assumption to ensure that the remainders are of the stated order.
A third-order expansion for the bias of δN is
Bias(δN ) = b−1 + b−3/2 +O(N−2), (3.3)
where b−1 = E(a−1/2 + a−1) and b−3/2 = E(a−3/2), being the second- and third-order
biases. Similarly, a third-order expansion for the mean squared error (MSE) of δN is
MSE(δN ) = m−1 +m−3/2 +m−2 +O(N−5/2), (3.4)
where m−1 = E(a−1/2a′−1/2), m−3/2 = E(a−1/2a
′−1 + a−1a
′−1/2) and m−2 = E(a−1a
′−1 +
a−1/2a′−3/2 + a−3/2a
′−1/2), and the third-order expansion for the variance of δN is
Var(δN ) = v−1 + v−3/2 + v−2 +O(N−5/2), (3.5)
where v−1 = Var(a−1/2), v−3/2 = Cov(a−1/2, a−1)+Cov(a−1, a−1/2), and v−2 = Cov(a−1/2,
a−3/2) + Cov(a−3/2, a−1/2) + Var(a−1 + a−3/2); or simply v−1 = m−1, v−3/2 = m−3/2, and
v−2 = m−2 − b2−1.
Therefore, we can improve estimation and statistical inference in finite samples by
correcting the bias and standard deviation of estimates. From (3.3), we can use
δbc2N = δN − b−1 or δbc3
N = δN − b−1 − b−3/2,
to yield an estimator unbiased up to order O(N−1) or O(N−3/2) respectively. With esti-
mated b−1 and b−3/2, feasible δbc2N and δbc3N are constructed.
Similar procedures can be applied to increase the precision of the variance estimate.
By (3.5), if b−1 − b−1 = Op(N−3/2) and b−3/2 − b−3/2 = Op(N
−2), we have
Var(δbc3N ) = v−1 + v−3/2 + v−2 − 2ACov(δN , b−1) +O(N−5/2), (3.6)
and Var(δbc2N ) = Var(δbc3
N ) + O(N−5/2), where ACov denotes asymptotic covariance. See
Section 4 for details on the practical implementation of bias and variance corrections.
7
Forthcoming in Regional Science and Urban Economics

3.2 Third-order bias and variance for spatial estimators
As pointed out in the introduction, the general expansions summarized in Section 3.1
are applicable to different models including the FE-SPD model we consider in this paper,
but the detailed developments for the corrections on bias, variance, and t-ratio vary from
one model to another. Furthermore, the transformation approach induces errors to be no
longer iid, rendering the bootstrap method of Yang (2015) for estimating the correction
terms not directly applicable. In this subsection, we first derive all the quantities required
for the third-order expansion of the FE-SPD model, and then discuss conditions under
which the results (3.2)-(3.6) hold for the FE-SPD model, instead of going through the
detailed proofs of them. As seen from Section 2, the set of nonlinear parameters in
the FE-SPD model are δ = (λ, ρ)′. The CEF leading to the QMLE δN = (λN , ρN ) is
ψN (δ) = 1N
∂∂δ `
cN (δ), which has the form:
ψN (δ) =
−T0N (λ) +
Y′N (λ)MN (ρ)W1NYN
Y′N (λ)MN (ρ)YN (λ),
−K0N (ρ)−Y′N (λ)M
(1)N (ρ)YN (λ)
2Y′N (λ)MN (ρ)YN (λ),
(3.7)
where T0N (λ) = 1N tr(W1NA−1
N (λ)), K0N (ρ) = 1N tr(W2NB−1
N (ρ)), and M(1)N (ρ) = d
dρMN (ρ).9
To derive the rth order derivative, HrN (δ), of ψN (δ) w.r.t. δ′, r = 1, 2, 3, given in
(3.2), define TrN (λ) = 1N tr[(W1NA−1
N (λ))r+1], and KrN (ρ) = 1N tr[(W2NB−1
N (ρ))r+1], r =
0, 1, 2, 3. Let M(k)N (ρ) be the kth derivative of MN (ρ) w.r.t. ρ, k = 1, 2, 3, 4. Define
R1N (δ) =Y′N (λ)MN (ρ)W1NYN
Y′N (λ)MN (ρ)YN (λ), R2N (δ) =
Y′NW′1NMN (ρ)W1NYN
Y′N (λ)MN (ρ)YN (λ);
Q†kN (δ) =Y′N (λ)M
(k)N (ρ)W1NYN
Y′N (λ)MN (ρ)YN (λ), Q‡kN (δ) =
Y′NW′1NM
(k)N (ρ)W1NYN
Y′N (λ)MN (ρ)YN (λ);
SkN (δ) =Y′N (λ)M
(k)N (ρ)YN (λ)
Y′N (λ)MN (ρ)YN (λ),
which have the following properties,
∂R1N (δ)∂λ = 2R2
1N (δ)−R2N (δ), ∂R2N (δ)∂λ = 2R1N (δ)R2N (δ),
∂Q†kN (δ)
∂λ = 2R1N (δ)Q†kN (δ)−Q‡kN (δ),∂Q‡kN (δ)
∂λ = 2R1N (δ)Q‡kN (δ),
∂SkN (δ)∂λ = 2R1N (δ)SkN (δ)− 2Q†kN (δ);
∂R1N (δ)∂ρ = Q†1N (δ)−R1N (δ)S1N (δ), ∂R2N (δ)
∂ρ = Q‡1N (δ)−R2N (δ)S1N (δ),
∂Q†kN (δ)
∂ρ = Q†k+1,N (δ)−Q†kN (δ)S1N (δ),∂Q‡kN (δ)
∂ρ = Q‡k+1,N (δ)−Q‡kN (δ)S1N (δ),
∂SkN (δ)∂ρ = Sk+1,N (δ)− SkN (δ)S1N (δ).
9Lee and Yu (2010b) provide a useful identity: (In−1 − λW ∗hn)−1 = F ′n,n−1(In−1 − λWhn)−1Fn,n−1.
Based on this, the inverses of AN (λ) and BN (λ) can easily be calculated as they are block-diagonal. The
conditions for the√N -consistency of δN are given in Lee and Yu (2010b), and also in Appendix A.
8
Forthcoming in Regional Science and Urban Economics

Write ψN (δ) = (ψ1N (δ), ψ2N (δ))′ with ψ1N (δ) = −T0N (λ) + R1N (δ) and ψ2N (δ) =
−K0N (ρ) − S1N (δ). Denote the partial derivatives of ψjN (δ) by adding superscripts λ
and/or ρ sequentially, e.g., ψλλ1N (δ) = ∂2
∂λ2ψ1N (δ), and ψλρλ2N (δ) = ∂3
∂λ∂ρ∂λ ψ2N (δ). Thus,
H1N (δ) has 1st row ψλ1N (δ), ψρ1N (δ) and 2nd row ψλ2N (δ), ψρ2N (δ), which gives
H1N (δ) =
−T1N (λ)−R2N (δ) + 2R21N (δ), Q†1N (δ)−R1N (δ)S1N (δ)
Q†1N (δ)−R1N (δ)S1N (δ), −K1N (ρ)− 12S2N (δ) + 1
2S21N (δ)
.
H2N (δ) has rows ψλλ1N (δ), ψλρ1N (δ), ψρλ1N (δ), ψρρ1N (δ) and ψλλ2N (δ), ψλρ2N (δ), ψρλ2N (δ), ψρρ2N (δ),where
ψλλ1N (δ) = −2T2N (λ)− 6R1N (δ)R2N (δ) + 8R31N (δ),
ψλρ1N (δ) = −Q‡1N (δ) + 4R1N (δ)Q†1N (δ) +R2N (δ)S1N (δ)− 4R21N (δ)S1N (δ),
ψρρ1N (δ) = Q†2N (δ)− 2Q†1N (δ)S1N (δ) + 2R1N (δ)S21N (δ)−R1N (δ)S2N (δ),
ψρρ2N (δ) = −2K2N (ρ)− 12S3N (δ) + 3
2S1N (δ)S2N (δ)− S31N (δ),
ψλλ2N (δ) = ψρλ1N (δ) = ψλρ1N (δ), and ψλρ2N (δ) = ψρλ2N (δ) = ψρρ1N (δ).
H3N (δ) is obtained by differentiating every element of H2N (δ) w.r.t. δ′. It has elements:
ψλλλ1N (δ) = −6T3N (λ) + 6R22N (δ)− 48R2
1N (δ)R2N (δ) + 48R41N (δ),
ψλλρ1N (δ) = −6Q†1N (δ)R2N (δ) + 12R1N (δ)R2N (δ)S1N (δ)− 6R1N (δ)Q‡1N (δ),
+24R21N (δ)[Q†1N (δ)−R1N (δ)S1N (δ)],
ψλρλ1N (δ) = 2Q‡1N (δ)R1N (δ) + 12R1N (δ)R2N (δ)S1N (δ)− 6R1N (δ)Q†1N (δ)
+8R21N (δ)Q†1N (δ)− 20R3
1N (δ)S1N (δ),
ψλρρ1N (δ) = −Q‡2N (ρ) + 2Q‡1N (ρ)S1N (δ)− 2R2N (δ)S21N (δ) +R2N (δ)S2N (δ) + 4Q† 2
1N (δ)
−16R1N (δ)S1N (δ)Q†1N (δ)+4R1N (δ)Q†2N (δ)+12R21N (δ)S2
1N (δ)−4R21N (δ)S2N (δ),
ψρρλ1N (δ) = −Q‡2N (δ)+4Q†2N (δ)R1N (δ)+2Q‡1N (δ)S1N (δ)+4Q† 21N (δ)−16R1N (δ)Q†1N (δ)S1N (δ)
−R2N (δ)S2N (δ) + 12R21N (δ)S2
1N (δ)− 2R2N (δ)S21N (δ)− 4S2
1N (δ)S2N (δ),
ψρρρ1N (δ) = Q†3N (δ)−3Q†2N (δ)S1N (δ)+6Q†1N (δ)S21N (δ)−3Q†1N (δ)S2N (δ)−6R1N (δ)S3
1N (δ)
+6R1N (δ)S1N (δ)S2N (δ)−R1N (δ)S3N (δ),
ψρρλ2N (δ) = Q†3N (δ)−R1N (δ)S3N (δ)− 3Q†1N (δ)S2N (δ) + 6R1N (δ)S1N (δ)S2N (δ)
−3S1N (δ)Q†2N (δ) + 6S21N (δ)Q†1N (δ)− 6R1N (δ)S3
1N (δ),
ψρρρ2N (δ) = −6K3N (ρ)− 12S4N (δ)+2S1N (δ)S3N (δ)+ 3
2S22N (δ)−6S2N (δ)S2
1N (δ)+3S41N (δ).
ψρλλ1N (δ) = ψλρλ1N (δ) = ψλλλ2N (δ), ψρλρ1N (δ) = ψλρρ1N (δ) = ψλλρ2N (δ),
ψρρλ1N (δ) = ψλρλ2N (δ) = ψρλλ2N (δ), and ψρρρ1N (δ) = ψλρρ2N (δ) = ψρλρ2N (δ).
The expressions of M(k)N (ρ), ρ, k = 1, 2, 3, 4, are lengthy, and hence are relegated to
Appendix B.
9
Forthcoming in Regional Science and Urban Economics

For the general results (3.2)-(3.6) to be valid when the CEF ψN (δ) corresponds to
the FE-SPD model, it is sufficient that this function satisfies Assumptions G1-G4 listed
in Section 3.1. First the√N -consistency of δN in Assumption G1 is given in Theorem
A.1 in Appendix A. The differentiability of ψN (δ) in Assumption G2 is obvious. From
Section 4.1 we see that the R-, S- and Q-quantities at the true parameter values are all
ratios of quadratic forms in VN , having the same denominator V′NMNVN where M
N =
IN −XN (ρ0)[X′N (ρ0)XN (ρ0)]−1X′N (ρ0). It can be shown that 1NV′NM
NVN converges to
σ20(> 0) with probability one. Hence, with Assumptions A1-A8 in Appendix A, for the
H-quantities to have proper stochastic behavior, it would typically require the existence
of the 6th moment of vit for the second-order bias correction, and the existence of the
10th moment of vit for the third-order bias correction. Variance corrections have stronger
moment requirements. However, these moment requirements are no more than those under
a joint estimating equation with analytical approach. The condition E(ψN ) = O(N−1) is
required so that b−1 is truly O(N−1). This condition is not restrictive given the asymptotic
normality of δN , i.e., as N → ∞,√N(δN − δ0) converges to a centered bivariate normal
distribution, established by Lee and Yu (2010b), implies that E(ψN ) = o(N−1/2). The
other conditions are likely to hold for the FE-SPD model. With these and Assumptions
A1-A8 in Appendix A, the results (3.2)-(3.6) are likely to hold. For these reasons, we do
not present detailed proofs of the results (3.2)-(3.6) for the FE-SPD model, but rather
focus on the validity of the bootstrap methods for the practical implementation of these
bias and variance corrections.
3.3 Reduced models
Letting either ρ = 0 or λ = 0 leads to two important submodels, the FE-SPD model
with SL dependence only and the FE-SPD model with SE dependence only.10 Bias and
variance corrections become much simpler in these cases, in particular the former.
FE-SPD model with SL dependence. The necessary terms for up to third-order
bias and variances correction for the FE-SPD model with only SL dependence are:
R1N (λ) =Y′N (λ)M0
NW1NYN
Y′N (λ)M0NYN (λ)
, R2N (λ) =Y′NW′
1NM0NW1NYN
Y′N (λ)M0NYN (λ)
,
ψN (λ) = −T0N (λ) +R1N (λ),
H1N (λ) = −T1N (λ)−R2N (λ) + 2R21N (λ),
H2N (λ) = −2T2N (λ)− 6R1N (λ)R2N (λ) + 8R31N (λ),
H3N (λ) = −6T3N (λ) + 6R22N (λ)− 48R2
1N (λ)R2N (λ) + 48R41N (λ),
where M0N ≡MN (0) = IN −XN (X′NXN )−1X′N . These results contain, as a special case,
the results for linear SL dependence model considered in detail in Yang (2015), showing
the usefulness of the linear SARAR representation (2.4) for the FE-SPD model.
10Both can be extended by adding a spatial Durbin term WNXN to give the so-called spatial Durbin
model and the spatial Durbin error model; see, e.g., Elhorst (2014). See also Sec. 6 for more discussions.
10
Forthcoming in Regional Science and Urban Economics

FE-SPD model with SE dependence. The necessary terms for up to third-order
bias and variances correction for the FE-SPD model with only SE dependence are:
SkN (ρ) =Y′NM
(k)N (ρ)YN
Y′NMN (ρ)YN, k = 1, 2, 3, 4,
ψN (ρ) = −K0N (ρ)− 12S1N (ρ),
H1N (ρ) = −K1N (ρ)− 12S2N (ρ) + 1
2S21N (ρ),
H2N (ρ) = −2K2N (ρ)− 12S3N (ρ) + 3
2S1N (ρ)S2N (ρ)− S31N (ρ),
H3N (ρ) = −6K3N (ρ)− 12S4N (δ) + 2S1N (δ)S3N (δ) + 3
2S22N (δ)
−6S2N (δ)S21N (δ) + 3S4
1N (δ).
These results contain, as a special case, the results for the linear SED model considered
in Liu and Yang (2015a). Again, these results show the usefulness of the linear SASAR
representation for the FE-SPD model given in (2.4).
Simplifications to a one-way fixed effects model are easily done by dropping either
Fn,n−1 or FT,T−1 in defining the transformed variables Y ∗nt, U∗nt, and V ∗nt, and the trans-
formed matrices X∗nt and W ∗hn, h = 1, 2. Obviously, when the model contains only
individual-specific effects, t = 1, . . . , T − 1 and N = n(T − 1), and when model contains
only time-specific effects, t = 1, . . . , T and N = (n− 1)T .
3.4 Bias correction for non-spatial estimators
As βN (δ0) in (2.6) is an unbiased estimator of β, and NN−k σ
2N (δ0) in (2.7) is an un-
biased estimator of σ2, it is natural to expect that, with a bias-corrected QMLE δbcN of
δ, βbcN = βN (δbc
N ) and σ2,bcN = N
N−k σ2N (δbc
N ) would be much less biased than the original
QMLEs. Thus, with a bias-corrected nonlinear estimator, the QMLEs of the linear and
scale parameters may be automatically bias-corrected, making the overall bias correction
much easier. This is another point stressed by Yang (2015) in supporting the arguments
that one should use CEE to perform bias correction on nonlinear parameters. We now
present some results to support this point.
First, βN ≡ βN (δN ) = FN (ρN )YN (λN ), where FN (ρ) = [X′N (ρ)XN (ρ)]−1X′N (ρ)BN (ρ),
by (2.6). Let β(k)N (δ) be the kth derivative of βN (δ) w.r.t. δ′, and F
(k)N (ρ) the kth deriva-
tive of FN (ρ) w.r.t. ρ. A notational convention is followed: βN ≡ βN (δ0), β(k)N ≡
β(k)N (δ0), FN ≡ FN (ρ0), AN = AN (λ0), BN = BN (ρ0), etc. Assume E(β
(k)N ) exists
and β(k)N − E(β
(k)N ) = Op(N
−1/2), k = 1, 2. By a Taylor series expansion, we obtain,
βN (δN ) = βN + β(1)N (δN − δ0) + 1
2 β(2)N [(δN − δ0)⊗ (δN − δ0)] +Op(N
−3/2), (3.8)
= βN + E(β(1)N )(δN − δ0) + bNa−1/2 + 1
2E(β(2)N )(a−1/2 ⊗ a−1/2) +Op(N
−3/2),
where E(β(1)N ) = [−FNGNXNβ0, F
(1)N XNβ0], GN = W1NA−1
N , bN = [−FNGNB−1N VN ,
F(1)N B−1
N VN ], and E(β(2)N ) = [0k×1, −F
(1)N GNXNβ0, −F
(1)N GNXNβ0, F
(2)N XNβ0]. Recall
a−1/2 = ΩN ψN .
11
Forthcoming in Regional Science and Urban Economics

It is easy to see that the expansion (3.8) holds when δN is replaced by δbc2N . Thus,
Bias(βN ) = E(β(1)N )Bias(δN ) + E(bNa−1/2) + 1
2E(β(2)N )E(a−1/2 ⊗ a−1/2) +O(N−3/2),
Bias(βbc2N ) = E(bNa−1/2) + 1
2E(β(2)N )E(a−1/2 ⊗ a−1/2) +O(N−3/2). (3.9)
The key term E(β(1)N )Bias(δN ) of order O(N−1) in the bias of βN (δN ) is absorbed into the
error term when δN is replaced by δbc2N in defining the estimator for β0. Thus, it can be
expected that the resulting bias reduction can be big, and the estimator βbc2N = βN (δbc2
N ) is
essentially second-order bias-corrected, if E(bNa−1/2)+ 12E(β
(2)N )E(a−1/2⊗a−1/2) is ‘small’.
In general, using (3.9), βbc2N can easily be further bias-corrected to be ‘truly’ second-order
unbiased. However, our Monte Carlo results given in Section 5 suggest that this may not
be necessary. Finally, F(k)N (ρ), k = 1, 2, can be easily derived.
Now, from (2.7), σ2N = σ2
N (δN ) = 1NY′N (λN )MN (ρN )YN (λN ) ≡ 1
NQN (δN ). Let
Q(k)N (δ) be the kth partial derivative of QN (δ) w.r.t. δ′, and similarly Q
(k)N ≡ Q
(k)N (δ0).
Assume 1NE(Q
(k)N ) = O(1) and 1
N [Q(k)N − E(Q
(k)N )] = Op(N
−1/2) for k = 1, 2. A Taylor
series expansion gives,
σ2N (δN ) = σ2
N + 1NQ
(1)N (δN − δ0) + 1
2NQ(2)N [(δN − δ0)⊗ (δN − δ0)] +Op(N
−3/2),
= σ2N + 1
NE(Q(1)N )(δN − δ0) + qNa−1/2 + 1
2NE(Q(2)N )(a−1/2 ⊗ a−1/2) (3.10)
+Op(N−3/2),
where the exact expressions for qN and E(Q(k)N ), k = 1, 2, are given in Appendix B.
It is easy to see that (3.10) holds when δN is replaced by δbc2N . It follows that
Bias[ NN−k σ
2N (δN )] = 1
N−kE(Q(1)N )Bias(δN ) + N
N−kE(qNa−1/2)
+ 12(N−k)E(Q
(2)N )E(a−1/2 ⊗ a−1/2) +O(N−3/2),
Bias[ NN−k σ
2N (δbc2
N )] = NN−kE(qNa−1/2) + 1
2(N−k)E(Q(2)N )E(a−1/2 ⊗ a−1/2) (3.11)
+O(N−3/2).
Again, the key bias term 1N−kE(Q
(1)N )Bias(δN ) is removed when δN is replaced by δbc2
N
in defining the estimator for σ20, and our Monte Carlo results in Section 5 show that
NN−k σ
2N (δbc2
N ) is nearly unbiased for σ20. In any case, one can always use (3.11) to carry
out further bias correction on NN−k σ
2N (δbc2
N ).
3.5 Inferences following bias and variance corrections
The impact of bias correction for spatial estimators on the estimation of the regression
coefficients and error standard deviation were investigated in the earlier subsection. It
would be interesting to further investigate the impacts of bias and variance corrections
for spatial estimators on the statistical inferences concerning the spatial parameters or
the regression coefficients. The latter issue is of a great practical relevance, as being able
to assess the covariate effects in a reliable manner may be the most desirable feature in
12
Forthcoming in Regional Science and Urban Economics

any econometric modelling activity. Unfortunately, this issue has not been addressed for
spatial panel data regression models.
One of the most interesting type of inferences for a spatial model would be testing for
the existence of spatial effects. With the availability of QMLEs δN and its asymptotic
variance ΩNE(ψN ψ′N )ΩN , one can easily carry out a Wald test. However, given the fact
that δN can be quite biased, it is questionable that this asymptotic test would be reliable
when N is not large. With the bias and variance correction results presented in Section 3,
one can easily construct various ‘bias-corrected’ Wald tests. For testing H0 : λ = ρ = 0,
i.e., the joint non-existence of both types of spatial effects, we have,
WSARARN,jk = (δbcj
N )′Var−1k (δbcj
N )δbcjN , (3.12)
where δbcjN is the jth-order bias-corrected δN and Vark(δ
bcjN ) is the kth-order corrected
variance of δbcjN . When j = k = 1, δbc1
N = δN , Var1(δbc1N ) = ΩNE(ψN ψ
′N )ΩN , and the test
is an asymptotic Wald test. The details on estimating Vark(δbcjN ), in particular, Var3(δbc3
N ),
are given at the end of Section 4.
Similarly, for testing the non-existence of one type of spatial effect, allowing the exis-
tence of the other type of spatial effect, i.e., H0 : λ = 0, allowing ρ, or H0 : ρ = 0 allowing
λ, we have, respectively,
WSARN,jk = λbcj
N /
√Var11,k(δ
bcjN ) or WSED
N,jk = ρbcjN /
√Var22,k(δ
bcjN ), (3.13)
where Varii,k(δbcjN ) denotes the i-th diagonal element of Vark(δ
bcjN ). Furthermore, we can
easily construct improved tests for testing the non-existence of spatial effect in the two
reduced models, i.e., testing H0 : λ = 0, given ρ = 0, or H0 : ρ = 0, given λ = 0:
T SARN,jk = λbcj
N /
√Vark(λ
bcjN ) or T SED
N,jk = ρbcjN /
√Vark(ρ
bcjN ), (3.14)
where Vark(λbcjN ) and Vark(ρ
bcjN ) are the k-order corrected variances of the jth-order bias-
corrected estimators based on the corresponding reduced models described in Section 3.3.
Another important type of inference concerns the covariate effects, i.e., the testing or
confidence interval construction for c′β0, a linear combination of the regression parameters.
For an improved inference, we need the bias-corrected variance estimator for βbc2N . By (3.8)
with δN being replaced by δbc2N , we have,
Var(βbc2N ) = Var
[βN+E(β
(1)N )(a−1/2+a−1)+bNa−1/2+ 1
2E(β(2)N )(a−1/2⊗a−1/2)
]+Op(N
−2).
This variance can be easily estimated based on the bootstrap method described at the end
of Section 4. For testing H0 : c′β0 = 0, the following two statistics may be used:
TN,11 = c′βN/
√c′AVar(βN )c, and TN,22 = c′βbc2
N /
√c′Var(βbc2
N )c, (3.15)
where AVar(βN ) is the estimate of the asymptotic variance of βN and Var(βbc2N ) is the
bootstrap estimate of Var(βbc2N ) (see the end of Section 4). These results can easily be
simplified to suit the simpler models. Monte Carlo results presented in Section 5 show
that inferences based on TN,22 are much more reliable than inferences based on TN,11.
13
Forthcoming in Regional Science and Urban Economics

4 Bootstrap for Feasible Bias and Variance Corrections
For practical implementation of the methods given in the previous section, we need
to evaluate the expectations of a−s/2 for s = 1, 2, 3, and the expectations of their cross
products. Thus, we need to compute the expectations of all the R-, S-, and Q-ratios
of quadratic forms defined below (3.7), expectations of their powers, and expectations of
cross products of powers, which seem impossible analytically. The use of a joint estimat-
ing equation (JEE) as in Bao and Ullah (2007) and Bao (2013) may offer a possibility.
However, even for a second-order bias correction of the pure SL dependent model without
regressors (Bao, 2013), the formulae are seen to be very complicated already. Furthermore,
the analytical approach runs into another problem with variance corrections and higher-
order bias corrections – it may involve higher than fourth moments of the errors of which
estimation may not be stable numerically. In the current paper, we follow Yang (2015)
to use the CEE, ψN (δ) = 0, which not only reduces the dimensionality but also captures
additional bias and variability from the estimation of linear and scale parameters, making
the bias correction more effective. We then use bootstrap to estimate these expectations
involved in the bias and variance corrections, which overcomes the difficulty of analytically
evaluating the expectations of ratios of quadratic forms and avoids the direct estimation
of higher-order moments of the errors.
4.1 The bootstrap method
We follow Yang (2015) and propose a bootstrap procedure for the FE-SPD model
with SLE dependence given in (2.4). Note YN (λ0) = XNβ0 + B−1N (ρ0)VN , W1NYN =
GN [XNβ0 + B−1N (ρ0)VN ], where GN ≡ GN (λ0) = W1NA−1(λ0), and MN (ρ)XN = 0.
The R-ratios, S-ratios and Q-ratios at δ = δ0 defined below (3.7) can all be written as
functions of ζ0 = (β′0, δ′0)′ and VN , given XN and WjN , j = 1, 2:
R1N (ζ0,VN ) =V′NB′−1
N MNGN (XNβ0 + B−1N VN )
V′NMNVN
, (4.1)
R2N (ζ0,VN ) =(XNβ0 + B−1
N VN )′G′NMNGN (XNβ0 + B−1N VN )
V′NMNVN
, (4.2)
Q†kN (ζ0,VN ) =(XNβ0 + B−1
N VN )′M(k)N GN (XNβ0 + B−1
N VN )
V′NMNVN
, (4.3)
Q‡kN (ζ0,VN ) =(XNβ0 + B−1
N VN )′G′NM(k)N GN (XNβ0 + B−1
N VN )
V′NMNVN
, (4.4)
SkN (ζ0,VN ) =(XNβ0 + B−1
N VN )′M(k)N (XNβ0 + B−1
N VN )
V′NMNVN
, (4.5)
where MN = IN −XN (ρ0)[X′N (ρ0)XN (ρ0)]−1X′N (ρ0) given at the end of Section 3.2, and
M(k)N ≡M
(k)N (ρ0). It follows that ψN = ψN (ζ0,VN ) and HrN = HrN (ζ0,VN ), r = 1, 2, 3.
14
Forthcoming in Regional Science and Urban Economics

Now, define the QML estimate of the error vector VN in the FE-SPD model (2.4):
VN = BN (ρN )[A(λN )YN −XN βN ]. (4.6)
Let V?N be a bootstrap sample based on VN . The bootstrap analogs of various quantities
are simply
ψ?N ≡ ψN (ζN ,V?N ) and H?
rN ≡ HrN (ζN ,V?N ), r = 1, 2, 3.
Thus, the bootstrap estimates of the quantities in bias and variance corrections are, for
example,
E(ψN ⊗HrN ) = E?[ψN (ζN , V
?N )⊗HrN (ζN , V
?N )], and
E(ψN ⊗ ψN ⊗ ψN ) = E?[ψN (ζN , V
?N )⊗ ψN (ζN , V
?N )⊗ ψN (ζN , V
?N )],
where E? denotes the expectation with respect to the bootstrap distribution. The boot-
strap estimates of other quantities are defined in the same manner.11 To make these
bootstrap expectations practically feasible, we first follow Yang (2015) and propose the
following iid bootstrap procedure:
Algorithm 4.1 (iid Bootstrap)
1. Compute ζN and VN , and center VN .
2. Draw a bootstrap sample V?N,b, i.e., make N random draws from the elements of
centered VN .
3. Compute ψN (ζN , V?N,b) and HrN (ζN , V
?N,b), r = 1, 2, 3.
4. Repeat steps 2-3 for B times to give approximate bootstrap estimates as
E(ψN ⊗HrN ) = 1B
∑Bb=1
[ψN (ζN , V
?N,b)⊗HrN (ζN , V
?N,b)
], and
E(ψN ⊗ ψN ⊗ ψN ) = 1B
∑Bb=1
[ψN (ζN , V
?N,b)⊗ ψN (ζN , V
?N,b)⊗ ψN (ζN , V
?N,b)
].
Note that the approximation in the last step of Algorithm (4.1) can be made arbitrarily
accurate by choosing an arbitrarily large B, and that the scale parameter σ20 and its QMLE
σ2N do not play a role in the bootstrap process as they are hidden in either VN or VN .
The iid bootstrap procedure requires that the underlining error vector VN contains
iid elements, which apparently may not be true in general if the original errors are not
normal. However, the fact that the elements of VN are uncorrelated and homoskedastic
suggests that applying the iid bootstrap may give a very good approximation although
it may not be strictly valid. Nevertheless, when the original errors are nonnormal, the
following wild bootstrap or perturbation procedure can be used.
11To facilitate the bootstrapping, the a−s/2 in (3.2) can be re-expressed so that the random quantities
are put together, using the well-known properties of Kronecker product: (A ⊗ B)(C ⊗ D) = AC ⊗ BDand vec(ACB) = (B′ ⊗ A)vec(C), where ‘vec’ vectorizes a matrix by stacking its columns. For example,
H1NΩN ψN = (ψ′N ⊗ H1N )vec(ΩN ), and a−1/2 ⊗ a−1/2 ⊗ a−1/2 = (ΩN ⊗ ΩN ⊗ ΩN )(ψN ⊗ ψN ⊗ ψN ).
Alternatively, one can follow the ‘two-step’ procedure given in Yang (2015, Sec. 4).
15
Forthcoming in Regional Science and Urban Economics

Algorithm 4.2 (Wild Bootstrap)
1. Compute ζN and VN , and center VN .
2. Compute V?N,b = VN εb, where denotes the Hadamard product, and εb is an
N -vector of iid draws from a distribution of mean zero and all higher moments 1,
and is independent of VN .12
3. Compute ψN (ζN , V?N,b) and HrN (ζN , V
?N,b), r = 1, 2, 3.
4. Repeat steps 2-3 for B times to give approximate bootstrap estimates as
E(ψN ⊗HrN ) = 1B
∑Bb=1
[ψN (ζN , V
?N,b)⊗HrN (ζN , V
?N,b)
], and
E(ψN ⊗ ψN ⊗ ψN ) = 1B
∑Bb=1
[ψN (ζN , V
?N,b)⊗ ψN (ζN , V
?N,b)⊗ ψN (ζN , V
?N,b)
].
Note that the common application of the wild bootstrap method is to handle the
problem of unknown heteroskedasticity, which clearly is not the main purpose of this
paper. In our model, the (transformed) errors are homoskedastic in the usual sense,
i.e., variances are constant. Also, the errors are uncorrelated. However, the transformed
errors are, strictly speaking, heteroskedastic in the sense that their third and higher order
moments may not be constant. The wild bootstrap here aims to capture these non-
constant higher-order moments. Also, there may be higher-order dependence, which the
wild bootstrap is unable to capture. We see in the next section that this can be ignored.
4.2 Validity of the bootstrap method
In discussing the validity of the bootstrap method, we concentrate on the bias correc-
tions. The fact that the elements of the transformed errors VN = v∗it are uncorrelated
and homoskedastic (up to second moment) across i and t, and its observed counterpart VN
is consistent, provide the theoretical base for the proposed iid bootstrap method. These
may not be sufficient in general for the classical iid bootstrap method to be strictly valid,
as our estimation requires matching of the higher-order bootstrap moments with those of
v∗it. However, there are important special cases under which the classical iid bootstrap
method is strictly valid.
First, we note that when the original errors vit are iid normal, the transformed
errors v∗it are again iid normal. Further, Lemma 4.1 shows that if the original errors
vit are iid with mean zero, variance σ20, and cumulants kr = 0, r = 3, 4, . . ., then the
transformed errors v∗it will also have mean zero, variance σ20, and rth cumulant being
zero for r = 3, 4, . . .. Furthermore, the rth order joint cumulants of the transformed errors
are also zero. The iid bootstrap procedure essentially falls into the general framework of
Yang (2015) and hence its validity is fully established. We give the following proposition.
12We are unaware of the existence of such a distribution. However, the two-point distribution suggested
by Mammen (1993): εb,i = −(√
5−1)/2 or (√
5+1)/2 with probability (√
5+1)/(2√
5) or (√
5−1)/(2√
5),
has mean zero, and second and third moments 1. Another two-point distribution: εb,i = −1 or 1 with
equal probability, has all the odd moments zero and even moments 1. See Liu (1988) and Davidson and
Flachaire (2008) for more details on wild bootstrap.
16
Forthcoming in Regional Science and Urban Economics

Proposition 4.1 Suppose the conditions leading to the third-order bias expansion
(3.3) are satisfied by the FE-SPD model. Assume further that the rth cumulant kr of
vit is 0, r = 3, . . . , 10. Then the iid bootstrap method stated in Algorithm 4.1 is valid,
i.e., Bias(δbc2N ) = O(N−3/2) and Bias(δbc3N ) = O(N−2).
Second, for the important submodel with only individual effects and small T , the
transformed errors, [V ∗n1, . . . , V∗n,T−1] = [Vn1, . . . , Vn,T ]FT,T−1 are iid across i, i.e., the rows
of the matrix [V ∗n1, . . . , V∗n,T−1] are iid irrespective of whether the original errors are normal
or nonnormal, where N = n(T −1). As T is small and fixed, the asymptotics depend only
on n. The bootstrap thus proceeds by randomly drawing the rows of the QML estimate
of [V ∗n1, . . . , V∗n,T−1]. We have the following proposition.
Proposition 4.2 Suppose the conditions leading to the third-order bias expansion
(3.3) are satisfied by the FE-SPD model with only individual effects. Assume further
that the rth cumulant kr of vit exists, r = 3, . . . , 10, and T is fixed. Then the bootstrap
method making iid draws from the rows of the QML estimates of [V ∗n1, . . . , V∗n,T−1] is valid,
i.e., Bias(δbc2N ) = O(N−3/2) and Bias(δbc3N ) = O(N−2).
For the general FE-SPD model with two-way fixed effects, T being small or large,
and the original errors being iid but not necessarily normal, the classical iid bootstrap
may not be strictly valid, because the transformed errors (on which the iid bootstrap
depends) are not guaranteed to be iid, although they are uncorrelated with mean zero
and constant variance σ20. In particular, the transformed errors may not be independent,
and their higher-order moments (3rd-order and higher) may not be constant. On the
other hand, making random draws from the empirical distribution function (EDF) of
the centered VN gives bootstrap samples that are of iid elements. Thus, the classical iid
bootstrap does not fully mimic or recreate the random structure of VN , rendering its strict
validity questionable. The following proposition says that the wild bootstrap described in
Algorithm 4.2 is valid.
Proposition 4.3 Suppose the conditions leading to the third-order bias expansion
(3.3) are satisfied by the FE-SPD model. Assume further that the rth cumulant kr of
vit exists for r = 3, . . . , 10. Then the wild bootstrap method stated in Algorithm 4.2 is
valid for the general FE-SPD model, provided that the joint cumulants of the transformed
errors v∗it up to rth order, r = 3, . . . , 10, are negligible.
Proof: We now present a collective discussion/proof of the Propositions 4.1-4.3. Very
importantly, we want to ‘show’ that the classical iid bootstrap method can give a very
good approximation in cases it is not strictly valid, i.e., the ‘missing parts’ can be ignored
numerically.
Let VnT = (V ′n1, . . . , V′nT )′ be the vector of original errors in Model (2.1), which contains
iid elements of mean zero, variance σ20, cumulative distribution function (CDF) F , and
17
Forthcoming in Regional Science and Urban Economics
cumulants kr, r = 3, 4, . . . , 10. Let FnT,N = FT,T−1⊗Fn,n−1 be the nT ×N transformation
matrix. We have
VN = F′nT,NVnT . (4.7)
For convenience, denote the elements of VN by vi, and the ith column of FnT,N by
fi, i = 1, . . . , N . Let κr(·) denote the rth cumulant of a random variable, and κ(·, . . . , ·)the joint cumulants of random variables. Let denote the Hadamard product. A vector
raised to rth power is operated elementwise.
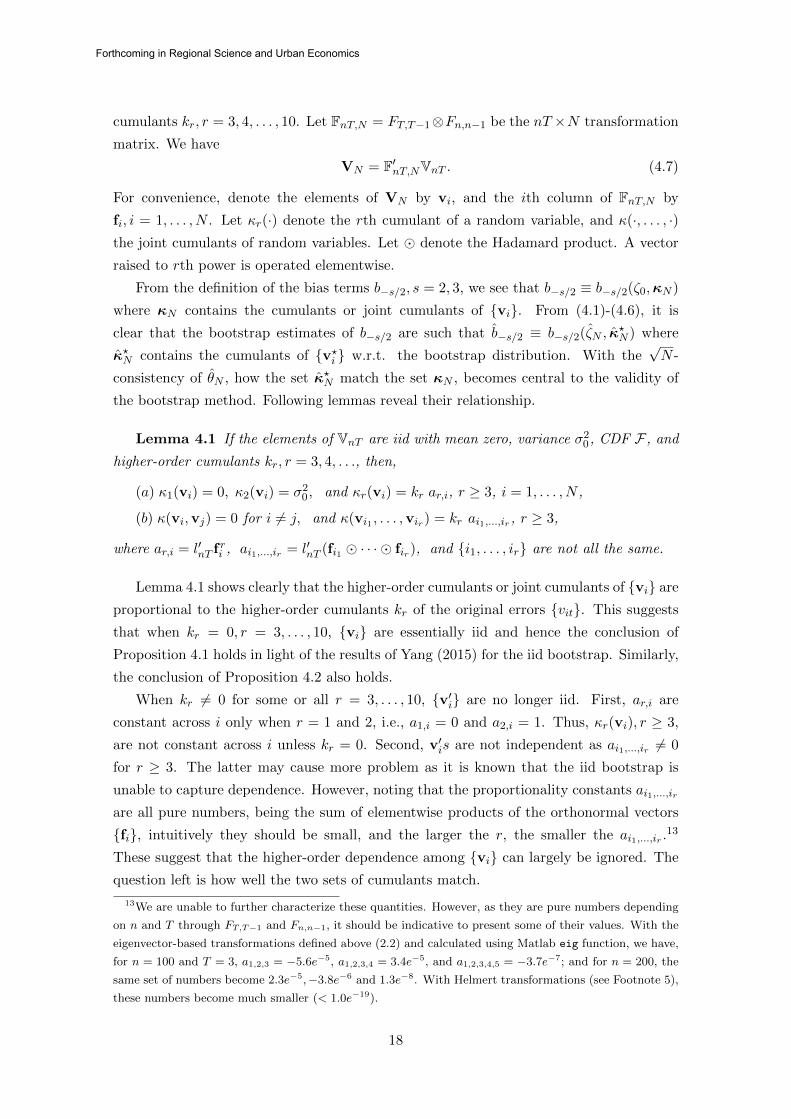
From the definition of the bias terms b−s/2, s = 2, 3, we see that b−s/2 ≡ b−s/2(ζ0,κN )
where κN contains the cumulants or joint cumulants of vi. From (4.1)-(4.6), it is
clear that the bootstrap estimates of b−s/2 are such that b−s/2 ≡ b−s/2(ζN , κ?N ) where
κ?N contains the cumulants of v?i w.r.t. the bootstrap distribution. With the√N -
consistency of θN , how the set κ?N match the set κN , becomes central to the validity of
the bootstrap method. Following lemmas reveal their relationship.
Lemma 4.1 If the elements of VnT are iid with mean zero, variance σ20, CDF F , and
higher-order cumulants kr, r = 3, 4, . . ., then,
(a) κ1(vi) = 0, κ2(vi) = σ20, and κr(vi) = kr ar,i, r ≥ 3, i = 1, . . . , N ,
(b) κ(vi,vj) = 0 for i 6= j, and κ(vi1 , . . . ,vir) = kr ai1,...,ir , r ≥ 3,
where ar,i = l′nT f ri , ai1,...,ir = l′nT (fi1 · · · fir), and i1, . . . , ir are not all the same.
Lemma 4.1 shows clearly that the higher-order cumulants or joint cumulants of vi are
proportional to the higher-order cumulants kr of the original errors vit. This suggests
that when kr = 0, r = 3, . . . , 10, vi are essentially iid and hence the conclusion of
Proposition 4.1 holds in light of the results of Yang (2015) for the iid bootstrap. Similarly,
the conclusion of Proposition 4.2 also holds.
When kr 6= 0 for some or all r = 3, . . . , 10, v′i are no longer iid. First, ar,i are
constant across i only when r = 1 and 2, i.e., a1,i = 0 and a2,i = 1. Thus, κr(vi), r ≥ 3,
are not constant across i unless kr = 0. Second, v′is are not independent as ai1,...,ir 6= 0
for r ≥ 3. The latter may cause more problem as it is known that the iid bootstrap is
unable to capture dependence. However, noting that the proportionality constants ai1,...,ir
are all pure numbers, being the sum of elementwise products of the orthonormal vectors
fi, intuitively they should be small, and the larger the r, the smaller the ai1,...,ir .13
These suggest that the higher-order dependence among vi can largely be ignored. The
question left is how well the two sets of cumulants match.
13We are unable to further characterize these quantities. However, as they are pure numbers depending
on n and T through FT,T−1 and Fn,n−1, it should be indicative to present some of their values. With the
eigenvector-based transformations defined above (2.2) and calculated using Matlab eig function, we have,
for n = 100 and T = 3, a1,2,3 = −5.6e−5, a1,2,3,4 = 3.4e−5, and a1,2,3,4,5 = −3.7e−7; and for n = 200, the
same set of numbers become 2.3e−5,−3.8e−6 and 1.3e−8. With Helmert transformations (see Footnote 5),
these numbers become much smaller (< 1.0e−19).
18
Forthcoming in Regional Science and Urban Economics

Lemma 4.2 Let v? be a random draw from vi, i = 1, . . . , N. Then, under the
conditions of Lemma 4.1, we have
κ?1(v?) = 0, κ?2(v?) = σ20 +Op(N
−1/2), and κ?r(v?) = krar +Op(N
−1/2), r ≥ 3,
where ar = 1N
∑Ni=1 ar,i, and κ?r(·) denotes rth cumulant w.r.t. the EDF GN of vi, i =
1, . . . , N.
Lemma 4.2 shows that the iid bootstrap is able to capture, to a certain degree, the
higher-order moments of vi (ar versus ar,i), but is unable to capture the higher-order
dependence. However, as argued below Lemma 4.1, the latter does not have a significant
effect as such dependence is weak and negligible. As both ar,i and their variability are
not big and get smaller as r increases,14 the results of Lemmas 4.1-4.3 strongly suggest
that the simple iid bootstrap method may be able to give a good approximation in the
situations where the original errors are not far from normal.
Lemma 4.3 Suppose Assumptions A1-A8 and the conditions of Lemma 4.1 hold. Let
v? be a random draw from the EDF GN of v1, . . . , vN, and v? a random draw from the
EDF GN of v1 . . . ,vN. Then,
κ?r(v?) = κ?r(v
?) +Op(N−1/2), or κr(GN ) = κr(GN ) +Op(N
−1/2), r ≥ 3,
where κ?r(v?) is the rth cumulant of v? w.r.t. GN , and κ?r(v
?) is the rth cumulant of v?
w.r.t. GN .
In case of severe nonnormality of the original errors so that the transformed errors are
far from being iid, it may be more important to be able to match the even moments, in
particular the kurtosis, than the odd moments, as ar,i is typically small on average with
moderate variability when r is odd, see Footnote 13. This point is also reflected by the
fact that the variance of the joint score function (given in Theorem A.1) is free from the
third cumulant of the original errors. In this spirit, the simple two-point distribution with
equal probability described in Footnote 12 may provide satisfactory results.
Lemma 4.4 Suppose Assumptions A1-A8 and the conditions of Lemma 4.1 hold. Let
v?i = viε?, where ε? is independent of vi, having a distribution with mean 0 and rth
moment 1, r ≥ 2. Then,
E?(v?i ) = 0, and E?[(v?i )r] = vri , r ≥ 2,
where E? corresponds to the distribution of ε?.
14Again, we are unable to further characterize these pure constants. To have some concrete idea,
we have calculated the mean and standard deviation of ar,i for n = 100, T = 3 and r = 3, 4, 5, 6:
(−.0020, .0827), (.1245, .0679), (−.0010, .0425), (.0308, .0299). When n = 500, the same set of values
becomes: (.0008, .0751), (.1141, .0714), (.0010, .0360), (.0263, .0281). With Helmert transformations, these
numbers become slightly bigger.
19
Forthcoming in Regional Science and Urban Economics
Lemma 4.3 shows that moving from the model errors to their observed counterparts
introduces errors of smaller order and hence can be ignored asymptotically. With the
results of Lemma 4.4, the validity of the wild bootstrap follows. The proofs of Lemmas
4.1-4.4 are given in Appendix C.
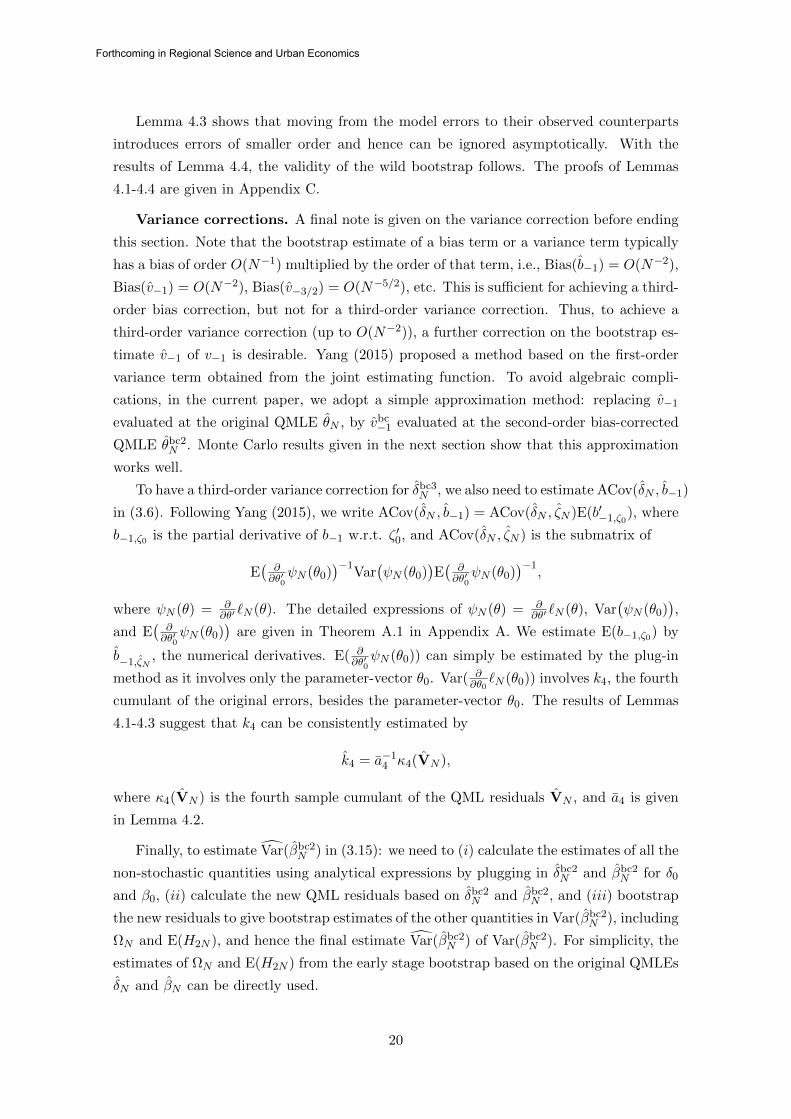
Variance corrections. A final note is given on the variance correction before ending
this section. Note that the bootstrap estimate of a bias term or a variance term typically
has a bias of order O(N−1) multiplied by the order of that term, i.e., Bias(b−1) = O(N−2),
Bias(v−1) = O(N−2), Bias(v−3/2) = O(N−5/2), etc. This is sufficient for achieving a third-
order bias correction, but not for a third-order variance correction. Thus, to achieve a
third-order variance correction (up to O(N−2)), a further correction on the bootstrap es-
timate v−1 of v−1 is desirable. Yang (2015) proposed a method based on the first-order
variance term obtained from the joint estimating function. To avoid algebraic compli-
cations, in the current paper, we adopt a simple approximation method: replacing v−1
evaluated at the original QMLE θN , by vbc−1 evaluated at the second-order bias-corrected
QMLE θbc2N . Monte Carlo results given in the next section show that this approximation
works well.
To have a third-order variance correction for δbc3N , we also need to estimate ACov(δN , b−1)
in (3.6). Following Yang (2015), we write ACov(δN , b−1) = ACov(δN , ζN )E(b′−1,ζ0), where
b−1,ζ0 is the partial derivative of b−1 w.r.t. ζ ′0, and ACov(δN , ζN ) is the submatrix of
E(∂∂θ′0
ψN (θ0))−1
Var(ψN (θ0)
)E(∂∂θ′0
ψN (θ0))−1
,
where ψN (θ) = ∂∂θ′ `N (θ). The detailed expressions of ψN (θ) = ∂
∂θ′ `N (θ), Var(ψN (θ0)
),
and E(∂∂θ′0
ψN (θ0))
are given in Theorem A.1 in Appendix A. We estimate E(b−1,ζ0) by
b−1,ζN, the numerical derivatives. E( ∂
∂θ′0ψN (θ0)) can simply be estimated by the plug-in
method as it involves only the parameter-vector θ0. Var( ∂∂θ0
`N (θ0)) involves k4, the fourth
cumulant of the original errors, besides the parameter-vector θ0. The results of Lemmas
4.1-4.3 suggest that k4 can be consistently estimated by
k4 = a−14 κ4(VN ),
where κ4(VN ) is the fourth sample cumulant of the QML residuals VN , and a4 is given
in Lemma 4.2.
Finally, to estimate Var(βbc2N ) in (3.15): we need to (i) calculate the estimates of all the
non-stochastic quantities using analytical expressions by plugging in δbc2N and βbc2
N for δ0
and β0, (ii) calculate the new QML residuals based on δbc2N and βbc2
N , and (iii) bootstrap
the new residuals to give bootstrap estimates of the other quantities in Var(βbc2N ), including
ΩN and E(H2N ), and hence the final estimate Var(βbc2N ) of Var(βbc2
N ). For simplicity, the
estimates of ΩN and E(H2N ) from the early stage bootstrap based on the original QMLEs
δN and βN can be directly used.
20
Forthcoming in Regional Science and Urban Economics

5 Monte Carlo Study
Extensive Monte Carlo experiments are conducted to investigate (i) the finite sample
performance of the QMLE δN and the bias-corrected QMLEs δbc2N and δbc3
N , (ii) the impact
of bias corrections for δN on the estimations for β and σ2, and (iii) the impact of bias and
variance correction on the inferences for spatial or regression coefficients. The simulations
are carried out based on the following data generation process (DGP):
Ynt = λ0W1nYnt+X1ntβ10+X2ntβ20+cn0+αt0ln+Unt, Unt = ρ0W2nUnt+Vnt, t = 1, . . . , T.
For all the Monte Carlo experiments, β0 = (β10, β20)′ is set to (1, 1)′ or (.5, .5)′, σ20 = 1,
λ0 and ρ0 take values from −0.5,−0.25, 0, 0.25, 0.5, n = 25, 50, 100, 200, 500, and
T = 3, 10. Each set of Monte Carlo results is based on M = 5000 Monte Carlo samples,
and B = 999 bootstrap samples within each Monte Carlo sample. The FT,T−1 and Fn,n−1
defined above (2.2) are used and calculated using Matlab eig function. The weights
matrices, the regressors, and the idiosyncratic errors are generated as follows.
Weights Matrices. We use four different methods for generating the spatial weights
matrices W1n and W2n: (i) Rook contiguity, (ii) Queen contiguity, (iii) Circular
neighbors, and (iv) Group Interaction. The degree of spatial interactions (number of
neighbors each unit has) specified by layouts (i)-(iii) are all fixed while in (iv) it may grow
with the sample size. This is attained by relating the number of groups k to the sample
size n, e.g., k = n0.5 (Lee, 2004). In this case, the degree of spatial interactions is reflected
by the group sizes generated from U(0.5m, 1.5m), where m = n/k is roughly the average
group size. For more details on generating spatial weights matrices, see Yang (2015).
Regressors. The exogenous regressors are generated according to REG1: Xkntiid∼
N(0, 1)/√
2, and are independent across k = 1, 2, and t = 1, . . . T . In case when the spatial
dependence is in the form of group interaction, the regressors can also be generated
according to REG2: the ith value of the kth regressor in the gth group is such that Xkt,igiid∼
(2zg + zig)/√
10, where (zg, zig)iid∼ N(0, 1) when group interaction scheme is followed;
Xkt,ig are independent across k and t, zg iid, and zig iid.
Error distributions. vit = σ0eit are generated according to DGP1: eit are iid
standard normal; DGP2: en,i are iid normal mixture with 10% of values from N(0, 4)
and the remaining from N(0, 1), standardized to have mean 0 and variance 1; and DGP3:
en,i iid log-normal (i.e., log eitiid∼ N(0, 1)), standardized to have mean 0 and variance 1.
The estimators of spatial parameters. The finite sample performance of the
QMLEs and bias-corrected QMLEs of the spatial parameters is investigated. Partial Monte
Carlo results are reported in Tables 1a, 1b, 2, 3a and 3b, where Tables 1a-1b correspond
to the model with ρ = 0, i.e., the spatial lag (SL) dependence model; Table 2 the model
with λ = 0, i.e., the spatial error (SE) dependence model; and Tables 3a-3b the general
model with both SL and SE (SLE) dependence. All the reported results correspond to the
iid bootstrap method given in Algorithm 4.1. The results (unreported for brevity) using
21
Forthcoming in Regional Science and Urban Economics

the wild bootstrap method described in Algorithm 4.2 show that the wild bootstrap gives
very similar results as the iid bootstrap, consistent with remarks below Lemma 4.2.15
In general, The Monte Carlo results reveal that the regular QMLEs of the spatial
parameters can be very biased, depending on the sample size, the degree of spatial in-
teractions, the parameter values, and the way the regressors are generated, etc. A larger
sample gives a smaller bias; a denser spatial weight matrix results in a larger bias; a smaller
|β| or a larger σ may lead to a larger bias; and non-iid regressors lead to a larger bias
compared with the case of iid regressors. In stark contrast, the bias-corrected estimators
are nearly unbiased in all situations, and in most of the situations considered, a second-
order bias correction has essentially removed the bias of the QMLEs and the third-order
bias correction might not be needed. Finally, the error distribution does not much affect
the finite sample performance of the estimators. Some details are as follows.
First, for each model, comparing the results for the QMLEs (reported and unreported)
under Queen Contiguity and Group Interaction, we see that a denser spatial weight
matrix leads to significantly larger biases, and non-iid regressors (REG2) lead to noticeably
larger biases compared with the iid regressors (REG1). With the two combined, the biases
of the QMLEs can be noticeable even when n = 500 (see Table 1b, case (b); Table 2: case
(b); Table 3b). Second, comparing the results in Table 1a, where β = (1 1)′, with the
corresponding results in Table 1b, where β = (.5 .5)′ and thus the signal-to-noise ratio
(SNR), defined as |E(Y |X)|/sd(Y |X), is halved, we see that reducing the SNR significantly
increases the bias of the QMLE λN of the spatial lag parameter λ in the SL model, in
particular in the case of group interaction spatial layout. Monte Carlo results (unreported
for brevity) reveal a similar phenomenon for λN in the SLE model. However, changing
SNR value by changing β and σ does affect the QMLE ρN of the spatial error parameter
ρ in the SE model, and has little effects on ρN in the SLE model. This is because ρ is a
pure ‘noise parameter’ and estimation of it is invariant of β and σ, at least in the case of
SE model (see Liu and Yang, 2015a). In contrast, λ affects both the signal and the noise
parts of the model, and hence λN is sensitive to changes in either β or σ (see Yang, 2015).
The above discussions about the biases of the QMLEs of the spatial parameters may
also extend to the variabilities of the QMLEs: (i) a denser spatial weight matrix leads to
higher variabilities of the QMLEs λN and ρN in general, (ii) reducing SNR, by reducing
|β| or increasing σ, increases the variability of λN but not that of ρN , (iii) the variability
of ρN increases as ρ decreases in general; the variability of λN increases as λ decreases for
the SL model in general, but not for the SLE model.
It is interesting to note that in the general SLE model, the finite sample performance of
ρN can be much worse than that of λN in terms of both bias and variability. Furthermore,
under the same model setting, thus the same SNR, the ρN of ρ(= 0) for the SE model is
more biased and more variable than λN of λ(= 0) for the SL model. It seems that the
15All the results, unreported but necessary for supporting the subsequent discussions are collected in a
Supplementary Material available from http://www.mysmu.edu/faculty/zlyang/.
22
Forthcoming in Regional Science and Urban Economics

values of λ and ρ affect more on the variabilities of λN and ρN but less on their biases.
The exact causes of these behaviors are unclear and deserves some future research.
In summary, the results show that in general the QMLEs of the spatial panel data
models may need to be bias-corrected even when the sample size is not small, and that
the proposed bias correction method is very effective in removing the bias. As far as bias
correction is concerned, a simple iid bootstrap may well serve the purpose. The method
can easily be applied and thus is recommended to practitioners.
The estimators of non-spatial parameters. The finite sample properties of βN and
σ2N , and their bias-corrected versions βbc
N and σ2,bcN defined in Section 3.4 are investigated.
Monte Carlo results reveal some interesting phenomena. The biases of the non-spatial
estimators βN and σ2N depend very much on whether λN is biased, not much on whether
ρN is biased. In general the biases of βN and σ2N are not problems of serious concern (at
most 6-7% for the experiments considered). Consistent with the discussions in Section 3.4,
βbcN is nearly unbiased in general. When the error distribution is skewed, σ2,bc
N may still
encounter a bias of less than 5% when n = 50 and T = 3, and in this case the method given
in Section 3.4 can be applied for further bias correction. Partial results are summarized
in Table 4. More can be found in the Supplementary Material (see Footnote 15).
Inferences following bias and variance corrections. To demonstrate the poten-
tial gains from bias and variance corrections, we present Monte Carlo results concerning
the finite sample performance of various tests for spatial effects, and the tests concerning
the regression coefficients, presented in Section 3.5. Partial results are summarized in
Tables 5a-5c, and 6. More can be found in the Supplementary Material (see Footnote 15).
Table 5a presents the empirical sizes of, respectively, the joint tests for the lack of both
SL and SE effects given in (3.12), and the one-directional tests for the lack of SL effect
allowing the presence of SE effect or the lack of SE effect allowing the presence of SL effect,
given in (3.13). The results show that the third-order bias and variance corrections on
the spatial estimators lead to tests that can have a much better finite sample performance
over the tests based on the original estimates and asymptotic variances. The tests based
on second-order corrections offer improvements over the asymptotic ones but may not be
satisfactory. All the reported results are based on the wild bootstrap with the perturbation
distribution being the simple two-point (1 and−1) distribution with equal probability. The
results based on iid bootstrap are collected in the Supplementary Material (see Footnote
15). Consistent with the results of Section 4.2, in case of severe nonnormality such as the
lognormal errors (n = 500), the wild bootstrap performs better than the iid bootstrap; in
case of normal errors, the iid bootstrap performs better than the wild bootstrap and both
show excellent performance of the third-order corrected Wald tests. Due to its robustness,
the wild bootstrap may be a better choice in the case of testing for spatial effects. Tables
5b and 5c present the empirical sizes of the tests given in (3.14) for the two simpler models,
from which the same conclusions are drawn.
23
Forthcoming in Regional Science and Urban Economics

Table 6 presents partial results for the empirical sizes of the tests for the equality of the
two regression slopes given in (3.15), based on the iid bootstrap. The results show that the
tests with merely second-order bias and variance corrections significantly outperforms the
standard tests with the original estimate and asymptotic variance. With smaller values of
the slope parameters, the size distortion for the standard tests becomes more persistent.
With a weaker spatial dependence (results unreported), the performance of the asymptotic
test improves, but is still outperformed by the proposed bias-corrected test.
6 Conclusion and Discussion
We have introduced a general method for finite sample bias and variance corrections of
the QMLEs of the two-way fixed effects spatial panel data models where the spatial inter-
actions can be in the form of either spatial lag or spatial error, or both, and the panels can
be either short or long. We have demonstrated that bias and variance corrections lead to
refined inferences for the spatial effects as well as covariate effects. The proposed methods
are seen to be very easy to implement, and very effective. If only bias-correction is of
concern, a second-order correction using iid bootstrap suffices. For improved inferences
for the spatial parameters, a third-order variance correction seems necessary and a wild
bootstrap method seems to perform better. However, for improved inferences concerning
the regression coefficients (the covariate effects), the second-order bias and variance cor-
rections seem sufficient, and the resulting inferences can be much more reliable than those
based on the standard asymptotic methods. The latter observation is perhaps the most
important one in this study, as being able to assess the covariate effects in a reliable man-
ner may be the most desirable feature of econometric modelling activities. All the methods
proposed in the current paper can easily be built into the standard statistical software to
facilitate practical applications (an empirical illustration is given in the Supplementary
Material and the corresponding matlab codes are available therein). The results presented
in this paper reinforce that the general methodology of bias and variance corrections of
Yang (2015), based on stochastic expansion and bootstrap, is indeed a promising approach
in handling the bias issues, and in providing refined inference methods.
Further extensions of the proposed methods are desirable, and are possible at least in
several directions: (i) adding spatial Durbin effects, (ii) studying the direct and indirect
effects, and (iii) adding higher-order spatial effects. As indicated in Footnote 10, the
spatial Durbin model and spatial Durbin error model are simple extensions of the SL and
SE models by replacing XN by [XN WNXN ], and hence can be studied using the same
techniques developed for the SL and SE models. What is interesting here may be that
the tests given in (3.15) can be adapted to give improved tests for the existence of spatial
Durbin effects, and that the ideas behind the developments of the improved inferences for
the regression coefficients, i.e., (3.8), (3.9), and (3.15), may be extended to give improved
inferences for the direct and indirect effects, as the measures of direct and indirect effects
24
Forthcoming in Regional Science and Urban Economics

are all smooth functions of the regression coefficients and the spatial parameters (see, e.g.,
Elhorst, 2014; LeSage and Pace, 2014).16 While these studies are very important, they
are beyond the scope of the paper and will be carried out in a future research.
Appendix A: Some First-Order Results
The following list summarizes some frequently used notations in the paper:
• δ = (λ, ρ)′, and δ0 is its true value.
• For an integerm, Jm = Im− 1m lml
′m where lm is anm×1 vector of ones. [Fm,m−1,
1√mlm]
is the eigenvector matrix of Jm, where Fm,m−1 corresponds to eigenvalue of ones.
• W ∗hn = F ′n,n−1WhnFn,n−1, h = 1, 2.
• An(λ) = In − λW1n and Bn(ρ) = In − ρW2n.
• [Z∗n1, . . . , Z∗n,T−1] = F ′n,n−1[Zn1, . . . , ZnT ]FT,T−1 for any n×T matrix [Zn1, · · · , ZnT ].
• YN = (Y ∗′n1, . . . , Y∗′n,T−1)′, XN = (X∗′n1, . . . , X
∗′n,T−1)′, and WhN = IT−1 ⊗W ∗hn, h =
1, 2.
• AN (λ) = IN − λW1N , and BN (ρ) = IN − ρW2N .
• MN (ρ) = B′N (ρ)IN −XN (ρ)[X′N (ρ)XN (ρ)]−1X′N (ρ)BN (ρ).
The following set of regularity conditions from Lee and Yu (2010b) are sufficient for
the√N -consistency of the QMLE δnT defined by maximizing (2.8), and hence the
√N -
consistency of the QMLEs βN and σ2N of β and σ2, which are clearly essential for the
development of the higher-order results for the QMLEs.
Assumption A1. W1n and W2n are row-normalized nonstochastic spatial weights
matrices with zero diagonals.
Assumption A2. The disturbances vit, i = 1, 2, . . . , n and t = 1, 2, . . . , T, are iid
across i and t with zero mean, variance σ20 and E|vit|4+η <∞ for some η > 0.
Assumption A3. An(λ) and Bn(ρ) are invertible for all λ ∈ Λ and ρ ∈ P, where
Λ and P are compact intervals. Furthermore, λ0 is in the interior of Λ, and ρ0 is in the
interior of P.17
16We are grateful to a referee for raising the issues related to spatial Durbin, direct and indirect effects.17Due to the nonlinearity of λ and ρ in the model, compactness of Λ and P is needed. However, the
compactness of the space of β and σ2 is not necessary because the β and σ2 estimates given λ and ρ are
least squares type estimates.
25
Forthcoming in Regional Science and Urban Economics
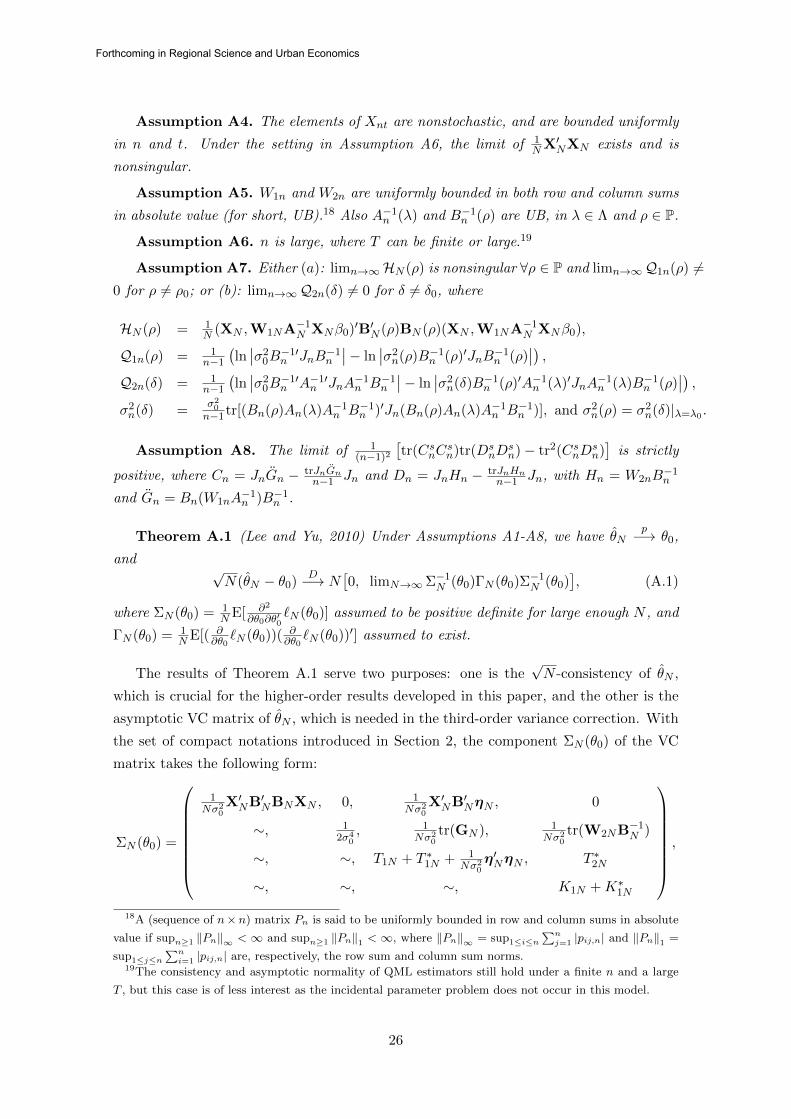
Assumption A4. The elements of Xnt are nonstochastic, and are bounded uniformly
in n and t. Under the setting in Assumption A6, the limit of 1NX′NXN exists and is
nonsingular.
Assumption A5. W1n and W2n are uniformly bounded in both row and column sums
in absolute value (for short, UB).18 Also A−1n (λ) and B−1
n (ρ) are UB, in λ ∈ Λ and ρ ∈ P.
Assumption A6. n is large, where T can be finite or large.19
Assumption A7. Either (a): limn→∞HN (ρ) is nonsingular ∀ρ ∈ P and limn→∞Q1n(ρ) 6=0 for ρ 6= ρ0; or (b): limn→∞Q2n(δ) 6= 0 for δ 6= δ0, where
HN (ρ) = 1N (XN ,W1NA−1
N XNβ0)′B′N (ρ)BN (ρ)(XN ,W1NA−1N XNβ0),
Q1n(ρ) = 1n−1
(ln∣∣σ2
0B−1′n JnB
−1n
∣∣− ln∣∣σ2n(ρ)B−1
n (ρ)′JnB−1n (ρ)
∣∣) ,Q2n(δ) = 1
n−1
(ln∣∣σ2
0B−1′n A−1′
n JnA−1n B−1
n
∣∣− ln∣∣σ2n(δ)B−1
n (ρ)′A−1n (λ)′JnA
−1n (λ)B−1
n (ρ)∣∣) ,
σ2n(δ) =
σ20
n−1tr[(Bn(ρ)An(λ)A−1n B−1
n )′Jn(Bn(ρ)An(λ)A−1n B−1
n )], and σ2n(ρ) = σ2
n(δ)|λ=λ0 .
Assumption A8. The limit of 1(n−1)2
[tr(CsnC
sn)tr(Ds
nDsn)− tr2(CsnD
sn)]
is strictly
positive, where Cn = JnGn − trJnGnn−1 Jn and Dn = JnHn − trJnHn
n−1 Jn, with Hn = W2nB−1n
and Gn = Bn(W1nA−1n )B−1
n .
Theorem A.1 (Lee and Yu, 2010) Under Assumptions A1-A8, we have θNp−→ θ0,
and√N(θN − θ0)
D−→ N[0, limN→∞Σ−1
N (θ0)ΓN (θ0)Σ−1N (θ0)
], (A.1)
where ΣN (θ0) = 1NE[ ∂2
∂θ0∂θ′0`N (θ0)] assumed to be positive definite for large enough N , and
ΓN (θ0) = 1NE[( ∂
∂θ0`N (θ0))( ∂
∂θ0`N (θ0))′] assumed to exist.
The results of Theorem A.1 serve two purposes: one is the√N -consistency of θN ,
which is crucial for the higher-order results developed in this paper, and the other is the
asymptotic VC matrix of θN , which is needed in the third-order variance correction. With
the set of compact notations introduced in Section 2, the component ΣN (θ0) of the VC
matrix takes the following form:
ΣN (θ0) =
1Nσ2
0X′NB′NBNXN , 0, 1
Nσ20X′NB′NηN , 0
∼, 12σ4
0, 1
Nσ20tr(GN ), 1
Nσ20tr(W2NB−1
N )
∼, ∼, T1N + T ∗1N + 1Nσ2
0η′NηN , T ∗2N
∼, ∼, ∼, K1N +K∗1N
,
18A (sequence of n×n) matrix Pn is said to be uniformly bounded in row and column sums in absolute
value if supn≥1 ‖Pn‖∞ < ∞ and supn≥1 ‖Pn‖1 < ∞, where ‖Pn‖∞ = sup1≤i≤n∑nj=1 |pij,n| and ‖Pn‖1 =
sup1≤j≤n∑ni=1 |pij,n| are, respectively, the row sum and column sum norms.
19The consistency and asymptotic normality of QML estimators still hold under a finite n and a large
T , but this case is of less interest as the incidental parameter problem does not occur in this model.
26
Forthcoming in Regional Science and Urban Economics

where ηN = BNGNXNβ0, T ∗1N = 1N tr(B′−1
N G′NB′NBNGNB−1N ), K∗1N = 1
N tr(B′−1N W′
2NW2NB−1N ),
and T ∗2N = 1N tr(B′−1
N G′NW′2N + B′−1
N G′NB′NW2NB−1N ).
To obtain the other component ΓN (θ0) of the VC matrix, it is helpful to express the
score vector in terms of the original errors using (4.7):
1
N
∂`N (θ0)
∂θ0=
1Nσ2
0A′1nTVnT
− 12σ2
0+ 1
2Nσ40V′nTA′2nTVnT
−T0N + 1Nσ2
0V′nTA′3nTVnT + 1
Nσ20b′nTVnT
−K0N + 1Nσ2
0V′nTA′4nTVnT
where bnT = FnT,NηN , A1nT = FnT,NBNXN , A2nT = FnT,NF′nT,N , A3nT = FnT,NBN
·GNB−1N F′nT,N , and A4nT = FnT,NW2NB−1
N F′nT,N . Letting ainT be the diagonal vector of
AinT , and denoting
Πij = 1N tr[AinT (AjnT + A′jnT )] + 1
N k4a′inTajnT ,
we obtain, referring to Lemma A.4 of Lee and Yu (2010b) and its proof,
ΓN (θ0) =
1Nσ2
0X′NB′NBNXN , 0, 1
Nσ20A′1nTbnT , 0
∼, 14σ4
0Π22,
12σ2
0Π23,
12σ2
0Π24
∼, ∼, Π33 + 1Nσ2
0b′nTbnT , Π34
∼, ∼, ∼, Π44
.
Appendix B: Some Higher-Order Results
Derivatives of MN (ρ) defined below (2.7).
We have MN (ρ) = CN (ρ) − CN (ρ)XNDN (ρ)X′NCN (ρ) where CN (ρ) = B′N (ρ)BN (ρ)
and DN (ρ) = [X′NCN (ρ)XN ]−1. Let C(k)N (ρ) and D
(k)N (ρ) be, respectively, the kth order
partial derivatives of CN (ρ) and DN (ρ) w.r.t. ρ. The derivatives of MN (ρ) are:
M(1)N (ρ) = C
(1)N (ρ)− C(1)
N (ρ)XNDN (ρ)X′NCN (ρ)− CN (ρ)XND(1)N (ρ)X′NCN (ρ)
−CN (ρ)XNDN (ρ)X′NC(1)N (ρ),
M(2)N (ρ) = C
(2)N (ρ)− C(2)
N (ρ)XNDN (ρ)X′NCN (ρ)− 2C(1)N (ρ)XND
(1)N (ρ)X′NCN (ρ)
−2C(1)N (ρ)XNDN (ρ)X′NC
(1)N (ρ)− 2CN (ρ)XND
(1)N (ρ)X′NC
(1)N (ρ)
−CN (ρ)XND(2)N (ρ)X′NCN (ρ)− CN (ρ)XNDN (ρ)X′NC
(2)N (ρ)
M(3)N (ρ) = −3C
(2)N (ρ)XND
(1)N X′NCN (ρ)− 3C
(2)N (ρ)XNDN (ρ)X′NC
(1)N (ρ)
−3C(1)N (ρ)XND
(2)N (ρ)X′NCN (ρ)− 6C
(1)N (ρ)XND
(1)N (ρ)X′NC
(1)N (ρ)
−3C(1)N (ρ)XNDN (ρ)X′NC
(2)N (ρ)− 3CN (ρ)XND
(2)N (ρ)X′NC
(1)N (ρ)
−3CN (ρ)XND(1)N (ρ)X′NC
(2)N (ρ)− CN (ρ)XND
(3)N (ρ)X′NCN (ρ)
M(4)N (ρ) = −6C
(2)N (ρ)XND
(2)N X′NCN (ρ)− 12C
(2)N (ρ)XND
(1)N (ρ)X′NC
(1)N (ρ)
27
Forthcoming in Regional Science and Urban Economics

−6C(2)N (ρ)XNDN (ρ)X′NC
(2)N (ρ)− 4C
(1)N (ρ)XND
(3)N (ρ)X′NCN (ρ)
−4CN (ρ)XND(3)N (ρ)X′NC
(1)N (ρ)− 12C
(1)N (ρ)XND
(2)N (ρ)X′NC
(1)N (ρ)
−12C(1)N (ρ)XND
(1)N (ρ)X′NC
(2)N (ρ)− 6CN (ρ)XND
(2)N (ρ)X′NC
(2)N (ρ)
−CN (ρ)XND(4)N (ρ)X′NCN (ρ).
For the derivatives of CN (ρ), we have C(1)N (ρ) = −W′
2NBN (ρ)−B′N (ρ)W2N , C(2)N (ρ) =
2W′2NW2N , and C
(k)N (ρ) = 0, k ≥ 3. For the derivatives of DN (ρ), denoting PN (ρ) =
X′NCN (ρ)XN and its kth derivative P(k)N (ρ), we have,
D(1)N (ρ) = −DN (ρ)P
(1)N (ρ)DN (ρ),
D(2)N (ρ) = −D(1)
N (ρ)P(1)N (ρ)DN (ρ)−DN (ρ)P
(2)N (ρ)DN (ρ)−DN (ρ)P
(1)N (ρ)D
(1)N (ρ),
D(3)N (ρ) = −D(2)
N (ρ)P(1)N (ρ)DN (ρ)−DN (ρ)P
(1)N (ρ)D
(2)N (ρ)− 2D
(1)N (ρ)P
(2)N (ρ)DN (ρ)
−2D(1)N (ρ)P
(1)N (ρ)D
(1)N (ρ)− 2DN (ρ)P
(2)N (ρ)D
(1)N (ρ),
D(4)N (ρ) = −D(3)
N (ρ)P(1)N (ρ)DN (ρ)−DN (ρ)P
(1)N (ρ)D
(3)N (ρ)− 3D
(2)N (ρ)P
(2)N (ρ)DN (ρ)
−3D(2)N (ρ)P
(1)N (ρ)D
(1)N (ρ)− 3D
(1)N (ρ)P
(1)N (ρ)D
(2)N (ρ)− 3DN (ρ)P
(2)N (ρ)D
(2)N (ρ)
−6D(1)N (ρ)P
(2)N (ρ)D
(1)N (ρ).
Clearly, P(k)N (ρ) can be obtained from C
(k)N (ρ), and both are zero when k ≥ 3.
Additional quantities required in (3.10).
Letting E(Q(1)N ) = (s1, s2), qN = (s3, s4) and E[Q
(2)N (δ0) = (s5, s6, s7, s8), we have
s1 = −2β′0X′NG′1NMNXNβ0 − 2σ2
0tr[GNMN (B′NBN )−1],
s2 = 2β′0X′NM
(1)N XNβ0 + σ2
0tr[M(1)N (B′NBN )−1],
s3 = −4β′0X′NG′1NMNB−1
N VN − 2V′NB′NGNMNB−1N VN + 2σ2
0tr[GNMN (B′NBN )−1],
s4 = 2β′0X′NM
(1)N B−1
N VN + V′NB′ −1N M
(1)N B−1
N VN − σ20tr[M
(1)N (B′NBN )−1],
s5 = 2β′0X′NG′1NMNGNXNβ0 + 2σ2
0tr[G′1NMNGN (B′NBN )−1],
s6 = q7 = −2β′0X′NG′1NM
(1)N XNβ0 − 2σ2
0tr[GNM(1)N (B′NBN )−1],
s8 = β′0X′NM
(2)N XNβ0 + σ2
0tr[M(2)N (B′NBN )−1],
where MN ≡MN (ρ0) and M(k)N ≡M
(k)N (ρ0).
Appendix C: Proofs for Section 4
Proof of Lemma 4.1: The results of (a) follows from the following properties of
cumulants: for two independent random variables X and Y and a constant c, (i) κ1(X +
c) = κ1(X) + c, (ii) κr(X + c) = κr(X), r ≥ 2, (iii) κr(cX) = crκr(X), and (iv) κr(X +
Y ) = κr(X) + κr(Y ). See, e.g., Kendall and Stuart (1969, Sec. 3.12). The results of (b)
follows from the definition of the joint cumulants, and some tedious derivations.
28
Forthcoming in Regional Science and Urban Economics

Proof of Lemma 4.2: Note that the rth cumulant w.r.t. the EDF GN of vi, i =
1, . . . , N is just the rth sample cumulant of vi, i = 1, . . . , N. This immediately gives
κ?1(v?) = 1N
∑Ni=1 vi = 0.
To show κ?2(v?) = σ20 + Op(N
−1/2), note that E(κ?2(v?)) = 1NE(V′NVN ) = σ2
0. From
Lemma 4.1, we have Var(v2i ) = k4a4,i + 2σ4
0, Cov(v2i ,v
2j ) = k4ai,i,j,j = k4
∑Nm=1 f
2mif
2mj ,
and thus
Var( 1NV′NVN ) = 1
N2
∑Ni=1 Var(v2
i ) + 2N2
∑Ni=1
∑Nj 6=i Cov(v2
i ,v2j )
= 1N (k4a4 + 2σ4
0) + 2N2k4
∑Ni=1
∑Nj 6=i∑N
m=1 f2mif
2mj
= 1N (k4a4 + 2σ4
0) + 2N2k4
∑Ni=1
∑Nj=1
∑Nm=1 f
2mif
2mj − 2
N k4a4
= 1N (k4a4 + 2σ4
0) + 2N2k4
∑Nm=1(
∑Ni=1 f
2mi)(
∑Nj=1 f
2mj)− 2
N k4a4
= O(N−1),
due to the fact that∑N
i=1 f2mi is bounded, uniformly in m = 1, 2, . . . , nT . It follows by the
generalized Chebyshev’s inequality that κ?2(v?) = σ20 +Op(N
−1/2).
For the general results with r ≥ 3, it is easy to verify that E(κ?r(v?)) = krar+O(N−1/2).
By the results of Lemma 4.1 and the fact that∑N
i=1 |fmi|r is bounded, uniformly in m =
1, 2, . . . , nT , it is straightforward, though tedious, to show that Var(κ?r(v?)) = O(N−1).
The result thus follows.
Proof of Lemma 4.3: As VN is defined by replacing θ0 in VN by θN , the result
follows directly from the√N -consistency of θN .
Proof of Lemma 4.4: The proof is trivial.
References
Anselin, L., 1988. Spatial Econometrics: Methods and Models. The Netherlands: Kluwer
Academic Publishers.
Anselin, L., Le Gallo, J., Jayet, J., 2008. Spatial panel econometrics. In: Matyas, L.,
Sevestre, P. (Eds.), The Econometrics of Panel Data: Fundamentals and Recent
Developments in Theory and Practice. Springer-Verlag, Berlin Heidelberg.
Arellano, M., Hahn, J., 2005. Understanding bias in non-linear panel models: some
recent developments. In: R. Blundell, W. K. Newey and T. Persson (Eds.), Advances
in Econometrics and Economics: Theory and Applications, IXth World Congress,
Volume II, Econometric Society Monographs.
Baltagi, B., Song, S. H., Kon, W., 2003. Testing panel data regression models with
spatial error correlation. Journal of Econometrics 117, 123-150.
29
Forthcoming in Regional Science and Urban Economics

Baltagi, B., Egger, P., Pfaffermayr, M., 2013. A generalised spatial panel data model
with random effects. Econometric Reviews 32, 650-685.
Baltagi, B. H., Yang, Z. L., 2013a. Standardized LM tests for spatial error dependence
in linear or panel regressions. The Econometrics Journal 16, 103-134.
Baltagi, B. H., Yang, Z. L., 2013b. Heteroskedasticity and non-normality robust LM
tests for spatial dependence. Regional Science and Urban Economics 43, 725-739.
Bao, Y., 2013. Finite sample bias of the QMLE in spatial autoregressive models. Econo-
metric Theory 29, 68-88.
Bao, Y., Ullah, A., 2007. Finite sample properties of maximum likelihood estimator in
spatial models. Journal of Econometrics 137, 396-413.
Bun, M. J. G., Carree, M. A., 2005. Bias-corrected estimation in dynamic panel data
models. Journal of Business and Economic Statistics 23, 200-210.
Davidson, R., Flachaire, E., 2008. The wild bootstrap, tamed at last. Journal of Econo-
metrics 146, 162
Debarsy, N., Ertur, C. , 2010. Testing for spatial autocorrelation in a fixed effects panel
data model. Regional Science and Urban Economics 40, 453-470.
Elhorst, J. P., 2014. Spatial Econometrics from Cross-Sectional Data to Spatial Panels.
Springer.
Griffith, D. A. 1988. Advanced Spatial Statistics. Kluwer, Dordrecht, the Netherlands.
Hahn J., Kuersteiner, G., 2002. Asymptotically unbiased inference for a dynamic panel
model with fixed effects when both n and T are large. Econometrica 70, 1639-1657.
Hahn J., Moon, H. R., 2006. Reducing bias in MLE in a dynamic panel data model.
Econometric Theory 22, 499-512.
Hahn J., Newey, W., 2004. Jackknife and analytical bias reduction for nonlinear panel
models. Econometrica 72, 1295-1319.
Kapoor, M., Kelejian H. H., Prucha, I. R., 2007. Panel data models with spatially
correlated error components. Journal of Econometrics 140, 97-130.
Kendall, M. G., Stuart, A., 1969. Advanced Theory of Statistics, Vol. 1, 3rd Ed. Griffin,
London.
Kiviet, J. F., 1995. On bias, inconsistency, and efficiency of various estimators in dynamic
panel data models. Journal of Econometrics 68, 53-78.
Lancaster, T., 2000. Incidental parameter problem since 1948. Journal of Econometrics
95, 391-413.
Lee, L. F., 2004. Asymptotic distributions of quasi-maximum likelihood estimators for
spatial autoregressive models. Econometrica 72, 1899-1925.
30
Forthcoming in Regional Science and Urban Economics

Lee, L. F., Yu, J., 2010a. Some recent developments in spatial panel data models.
Regional Science and Urban Economics 40, 255-271.
Lee, L. F., Yu, J., 2010b. Estimation of spatial autoregressive panel data models with
fixed effects. Journal of Econometrics 154, 165-185.
Lee, L. F., Yu, J., 2015. Spatial panel data models. In: Baltagi, B. H. (Eds.), The Oxford
Handbook of Panel Data. Oxford University Press, New York, NY, pp. 363-400.
Lee, L. F., Yu, J., 2016. Identification of spatial Durbin models. Journal of Applied
Econometrics 31, 133-162.
LeSage, J. P., Pace, R. K., 2014. The biggest myth in spatial econometrics. Econometrics
2, 217-249.
Liu, R.Y., 1988. Bootstrap procedures under some non-I.I.D. models. Annals of Statistics
16, 1696-1708.
Liu, S. F., Yang, Z. L., 2015a. Asymptotic distribution and finite-sample bias correction
of QML estimators for spatial error dependence model. Econometrics 3, 376-411.
Liu, S. F., Yang, Z. L., 2015b. Improved inferences for spatial regression models. Regional
Science and Urban Economics 55, 55-67..
Mammen, E., 1993. Bootstrap and wild bootstrap for high dimensional linear models.
Annals of Statistics 21, 255
Neyman, J., Scott, E. L., 1948. Consistent estimates based on partially consistent obser-
vations. Econometrica 16, 1-32.
Nickell, S., 1981. Biases in dynamic models with fixed effects. Econometrica 39, 383-396.
Rilstone, P., Srivastava, V. K., Ullah, A., 1996. The second-order bias and mean squared
error of non-linear estimators. Journal of Econometrics 75, 369-395.
Su, L. J., Yang Z. L., 2015. QML estimation of dynamic panel data models with spatial
errors. Journal of Econometrics 185, 230-258.
Yang, Z. L., 2015. A general method for third-order bias and variance corrections on a
nonlinear estimator. Journal of Econometrics 186, 178-200.
Yu, J., de Jong, R., Lee, L. F., 2008. Quasi maximum likelihood estimators for spatial
dynamic panel data with fixed effects when both n and T are large. Journal of
Econometrics 146, 118-134.
Yu, J., de Jong, R., Lee, L. F., 2012. Estimation of spatial dynamic panel data with
fixed effects: The case of spatial cointegration. Journal of Econometrics 167, 16-37.
Yu, J., Lee, L. F., 2010. Estimation of unit root spatial dynamic panel data models.
Econometric Theory 26, 1332-1362.
31
Forthcoming in Regional Science and Urban Economics

Table 1a. Empirical Mean[rmse](sd) of Estimators of λ, 2FE-SPD Model with SLD, T = 3, β = (1,1)′, σ = 1
λ λN λbc2N λbc3N λN λbc2N λbc3N
(a) Queen Contiguity, REG1 (b) Group Interaction, REG2
Normal Error, n=50
.50 .484[.120](.119) .502[.120](.120) .502[.120](.120) .469[.095](.089) .497[.088](.088) .499[.088](.088)
.25 .234[.142](.141) .248[.143](.143) .250[.143](.143) .210[.130](.124) .250[.123](.123) .251[.123](.123)
.00 -.010[.158](.158) .001[.161](.161) .002[.161](.161) -.049[.167](.159) -.001[.160](.160) .001[.160](.160)
-.25 -.258[.161](.161) -.251[.164](.164) -.250[.165](.165) -.303[.189](.182) -.250[.184](.184) -.248[.184](.184)
-.50 -.504[.163](.163) -.503[.166](.166) -.502[.167](.167) -.565[.214](.204) -.509[.208](.208) -.507[.208](.208)
Normal Mixture, n=50
.50 .483[.119](.117) .500[.118](.118) .501[.118](.118) .470[.091](.086) .498[.084](.084) .499[.084](.084)
.25 .238[.139](.139) .253[.141](.141) .254[.141](.141) .209[.128](.121) .248[.120](.120) .249[.120](.120)
.00 -.013[.155](.154) -.002[.157](.157) -.001[.157](.157) -.048[.160](.152) -.001[.153](.153) .001[.153](.153)
-.25 -.257[.158](.158) -.251[.161](.161) -.250[.162](.162) -.301[.188](.181) -.248[.182](.182) -.247[.183](.183)
-.50 -.504[.163](.163) -.503[.166](.166) -.503[.167](.167) -.556[.206](.199) -.500[.203](.203) -.498[.203](.203)
Lognormal Error, n=50
.50 .485[.111](.110) .501[.111](.111) .502[.111](.111) .470[.090](.085) .497[.083](.083) .498[.083](.083)
.25 .239[.133](.133) .253[.134](.134) .254[.134](.134) .212[.122](.116) .249[.115](.115) .251[.115](.115)
.00 -.010[.146](.146) .001[.149](.149) .002[.149](.149) -.045[.154](.147) .000[.147](.147) .002[.147](.147)
-.25 -.255[.151](.151) -.249[.154](.154) -.248[.154](.154) -.302[.178](.171) -.251[.173](.173) -.250[.173](.173)
-.50 -.498[.152](.152) -.499[.155](.155) -.499[.156](.156) -.556[.204](.196) -.503[.200](.200) -.501[.200](.200)
Normal Error, n=100
.50 .493[.079](.078) .502[.078](.078) .502[.078](.078) .482[.067](.065) .500[.064](.064) .501[.064](.064)
.25 .243[.095](.095) .251[.095](.095) .252[.095](.095) .222[.096](.092) .248[.092](.092) .248[.092](.092)
.00 -.007[.110](.109) .000[.110](.110) .000[.110](.110) -.031[.123](.119) .000[.120](.120) .001[.120](.120)
-.25 -.255[.114](.114) -.250[.115](.115) -.250[.115](.115) -.289[.146](.141) -.254[.143](.143) -.253[.143](.143)
-.50 -.503[.117](.117) -.501[.118](.118) -.501[.118](.118) -.538[.162](.158) -.503[.162](.162) -.503[.162](.162)
Normal Mixture, n=100
.50 .490[.078](.078) .499[.078](.078) .500[.078](.078) .482[.067](.065) .500[.065](.065) .500[.065](.065)
.25 .241[.095](.095) .249[.095](.095) .250[.095](.095) .224[.095](.091) .250[.091](.091) .250[.091](.091)
.00 -.006[.106](.106) .001[.107](.107) .002[.107](.107) -.034[.122](.117) -.002[.118](.118) -.002[.118](.118)
-.25 -.255[.112](.112) -.250[.113](.113) -.250[.113](.113) -.286[.144](.140) -.251[.142](.142) -.250[.142](.142)
-.50 -.502[.117](.117) -.499[.119](.119) -.499[.119](.119) -.535[.160](.156) -.500[.159](.159) -.500[.159](.159)
Lognormal Error, n=100
.50 .492[.075](.075) .501[.075](.075) .501[.075](.075) .482[.065](.062) .500[.062](.062) .500[.062](.062)
.25 .242[.091](.091) .250[.091](.091) .250[.091](.091) .225[.093](.090) .250[.090](.090) .250[.090](.090)
.00 -.006[.102](.102) .001[.103](.103) .001[.103](.103) -.029[.116](.113) .001[.113](.113) .002[.113](.113)
-.25 -.255[.110](.110) -.250[.111](.111) -.250[.111](.111) -.283[.138](.134) -.249[.136](.136) -.248[.136](.136)
-.50 -.503[.112](.112) -.500[.113](.113) -.500[.113](.113) -.526[.157](.154) -.492[.159](.159) -.495[.159](.159)
Normal Error, n=500
.50 .498[.033](.033) .500[.033](.033) .500[.033](.033) .495[.034](.033) .500[.033](.033) .500[.033](.033)
.25 .249[.040](.040) .251[.041](.041) .251[.041](.041) .242[.050](.049) .249[.049](.049) .249[.049](.049)
.00 -.001[.047](.047) .000[.047](.047) .000[.047](.047) -.009[.065](.064) .000[.065](.065) .000[.065](.065)
-.25 -.252[.050](.050) -.251[.050](.050) -.251[.050](.050) -.260[.080](.079) -.249[.079](.079) -.249[.079](.079)
-.50 -.501[.050](.050) -.501[.050](.050) -.501[.050](.050) -.514[.096](.095) -.501[.095](.095) -.501[.095](.095)
Normal Mixture, n=500
.50 .498[.033](.033) .500[.033](.033) .500[.033](.033) .495[.034](.033) .500[.033](.033) .500[.033](.033)
.25 .249[.040](.040) .250[.040](.040) .250[.040](.040) .242[.050](.049) .249[.049](.049) .249[.049](.049)
.00 -.002[.045](.045) -.001[.045](.045) -.001[.045](.045) -.007[.066](.066) .002[.066](.066) .002[.066](.066)
-.25 -.251[.048](.048) -.250[.048](.048) -.250[.048](.048) -.261[.081](.081) -.250[.081](.081) -.250[.081](.081)
-.50 -.501[.050](.050) -.500[.050](.050) -.500[.050](.050) -.514[.095](.094) -.501[.094](.094) -.501[.094](.094)
Lognormal Error, n=500
.50 .498[.032](.032) .500[.032](.032) .500[.032](.032) .496[.034](.034) .501[.034](.034) .501[034](.034)
.25 .248[.040](.040) .250[.040](.040) .250[.040](.040) .243[.050](.049) .250[.049](.049) .250[.049](.049)
.00 -.003[.046](.046) -.001[.046](.046) -.001[.046](.046) -.009[.065](.064) .000[.064](.064) .000[.064](.064)
-.25 -.250[.048](.048) -.249[.048](.048) -.249[.048](.048) -.259[.080](.080) -.248[.080](.080) -.248[.080](.080)
-.50 -.501[.049](.049) -.501[.049](.049) -.501[.049](.049) -.514[.095](.094) -.501[.095](.095) -.501[.095](.095)
32
Forthcoming in Regional Science and Urban Economics

Table 1b. Empirical Mean[rmse](sd) of Estimators of λ, 2FE-SPD Model with SLD, T = 3, β = (.5, .5)′, σ = 1
λ λN λbc2N λbc3N λN λbc2N λbc3N
(a) Queen Contiguity, REG1 (b) Group Interaction, REG2
Normal Error, n=50
.50 .477[.133](.132) .500[.133](.133) .500[.132](.132) .449[.122](.111) .498[.105](.105) .500[.105](.105)
.25 .231[.157](.156) .251[.159](.159) .252[.158](.158) .179[.171](.156) .248[.150](.150) .250[.150](.150)
.00 -.015[.176](.175) .000[.180](.180) .002[.180](.180) -.086[.214](.196) -.002[.191](.191) .001[.191](.191)
-.25 -.261[.180](.180) -.252[.185](.185) -.251[.185](.185) -.348[.247](.227) -.252[.224](.224) -.249[.224](.224)
-.50 -.505[.185](.184) -.502[.190](.190) -.501[.190](.190) -.609[.283](.262) -.504[.261](.261) -.502[.262](.262)
Normal Mixture, n=50
.50 .478[.133](.132) .501[.133](.133) .500[.132](.132) .449[.120](.109) .498[.103](.103) .500[.103](.103)
.25 .229[.158](.157) .248[.159](.159) .249[.159](.159) .180[.168](.153) .248[.147](.147) .250[.147](.147)
.00 -.017[.174](.173) -.002[.177](.177) .000[.177](.177) -.088[.212](.193) -.003[.188](.188) .000[.188](.188)
-.25 -.260[.176](.176) -.251[.181](.181) -.250[.181](.181) -.346[.247](.227) -.250[.224](.224) -.247[.225](.225)
-.50 -.502[.181](.181) -.499[.186](.186) -.499[.186](.186) -.608[.281](.260) -.503[.260](.260) -.500[.260](.260)
Lognormal Error, n=50
.50 .480[.123](.122) .502[.123](.123) .502[.122](.122) .454[.112](.102) .502[.097](.097) .504[.097](.097)
.25 .229[.148](.147) .249[.150](.149) .250[.149](.149) .184[.157](.143) .251[.138](.138) .254[.138](.138)
.00 -.013[.162](.161) .002[.165](.165) .003[.165](.165) -.079[.193](.176) .003[.172](.172) .006[.172](.172)
-.25 -.258[.168](.167) -.248[.172](.172) -.247[.172](.172) -.341[.225](.206) -.247[.203](.203) -.244[.203](.203)
-.50 -.504[.173](.172) -.501[.177](.177) -.501[.178](.178) -.598[.258](.239) -.495[.239](.239) -.493[.240](.240)
Normal Error, n=100
.50 .490[.090](.090) .502[.090](.090) .502[.089](.089) .469[.087](.081) .499[.079](.079) .500[.079](.079)
.25 .242[.108](.108) .253[.109](.109) .253[.109](.109) .205[.127](.119) .248[.117](.117) .248[.117](.117)
.00 -.003[.122](.122) .006[.123](.123) .006[.123](.123) -.058[.166](.155) -.004[.153](.153) -.003[.153](.153)
-.25 -.256[.130](.129) -.250[.131](.131) -.249[.131](.131) -.313[.192](.181) -.249[.179](.179) -.249[.179](.179)
-.50 -.505[.131](.131) -.503[.133](.133) -.503[.133](.133) -.578[.223](.209) -.506[.209](.208) -.506[.209](.209)
Normal Mixture, n=100
.50 .491[.088](.088) .502[.088](.088) .502[.088](.088) .470[.087](.082) .500[.080](.080) .500[.079](.079)
.25 .241[.105](.105) .252[.106](.106) .252[.106](.106) .207[.124](.116) .249[.113](.113) .250[.113](.113)
.00 -.010[.120](.120) -.002[.121](.121) -.001[.121](.121) -.056[.160](.150) -.001[.148](.148) -.001[.148](.148)
-.25 -.254[.129](.129) -.248[.131](.131) -.247[.131](.131) -.314[.195](.184) -.251[.182](.182) -.250[.182](.182)
-.50 -.503[.130](.130) -.500[.131](.131) -.500[.132](.132) -.567[.217](.207) -.496[.206](.206) -.495[.206](.206)
Lognormal Error, n=100
.50 .490[.084](.084) .502[.084](.084) .502[.084](.084) .470[.084](.079) .500[.077](.077) .500[.077](.077)
.25 .235[.102](.101) .246[.102](.102) .246[.102](.102) .208[.120](.113) .250[.110](.110) .251[.110](.110)
.00 -.005[.116](.116) .004[.117](.117) .004[.117](.117) -.050[.151](.143) .003[.141](.141) .004[.141](.141)
-.25 -.258[.121](.121) -.252[.123](.123) -.252[.123](.123) -.316[.185](.172) -.253[.171](.171) -.253[.171](.171)
-.50 -.502[.125](.125) -.499[.126](.126) -.499[.126](.126) -.565[.208](.197) -.495[.197](.197) -.495[.197](.197)
Normal Error, n=500
.50 .498[.039](.039) .500[.039](.039) .500[.039](.039) .490[.050](.049) .501[.048](.048) .501[.048](.048)
.25 .247[.048](.048) .250[.048](.048) .250[.048](.048) .234[.073](.071) .250[.071](.071) .250[.071](.071)
.00 -.001[.055](.055) .001[.055](.055) .001[.055](.055) -.021[.097](.094) .000[.094](.094) .000[.094](.094)
-.25 -.251[.058](.058) -.250[.058](.058) -.250[.058](.058) -.275[.117](.114) -.249[.113](.113) -.249[.113](.113)
-.50 -.500[.060](.060) -.499[.061](.061) -.499[.061](.061) -.530[.139](.136) -.500[.135](.135) -.500[.135](.135)
Normal Mixture, n=500
.50 .499[.039](.039) .501[.039](.039) .501[.039](.039) .490[.048](.047) .501[.047](.047) .501[.047](.047)
.25 .247[.048](.048) .249[.048](.048) .249[.048](.048) .233[.074](.072) .249[.071](.071) .249[.071](.071)
.00 .000[.054](.054) .002[.055](.055) .002[.055](.055) -.020[.095](.093) .002[.092](.092) .002[.092](.092)
-.25 -.250[.059](.059) -.249[.059](.059) -.249[.059](.059) -.279[.119](.116) -.253[.115](.115) -.253[.115](.115)
-.50 -.501[.059](.059) -.500[.060](.060) -.500[.060](.060) -.529[.137](.134) -.499[.133](.133) -.499[.133](.133)
Lognormal Error, n=500
.50 .497[.037](.037) .500[.037](.037) .500[.037](.037) .491[.047](.046) .502[.046](.046) .502[.046](.046)
.25 .248[.048](.048) .250[.048](.048) .250[.048](.048) .234[.072](.070) .251[.069](.069) .251[.069](.069)
.00 -.002[.053](.053) .000[.053](.053) .000[.053](.053) -.020[.094](.092) .001[.091](.091) .001[.091](.091)
-.25 -.252[.057](.057) -.251[.058](.058) -.251[.058](.058) -.277[.116](.112) -.250[.112](.112) -.251[.112](.112)
-.50 -.499[.059](.059) -.499[.059](.059) -.499[.059](.059) -.530[.139](.136) -.498[.135](.135) -.499[.135](.135)
33
Forthcoming in Regional Science and Urban Economics

Table 2. Empirical Mean[rmse](sd) of Estimators of ρ - 2FE-SPD Model with SED, T = 3, β = (1, 1)′, σ = 1
ρ ρN ρbc2N ρbc3N ρN ρbc2N ρbc3N
(a) Queen Contiguity, REG1 (b) Group Interaction, REG2
Normal Error, n=50
.50 .481[.144](.142) .500[.143](.143) .500[.142](.142) .457[.139](.132) .503[.116](.116) .503[.115](.115)
.25 .233[.171](.170) .252[.171](.171) .254[.171](.171) .177[.202](.188) .258[.167](.167) .260[.167](.166)
.00 -.018[.190](.189) -.001[.190](.190) .001[.191](.190) -.115[.266](.240) -.004[.221](.221) -.001[.220](.220)
-.25 -.271[.202](.201) -.255[.203](.203) -.254[.204](.204) -.382[.299](.268) -.250[.256](.256) -.249[.256](.256)
-.50 -.516[.203](.202) -.503[.205](.205) -.502[.206](.206) -.637[.321](.290) -.496[.287](.287) -.497[.288](.288)
Normal Mixture, n=50
.50 .480[.139](.138) .500[.138](.138) .500[.137](.137) .458[.137](.130) .504[.114](.114) .504[.113](.113)
.25 .233[.166](.165) .252[.166](.166) .251[.166](.166) .168[.210](.194) .251[.172](.172) .250[.171](.171)
.00 -.016[.186](.185) .002[.186](.186) .003[.186](.186) -.108[.258](.234) .004[.214](.214) .003[.214](.214)
-.25 -.267[.195](.194) -.252[.196](.196) -.250[.197](.197) -.381[.293](.262) -.248[.251](.251) -.249[.251](.251)
-.50 -.511[.198](.197) -.498[.200](.200) -.498[.201](.201) -.636[.313](.282) -.493[.280](.280) -.495[.281](.281)
Lognormal Error, n=50
.50 .483[.135](.133) .504[.134](.134) .503[.133](.133) .454[.136](.128) .502[.112](.112) .502[.111](.111)
.25 .237[.160](.159) .256[.161](.160) .255[.160](.160) .174[.196](.181) .257[.160](.160) .256[.160](.160)
.00 -.012[.179](.179) .006[.180](.180) .005[.180](.180) -.105[.242](.218) .009[.199](.199) .002[.199](.199)
-.25 -.264[.186](.186) -.248[.188](.188) -.249[.188](.188) -.368[.273](.247) -.233[.235](.235) -.239[.236](.235)
-.50 -.512[.191](.191) -.499[.194](.194) -.499[.194](.194) -.632[.305](.275) -.489[.272](.272) -.489[.274](.273)
Normal Error, n=100
.50 .490[.096](.095) .500[.095](.095) .500[.095](.095) .467[.107](.102) .501[.093](.093) .501[.093](.093)
.25 .241[.119](.119) .251[.119](.119) .251[.118](.118) .196[.152](.142) .252[.132](.132) .251[.132](.132)
.00 -.011[.132](.132) -.001[.132](.132) .000[.132](.132) -.074[.192](.177) -.002[.171](.171) -.002[.171](.171)
-.25 -.259[.141](.140) -.249[.141](.141) -.249[.141](.141) -.333[.215](.199) -.255[.199](.199) -.255[.199](.199)
-.50 -.510[.142](.142) -.501[.143](.143) -.501[.143](.143) -.574[.220](.207) -.500[.215](.215) -.500[.215](.215)
Normal Mixture, n=100
.50 .489[.095](.094) .500[.094](.094) .500[.094](.094) .465[.104](.098) .500[.090](.090) .500[.090](.090)
.25 .240[.118](.117) .250[.117](.117) .250[.117](.117) .196[.149](.139) .253[.130](.130) .253[.130](.130)
.00 -.010[.130](.130) .001[.130](.130) .001[.130](.130) -.073[.189](.174) .000[.168](.168) .000[.168](.168)
-.25 -.260[.138](.138) -.250[.138](.138) -.249[.138](.138) -.327[.211](.196) -.249[.197](.197) -.249[.197](.197)
-.50 -.510[.138](.138) -.501[.139](.139) -.501[.139](.139) -.569[.220](.209) -.495[.219](.219) -.495[.219](.219)
Lognormal Error, n=100
.50 .494[.088](.088) .505[.088](.088) .505[.088](.088) .465[.107](.101) .501[.092](.092) .500[.092](.092)
.25 .240[.110](.110) .251[.110](.110) .251[.110](.110) .198[.145](.135) .256[.126](.126) .256[.126](.125)
.00 -.006[.126](.126) .004[.127](.126) .003[.127](.126) -.064[.174](.162) .010[.156](.156) .010[.156](.156)
-.25 -.259[.136](.136) -.250[.136](.136) -.249[.136](.136) -.320[.200](.188) -.239[.189](.188) -.239[.189](.189)
-.50 -.508[.135](.135) -.500[.136](.136) -.500[.136](.136) -.561[.214](.205) -.485[.215](.215) -.486[.215](.215)
Normal Error, n=500
.50 .497[.041](.041) .499[.041](.041) .499[.041](.041) .487[.060](.059) .500[.057](.057) .500[.057](.057)
.25 .249[.051](.051) .251[.051](.051) .251[.051](.051) .226[.090](.087) .249[.083](.083) .249[.083](.083)
.00 -.003[.058](.058) -.001[.058](.058) -.001[.058](.058) -.033[.121](.116) .000[.112](.112) .000[.112](.112)
-.25 -.252[.062](.061) -.250[.062](.062) -.250[.062](.062) -.292[.148](.142) -.249[.137](.137) -.249[.137](.137)
-.50 -.500[.063](.063) -.499[.063](.063) -.499[.063](.063) -.549[.170](.162) -.499[.158](.158) -.499[.158](.158)
Normal Mixture, n=500
.50 .498[.040](.040) .500[.040](.040) .500[.040](.040) .485[.060](.058) .499[.056](.056) .499[.056](.056)
.25 .247[.051](.051) .250[.051](.051) .250[.051](.051) .226[.091](.088) .250[.084](.084) .249[.084](.084)
.00 -.001[.058](.058) .001[.058](.058) .001[.058](.058) -.035[.120](.114) -.001[.110](.110) -.002[.110](.110)
-.25 -.252[.062](.062) -.250[.062](.062) -.250[.062](.062) -.291[.146](.140) -.249[.136](.136) -.249[.136](.136)
-.50 -.504[.063](.063) -.502[.063](.063) -.502[.063](.063) -.551[.173](.165) -.500[.161](.161) -.500[.161](.161)
Lognormal Error, n=500
.50 .498[.040](.040) .500[.040](.040) .500[.040](.040) .485[.062](.060) .500[.058](.058) .499[.058](.058)
.25 .249[.050](.050) .251[.050](.050) .251[.050](.050) .227[.088](.085) .252[.081](.081) .252[.081](.081)
.00 -.003[.057](.056) -.001[.056](.056) -.001[.056](.056) -.030[.112](.108) .006[.104](.104) .005[.104](.104)
-.25 -.251[.060](.060) -.249[.060](.060) -.249[.060](.060) -.290[.141](.135) -.245[.131](.130) -.246[.130](.130)
-.50 -.503[.062](.062) -.501[.062](.062) -.501[.062](.062) -.545[.168](.162) -.492[.158](.157) -.493[.158](.157)
34
Forthcoming in Regional Science and Urban Economics

Table 3a. Empirical Mean[rmse](sd) of Estimators of λ and ρ, 2FE-SPD Model with SARAR, T = 3, β = (1, 1)′, σ = 1, Queen Contiguity, REG-1
λ ρ λN λbc2N ρN ρbc2N λN λbc2N ρN ρbc2N
(a) Normal Error, n = 50 (b) Lognormal Error, n = 50
.50 .50 .484[.116](.115) .500[.116](.116) .483[.143](.142) .500[.143](.143) .486[.105](.104) .502[.105](.105) .484[.131](.130) .502[.131](.131)
.25 .484[.119](.117) .501[.118](.118) .226[.176](.174) .242[.175](.175) .485[.114](.113) .501[.113](.113) .233[.162](.161) .250[.161](.161)
.00 .483[.118](.116) .500[.117](.117) -.019[.192](.191) -.002[.192](.192) .486[.110](.109) .503[.110](.110) -.015[.177](.176) .002[.177](.177)
-.25 .482[.124](.122) .500[.123](.123) -.267[.202](.202) -.251[.203](.203) .487[.112](.111) .503[.112](.112) -.265[.193](.193) -.249[.193](.193)
-.50 .484[.125](.123) .500[.124](.124) -.513[.208](.208) -.498[.209](.209) .489[.111](.110) .505[.111](.111) -.514[.195](.194) -.499[.196](.196)
-.50 .50 -.502[.158](.158) -.500[.161](.161) .486[.144](.143) .504[.144](.144) -.502[.145](.145) -.500[.148](.148) .486[.132](.131) .504[.132](.131)
.25 -.506[.165](.165) -.504[.168](.168) .232[.174](.173) .249[.174](.174) -.505[.152](.151) -.503[.155](.154) .233[.161](.160) .250[.160](.160)
.00 -.501[.163](.163) -.499[.167](.167) -.006[.187](.187) .010[.187](.187) -.499[.159](.159) -.497[.162](.162) -.018[.180](.179) -.001[.180](.180)
-.25 -.500[.164](.164) -.498[.168](.168) -.262[.209](.209) -.246[.210](.210) -.501[.152](.152) -.499[.155](.155) -.263[.197](.197) -.246[.197](.197)
-.50 -.506[.169](.169) -.505[.172](.172) -.518[.207](.206) -.503[.208](.208) -.498[.157](.157) -.497[.160](.160) -.513[.194](.194) -.498[.195](.195)
(c) Normal Error, n = 100 (d) Lognormal Error, n = 100
.50 .50 .494[.078](.077) .502[.078](.078) .490[.096](.096) .499[.096](.096) .490[.078](.078) .499[.078](.078) .493[.090](.090) .502[.090](.090)
.25 .490[.080](.080) .499[.080](.080) .244[.117](.116) .253[.117](.117) .491[.081](.080) .500[.080](.080) .243[.111](.111) .252[.111](.111)
.00 .493[.083](.083) .502[.083](.083) -.011[.132](.131) -.002[.131](.131) .494[.079](.079) .503[.079](.079) -.009[.126](.126) .001[.126](.126)
-.25 .491[.084](.083) .500[.083](.083) -.258[.142](.142) -.249[.142](.142) .490[.077](.077) .499[.077](.077) -.264[.138](.137) -.254[.138](.137)
-.50 .490[.079](.078) .499[.078](.078) -.509[.142](.141) -.499[.142](.142) .493[.077](.077) .501[.077](.077) -.509[.137](.137) -.499[.137](.137)
-.50 .50 -.494[.118](.118) -.493[.119](.119) .492[.094](.094) .501[.094](.094) -.503[.106](.106) -.503[.107](.107) .491[.089](.088) .500[.088](.088)
.25 -.501[.119](.119) -.500[.121](.121) .242[.117](.117) .251[.117](.117) -.502[.112](.112) -.501[.113](.113) .240[.111](.111) .249[.111](.111)
.00 -.496[.115](.115) -.495[.117](.117) -.008[.133](.133) .001[.133](.133) -.498[.114](.114) -.498[.115](.115) -.007[.129](.129) .003[.128](.128)
-.25 -.505[.118](.118) -.504[.120](.120) -.258[.143](.143) -.248[.143](.143) -.497[.112](.112) -.496[.113](.113) -.257[.136](.136) -.248[.136](.136)
-.50 -.501[.118](.118) -.500[.120](.120) -.504[.148](.148) -.495[.149](.149) -.505[.109](.109) -.504[.110](.110) -.507[.137](.137) -.498[.138](.137)
(e) Normal Error, n = 500 (f) Lognormal Error, n = 500
.50 .50 .497[.033](.033) .499[.033](.033) .499[.041](.041) .501[.041](.041) .499[.030](.030) .501[.030](.030) .497[.040](.040) .499[.040](.040)
.25 .497[.033](.033) .499[.033](.033) .247[.052](.052) .249[.052](.052) .499[.032](.032) .501[.032](.032) .249[.050](.050) .250[.050](.050)
.00 .499[.033](.033) .501[.033](.033) .001[.057](.057) .003[.058](.057) .498[.033](.033) .500[.033](.033) -.001[.057](.057) .001[.057](.057)
-.25 .498[.033](.032) .499[.033](.033) -.254[.062](.062) -.252[.062](.062) .498[.033](.033) .500[.033](.033) -.250[.061](.061) -.248[.061](.061)
-.50 .498[.032](.032) .500[.032](.032) -.503[.062](.062) -.501[.062](.062) .497[.032](.032) .499[.032](.032) -.501[.062](.062) -.499[.062](.062)
-.50 .50 -.502[.049](.049) -.501[.049](.049) .498[.041](.041) .500[.041](.041) -.499[.049](.049) -.499[.049](.049) .498[.040](.040) .500[.040](.040)
.25 -.503[.051](.051) -.502[.051](.051) .249[.051](.051) .250[.051](.051) -.500[.051](.051) -.499[.051](.051) .248[.050](.050) .250[.050](.050)
.00 -.501[.050](.050) -.501[.050](.050) -.001[.060](.060) .001[.060](.060) -.501[.051](.051) -.500[.052](.052) -.002[.058](.058) .000[.058](.058)
-.25 -.502[.051](.050) -.502[.051](.051) -.253[.061](.061) -.251[.061](.061) -.499[.051](.051) -.498[.051](.051) -.252[.062](.062) -.250[.062](.062)
-.50 -.500[.049](.049) -.499[.049](.049) -.501[.063](.063) -.499[.064](.064) -.500[.048](.048) -.500[.049](.049) -.503[.062](.062) -.502[.062](.062)
35
Forthcoming in Regional Science and Urban Economics

Table 3b. Empirical Mean[rmse](sd) of Estimators of λ and ρ, 2FE-SPD Model with SARAR, T = 3, β = (1, 1)′, σ = 1, Group Interaction, REG-2
λ ρ λN λbc2N ρN ρbc2N λN λbc2N ρN ρbc2N
(a) Normal Error, n = 50 (b) Lognormal Error, n = 50
.50 .50 .484[.095](.094) .499[.092](.092) .453[.156](.149) .500[.129](.129) .484[.089](.088) .500[.087](.087) .456[.146](.140) .505[.121](.121)
.25 .480[.103](.101) .497[.099](.099) .162[.238](.221) .248[.194](.194) .484[.096](.095) .501[.093](.093) .161[.237](.220) .251[.193](.193)
.00 .481[.104](.102) .498[.100](.100) -.120[.298](.272) .001[.243](.243) .486[.097](.096) .501[.093](.093) -.120[.301](.276) .005[.247](.247)
-.25 .481[.104](.102) .496[.100](.100) -.408[.362](.326) -.257[.299](.299) .488[.097](.096) .502[.094](.094) -.407[.365](.330) -.252[.306](.306)
-.50 .484[.099](.098) .498[.096](.096) -.685[.400](.354) -.512[.335](.334) .491[.095](.095) .504[.093](.093) -.682[.413](.370) -.506[.354](.354)
-.50 .50 -.527[.218](.216) -.499[.218](.218) .453[.158](.150) .501[.130](.130) -.522[.214](.213) -.494[.215](.215) .458[.147](.141) .507[.123](.122)
.25 -.534[.237](.235) -.505[.237](.236) .164[.235](.219) .251[.191](.191) -.524[.226](.225) -.495[.227](.227) .171[.220](.205) .259[.179](.179)
.00 -.532[.239](.237) -.504[.239](.239) -.117[.301](.277) .004[.249](.249) -.528[.239](.237) -.501[.239](.239) -.114[.293](.270) .010[.242](.242)
-.25 -.530[.237](.235) -.504[.237](.237) -.407[.357](.320) -.257[.295](.295) -.519[.240](.240) -.494[.241](.241) -.396[.349](.317) -.243[.293](.293)
-.50 -.524[.233](.232) -.500[.233](.233) -.689[.403](.355) -.518[.337](.336) -.528[.251](.250) -.505[.252](.252) -.661[.399](.364) -.489[.345](.345)
(c) Normal Error, n = 250 (d) Lognormal Error, n = 250
.50 .50 .497[.044](.044) .501[.044](.044) .477[.082](.079) .500[.074](.074) .497[.043](.043) .500[.042](.042) .477[.081](.078) .500[.073](.073)
.25 .497[.043](.043) .500[.043](.043) .209[.124](.117) .250[.110](.110) .497[.042](.042) .500[.042](.042) .209[.119](.112) .250[.105](.105)
.00 .497[.041](.040) .499[.040](.040) -.056[.161](.151) .001[.142](.142) .498[.040](.040) .500[.039](.039) -.056[.158](.148) .002[.138](.138)
-.25 .498[.038](.038) .500[.038](.038) -.327[.204](.189) -.253[.178](.178) .498[.038](.038) .500[.038](.038) -.322[.194](.180) -.247[.169](.169)
-.50 .499[.035](.035) .500[.035](.035) -.590[.232](.214) -.501[.203](.203) .500[.035](.035) .501[.035](.035) -.588[.229](.211) -.497[.200](.200)
-.50 .50 -.508[.123](.122) -.498[.122](.122) .476[.082](.078) .499[.073](.073) -.509[.122](.121) -.498[.121](.121) .476[.081](.078) .500[.073](.073)
.25 -.510[.118](.118) -.502[.118](.118) .213[.121](.115) .253[.108](.108) -.504[.118](.118) -.496[.118](.118) .210[.120](.113) .251[.106](.106)
.00 -.507[.116](.116) -.500[.116](.116) -.063[.167](.155) -.005[.146](.146) -.509[.113](.113) -.502[.113](.113) -.058[.161](.150) .000[.140](.140)
-.25 -.502[.105](.105) -.497[.105](.105) -.326[.201](.186) -.252[.175](.175) -.507[.105](.105) -.502[.105](.105) -.320[.192](.179) -.245[.169](.169)
-.50 -.506[.099](.099) -.502[.099](.099) -.592[.235](.216) -.503[.204](.204) -.503[.100](.100) -.499[.100](.100) -.589[.234](.217) -.498[.205](.205)
(e) Normal Error, n = 500 (f) Lognormal Error, n = 500
.50 .50 .498[.030](.030) .500[.030](.030) .484[.065](.063) .500[.060](.060) .498[.030](.030) .500[.030](.030) .484[.065](.063) .501[.060](.060)
.25 .499[.029](.029) .500[.029](.029) .220[.098](.093) .248[.089](.089) .498[.029](.029) .500[.029](.029) .223[.096](.092) .252[.087](.087)
.00 .500[.027](.027) .501[.027](.027) -.040[.128](.122) .001[.116](.116) .500[.027](.027) .501[.027](.027) -.044[.128](.120) -.001[.114](.114)
-.25 .500[.025](.025) .501[.025](.025) -.303[.160](.151) -.249[.144](.144) .500[.025](.025) .501[.025](.025) -.305[.158](.148) -.249[.141](.141)
-.50 .499[.023](.023) .500[.023](.023) -.562[.187](.176) -.496[.168](.168) .499[.022](.022) .500[.022](.022) -.565[.192](.180) -.497[.172](.172)
-.50 .50 -.505[.087](.087) -.500[.087](.087) .485[.065](.063) .500[.060](.060) -.505[.085](.085) -.499[.085](.085) .484[.064](.062) .501[.059](.059)
.25 -.507[.082](.082) -.503[.082](.082) .220[.098](.094) .248[.089](.089) -.504[.081](.081) -.500[.081](.081) .223[.096](.092) .252[.088](.088)
.00 -.503[.075](.075) -.500[.075](.075) -.041[.131](.124) .000[.118](.118) -.502[.075](.075) -.499[.075](.075) -.044[.127](.119) -.001[.113](.113)
-.25 -.504[.070](.070) -.502[.070](.070) -.303[.161](.152) -.249[.145](.145) -.501[.071](.071) -.499[.071](.071) -.303[.159](.150) -.248[.143](.143)
-.50 -.501[.065](.065) -.499[.065](.065) -.569[.192](.179) -.503[.171](.171) -.502[.065](.065) -.500[.065](.065) -.562[.187](.176) -.494[.168](.168)
36
Forthcoming in Regional Science and Urban Economics

Table 4. Empirical Means of the Non-Spatial Estimators, 2FE-SPD Model with SLD
Group Interaction, REG2, T = 3
λ β1N β2N σ2N βbc
1N βbc2N σ2,bc
N β1N β2N σ2N βbc
1N βbc2N σ2,bc
N
(a) β = (1, 1)′, σ = 1 (b) β = (.5, .5)′, σ = 1
Normal Error, n=50
.50 1.041 1.035 0.984 0.996 0.998 0.992 0.533 0.530 0.985 0.496 0.499 0.991
.25 1.039 1.030 0.982 0.997 0.995 0.992 0.532 0.524 0.981 0.498 0.496 0.991
.00 1.035 1.023 0.980 0.997 0.992 0.992 0.529 0.519 0.978 0.498 0.494 0.991
-.25 1.032 1.023 0.978 0.997 0.995 0.992 0.524 0.519 0.975 0.496 0.496 0.992
-.50 1.030 1.019 0.974 0.999 0.994 0.989 0.527 0.514 0.970 0.501 0.494 0.990
Normal Mixture, n=50
.50 1.040 1.031 0.975 0.996 0.994 0.982 0.532 0.520 0.981 0.495 0.490 0.988
.25 1.041 1.030 0.973 1.000 0.996 0.982 0.531 0.523 0.973 0.497 0.495 0.983
.00 1.038 1.030 0.973 1.001 0.998 0.984 0.526 0.518 0.973 0.495 0.493 0.986
-.25 1.035 1.025 0.966 1.001 0.997 0.980 0.524 0.515 0.963 0.496 0.492 0.979
-.50 1.028 1.023 0.969 0.997 0.997 0.985 0.521 0.520 0.962 0.496 0.500 0.981
Lognormal Error, n=50
.50 1.036 1.031 0.944 0.994 0.995 0.951 0.529 0.523 0.946 0.493 0.493 0.952
.25 1.036 1.032 0.947 0.996 0.999 0.957 0.529 0.521 0.946 0.496 0.494 0.956
.00 1.028 1.020 0.936 0.992 0.990 0.947 0.525 0.519 0.944 0.495 0.494 0.957
-.25 1.029 1.019 0.942 0.996 0.992 0.955 0.522 0.517 0.943 0.494 0.494 0.959
-.50 1.026 1.017 0.940 0.996 0.993 0.956 0.518 0.514 0.926 0.494 0.494 0.945
Normal Error, n=100
.50 1.028 1.023 0.993 1.000 0.999 0.996 0.526 0.521 0.993 0.501 0.499 0.996
.25 1.027 1.019 0.991 1.000 0.996 0.995 0.524 0.517 0.990 0.500 0.496 0.995
.00 1.023 1.020 0.990 0.998 0.999 0.996 0.524 0.516 0.991 0.501 0.496 0.997
-.25 1.020 1.020 0.989 0.996 1.000 0.995 0.521 0.514 0.988 0.499 0.496 0.995
-.50 1.024 1.018 0.988 1.002 0.999 0.995 0.520 0.514 0.986 0.500 0.497 0.994
Normal Mixture, n=100
.50 1.026 1.022 0.990 0.998 0.998 0.993 0.523 0.518 0.988 0.497 0.497 0.991
.25 1.024 1.019 0.987 0.998 0.996 0.992 0.525 0.519 0.986 0.501 0.498 0.990
.00 1.022 1.018 0.985 0.997 0.996 0.990 0.522 0.515 0.985 0.499 0.496 0.991
-.25 1.023 1.018 0.987 1.000 0.998 0.994 0.523 0.517 0.983 0.501 0.499 0.991
-.50 1.022 1.019 0.982 1.000 1.001 0.989 0.518 0.515 0.983 0.498 0.498 0.992
Lognormal Error, n=100
.50 1.024 1.021 0.973 0.997 0.998 0.977 0.524 0.518 0.969 0.499 0.497 0.972
.25 1.025 1.023 0.964 1.000 1.002 0.968 0.522 0.516 0.966 0.498 0.496 0.971
.00 1.023 1.015 0.963 0.999 0.995 0.969 0.520 0.514 0.962 0.497 0.495 0.968
-.25 1.022 1.016 0.970 0.999 0.997 0.977 0.520 0.516 0.964 0.499 0.498 0.972
-.50 1.021 1.012 0.960 1.000 0.995 0.966 0.516 0.514 0.958 0.497 0.498 0.967
Normal Error, n=250
.50 1.011 1.010 0.997 0.999 0.998 0.999 0.512 0.512 0.997 0.499 0.499 0.998
.25 1.010 1.009 0.996 0.998 0.997 0.998 0.512 0.512 0.996 0.500 0.500 0.998
.00 1.009 1.009 0.996 0.998 0.997 0.998 0.509 0.509 0.996 0.497 0.497 0.998
-.25 1.009 1.010 0.996 0.997 0.998 0.999 0.508 0.511 0.995 0.497 0.500 0.998
-.50 1.009 1.010 0.995 0.998 0.999 0.998 0.511 0.510 0.994 0.500 0.499 0.997
Normal Mixture, n=250
.50 1.014 1.013 0.997 1.002 1.000 0.998 0.513 0.509 0.996 0.500 0.497 0.997
.25 1.012 1.010 0.993 1.000 0.998 0.995 0.512 0.511 0.995 0.500 0.498 0.996
.00 1.010 1.011 0.995 0.998 0.999 0.997 0.510 0.512 0.993 0.498 0.500 0.996
-.25 1.012 1.011 0.996 1.001 1.000 0.998 0.510 0.510 0.997 0.498 0.498 1.000
-.50 1.009 1.008 0.994 0.998 0.997 0.996 0.510 0.509 0.993 0.499 0.498 0.996
Lognormal Error, n=250
.50 1.011 1.010 0.986 0.999 0.998 0.987 0.511 0.511 0.982 0.498 0.498 0.983
.25 1.012 1.013 0.985 1.000 1.001 0.987 0.513 0.513 0.986 0.501 0.501 0.988
.00 1.010 1.009 0.983 0.998 0.998 0.985 0.511 0.511 0.984 0.499 0.499 0.987
-.25 1.010 1.009 0.982 0.999 0.997 0.985 0.512 0.510 0.984 0.500 0.498 0.987
-.50 1.007 1.007 0.985 0.996 0.997 0.987 0.509 0.508 0.983 0.498 0.497 0.986
37
Forthcoming in Regional Science and Urban Economics

Table 5a. Empirical Sizes: Two-Sided Tests of Spatial Dependence in SARAR Model
Group Interaction, REG2, T = 3, β = (1, 1)′, σ = 1, Wild Bootstrap
n Test 10% 5% 1% 10% 5% 1% 10% 5% 1%
Normal Errors Normal Mixture Lognormal Errors
H0 : λ = ρ = 0
50 W11 .1974 .1288 .0546 .1918 .1232 .0450 .1616 .1062 .0456
W22 .1896 .1196 .0516 .1846 .1222 .0470 .1584 .1008 .0408
W33 .1520 .0906 .0388 .1428 .0874 .0302 .1318 .0778 .0300
100 W11 .1732 .1048 .0348 .1652 .0964 .0384 .1416 .0860 .0286
W22 .1754 .1116 .0366 .1684 .1070 .0388 .1416 .0858 .0284
W33 .1290 .0764 .0224 .1228 .0734 .0266 .1192 .0676 .0208
250 W11 .1406 .0808 .0208 .1364 .0736 .0198 .1104 .0620 .0162
W22 .1390 .0788 .0234 .1350 .0758 .0206 .1170 .0712 .0196
W33 .1148 .0618 .0174 .1102 .0576 .0154 .1026 .0564 .0170
500 W11 .1334 .0740 .0176 .1168 .0682 .0142 .1128 .0630 .0136
W22 .1358 .0752 .0178 .1270 .0674 .0176 .1338 .0730 .0196
W33 .1088 .0548 .0128 .1000 .0528 .0118 .1096 .0552 .0118
H0 : λ = 0, (true ρ = 0)
50 W11 .1660 .1024 .0392 .1436 .0920 .0320 .1450 .0920 .0360
W22 .1622 .1044 .0382 .1578 .0968 .0378 .1590 .0970 .0410
W33 .1354 .0842 .0294 .1260 .0758 .0246 .1284 .0798 .0286
100 W11 .1362 .0798 .0256 .1352 .0812 .0268 .1302 .0734 .0230
W22 .1532 .0908 .0282 .1494 .0906 .0294 .1332 .0758 .0230
W33 .1174 .0668 .0212 .1162 .0686 .0202 .1186 .0670 .0178
250 W11 .1232 .0732 .0174 .1228 .0690 .0158 .1134 .0576 .0154
W22 .1266 .0726 .0170 .1238 .0682 .0160 .1174 .0616 .0154
W33 .1126 .0630 .0132 .1100 .0594 .0118 .1052 .0542 .0126
500 W11 .1108 .0578 .0142 .1094 .0556 .0116 .1116 .0616 .0138
W22 .1198 .0588 .0148 .1120 .0576 .0128 .1198 .0662 .0160
W33 .1050 .0530 .0122 .1030 .0524 .0098 .1070 .0572 .0130
H0 : ρ = 0 (true λ = 0)
50 W11 .1730 .1054 .0392 .1714 .1070 .0382 .1498 .0902 .0328
W22 .1366 .0850 .0326 .1418 .0822 .0312 .1202 .0692 .0192
W33 .1268 .0794 .0280 .1214 .0710 .0262 .1056 .0598 .0170
100 W11 .1604 .0980 .0268 .1478 .0856 .0250 .1292 .0710 .0198
W22 .1302 .0758 .0252 .1274 .0732 .0260 .1142 .0672 .0220
W33 .1124 .0630 .0198 .1056 .0612 .0196 .0952 .0568 .0164
250 W11 .1358 .0742 .0192 .1304 .0724 .0192 .1030 .0506 .0122
W22 .1216 .0694 .0166 .1226 .0670 .0176 .1036 .0552 .0168
W33 .1074 .0570 .0132 .1054 .0556 .0126 .0880 .0456 .0132
500 W11 .1306 .0704 .0158 .1126 .0600 .0140 .0976 .0514 .0124
W22 .1208 .0682 .0170 .1110 .0590 .0150 .1154 .0616 .0146
W33 .1030 .0528 .0114 .0928 .0466 .0106 .0966 .0478 .0116
Note: Wjj are defined in (3.12) for joint tests and (3.13) for one-directional tests.
38
Forthcoming in Regional Science and Urban Economics

Table 5b. Empirical Sizes: Two-Sided Tests of H0 : λ = 0 in SLD Model
Group Interaction, REG2, T = 3, β = (1, 1)′, σ = 1. Tjj are defined in (3.14)
n Test 10% 5% 1% 10% 5% 1% 10% 5% 1%
Normal Errors Normal Mixture Lognormal Errors
50 T11 .1422 .0850 .0232 .1254 .0676 .0190 .1068 .0552 .0140
T22 .1348 .0808 .0212 .1154 .0586 .0162 .1042 .0586 .0134
T33 .1120 .0616 .0146 .0992 .0472 .0126 .0918 .0484 .0102
100 T11 .1224 .0622 .0174 .1186 .0660 .0136 .1070 .0590 .0116
T22 .1142 .0604 .0128 .1214 .0654 .0158 .1108 .0600 .0130
T33 .1004 .0478 .0102 .1046 .0518 .0118 .0958 .0502 .0084
250 T11 .1148 .0584 .0176 .1042 .0540 .0112 .1006 .0512 .0142
T22 .1130 .0622 .0172 .1128 .0604 .0128 .1140 .0572 .0150
T33 .1006 .0526 .0130 .0946 .0506 .0086 .0996 .0466 .0124
500 T11 .1126 .0560 .0106 .1082 .0528 .0122 .0970 .0472 .0082
T22 .1154 .0646 .0140 .1066 .0564 .0118 .1064 .0554 .0106
T33 .1010 .0554 .0110 .0972 .0484 .0104 .0960 .0474 .0080
Table 5c. Empirical Sizes: Two-Sided Tests of H0 : ρ = 0 in SED Model
Group Interaction, REG2, T = 3, β = (1, 1)′, σ = 1. Tjj are defined in (3.14)
n Test 10% 5% 1% 10% 5% 1% 10% 5% 1%
Normal Errors Normal Mixture Lognormal Errors
50 T11 .1572 .0920 .0282 .1492 .0846 .0236 .1282 .0666 .0164
T22 .1386 .0758 .0234 .1242 .0734 .0220 .1030 .0572 .0152
T33 .1146 .0620 .0172 .1152 .0640 .0176 .0928 .0518 .0142
100 T11 .1420 .0798 .0224 .1324 .0738 .0142 .1170 .0598 .0126
T22 .1274 .0736 .0202 .1248 .0700 .0160 .1010 .0550 .0140
T33 .1116 .0594 .0154 .1054 .0540 .0112 .0840 .0444 .0116
250 T11 .1224 .0630 .0140 .1128 .0568 .0114 .1028 .0544 .0124
T22 .1190 .0656 .0172 .1096 .0560 .0142 .1056 .0566 .0166
T33 .1006 .0518 .0124 .0882 .0450 .0114 .0880 .0466 .0114
500 T11 .1124 .0578 .0120 .1126 .0526 .0098 .1004 .0518 .0116
T22 .1136 .0624 .0142 .1202 .0604 .0148 .1164 .0610 .0178
T33 .0952 .0492 .0098 .1004 .0482 .0108 .0982 .0476 .0126
Table 6. Empirical Sizes: Two-Sided Tests of H0 : β1 = β2 in SARAR Model
Group Interaction, REG2, T = 3, σ = 1, λ = ρ = 0
n Test 10% 5% 1% 10% 5% 1% 10% 5% 1%
Normal Errors Normal Mixture Lognormal Errors
50 T11 .1608 .1020 .0386 .1630 .1046 .0386 .1604 .0978 .0344
T22 .1154 .0650 .0214 .1190 .0678 .0206 .1138 .0614 .0204
100 T11 .1334 .0744 .0228 .1344 .0794 .0218 .1334 .0782 .0218
T22 .1012 .0546 .0138 .1042 .0536 .0126 .1032 .0534 .0120
250 T11 .1240 .0642 .0166 .1210 .0680 .0204 .1196 .0670 .0184
T22 .1066 .0524 .0120 .1060 .0564 .0152 .1018 .0580 .0114
500 T11 .1092 .0548 .0116 .1100 .0564 .0140 .1154 .0616 .0200
T22 .0958 .0472 .0092 .0978 .0472 .0100 .1022 .0536 .0146
50 T11 .1624 .1004 .0376 .1624 .1024 .0390 .1610 .0992 .0376
T22 .1136 .0654 .0196 .1204 .0666 .0208 .1136 .0640 .0216
100 T11 .1282 .0742 .0196 .1394 .0810 .0208 .1420 .0808 .0250
T22 .0968 .0496 .0114 .1068 .0540 .0090 .1060 .0564 .0118
250 T11 .1254 .0688 .0190 .1224 .0642 .0140 .1146 .0622 .0180
T22 .1050 .0568 .0142 .1024 .0480 .0094 .0990 .0526 .0132
500 T11 .1240 .0626 .0152 .1130 .0594 .0130 .1220 .0650 .0160
T22 .1102 .0502 .0124 .0978 .0482 .0096 .1084 .0552 .0122
Note: β = (1, 1)′ for upper panel, and (.5, .5)′ for lower panel. Tjj are defined in (3.15).
39
Forthcoming in Regional Science and Urban Economics