bi b i e i i biomass burning emissions - gofc...
TRANSCRIPT

Bi B i E i iGOFC Fire IT Workshop, Frascati 23-25 March 2010
Biomass Burning EmissionsC. Liousse, G. Van der Werf, P.A. Brivio
Different approachesUncertaintiesRecommendation
1

Satellite-derived Bottom-up inventories : I
“fire pixels” (active fires) burnt per vegetation type : AF
Area burnt (burnt areas) per vegetation type: ha : BA
Fuel: T. ha-1
M (…) = Area x Biomass Density x Burning Efficiency x Emission Factor
Examples :
Fuel: T. ha-1 ???? Dry tropical grass savanna: ~ 2 tons/haMoist tropical savanna: ~ 10 tons/ha
With constant vegetationIto and Penner 2004 : AF (MODIS, ATSR) x BA (Spot)Hoelzemann et al. 2005 : AF (ATSR)x BA (Globscar)Liousse et al 2004 2010 : BA (AVHRR SPOT)Moist tropical savanna: 10 tons/ha
Boreal forest: ~ 20 tons/haMoist tropical forest: ~ 40 tons/ha
Liousse et al. 2004, 2010 : BA (AVHRR, SPOT)Chin et al., 2005 : AF (MODIS)Mieville et al., 2009 : AF (ATSR) x BA (Spot)
BD 1 36 (1 30)
2
With a dynamical vegetation modelVan der Werf et al 2006, 2009, Giglio et al. 2006 :
AF(ATSR) x BA (MODIS)
BD range: 1 – 36 (1:30)BE range: 0.3 - 0.9 (1:3)EF range: 65 – 107 (1:2)

Satellite-derived Bottom-up inventories : IIFRE/FRP-based smoke emissions estimation approach (MODIS & SEVIRI)
• Emissions = Emiss Ratio × BM (from FRE or FRP) f[Wooster et al. 2005] [Ichoku Kaufman 2005]
* high range in the emission ratios
Kaiser et al. 09
3

Satellite-derived Top-Down inventories
Most works used CO (combustion tracer) e.g. Petron et al. 2004, Bergamaschi et al. 2000, Chevalier et al. 2009
Recent developments on black carbon aerosols (Dubovik et al, Vermote et al.2009)
CO concentrations database well documented at the regional and global levelCO concentrations database well documented at the regional and global level(e.g. MOPITT, AIRS, TES on Terra, Aqua & Aura and SCHIAMACHY on Envisat satellite dataset)
Inverse modelling chemical transport model(e.g. MOZART, GEOS-chem)
EF and ER(CO) known with low uncertainty factor
4
A posteriori Emissions

One type of UNCERTAINTIES BBSO
In the determination of the spatial and temporal distributions of burnt biomass => distribution of different products derived from Earth Observations are used :Observations are used :
- fire pixels (or active fires AF)- burnt areas (BA)- or both- More recently : fire radiative power or energy (FRP, FRE)
And these products lead to totally different emission results.
Intercomparison exercise : BBSO (Burnt Biomass and Satellite Observations) in the frame of GEIA/ACCENT programs
5
Observations) in the frame of GEIA/ACCENT programs

BBSO 1 (T l D b 2005)
BBSO
BBSO-1 (Toulouse, December 2005)
Two joint initiatives have emerged as a result of the final discussions of the workshop:
• 1) To draft a detailed description of global and regional emission inventories generated
by the participants and the methods used for the determination of burnt biomassby the participants and the methods used for the determination of burnt biomass
through BA, AF or FRE. This is presented in Table 1.
• 2) To carry out an intercomparison exercise for CO emission estimates
(JRC unit leadership). This will help to understand the origin of the observeddifferences between the emission estimates in terms of overall budgets andspatial/temporal distribution.
6

Research group
Vegetation cover map
used
Sensor used, day/night?
Using burnt area
or active fire
Species investigated Transport model used Comments
BBSO-1 (Toulouse, December 2005) BBSOf
C. Granier (SA), J.F. Lamarque (NCAR)
CLM 3,0 (P.J.Lawrence) with 17 PFTs
ATSR (night) active fires -
monthly maps at 0,5� resolution
CO, NOx, C2H4, C2H6, C3H6, C3H8, butane,
butene, CH2O, CH3CHO, CH3OH, C2H5OH, Acetone,
Toluene, Mek (ketones)
Mozart Assume the total amount of CO2 emitted on the 1997-2003 period is equal to the Hao climatology for the 1985-1991 period [Hao and Liu., 1994]. Emission ratios are from Andreae and Merlet [2001]
A. Ito and J.E. Penner
Zhu & Waller [2001] Hansen et al. [2003] Z t l [2000]
MODIS SPOT ATSR
Burnt area Carbon monoxide - - - - Akinori Ito and Joyce E. Penner, Estimates of CO emissions from open biomass burning in southern Africa for the year J. Geophys. Res., 110, D19306 2005.
Zeng et al. [2000] ATSR
Van der Werf / Randerson/ Kasibhatla
MODIS both
(MODIS / ATSR / VIRS)
active fires, scaled to burnt area [Giglio et
al., 2005, ACPD]
Focus on carbon, other species derived using
EF's from Andreae and Merlet [2001, GBC]
Geos - chemBurned area is retrieved using regionally derived active fire to burned area relations. These relations depend on fractional tree cover and active fire cluster size. Also the fire persistence is taken into account to increase the burned area per active fire in deforestation regions. Burned area is used as input for the satellite-driven CASA biogeochemical model to estimate emissions.
UMD, Department of G h
SAFARI 2000 fuel load data day
MODIS, GBA-2000,
GLOBSCAR40+ (CO2, CO, OVOC,
PM, CH4, etc.) No transport
included
Southern African biomass burning emissions have been modelled. The results have been published by 1) S. Korontzi (2005). Seasonal patterns in biomass burning emissions from southern African vegetation fires, Global Change Biology, 11, 1680-1700 and 2) S. Korontzi, D. P. Roy, C. O. Justice, and D. E. Ward (2004). Modelling and sensitivity analysis of fire emissions
Geography GLOBSCAR ) , y, , ( ) g y yin southern Africa during SAFARI 2000, Remote Sensing of Environment, 92(2), 255-275.
ABBI (Asian Biomass Burning Inventory)
UMD SPOT-VGT Burnt Area 58 gaseous species and 2 carbonaceous particles
no model used documentation: Michel et al., 2005 (JGR)
Africa GLC SPOT-VGT Burnt Area BC, OC RegCn, TM4 Konare et al. [2006]. Africa GISS (Matthews) AVHRR Burnt Area BC, OC MNH Period 1981-1991. [Liousse et al., 2004]
Global. ATSR active fire used for spatial and temporal distribution of fires (not used to retrieve emitted quantities) a) remove active fires detected ata permanent position (gasflares) from thedataset
LSCE/ IPSL none night active fire POM,BC LMDz
a) remove active fires detected at a permanent position (gasflares) from thedataset b) apply for a cloud coverage correction Climatological inventories used to have estimates of annual emitted quantities. Here Liousse et al, 1996. Method: 1. Globe divided into large fairly homogeneous regions (see Fig 1 in Generoso et al, 2003) 2. Emission Constant (EC) computed within each region, EC= annual emitted quantities / annual mean number of detected fires (based on
detection during 4years: [Jan97;May97]U[Jun98-Dec01] 3. Apply EC to the monthly distribution of fires. Products available: Monthly BC and POM emissions from 1997 to 2003 for the globe Same method but include updates : 1. Now take into account missing days in ATSR active fire dataset 2 Cli t l f BC POM B d t l 2004LMCA/
EPFL none night active fire POM,BC, CO, NOx ... GEOS-Chem2. Climatology for BC, POM : Bond et al, 2004Extended to gas : Climatology for CO, NOx :J.A. Logan, R. Yevich, unpublished data 3. Annual mean number of detected fires (for EC) now calculated based on 6 complete years: 99 to 04 Products available from 1997 to 2004 for the globe
Mian Chin Goddard Space Flight Center, USA)
GISS MODIS active fire BC, OC, CO , CO, SO - - - - Presented at the Burnt Biomass from Satellite Observations BBSO workshop, Toulouse, December 14th and 15th, 2005
7
)C. Ichoku and Y.J. Kaufman - - - - MODIS FRP / FRE Smoke aerosol - - - - Presented at the Burnt Biomass from Satellite Observations BBSO workshop, Toulouse, December 14th and 15th, 2005
Table 1 Species investigated and methods used by the different attending research groups.
BBSO
The aim of BBSO-2 workshop (Toulouse, November 2009) :
to show results of CO emissions intercomparisons based on different fire products. BBSO
to present modelling sensitivity tests on the use of different biomass burning emissions
to propose the best ways to derive burnt biomass distributions to propose the best ways to derive burnt biomass distributions and related emissions
t di ti iti f th i to discuss on common activities for the coming years (next intercomparison studies?, next validations?....)
8

Similarities and discrepancies …BBSO
pMonthly Global CO emissions maps 2003
VGT ATSR MODIS
(Brivio, 2009)
9

Year 2003: total CO emissionsB ttBottom-up
Top-down
VGT ATSR MODIS GFED2 MOPITT1422 547 769 398 594
10

BBSO300,00
TgCO/yr
200 00
250,00
glob VGT 1422 TgCO/yr
150,00
200,00gglob ATSRglob MODISglob MOPITTl b GFED 2
547769594397
100,00
glob GFED 2glob FRPglob GFED 3
397253313
0,00
50,00
jn fb mr ap my je jl ag sp ot nv dc
D t f INTERMEDE BBSO 2
j p y j j g p
11
Data from INTERMEDE BBSO-2Global CO emissions comparisons for 2003

70 00
80,00
BBSO
TgCO/yrN.Ame 276,60 48,07 19,20 25,48 14,75 10,29 14,00
VGT ATSR MODIS MOPITT GFED2 FRP GFED3
40 00
50,00
60,00
70,00
North Am VGTNorth Am ATSRNorth Am MODISN th A MOPITT
TgCO/yr Europe 87,85 7,33 13,16 9,33 3,51 1,09 1,40
N.Asia 559,15 139,49 241,64 101,96 78,99 31,89 49,92
10 00
20,00
30,00
40,00 North Am MOPITTNorth AmGFED2North AmFRPNorth AmGFED3
20,00
25,00
Europe VGT
TgCO/yr
0,00
10,00
jn fb mr ap my je jl ag sp ot nv dc
10,00
15,00
pEurope ATSREurope MODISEurope MOPITTEurope GFED2Europe FRPEurope GFED3
140,00
TgCO/yr
0,00
5,00
jn fb mr ap my je jl ag sp ot nv dc
p
80,00
100,00
120,00
N. Asia VGTN. Asia ATSRN. Asia MODISN Asia MOPITT
TgCO/yr
20,00
40,00
60,00N. Asia MOPITTN,Asia GFED2N,AsiaFRPN,Asia GFED3
Data from INTERMEDE BBSO 2
12
0,00jn fb mr ap my je jl ag sp ot nv dc
Data from INTERMEDE BBSO-2CO comparisons for 2003

BBSO30,00
TgCO/yrS. Ame 121,74 93,08 35,59 121,89 78,32 65,09 65,47
Africa 302 69 201 63 367 38 274 83 162 84 108 83 137 86
VGT ATSR MODIS MOPITT GFED2 FRP GFED3
15,00
20,00
25,00
S Ame VGTS Ame ATSRS Ame MODISS Ame MOPITT
TgCO/yr Africa 302,69 201,63 367,38 274,83 162,84 108,83 137,86
Oceania 73,96 57,90 92,60 60,51 59,74 31,69 44,26
50 00
60,00
70,00
f i G
5,00
10,00
,S Ame GFED 2S Ame FRPS Ame GFED 3
TgCO/yr
25,00 30,00
40,00
50,00 Africa VGTAfrica ATSRAfrica MODISAfrica MOPITTAfrica GFED2Africa FRP
0,00jn fb mr ap my je jl ag sp ot nv dc
TgCO/yr
15,00
20,00
Asia VGTAsia ATSRAsia MODISAsia MOPITT
0,00
10,00
20,00
jn fb mr ap my je jl ag sp ot nv dc
Africa GFED3TgCO/yr
5,00
10,00 Asia GFED 2Asia FRPAsia GFED 3
Data from INTERMEDE BBSO
13
0,00jn fb mr ap my je jl ag sp ot nv dc
Data from INTERMEDE BBSOCO comparisons for 2003

From this workshop activity – 1/3 : BBSO
From the talk of Jean-Marie Grégoire on BBSO comparisons results :
Africa : no big differences between the 3 products (VGT/MODIS/ATSR) Africa : no big differences between the 3 products (VGT/MODIS/ATSR)Reason for that : African evergreen broad forest ecosystems don’tburn while burning occurs in South America and Asian forest
Outside Africa : we can not use the same satellite fire products in the forest and non forest ecosystemy
Recommendation : From the year 2000, the best solution is to useMODIS suite of products : BA for herbaceous/shrub/boreal forest BA/FRP MODIS suite of products : BA for herbaceous/shrub/boreal forest, BA/FRP for evergreen forest and AF for temporal distribution at the seasonal scale.
S ifi f Af i C SEVIRI / G t ti fi i dditi t d i
14
Specific for Africa : Can use SEVIRI / Geostationary fire in addition to derive diurnal cycle of fire activities (aerosol)

1) to have a focus on the new window « mediterranean area »
From this workshop activity – 2/3 : BBSO1) to have a focus on the new window « mediterranean area »
2) Adding in our comparison : - CO emissions from new MODIS BA with the same constant vegetation for 2003CO emissions from new MODIS BA with the same constant vegetation for 2003- CO emissions obtained from MODIS FRP for 2003
3) A new global exercise for 2003 : CO emissions from BA/AF MODIS (GFED-3) with different vegetation (CASA, ISAM, GLC ..) => Our concern : Africa/GFED-3 : underestimates have been noticed from modeling studies
=> Important for choice done in IPCC emissions based on GFED-2 /but nobody knows uncertainties
4) A modeling exercise with comparison to experimental data over Africa with GFED/VGT/Seviri : year (within 2003-2006 including 2004 for Seviri), species (aerosols CO?) models (RegCM Chimere others?) need to be defined
15
(aerosols, CO?), models (RegCM, Chimere, others?) need to be defined…

From this workshop activity – 3/3 : BBSO
- to recommend experiments per land cover type to better experimentallycharacterize emissions from FRP (need comparisons with BA and AF ( pemissions).Example : need in Southern Europe, Africa, boreal areas, South America
and experiments in combustion chamber.... and experiments in combustion chamber
- to coordinate GEIA review on biomass burning emissions (next may)
- GEIA : IGAC/ILEAPS : to develop a BB page dedicated to all experiments around the world (past and planned) => BIBExp (p p )
- to be closely linked to joint our effort to other BB programs (ESF..)
16

A few recommendations
Co-ordinations are needed on these questions within :GOFC and GEIA, IGAC, ILEAPS and ACCENT…
=> To gather satellite providers and users, modellers, vegetation community ...g p , , g y(Such as collaborations within IGBP-DIS and BIBEx during 1990s)
Another type of uncertainties to be treated : yp FRP-based emission inventories : high range in the emission ratios (Wooster/Ichoku)
=> need experiments to validate this method Vegetation : what is the uncertainty on the vegetation choice?
(constant, dynamical…) => need an intercomparison exercise with same satellite products and different vegetation schemes.
Emission factors for some ecosystems. Historical trends : need for informations of satellite product compatibility to
reconstruct emission trends.
=> We (BBSO group) have been asked to write a GEIA review on biomass burning emissions (may)
17
=> We (BBSO group) have been asked to write a GEIA review on biomass burning emissions (may)In GEIA : IGAC/ILEAPS (can be also within GOFC) = to develop a BB webpage dedicated to all
experiments around the world (past and planned).
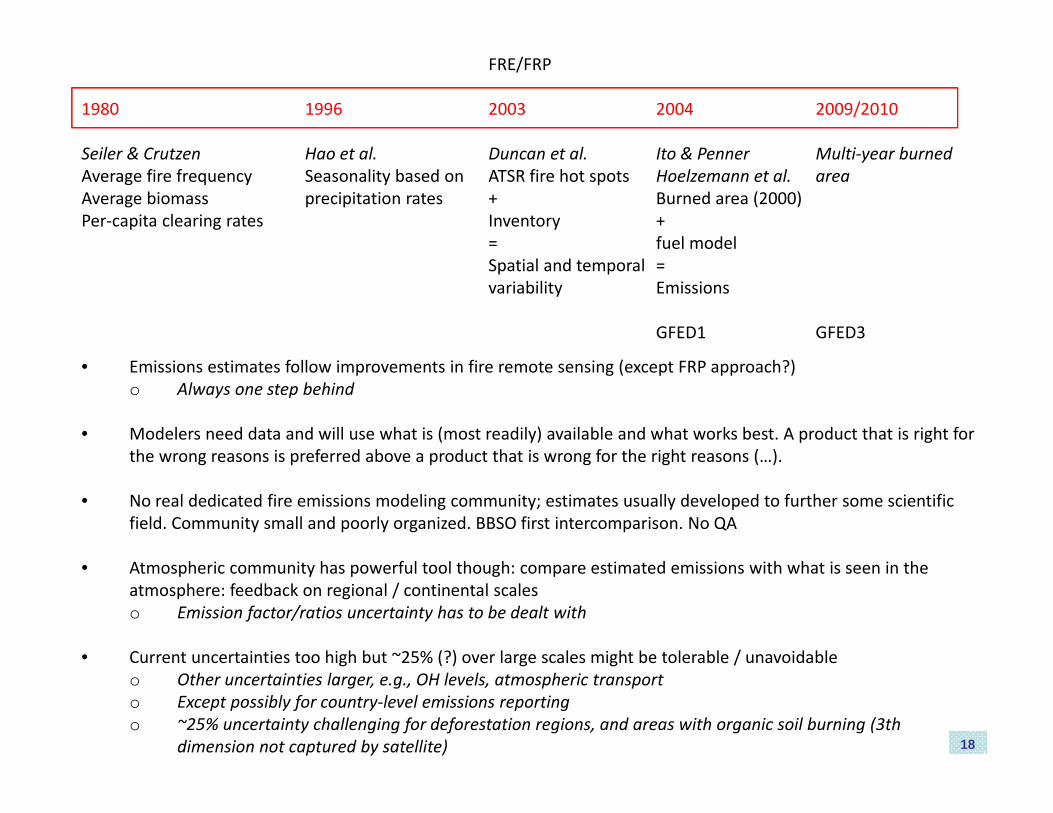
1980
S il & C t
1996
H t l
FRE/FRP
2003
D t l
2004
It & P
2009/2010
M lti b dSeiler & CrutzenAverage fire frequencyAverage biomassPer‐capita clearing rates
Hao et al.Seasonality based on precipitation rates
Duncan et al.ATSR fire hot spots+ Inventory =
Ito & PennerHoelzemann et al.Burned area (2000)+ fuel model
Multi‐year burned area
Spatial and temporal variability
= Emissions
GFED1 GFED3
• Emissions estimates follow improvements in fire remote sensing (except FRP approach?)o Always one step behind
• Modelers need data and will use what is (most readily) available and what works best. A product that is right for the wrong reasons is preferred above a product that is wrong for the right reasons ( )the wrong reasons is preferred above a product that is wrong for the right reasons (…).
• No real dedicated fire emissions modeling community; estimates usually developed to further some scientific field. Community small and poorly organized. BBSO first intercomparison. No QA
• Atmospheric community has powerful tool though: compare estimated emissions with what is seen in the atmosphere: feedback on regional / continental scales o Emission factor/ratios uncertainty has to be dealt with
• Current uncertainties too high but ~25% (?) over large scales might be tolerable / unavoidable
18
u e u ce a es oo g bu 5% ( ) o e a ge sca es g be o e ab e / u a o dab eo Other uncertainties larger, e.g., OH levels, atmospheric transporto Except possibly for country‐level emissions reportingo ~25% uncertainty challenging for deforestation regions, and areas with organic soil burning (3th
dimension not captured by satellite)

moderate resolution (500‐1km) Main input:Ancillary data (fuel, land cover, cc, etc)
burned areap land cover, cc, etc)
Case studies, regional expertise
Moderate resolution emissions d li Coarse resolution emissions
expertise
gnitu
de
modeling(simple / inventory / “get Google
involved”)
Coarse resolution emissions modeling(detailed)
ders of m
ag2‐4 ord
Typical 0.25d / CMG emissions iMain output:
19
estimatesMain output:

GFED3 fuel consumption (g C / m2)
20