bex 305 manual
DESCRIPTION
BEX 305 ManualTRANSCRIPT
SAP Business Information Warehouse
Business Explorer Analyzer for Power Users
(BEX_305)
University of Kentucky IRIS – Business Warehouse Team
Last Updated: 11/13/2005 Questions/Comments: [email protected]
BEx Analyzer Page 1
Objective This course is intended to familiarize users with the SAP Business Information Warehouse (BW): Business Explorer-Analyzer (BEx-Analyzer). After attending this class, you should be able to create, run, modify and save your BEx Queries. You will have to pass a skills test before you are given the Power User Role in Production.
BEx Analyzer Page 2
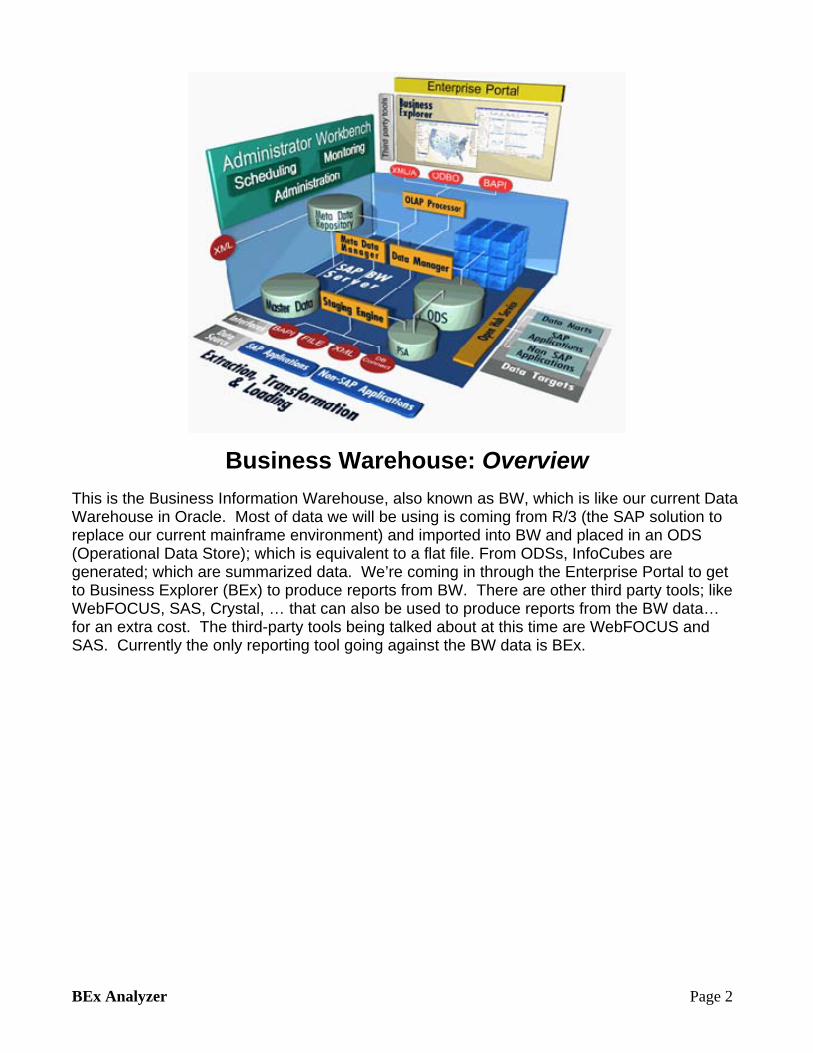
Business Warehouse: Overview
This is the Business Information Warehouse, also known as BW, which is like our current Data Warehouse in Oracle. Most of data we will be using is coming from R/3 (the SAP solution to replace our current mainframe environment) and imported into BW and placed in an ODS (Operational Data Store); which is equivalent to a flat file. From ODSs, InfoCubes are generated; which are summarized data. We’re coming in through the Enterprise Portal to get to Business Explorer (BEx) to produce reports from BW. There are other third party tools; like WebFOCUS, SAS, Crystal, … that can also be used to produce reports from the BW data… for an extra cost. The third-party tools being talked about at this time are WebFOCUS and SAS. Currently the only reporting tool going against the BW data is BEx.
BEx Analyzer Page 3
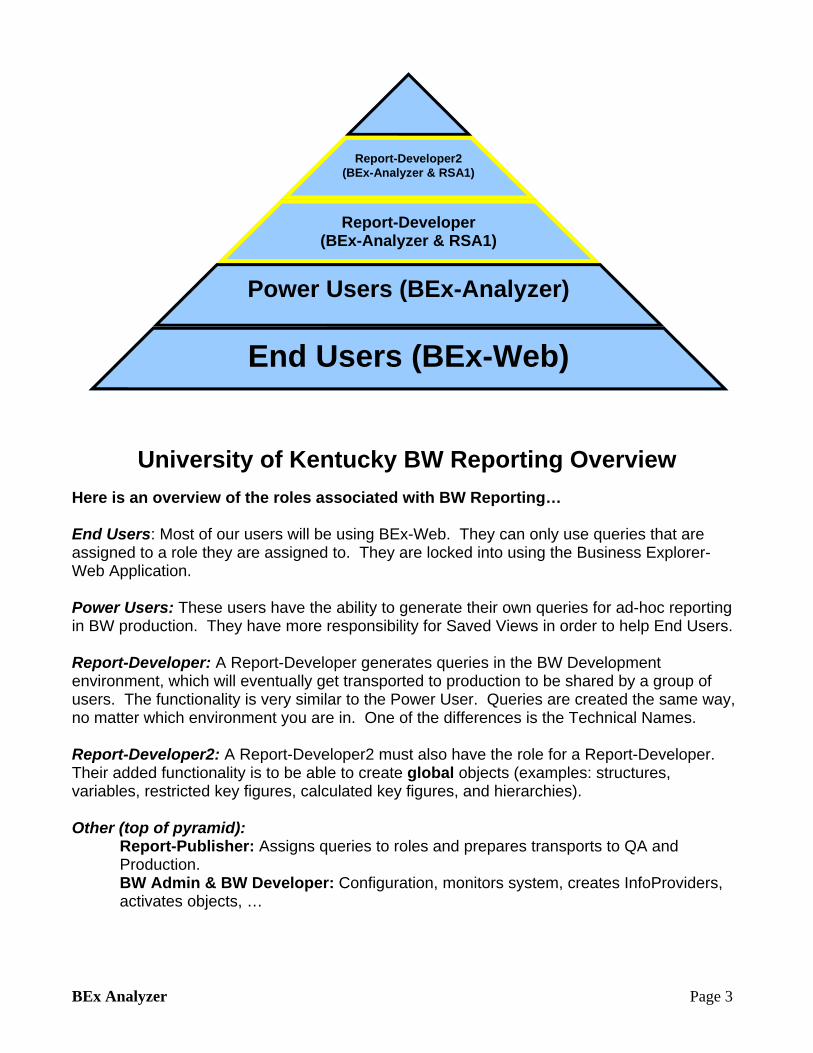
University of Kentucky BW Reporting Overview Here is an overview of the roles associated with BW Reporting… End Users: Most of our users will be using BEx-Web. They can only use queries that are assigned to a role they are assigned to. They are locked into using the Business Explorer-Web Application. Power Users: These users have the ability to generate their own queries for ad-hoc reporting in BW production. They have more responsibility for Saved Views in order to help End Users. Report-Developer: A Report-Developer generates queries in the BW Development environment, which will eventually get transported to production to be shared by a group of users. The functionality is very similar to the Power User. Queries are created the same way, no matter which environment you are in. One of the differences is the Technical Names. Report-Developer2: A Report-Developer2 must also have the role for a Report-Developer. Their added functionality is to be able to create global objects (examples: structures, variables, restricted key figures, calculated key figures, and hierarchies). Other (top of pyramid):
Report-Publisher: Assigns queries to roles and prepares transports to QA and Production. BW Admin & BW Developer: Configuration, monitors system, creates InfoProviders, activates objects, …
Report-Developer2(BEx-Analyzer & RSA1)
Report-Developer (BEx-Analyzer & RSA1)
Power Users (BEx-Analyzer)
End Users (BEx-Web)
BEx Analyzer Page 4
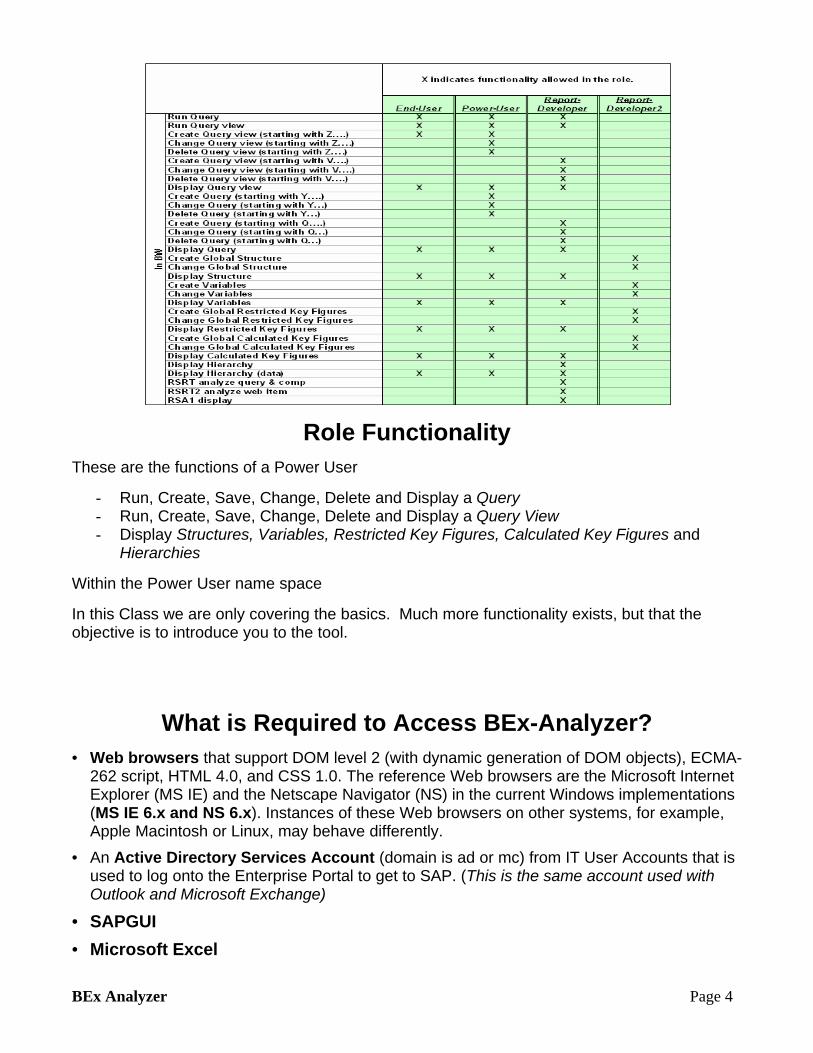
Role Functionality These are the functions of a Power User
- Run, Create, Save, Change, Delete and Display a Query - Run, Create, Save, Change, Delete and Display a Query View - Display Structures, Variables, Restricted Key Figures, Calculated Key Figures and
Hierarchies Within the Power User name space In this Class we are only covering the basics. Much more functionality exists, but that the objective is to introduce you to the tool.
What is Required to Access BEx-Analyzer? • Web browsers that support DOM level 2 (with dynamic generation of DOM objects), ECMA-
262 script, HTML 4.0, and CSS 1.0. The reference Web browsers are the Microsoft Internet Explorer (MS IE) and the Netscape Navigator (NS) in the current Windows implementations (MS IE 6.x and NS 6.x). Instances of these Web browsers on other systems, for example, Apple Macintosh or Linux, may behave differently.
• An Active Directory Services Account (domain is ad or mc) from IT User Accounts that is used to log onto the Enterprise Portal to get to SAP. (This is the same account used with Outlook and Microsoft Exchange)
• SAPGUI • Microsoft Excel
BEx Analyzer Page 5
Installing SAPGUI • Log onto http://download.uky.edu with your U-Connect userid and password
• Search for SAPGUI
• Download
• Restart your computer
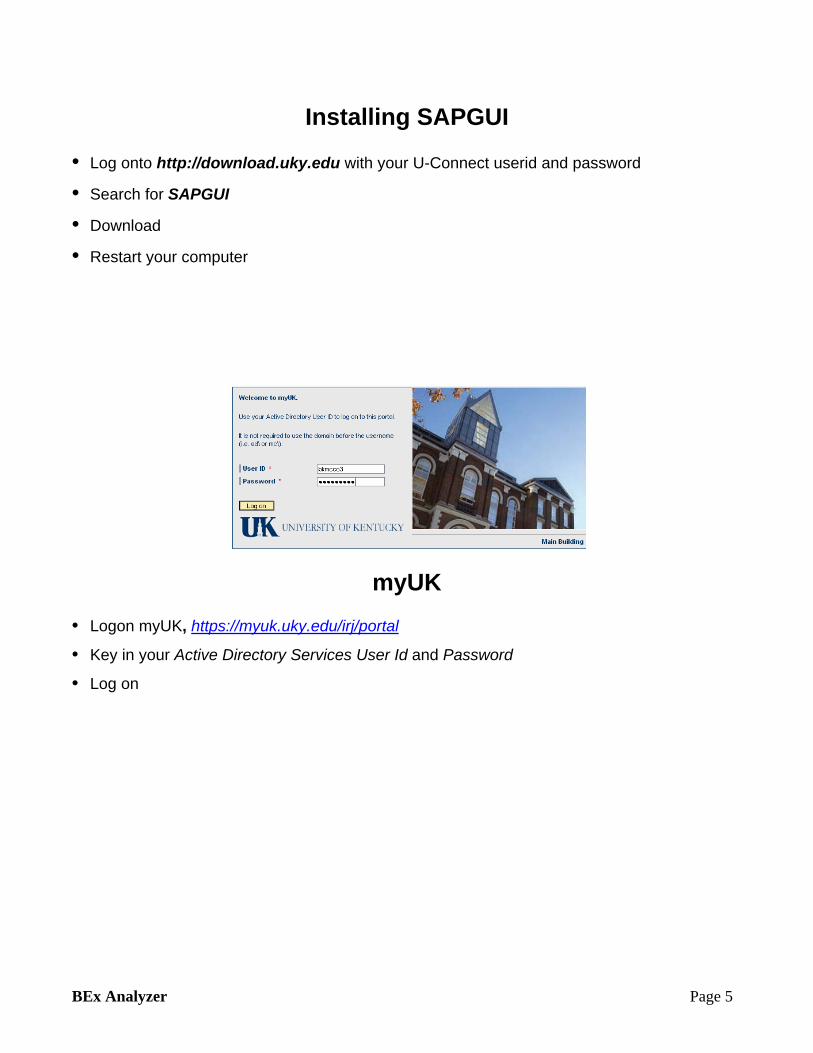
myUK • Logon myUK, https://myuk.uky.edu/irj/portal
• Key in your Active Directory Services User Id and Password
• Log on
BEx Analyzer Page 6
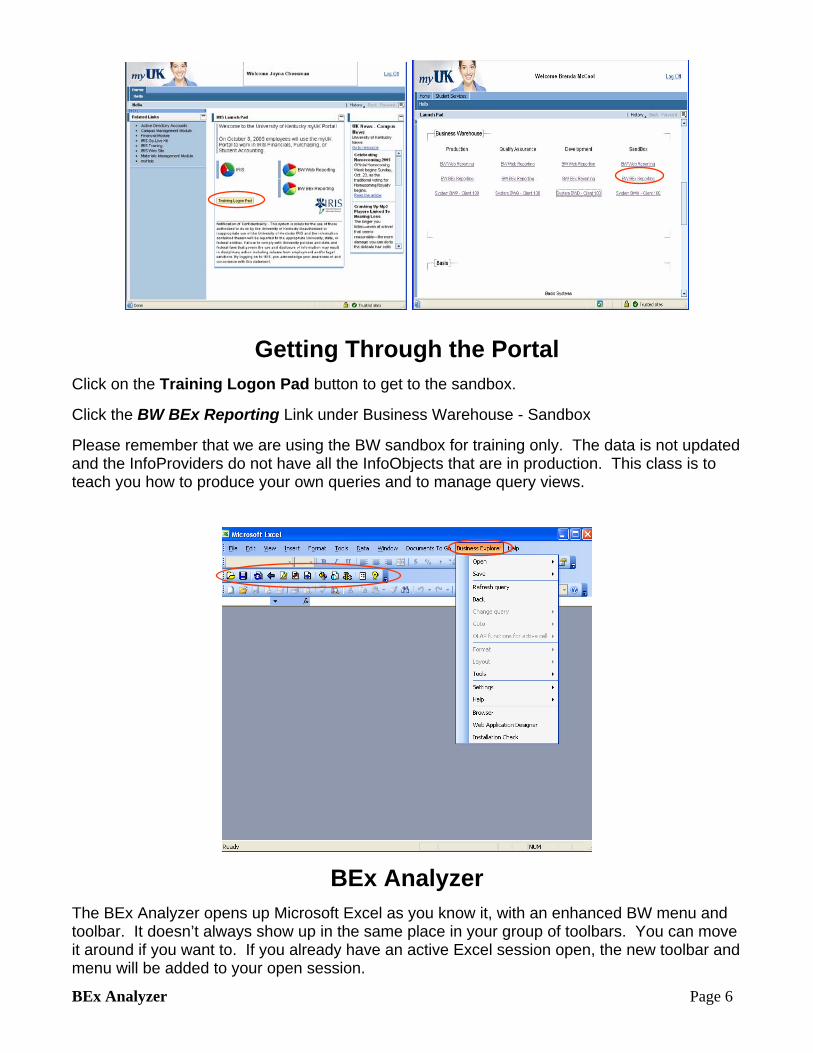
Getting Through the Portal Click on the Training Logon Pad button to get to the sandbox. Click the BW BEx Reporting Link under Business Warehouse - Sandbox Please remember that we are using the BW sandbox for training only. The data is not updated and the InfoProviders do not have all the InfoObjects that are in production. This class is to teach you how to produce your own queries and to manage query views.
BEx Analyzer The BEx Analyzer opens up Microsoft Excel as you know it, with an enhanced BW menu and toolbar. It doesn’t always show up in the same place in your group of toolbars. You can move it around if you want to. If you already have an active Excel session open, the new toolbar and menu will be added to your open session.
BEx Analyzer Page 7
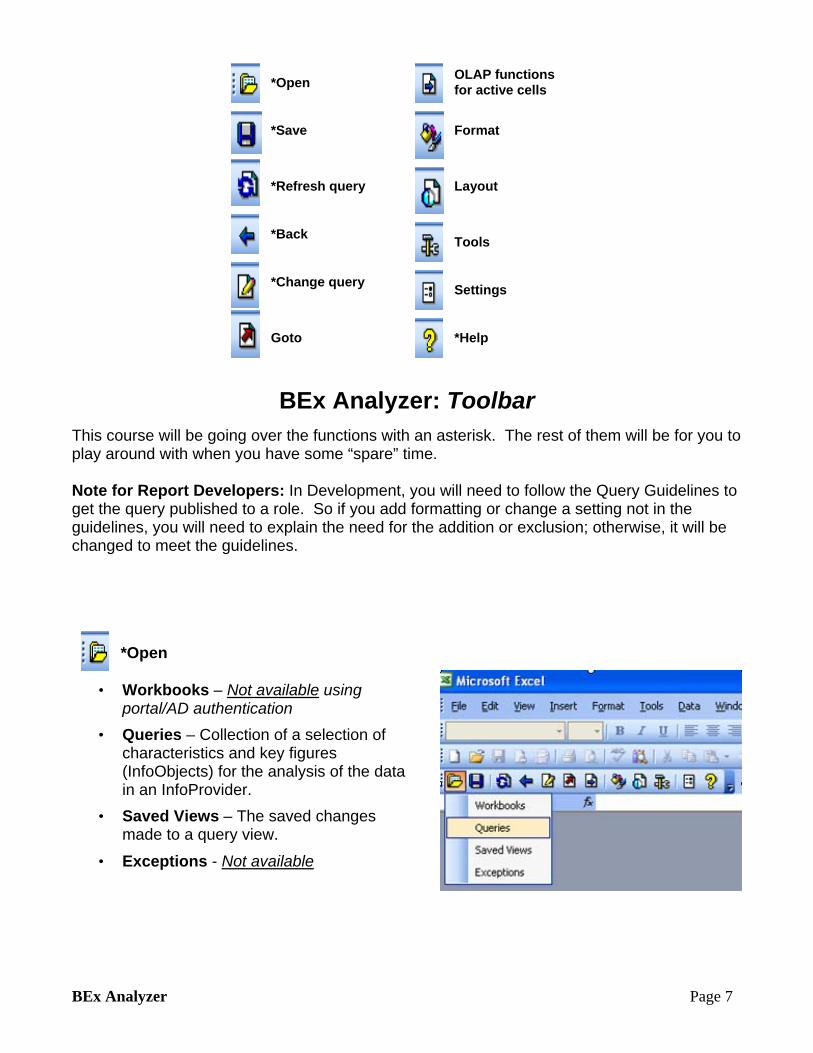
BEx Analyzer: Toolbar This course will be going over the functions with an asterisk. The rest of them will be for you to play around with when you have some “spare” time. Note for Report Developers: In Development, you will need to follow the Query Guidelines to get the query published to a role. So if you add formatting or change a setting not in the guidelines, you will need to explain the need for the addition or exclusion; otherwise, it will be changed to meet the guidelines.
*Open
*Save
*Refresh query
*Back
*Change query
Goto
OLAP functions for active cells
Format
Layout
Tools
Settings
*Help
• Workbooks – Not available using portal/AD authentication
• Queries – Collection of a selection of characteristics and key figures (InfoObjects) for the analysis of the data in an InfoProvider.
• Saved Views – The saved changes made to a query view.
• Exceptions - Not available
*Open
BEx Analyzer Page 8
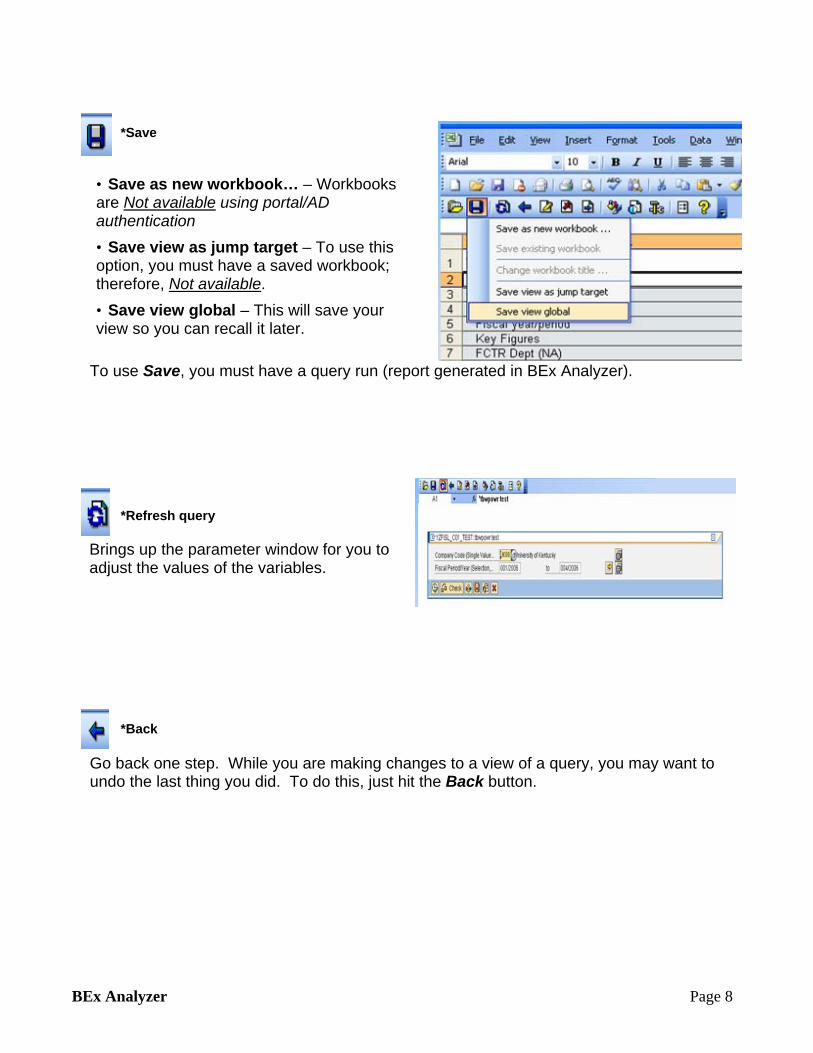
To use Save, you must have a query run (report generated in BEx Analyzer).
Go back one step. While you are making changes to a view of a query, you may want to undo the last thing you did. To do this, just hit the Back button.
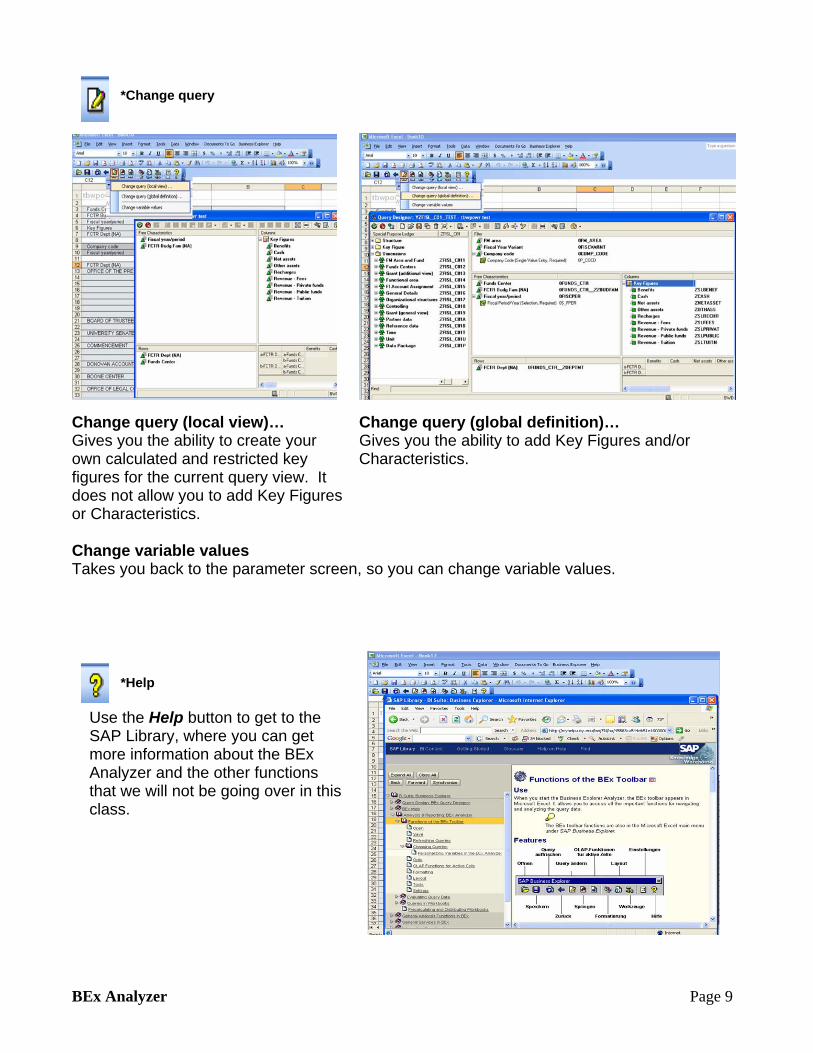
Brings up the parameter window for you to adjust the values of the variables.
• Save as new workbook… – Workbooks are Not available using portal/AD authentication • Save view as jump target – To use this option, you must have a saved workbook; therefore, Not available. • Save view global – This will save your view so you can recall it later.
*Save
*Refresh query
*Back
BEx Analyzer Page 9
Change query (local view)… Change query (global definition)… Gives you the ability to create your Gives you the ability to add Key Figures and/or own calculated and restricted key Characteristics. figures for the current query view. It does not allow you to add Key Figures or Characteristics. Change variable values Takes you back to the parameter screen, so you can change variable values.
Use the Help button to get to the SAP Library, where you can get more information about the BEx Analyzer and the other functions that we will not be going over in this class.
*Change query
*Help
BEx Analyzer Page 10
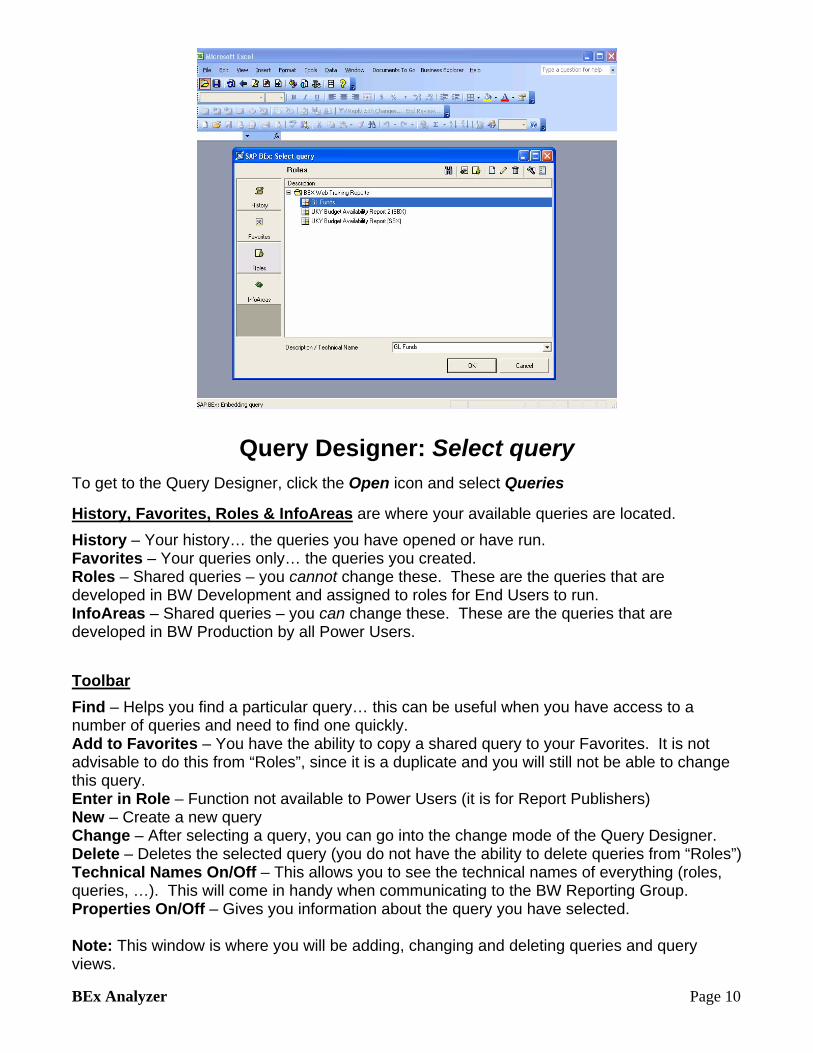
Query Designer: Select query To get to the Query Designer, click the Open icon and select Queries History, Favorites, Roles & InfoAreas are where your available queries are located. History – Your history… the queries you have opened or have run. Favorites – Your queries only… the queries you created. Roles – Shared queries – you cannot change these. These are the queries that are developed in BW Development and assigned to roles for End Users to run. InfoAreas – Shared queries – you can change these. These are the queries that are developed in BW Production by all Power Users. Toolbar Find – Helps you find a particular query… this can be useful when you have access to a number of queries and need to find one quickly. Add to Favorites – You have the ability to copy a shared query to your Favorites. It is not advisable to do this from “Roles”, since it is a duplicate and you will still not be able to change this query. Enter in Role – Function not available to Power Users (it is for Report Publishers) New – Create a new query Change – After selecting a query, you can go into the change mode of the Query Designer. Delete – Deletes the selected query (you do not have the ability to delete queries from “Roles”) Technical Names On/Off – This allows you to see the technical names of everything (roles, queries, …). This will come in handy when communicating to the BW Reporting Group. Properties On/Off – Gives you information about the query you have selected. Note: This window is where you will be adding, changing and deleting queries and query views.
BEx Analyzer Page 11
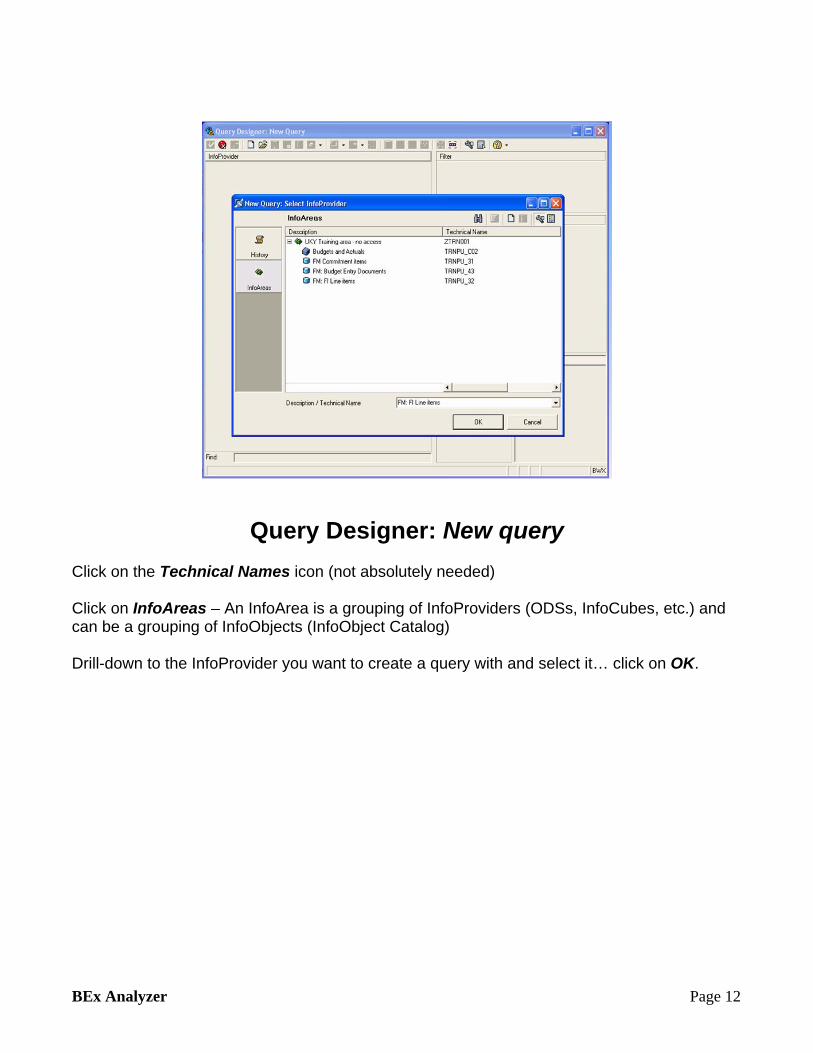
Query Designer: New query
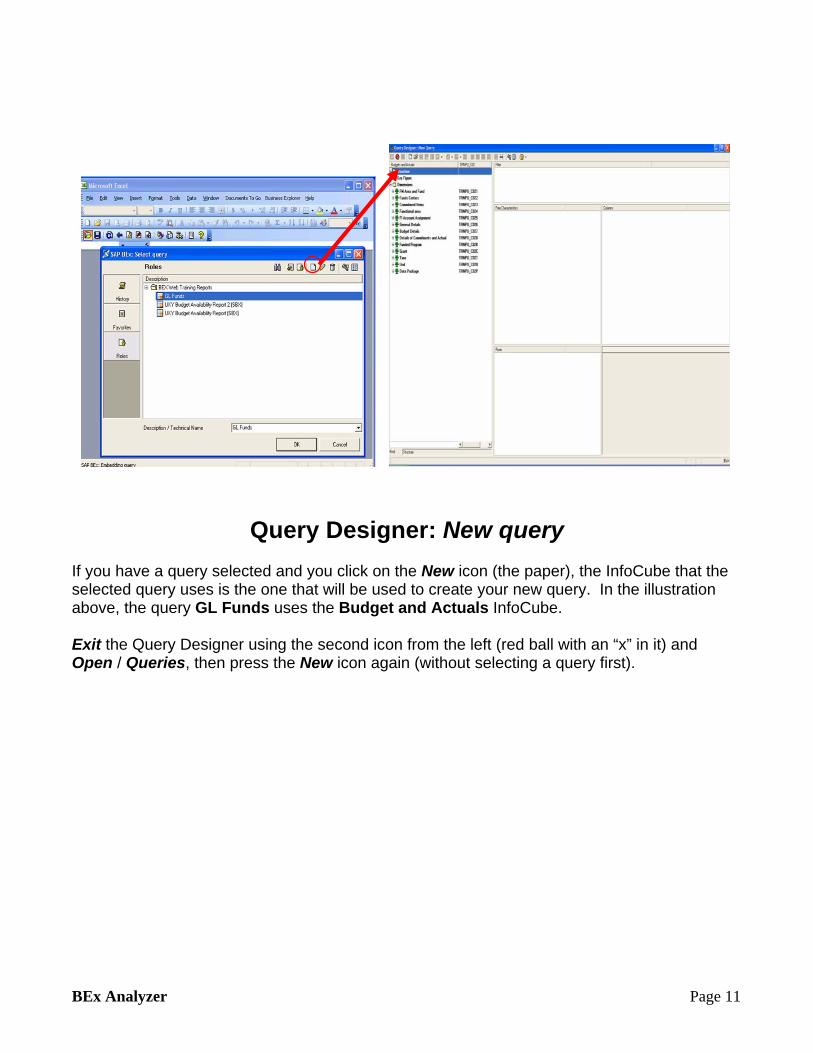
If you have a query selected and you click on the New icon (the paper), the InfoCube that the selected query uses is the one that will be used to create your new query. In the illustration above, the query GL Funds uses the Budget and Actuals InfoCube. Exit the Query Designer using the second icon from the left (red ball with an “x” in it) and Open / Queries, then press the New icon again (without selecting a query first).
BEx Analyzer Page 12
Query Designer: New query Click on the Technical Names icon (not absolutely needed) Click on InfoAreas – An InfoArea is a grouping of InfoProviders (ODSs, InfoCubes, etc.) and can be a grouping of InfoObjects (InfoObject Catalog) Drill-down to the InfoProvider you want to create a query with and select it… click on OK.
BEx Analyzer Page 13
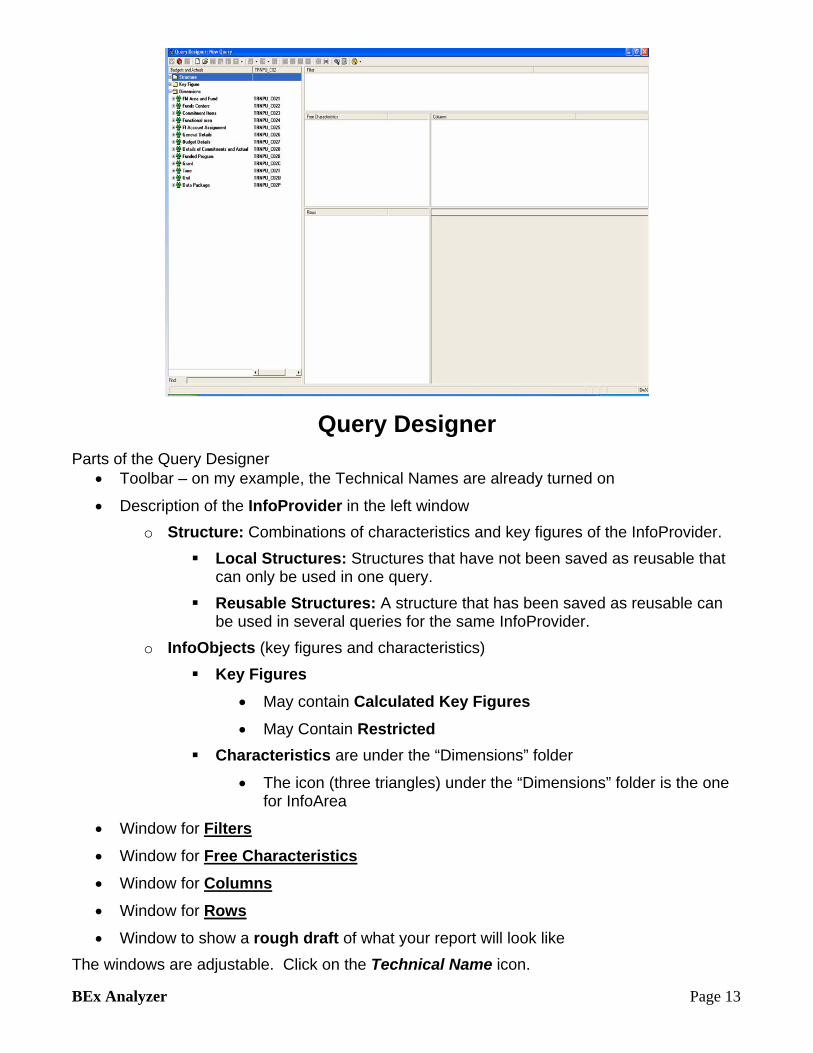
Query Designer Parts of the Query Designer
• Toolbar – on my example, the Technical Names are already turned on
• Description of the InfoProvider in the left window o Structure: Combinations of characteristics and key figures of the InfoProvider.
Local Structures: Structures that have not been saved as reusable that can only be used in one query.
Reusable Structures: A structure that has been saved as reusable can be used in several queries for the same InfoProvider.
o InfoObjects (key figures and characteristics) Key Figures
• May contain Calculated Key Figures • May Contain Restricted
Characteristics are under the “Dimensions” folder
• The icon (three triangles) under the “Dimensions” folder is the one for InfoArea
• Window for Filters • Window for Free Characteristics • Window for Columns • Window for Rows • Window to show a rough draft of what your report will look like
The windows are adjustable. Click on the Technical Name icon.
BEx Analyzer Page 14
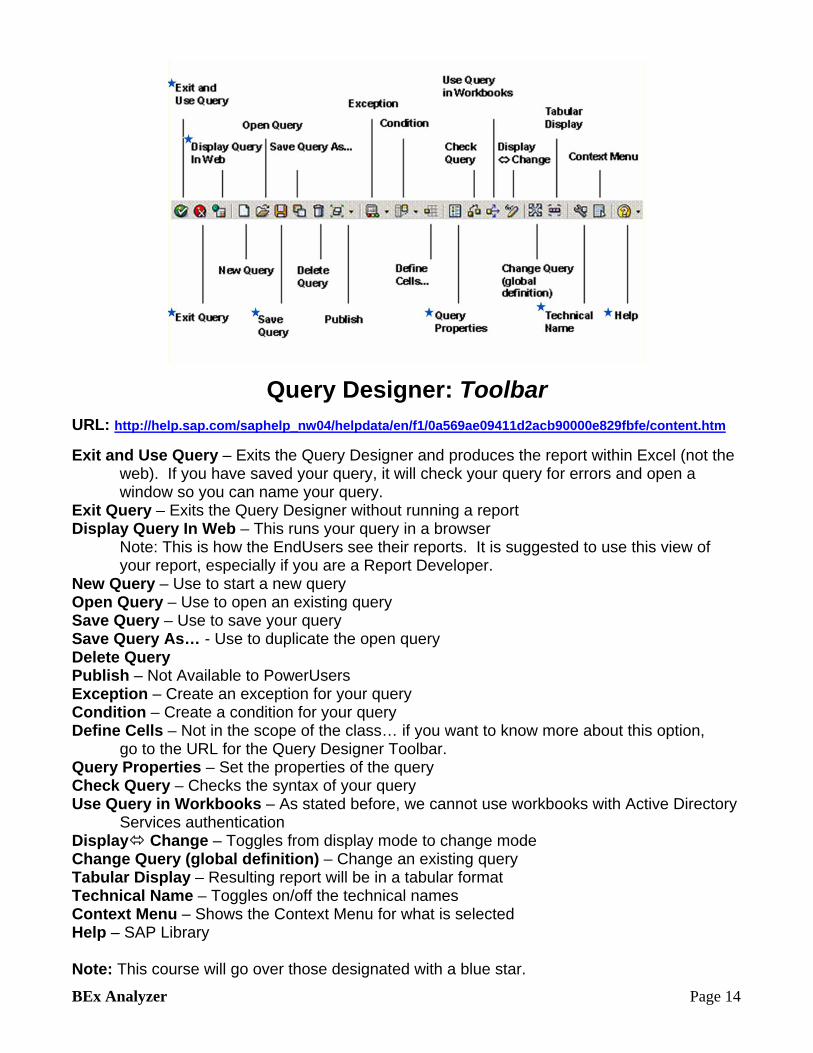
Query Designer: Toolbar URL: http://help.sap.com/saphelp_nw04/helpdata/en/f1/0a569ae09411d2acb90000e829fbfe/content.htm Exit and Use Query – Exits the Query Designer and produces the report within Excel (not the
web). If you have saved your query, it will check your query for errors and open a window so you can name your query.
Exit Query – Exits the Query Designer without running a report Display Query In Web – This runs your query in a browser
Note: This is how the EndUsers see their reports. It is suggested to use this view of your report, especially if you are a Report Developer.
New Query – Use to start a new query Open Query – Use to open an existing query Save Query – Use to save your query Save Query As… - Use to duplicate the open query Delete Query Publish – Not Available to PowerUsers Exception – Create an exception for your query Condition – Create a condition for your query Define Cells – Not in the scope of the class… if you want to know more about this option,
go to the URL for the Query Designer Toolbar. Query Properties – Set the properties of the query Check Query – Checks the syntax of your query Use Query in Workbooks – As stated before, we cannot use workbooks with Active Directory
Services authentication Display Change – Toggles from display mode to change mode Change Query (global definition) – Change an existing query Tabular Display – Resulting report will be in a tabular format Technical Name – Toggles on/off the technical names Context Menu – Shows the Context Menu for what is selected Help – SAP Library Note: This course will go over those designated with a blue star.
BEx Analyzer Page 15
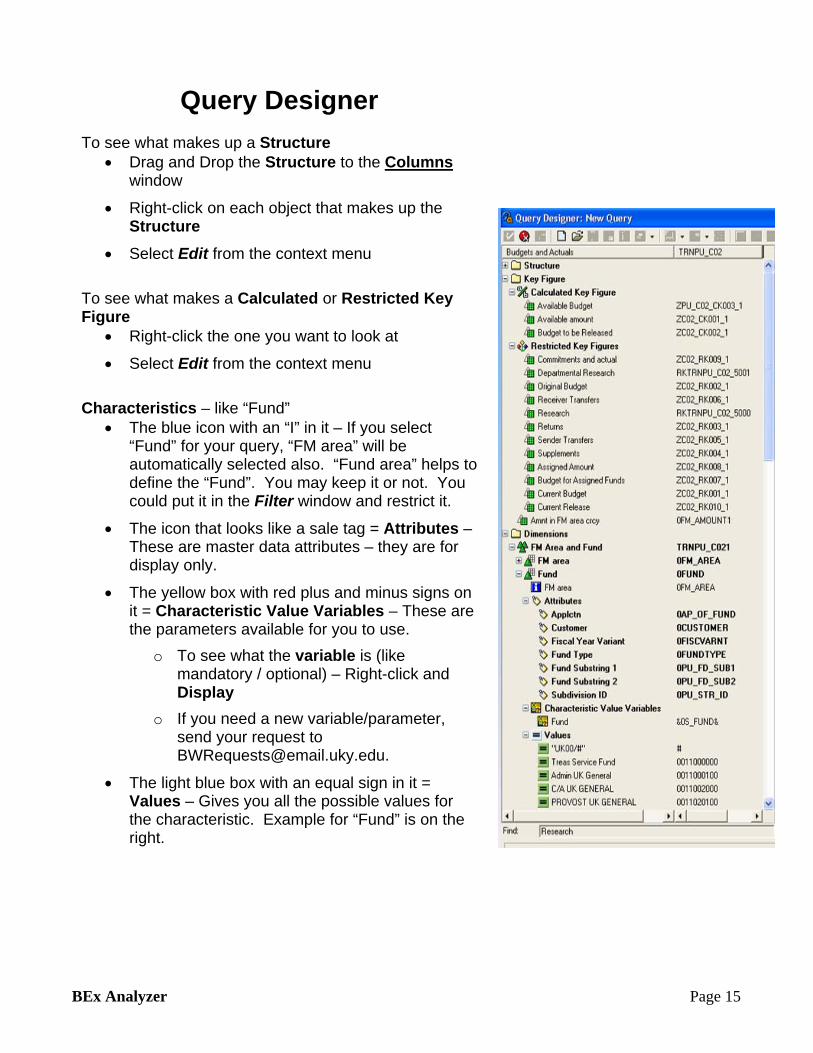
Query Designer To see what makes up a Structure
• Drag and Drop the Structure to the Columns window
• Right-click on each object that makes up the Structure
• Select Edit from the context menu To see what makes a Calculated or Restricted Key Figure
• Right-click the one you want to look at
• Select Edit from the context menu Characteristics – like “Fund”
• The blue icon with an “I” in it – If you select “Fund” for your query, “FM area” will be automatically selected also. “Fund area” helps to define the “Fund”. You may keep it or not. You could put it in the Filter window and restrict it.
• The icon that looks like a sale tag = Attributes – These are master data attributes – they are for display only.
• The yellow box with red plus and minus signs on it = Characteristic Value Variables – These are the parameters available for you to use.
o To see what the variable is (like mandatory / optional) – Right-click and Display
o If you need a new variable/parameter, send your request to [email protected].
• The light blue box with an equal sign in it = Values – Gives you all the possible values for the characteristic. Example for “Fund” is on the right.
BEx Analyzer Page 16
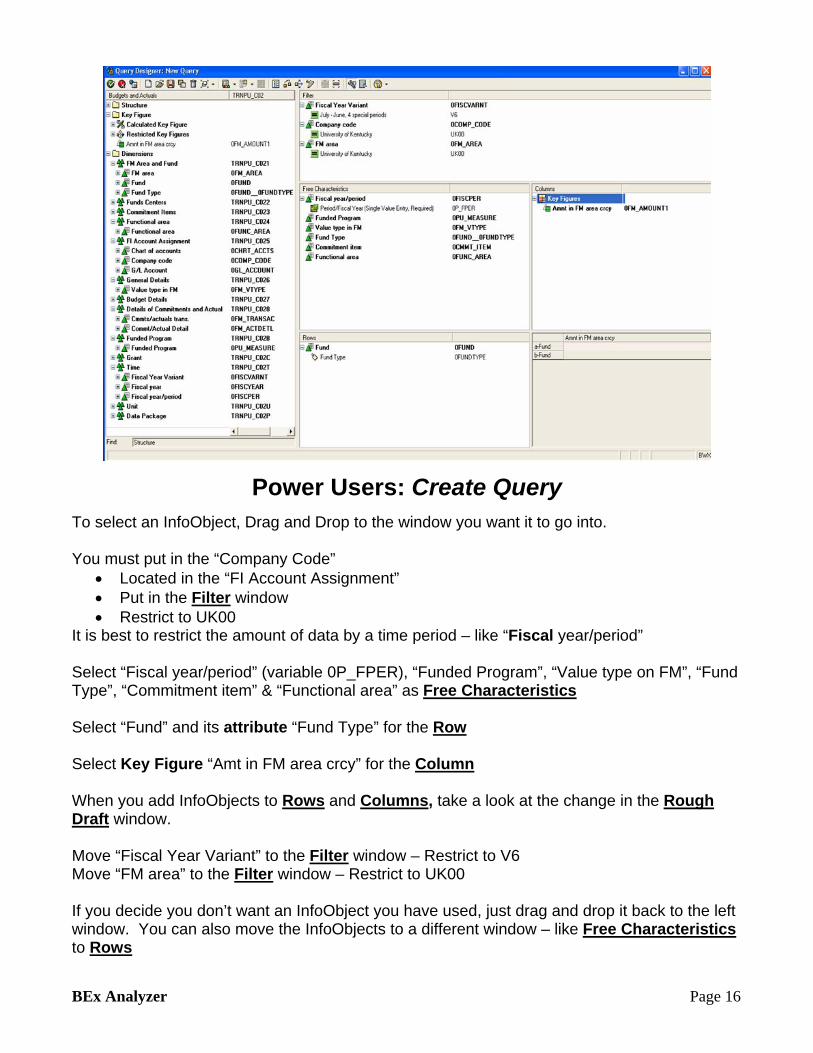
Power Users: Create Query To select an InfoObject, Drag and Drop to the window you want it to go into. You must put in the “Company Code”
• Located in the “FI Account Assignment” • Put in the Filter window • Restrict to UK00
It is best to restrict the amount of data by a time period – like “Fiscal year/period” Select “Fiscal year/period” (variable 0P_FPER), “Funded Program”, “Value type on FM”, “Fund Type”, “Commitment item” & “Functional area” as Free Characteristics Select “Fund” and its attribute “Fund Type” for the Row Select Key Figure “Amt in FM area crcy” for the Column When you add InfoObjects to Rows and Columns, take a look at the change in the Rough Draft window. Move “Fiscal Year Variant” to the Filter window – Restrict to V6 Move “FM area” to the Filter window – Restrict to UK00 If you decide you don’t want an InfoObject you have used, just drag and drop it back to the left window. You can also move the InfoObjects to a different window – like Free Characteristics to Rows
BEx Analyzer Page 17
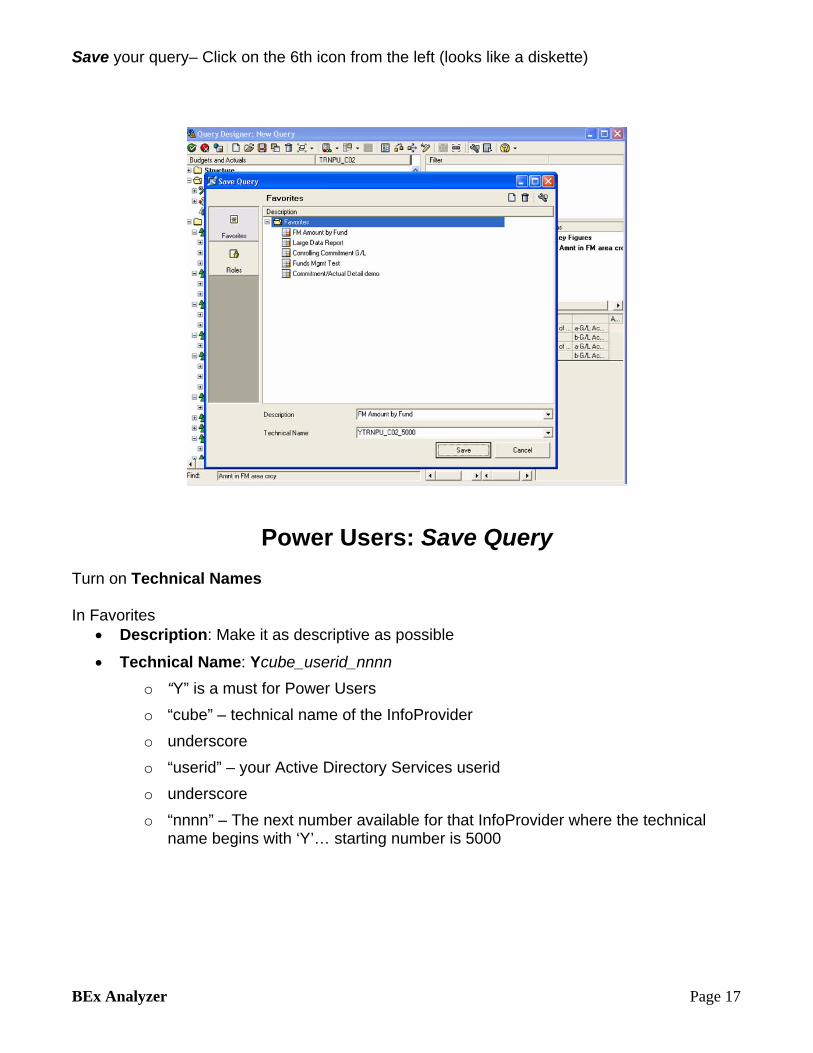
Save your query– Click on the 6th icon from the left (looks like a diskette)
Power Users: Save Query Turn on Technical Names In Favorites
• Description: Make it as descriptive as possible
• Technical Name: Ycube_userid_nnnn o “Y” is a must for Power Users o “cube” – technical name of the InfoProvider o underscore o “userid” – your Active Directory Services userid o underscore o “nnnn” – The next number available for that InfoProvider where the technical
name begins with ‘Y’… starting number is 5000
BEx Analyzer Page 18
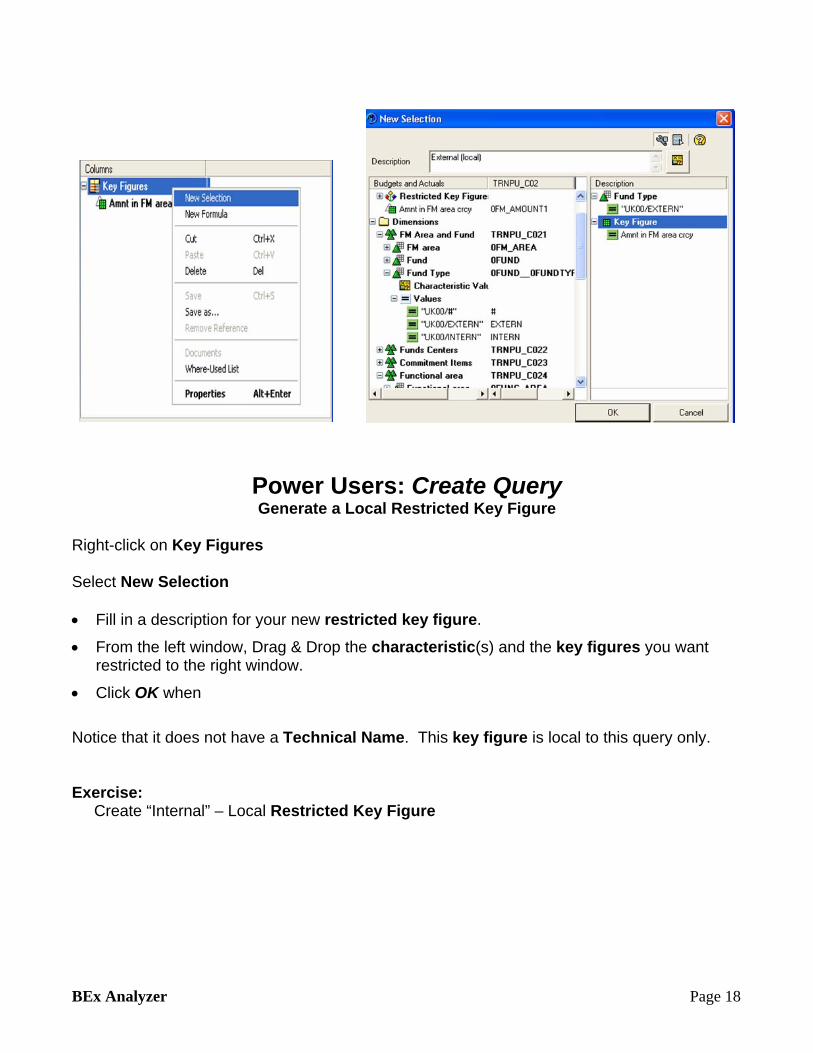
Power Users: Create Query Generate a Local Restricted Key Figure
Right-click on Key Figures Select New Selection • Fill in a description for your new restricted key figure.
• From the left window, Drag & Drop the characteristic(s) and the key figures you want restricted to the right window.
• Click OK when Notice that it does not have a Technical Name. This key figure is local to this query only. Exercise: Create “Internal” – Local Restricted Key Figure
BEx Analyzer Page 19
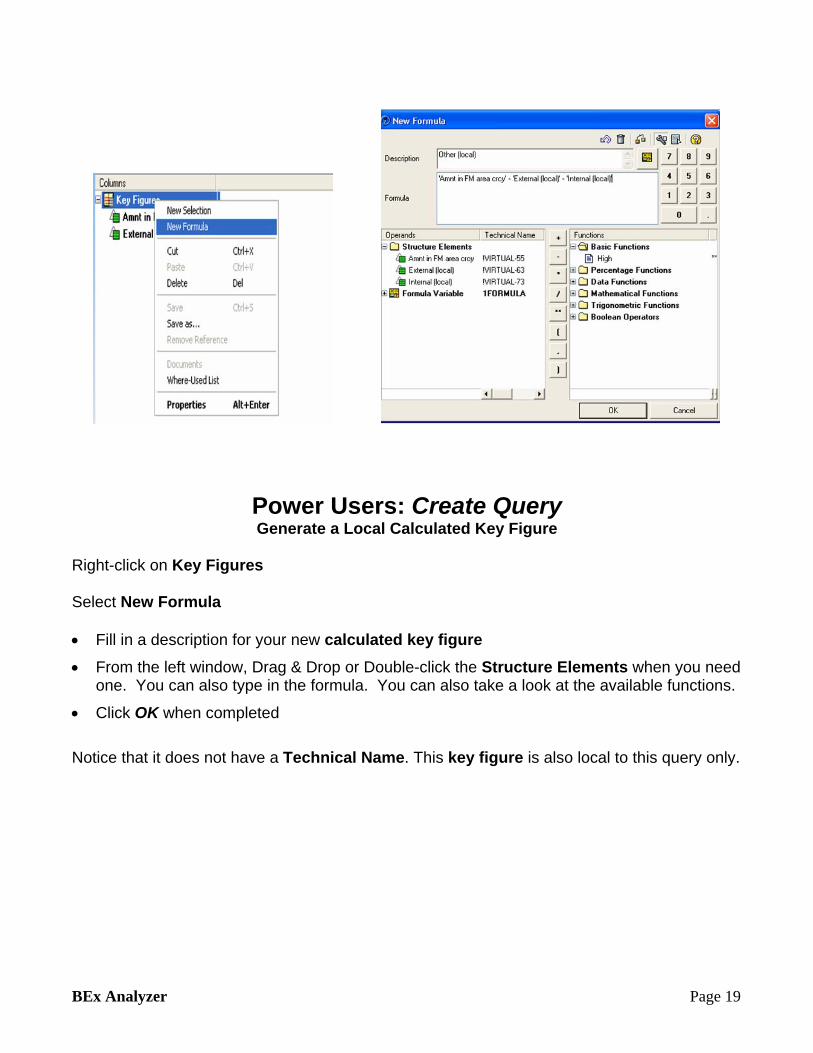
Power Users: Create Query Generate a Local Calculated Key Figure
Right-click on Key Figures Select New Formula • Fill in a description for your new calculated key figure
• From the left window, Drag & Drop or Double-click the Structure Elements when you need one. You can also type in the formula. You can also take a look at the available functions.
• Click OK when completed Notice that it does not have a Technical Name. This key figure is also local to this query only.
BEx Analyzer Page 20
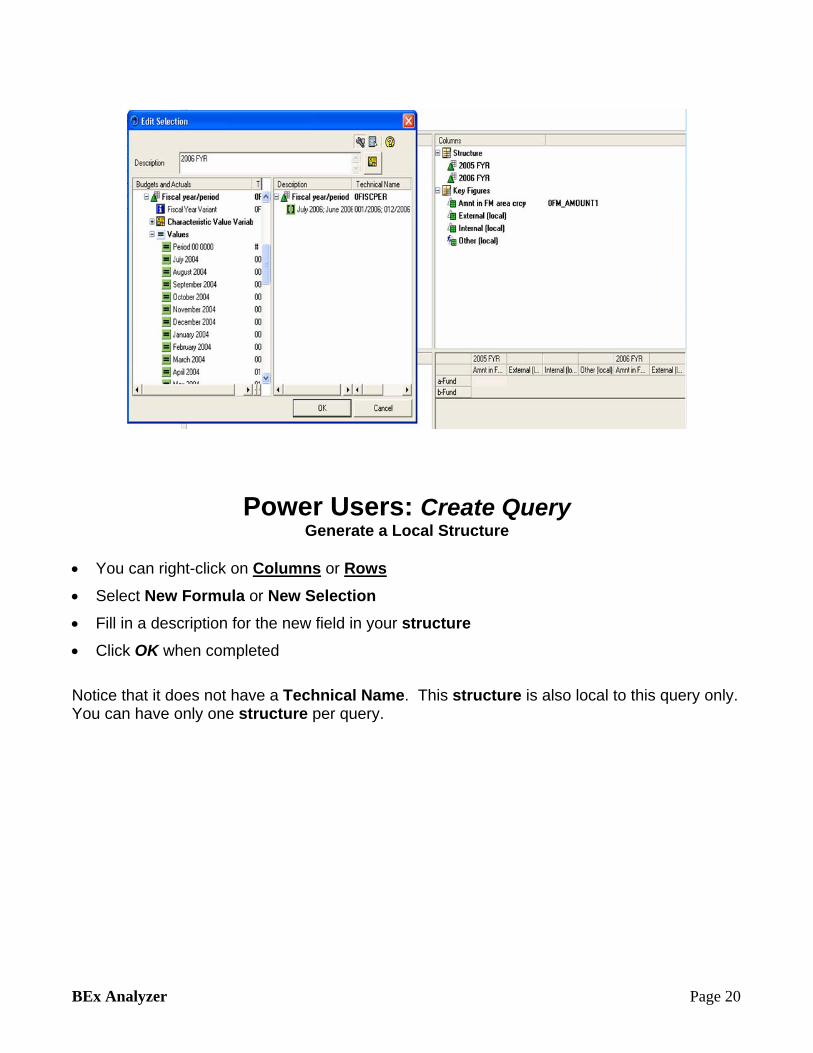
Power Users: Create Query Generate a Local Structure
• You can right-click on Columns or Rows
• Select New Formula or New Selection
• Fill in a description for the new field in your structure
• Click OK when completed Notice that it does not have a Technical Name. This structure is also local to this query only. You can have only one structure per query.
BEx Analyzer Page 21
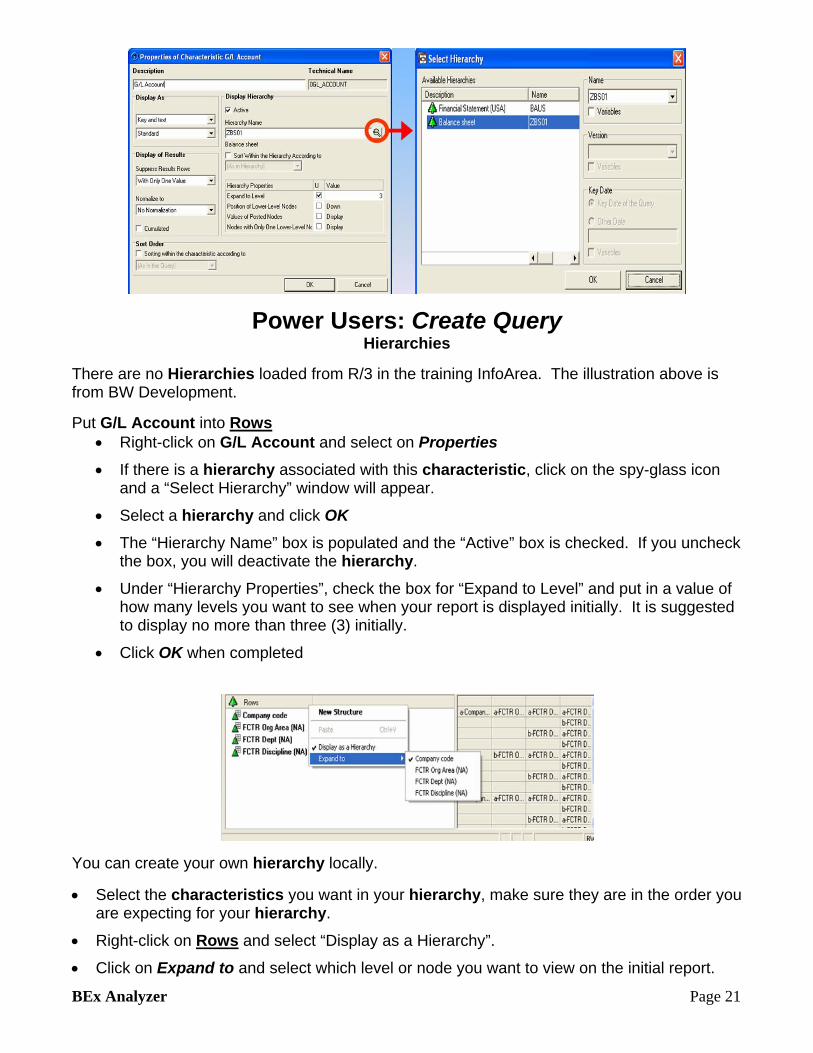
Power Users: Create Query Hierarchies
There are no Hierarchies loaded from R/3 in the training InfoArea. The illustration above is from BW Development. Put G/L Account into Rows
• Right-click on G/L Account and select on Properties
• If there is a hierarchy associated with this characteristic, click on the spy-glass icon and a “Select Hierarchy” window will appear.
• Select a hierarchy and click OK
• The “Hierarchy Name” box is populated and the “Active” box is checked. If you uncheck the box, you will deactivate the hierarchy.
• Under “Hierarchy Properties”, check the box for “Expand to Level” and put in a value of how many levels you want to see when your report is displayed initially. It is suggested to display no more than three (3) initially.
• Click OK when completed
You can create your own hierarchy locally.
• Select the characteristics you want in your hierarchy, make sure they are in the order you are expecting for your hierarchy.
• Right-click on Rows and select “Display as a Hierarchy”.
• Click on Expand to and select which level or node you want to view on the initial report.
BEx Analyzer Page 22
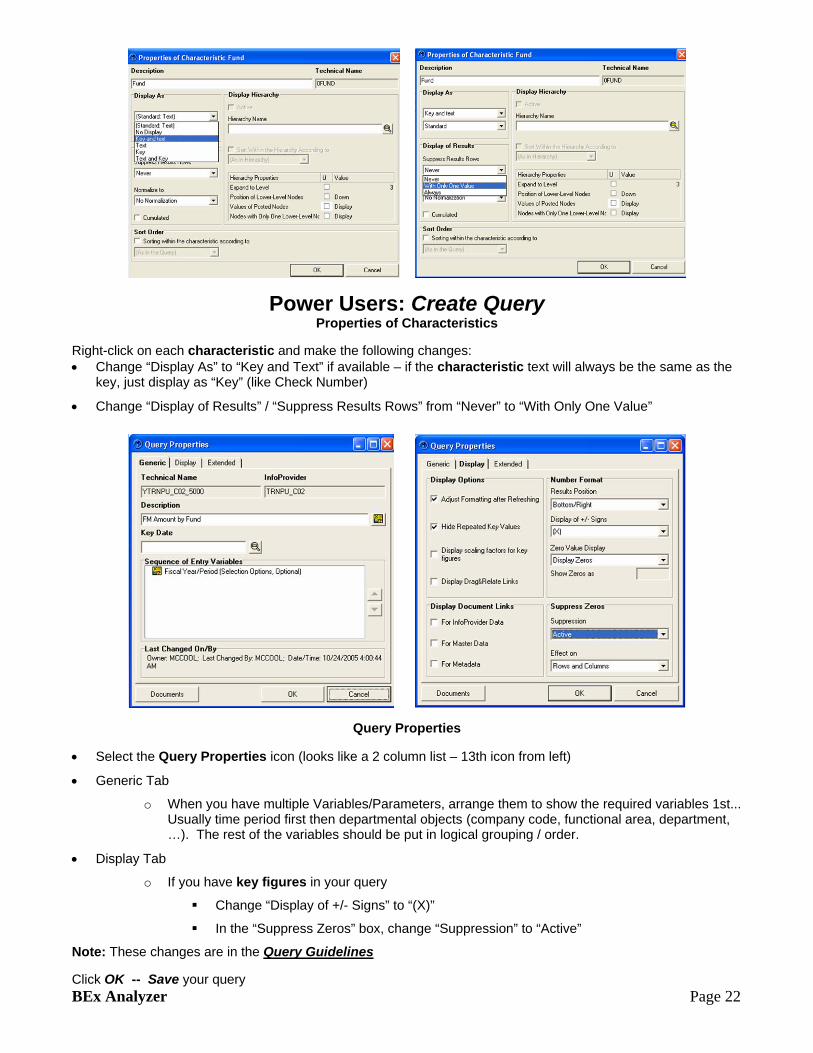
Power Users: Create Query Properties of Characteristics
Right-click on each characteristic and make the following changes: • Change “Display As” to “Key and Text” if available – if the characteristic text will always be the same as the
key, just display as “Key” (like Check Number)
• Change “Display of Results” / “Suppress Results Rows” from “Never” to “With Only One Value”
Query Properties • Select the Query Properties icon (looks like a 2 column list – 13th icon from left)
• Generic Tab
o When you have multiple Variables/Parameters, arrange them to show the required variables 1st... Usually time period first then departmental objects (company code, functional area, department, …). The rest of the variables should be put in logical grouping / order.
• Display Tab
o If you have key figures in your query
Change “Display of +/- Signs” to “(X)”
In the “Suppress Zeros” box, change “Suppression” to “Active”
Note: These changes are in the Query Guidelines Click OK -- Save your query
BEx Analyzer Page 23
Power Users: Run Query There are two ways to display the output of a query, in Excel or on the Web.
Display Report in Excel
• If in the Query Designer • Click on the first icon (green ball with a check mark in it)
• If not in Query Designer • Open • Queries • Drill-down to a query • Double-click the query and it will run in Excel.
Display Report on the Web
• If in the Query Designer • Click on the third icon – looks like a spreadsheet with a world in the upper left
corner • If not in Query Designer
• Open • Queries • Drill-down to a query • Single-click the query • Change the query
• Right-click and select Change OR • Click on the icon that looks like a pencil
Note: This will put you in the Query Designer. See 1st option.
BEx Analyzer Page 24
Power Users: Change Query • Open • Queries • Drill-down to a query
• Single-click the query
• Change the query o Right-click and select Change OR o Click on the icon that looks like a pencil
Note: This will put you in the Query Designer
Power Users: Delete Query • Open • Queries • Drill-down to a query
• Single-click the query
• Delete the query o Right-click and select Delete OR o Click on the icon that looks like a trash can
BEx Analyzer Page 25
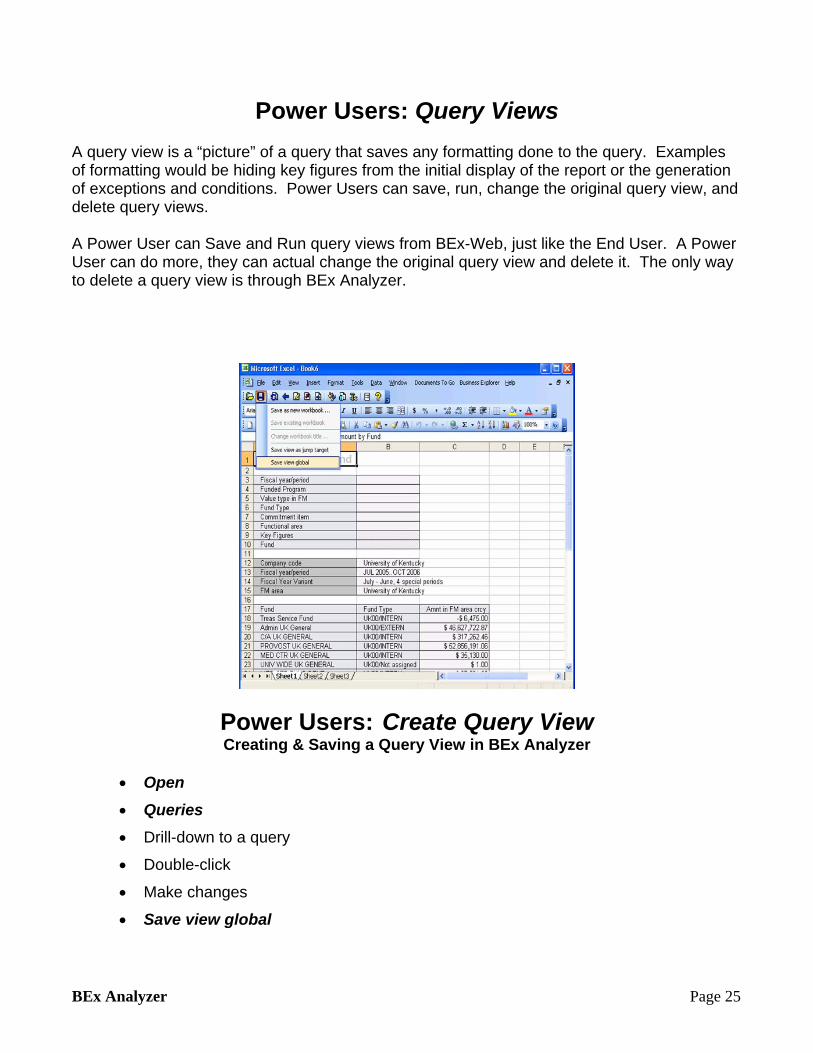
Power Users: Query Views A query view is a “picture” of a query that saves any formatting done to the query. Examples of formatting would be hiding key figures from the initial display of the report or the generation of exceptions and conditions. Power Users can save, run, change the original query view, and delete query views. A Power User can Save and Run query views from BEx-Web, just like the End User. A Power User can do more, they can actual change the original query view and delete it. The only way to delete a query view is through BEx Analyzer.
Power Users: Create Query View Creating & Saving a Query View in BEx Analyzer
• Open • Queries • Drill-down to a query
• Double-click
• Make changes
• Save view global
BEx Analyzer Page 26
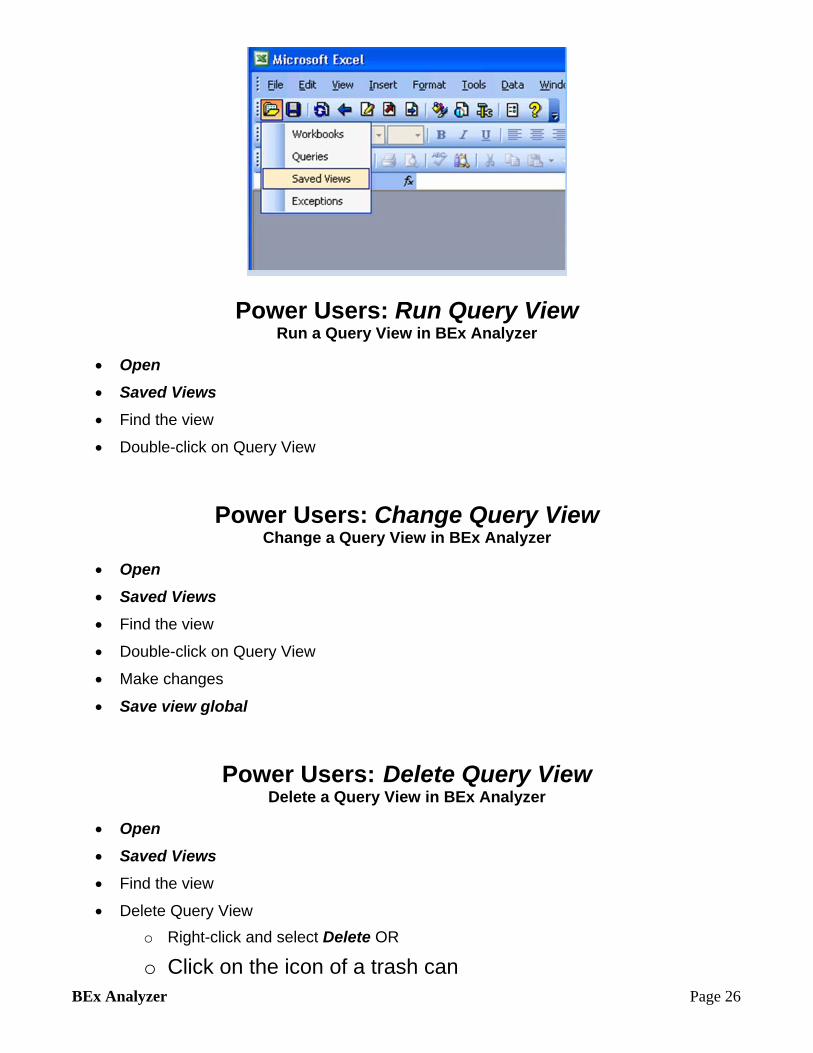
Power Users: Run Query View Run a Query View in BEx Analyzer
• Open • Saved Views • Find the view
• Double-click on Query View
Power Users: Change Query View Change a Query View in BEx Analyzer
• Open • Saved Views • Find the view
• Double-click on Query View
• Make changes
• Save view global
Power Users: Delete Query View Delete a Query View in BEx Analyzer
• Open • Saved Views • Find the view
• Delete Query View o Right-click and select Delete OR
o Click on the icon of a trash can
BEx Analyzer Page 27
Query Exercise 1. Display an existing query (Technical Name starts with a ‘Q’) from
the Budget and Actuals InfoCube 2. Create a new query A. Put at least one key figure or Structure in Columns (beware:
most calculated and restricted key figures do not work) B. Put at least one characteristic in Rows C. Put at least three characteristics in Free Characteristics D. Put at least one characteristic in Filter (“Fiscal year variant” /
“Company Code”) i. Restrict Filter E. Put a variable on a characteristic F. Change Characteristic Properties to meet Query Standards G. Change Query Properties to meet Query Standards 3. Save your new query – Technical Names must be unique – Don’t forget to use the naming standard 4. Run your query on the web 5. Exit out of web 6. Exit out of Query Designer 7. Change “Your” Query in Query Designer A. Add two characteristics to Free Characteristics B. Save your query globally 8. Run your Query 9. Delete your Query

BEx Analyzer Page 28
Notes