bett all slides doug+michael+peter
TRANSCRIPT

Learning Analytics: Making learning better?
Dr Doug ClowInstitute of Educational Technology, The Open University, UK
22
CC-BY – You are free to:
copy, share, adapt, or re-mix;
photograph, film, or broadcast;
blog, live-blog, or post video of
this presentation provided that:You attribute the work to its author and respect the rights andlicences associated with its components.

What is learning analytics?
• the measurement, collection, analysis and reporting of data about learners and their contexts, for purposes of understanding and optimising learning and the environments in which it occurs – First International Conference on Learning Analytics And Knowledge (LAK11), Banff, Alberta, Feb 27-
Mar 1, 2011
Photo (CC)-BY Cris: http://flickr.com/photos/chrismatos/6917786197/
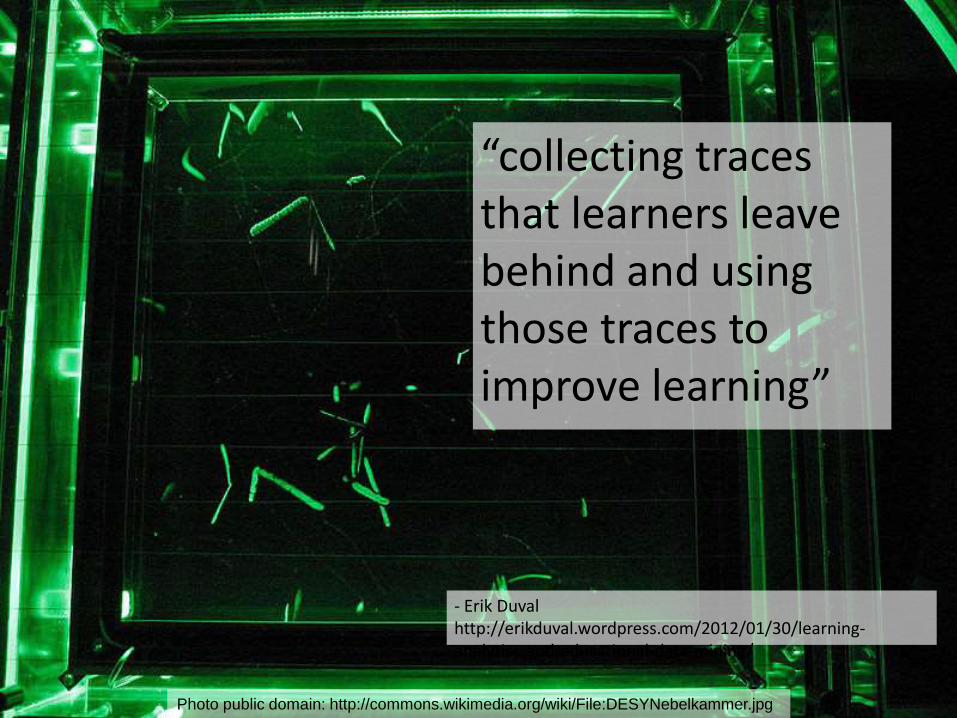
Photo public domain: http://commons.wikimedia.org/wiki/File:DESYNebelkammer.jpg
- Erik Duval http://erikduval.wordpress.com/2012/01/30/learning-analytics-and-educational-data-mining/
“collecting traces that learners leave behind and using those traces to improve learning”

“feeding back the data exhaust”
Big Data in Education
Photo (CC)-BY Iain Watson http://www.flickr.com/photos/dagoaty/3329699788/

Clow, LAK12, 2012

examples

School dashboards (Google Images)
• Maybe chop the first slide about this.
8
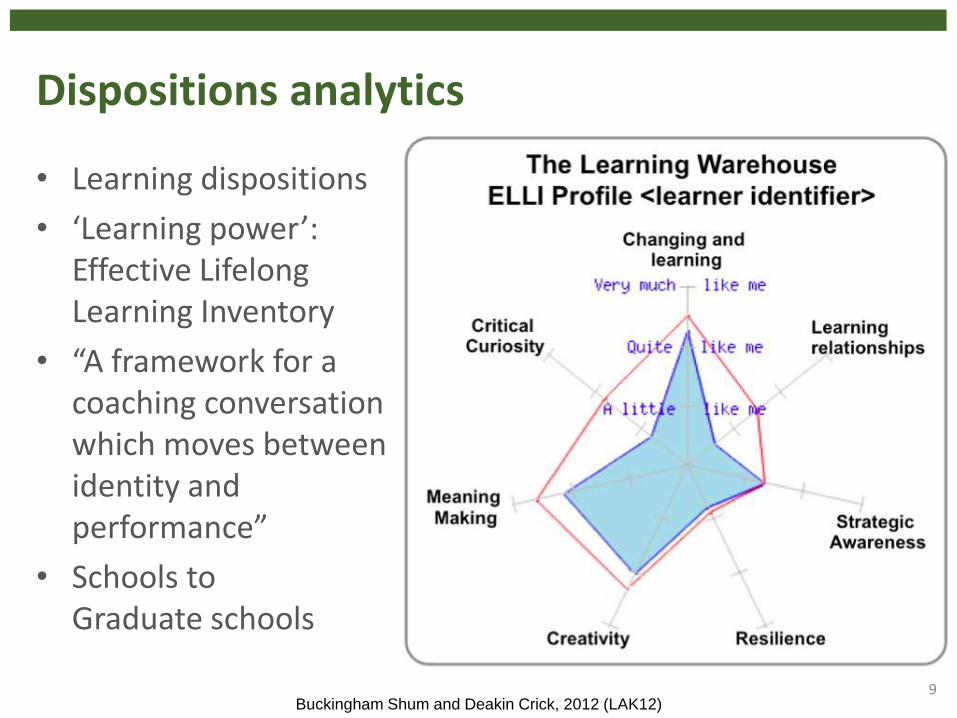
Dispositions analytics
• Learning dispositions
• ‘Learning power’: Effective Lifelong Learning Inventory
• “A framework for a coaching conversation which moves between identity and performance”
• Schools to Graduate schools
9Buckingham Shum and Deakin Crick, 2012 (LAK12)

ELLI Teacher view
10Buckingham Shum and Deakin Crick, 2012 (LAK12)

what else could you do?
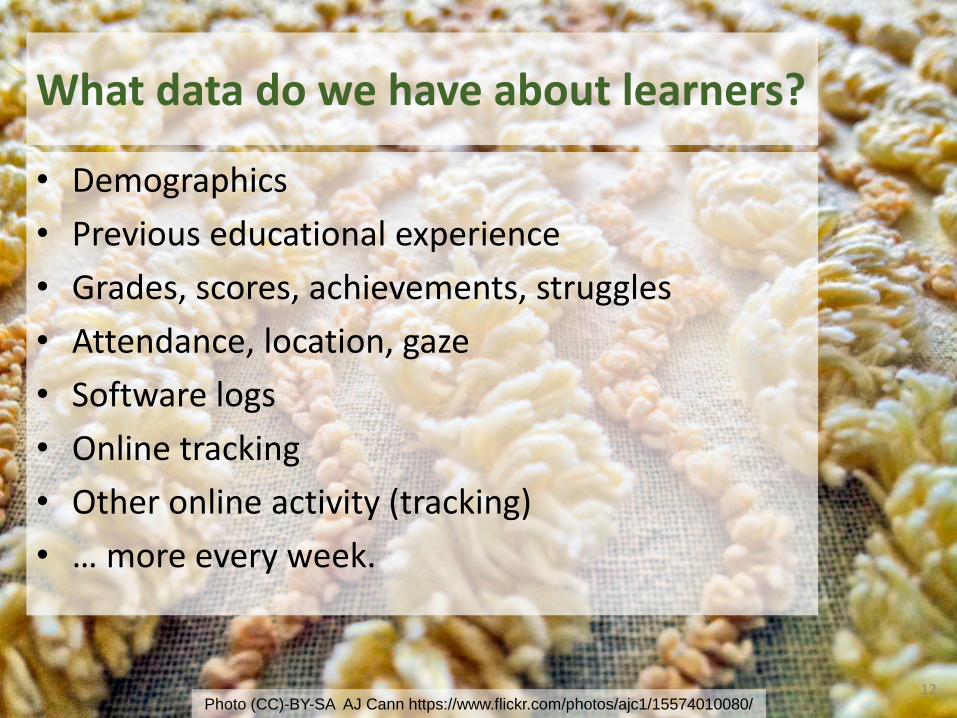
What data do we have about learners?
• Demographics
• Previous educational experience
• Grades, scores, achievements, struggles
• Attendance, location, gaze
• Software logs
• Online tracking
• Other online activity (tracking)
• … more every week.
12Photo (CC)-BY-SA AJ Cann https://www.flickr.com/photos/ajc1/15574010080/

What can we do with that data?
• Identify learners who need help– Simple or predictive
• Trigger interventions
– Via teacher, or direct
• Learn which interventions work
• Build a complete cognitive learning system
• Suggest resources or source of help– Learners like you found this helpful
– This person might be able to help you
13Photo (CC)-BY-NC Pulpolux https://www.flickr.com/photos/pulpolux/8735428280

what should we do?

15
control
Photo (CC)-BY Andy Roberts https://www.flickr.com/photos/aroberts/3035796
surveillance

16
support
Photo (CC)-BY-NC-SA Drew Bennett https://www.flickr.com/photos/abennett96/2710211041
guidance

Glasswinged butterfly, ? Greta oro
Photo (CC)-BY-NC-ND by Greg Foster on Flickr http://www.flickr.com/photos/gregfoster/3365801458/
Principles
• Privacy
• Data protection
• Ethics
• Transparency

www.laceproject.euLearning Analytics Community Exchange (FP7)
• Coordination and Support
• Evidence Hub
• Events
• Publications, briefings, webinars

Thanks to:
People:
• LACE at the OU: Rebecca Ferguson, Simon Cross, Linda Norwood Michelle
Bailey, Rebecca Wilson, Evaghn De Souza, Natalie Eggleston, Oliver
Millard, Gary Elliot-Citigottis,
• LACE project partners: CETIS (Bolton), OUNL, Skolverket, HIOA,
Kennisnet, ITS, ATiT.
• The learning analytics community, including SoLAR, IEDMS, those I’ve met
at LAK and LASI
Funders:
• LACE: European Commission 619424-FP7-ICT-2013-11

“Learning Analytics: Making Learning Better?” by Doug Clow, Institute of Educational Technology, The Open University, was presented at Bett, London, on 23 January 2015.
This work was undertaken as part of the LACE Project, supported by the European Commission Seventh Framework Programme, grant 619424.
These slides are provided under the Creative Commons Attribution Licence: http://creativecommons.org/licenses/by/4.0/. Some images used may have different licence terms.
www.laceproject.eu@laceproject
20

cc licensed ( BY ) flickr photo by David Goehring: http://flickr.com/photos/carbonnyc/33413040/

Netherlands
Michael van Wetering
Strategic Advisor on Innovation
Kennisnet

Dutchperspective
23

Michael van Wetering
Strategic Advisor Innovation
Blog: Innovatie.Kennisnet.nl
Twitter: @_mike
This work was undertaken as part of the LACE Project, supported by the European Commission Seventh Framework Programme, grant 619424.
These slides are provided under the Creative Commons Attribution Licence: http://creativecommons.org/licenses/by/4.0/. Some images used may have different licence terms.
www.laceproject.eu@laceproject
24
Sweden
Peter Karlberg
Director of Education
National Agency for Education

Studi.se (SWE)
• Videos (also with sub-titles in many languages), texts and quizzes
• Feedback to both the student and the teacher26

Interactive Flipped Classroom (SWE)
• Based on the flipped classroom method
• Makes the students more active in the classroom
• But they are still quite passive when looking at videos
• Technical platform which helps the teacher to cut the videos in smaller chunks and add quizzes
• Also possible for students to stop the video and write questions to the teacher
27

Feedback to the teacher
• How many have looked at the video (and when)?
• How did the group score on the quizzez?
• Which parts did they found (particularly) difficult?
• Where they confused by the examples?
• Specific questions feeded back to the teacher before the lesson
28

29
Why do you subtract 4/9? The students can stop the video and write questions if needed

Regional initiative on drop-outs
• Western parts of Sweden
• When do student drop-out from upper secondary school?
• Can we discover a pattern?
• Using the data – analysing
30