best practices for data centers: lessons learned from benchmarking 22 data centers steve greenberg,...
TRANSCRIPT
Best Practices for Data Centers: Lessons Learned from
Benchmarking 22 Data Centers
Steve Greenberg, Dale Sartor, Bill Tschudi, and Evan Mills, Lawrence Berkeley National
LaboratoryPeter Rumsey, Rumsey Engineers
Bruce Myatt, EYP Mission Critical Facilities
August 17, 2006
ACEEE Summer Study

The Data Center ChallengeThe Data Center Challenge
Data Centers 15-40x the energy Data Centers 15-40x the energy intensity of typical office buildings intensity of typical office buildings
A single rack of servers can be 20 A single rack of servers can be 20 kW kW – $17k per year (at $.10) $17k per year (at $.10) per rackper rack– Hundreds of racks per centerHundreds of racks per center
Where are the opportunities?Where are the opportunities?– 22 data centers benchmarked22 data centers benchmarked
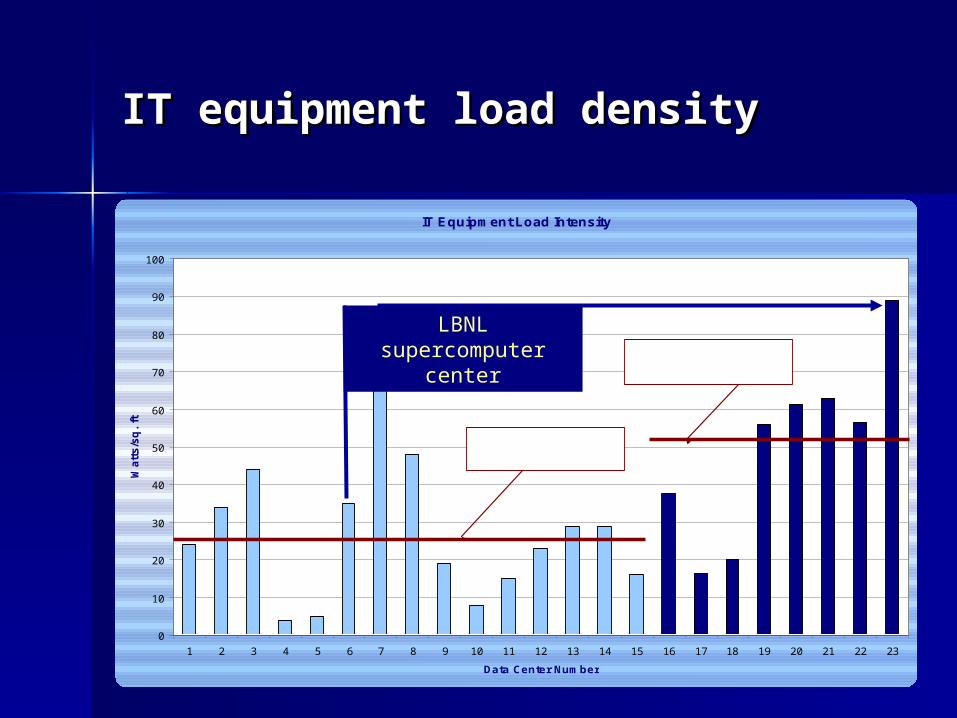
IT equipment load densityIT equipment load density
IT Equipment Load Intensity
0
10
20
30
40
50
60
70
80
90
100
1 2 3 4 5 6 7 8 9 10 11 12 13 14 15 16 17 18 19 20 21 22 23
Data Center Number
Wa
tts
/sq
. ft
.
2003 BenchmarksAve. ~ 25
2005 BenchmarksAve. ~ 52
LBNL supercomputer
center
Using benchmark results to find Using benchmark results to find best practicesbest practices
We wondered what metrics were We wondered what metrics were indicators of better performance. indicators of better performance. The ratio of IT equipment power to The ratio of IT equipment power to the total is an indicator of relative the total is an indicator of relative overall efficiency. Examination of overall efficiency. Examination of individual systems and components individual systems and components in the centers that performed well in the centers that performed well helped to identify best practices.helped to identify best practices.
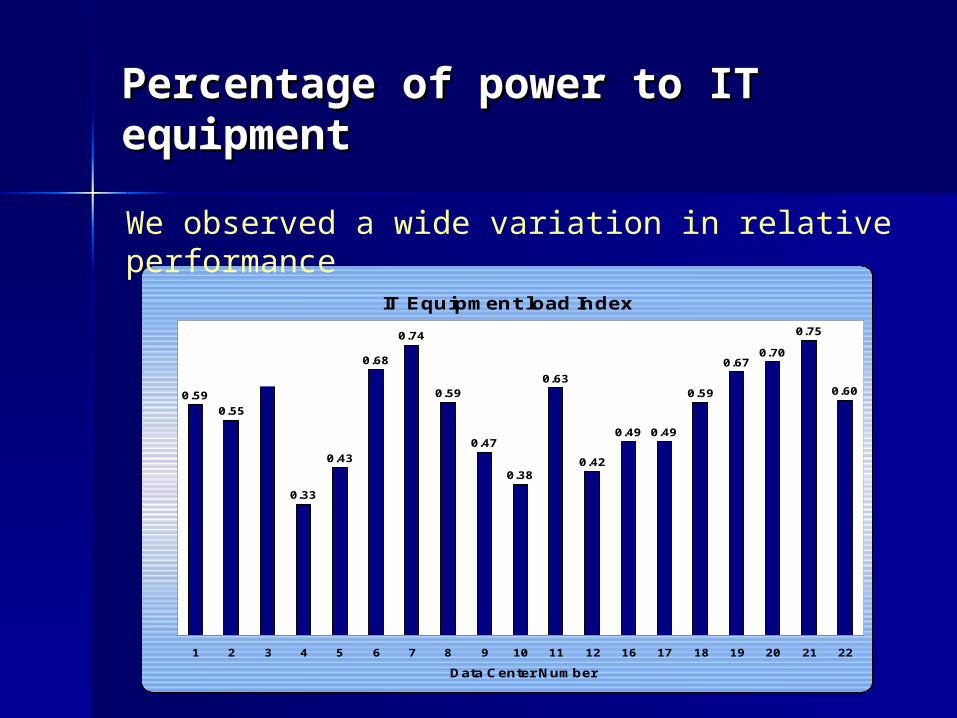
Percentage of power to IT Percentage of power to IT equipmentequipment
IT Equipment load Index
0.59
0.55
0.66
0.33
0.43
0.68
0.59
0.47
0.38
0.63
0.42
0.49 0.49
0.59
0.670.70
0.75
0.60
0.74
1 2 3 4 5 6 7 8 9 10 11 12 16 17 18 19 20 21 22
Data Center Number
All values are shown as a fraction of the respective data center total power consumption.
We observed a wide variation in relative performance
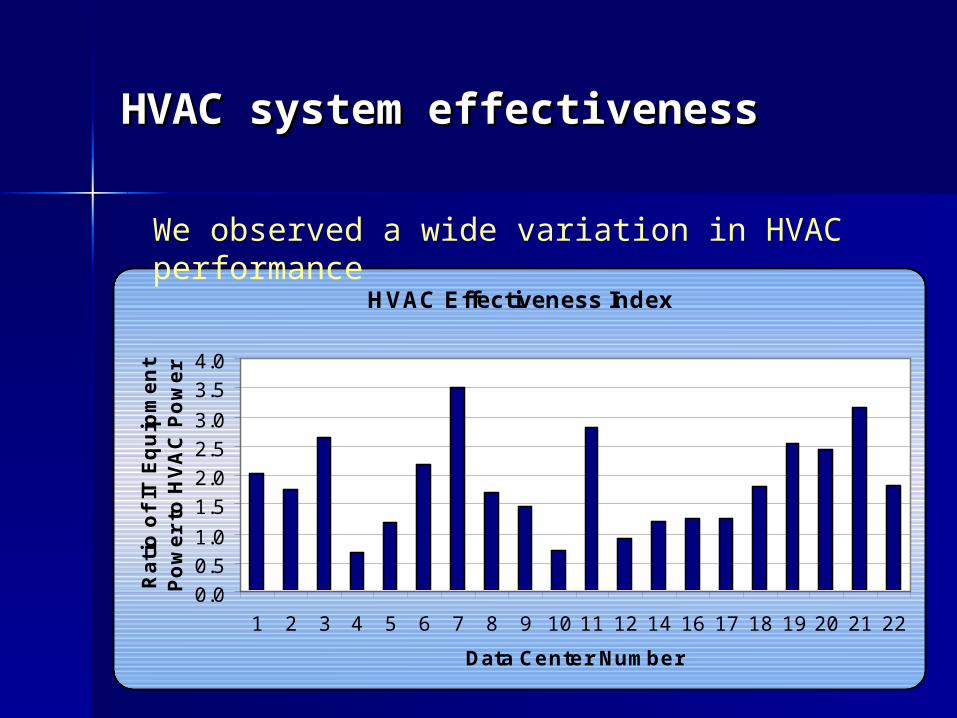
HVAC system effectivenessHVAC system effectiveness
HVAC Effectiveness Index
0.0
0.5
1.0
1.5
2.0
2.5
3.0
3.5
4.0
1 2 3 4 5 6 7 8 9 10 11 12 14 16 17 18 19 20 21 22
Data Center Number
Ra
tio
of
IT E
qu
ipm
en
t
Po
we
r to
HV
AC
Po
we
r
We observed a wide variation in HVAC performance
Optimize Air ManagementOptimize Air Management
Enforce hot aisle/cold aisle Enforce hot aisle/cold aisle arrangement arrangement
Eliminate bypasses and short Eliminate bypasses and short circuits circuits
Reduce air flow restrictionsReduce air flow restrictions Proper floor tile arrangementProper floor tile arrangement Proper locations of air handlersProper locations of air handlers
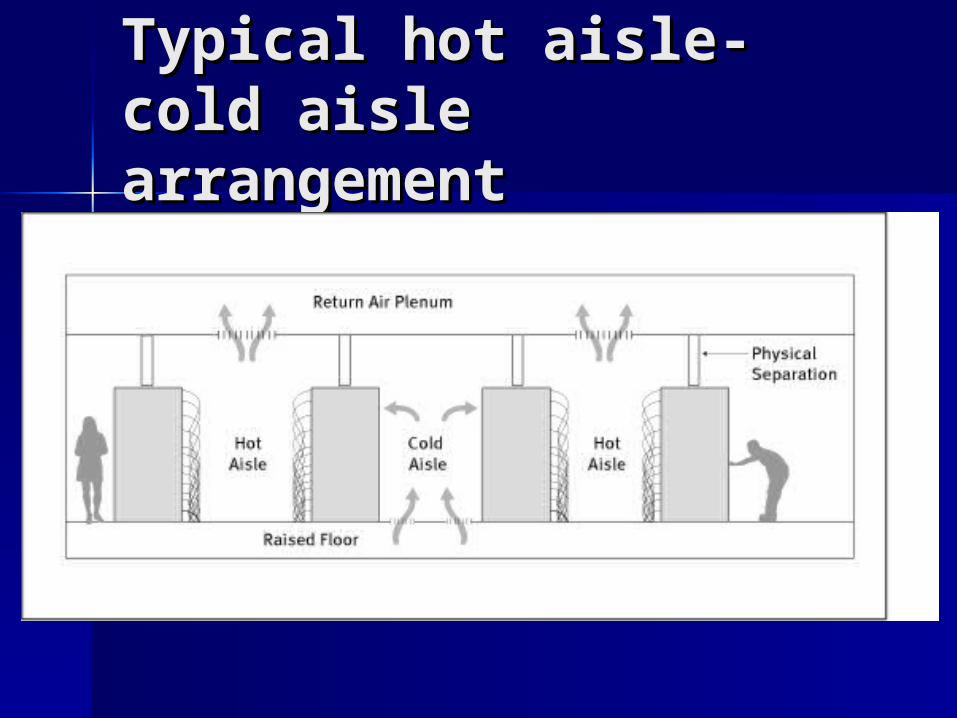
Typical hot aisle-cold Typical hot aisle-cold aisle arrangementaisle arrangement
Right-Size the DesignRight-Size the Design
Data Center HVAC often under-loadedData Center HVAC often under-loaded Ultimate load uncertainUltimate load uncertain Design for efficient part-load operation Design for efficient part-load operation
– modularitymodularity– variable-speed fans, pumps, compressorsvariable-speed fans, pumps, compressors
Upsize fixed elements (pipes, ducts)Upsize fixed elements (pipes, ducts) Upsize cooling towersUpsize cooling towers
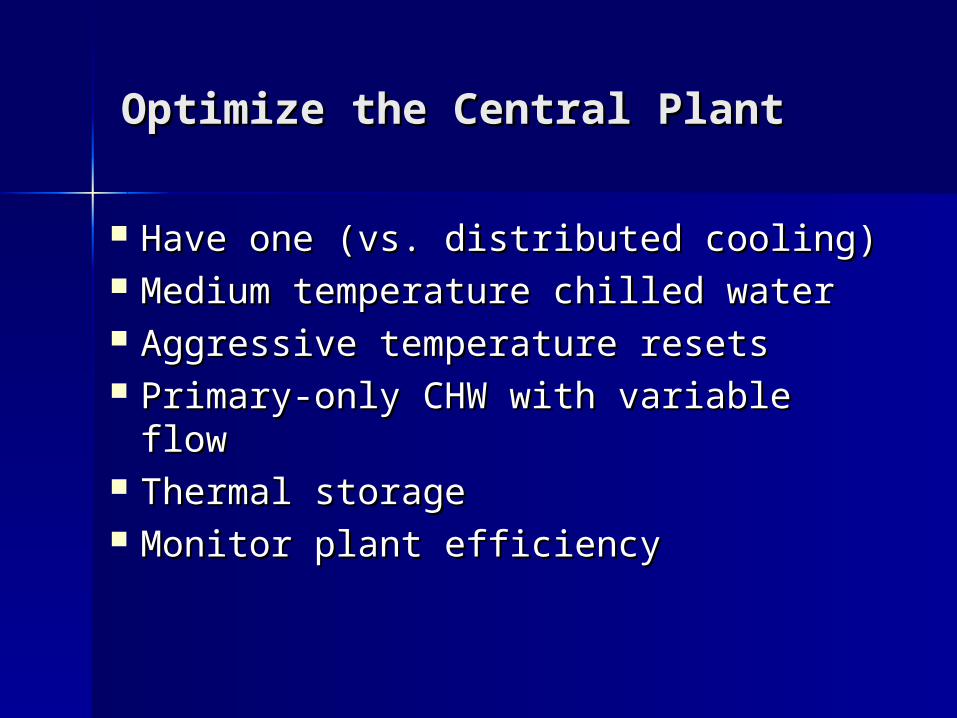
Optimize the Central PlantOptimize the Central Plant
Have one (vs. distributed cooling)Have one (vs. distributed cooling) Medium temperature chilled waterMedium temperature chilled water Aggressive temperature resets Aggressive temperature resets Primary-only CHW with variable flowPrimary-only CHW with variable flow Thermal storageThermal storage Monitor plant efficiencyMonitor plant efficiency
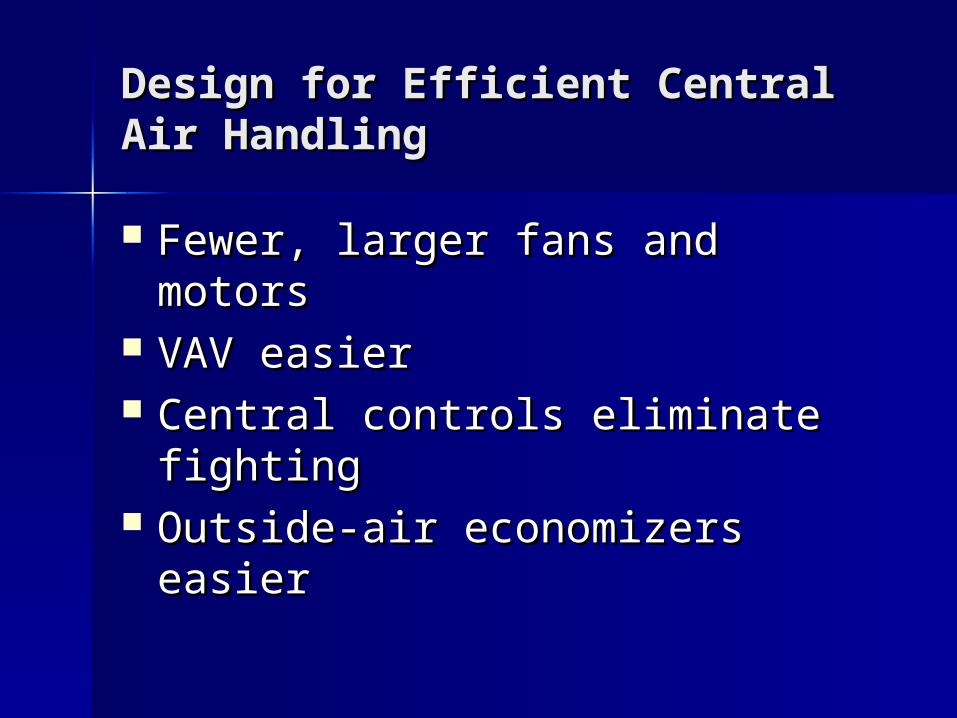
Design for Efficient Central Air Design for Efficient Central Air HandlingHandling
Fewer, larger fans and motorsFewer, larger fans and motors VAV easierVAV easier Central controls eliminate fightingCentral controls eliminate fighting Outside-air economizers easierOutside-air economizers easier
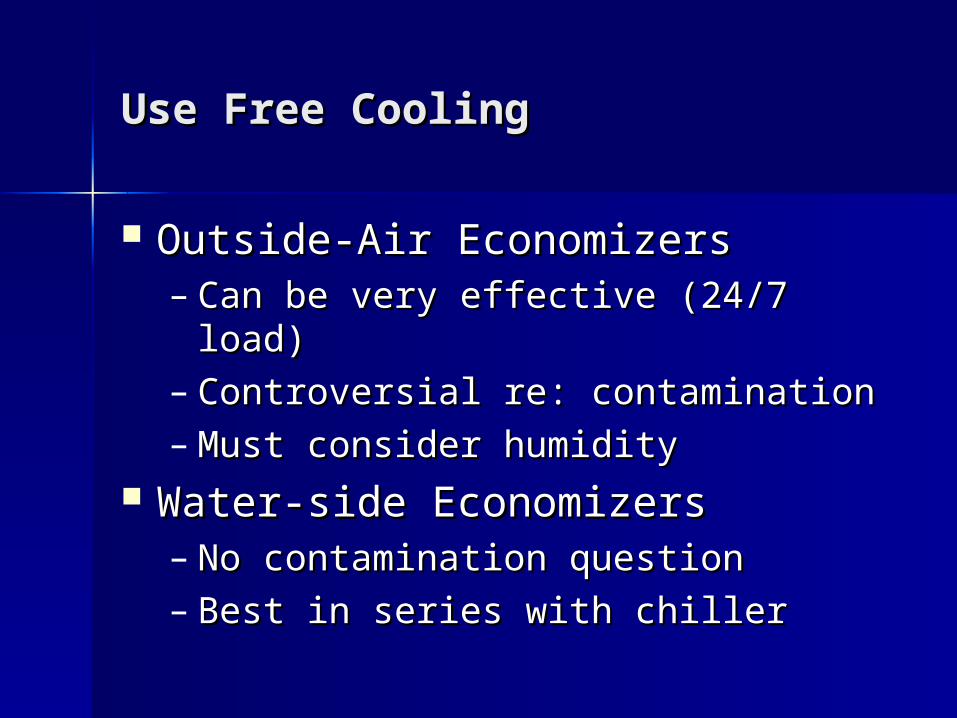
Use Free CoolingUse Free Cooling
Outside-Air Economizers Outside-Air Economizers – Can be very effective (24/7 load) Can be very effective (24/7 load) – Controversial re: contaminationControversial re: contamination– Must consider humidityMust consider humidity
Water-side EconomizersWater-side Economizers– No contamination questionNo contamination question– Best in series with chillerBest in series with chiller
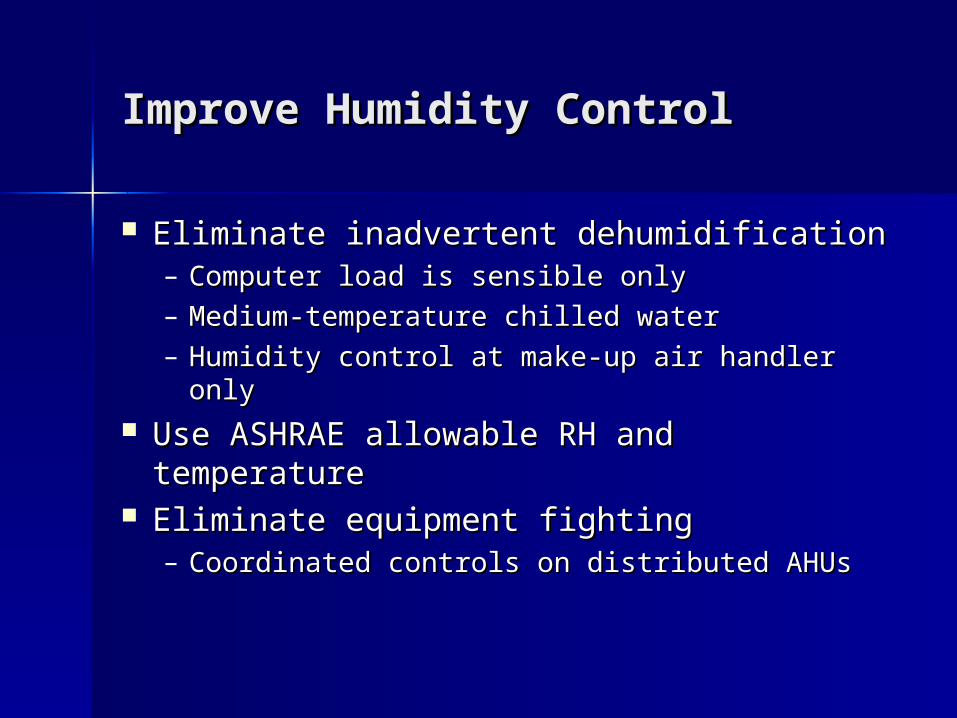
Improve Humidity ControlImprove Humidity Control
Eliminate inadvertent dehumidification Eliminate inadvertent dehumidification – Computer load is sensible onlyComputer load is sensible only– Medium-temperature chilled water Medium-temperature chilled water – Humidity control at make-up air handler onlyHumidity control at make-up air handler only
Use ASHRAE allowable RH and Use ASHRAE allowable RH and temperaturetemperature
Eliminate equipment fightingEliminate equipment fighting– Coordinated controls on distributed AHUsCoordinated controls on distributed AHUs
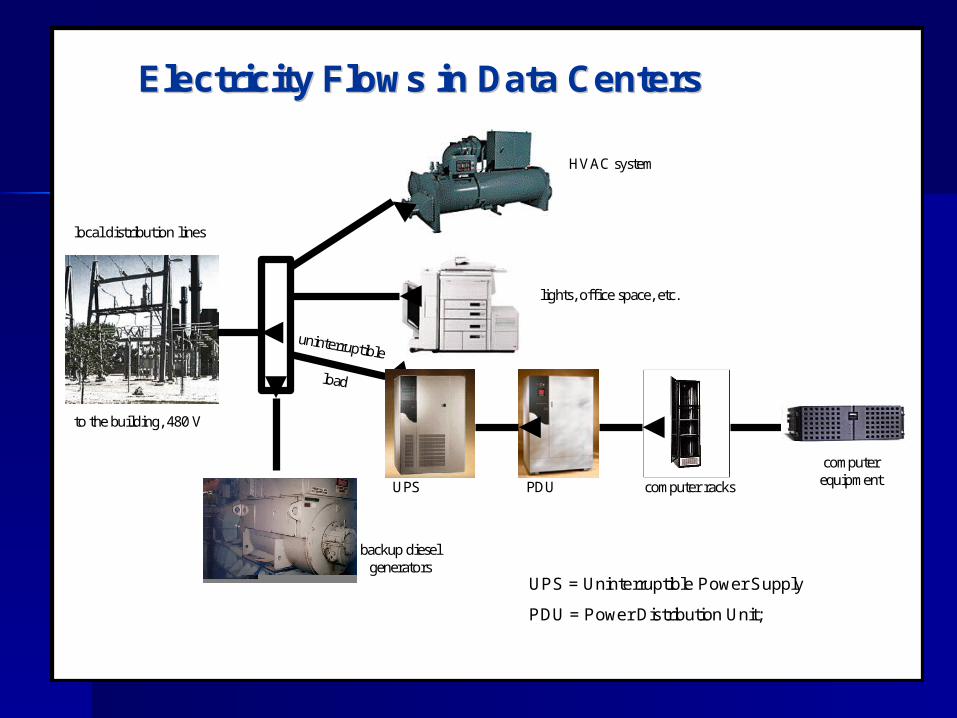
local distribution lines
to the building, 480 V
HVAC system
lights, office space, etc.
UPS PDU computer racks
backup diesel generators
Electricity Flows in Data CentersElectricity Flows in Data Centers
computerequipment
uninterruptible
load
UPS = Uninterruptible Power Supply
PDU = Power Distribution Unit;
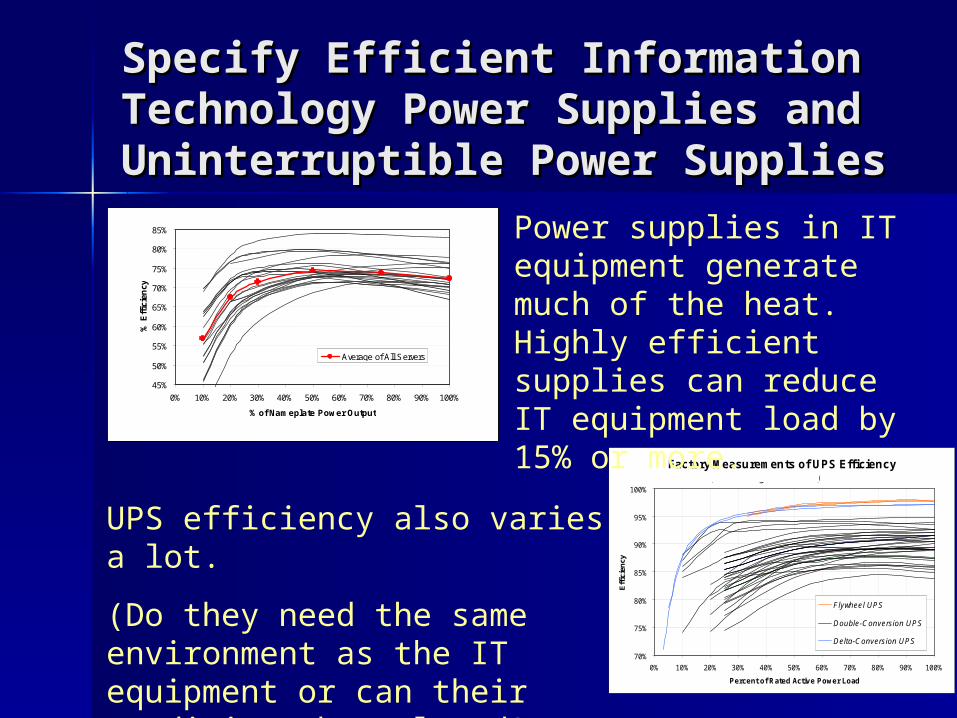
Specify Efficient Information Specify Efficient Information Technology Power Supplies and Technology Power Supplies and Uninterruptible Power SuppliesUninterruptible Power Supplies
Factory Measurements of UPS Efficiency
70%
75%
80%
85%
90%
95%
100%
0% 10% 20% 30% 40% 50% 60% 70% 80% 90% 100%
Percent of Rated Active Power Load
Eff
icie
ncy
Flywheel UPS
Double-Conversion UPS
Delta-Conversion UPS
(tested using linear loads)
45%
50%
55%
60%
65%
70%
75%
80%
85%
0% 10% 20% 30% 40% 50% 60% 70% 80% 90% 100%
% of Nameplate Power Output
% E
ffic
ien
cy
Average of All Servers
Power supplies in IT equipment generate much of the heat. Highly efficient supplies can reduce IT equipment load by 15% or more.
UPS efficiency also varies a lot.
(Do they need the same environment as the IT equipment or can their conditions be relaxed?)

Consider On-Site GenerationConsider On-Site Generation
Can use waste heat for cooling Can use waste heat for cooling – sorption cycles sorption cycles – typically required for cost effectivenesstypically required for cost effectiveness
Swaps role with utility for back-upSwaps role with utility for back-up Air-quality issuesAir-quality issues Sell-back optionsSell-back options
– complex controls requiredcomplex controls required

Use Liquid Cooling of Racks and Use Liquid Cooling of Racks and ComputersComputers
Water is 3500x more effective than air Water is 3500x more effective than air on a volume basis on a volume basis
Cooling distribution is more energy Cooling distribution is more energy efficientefficient
Water-cooled racks available now; Water-cooled racks available now; liquid-cooled computers are comingliquid-cooled computers are coming
Heat rejection at a higher temperature Heat rejection at a higher temperature – Chiller plant more efficientChiller plant more efficient– Water-side economizer more effectiveWater-side economizer more effective

Improve Design, Operations, Improve Design, Operations, and Maintenance Processesand Maintenance Processes
Get IT and Facilities people to work Get IT and Facilities people to work together together
Use life-cycle cost analysisUse life-cycle cost analysis Document design intentDocument design intent Introduce energy optimization earlyIntroduce energy optimization early Benchmark existing facilitiesBenchmark existing facilities Re-commission as a regular part of Re-commission as a regular part of
maintenancemaintenance
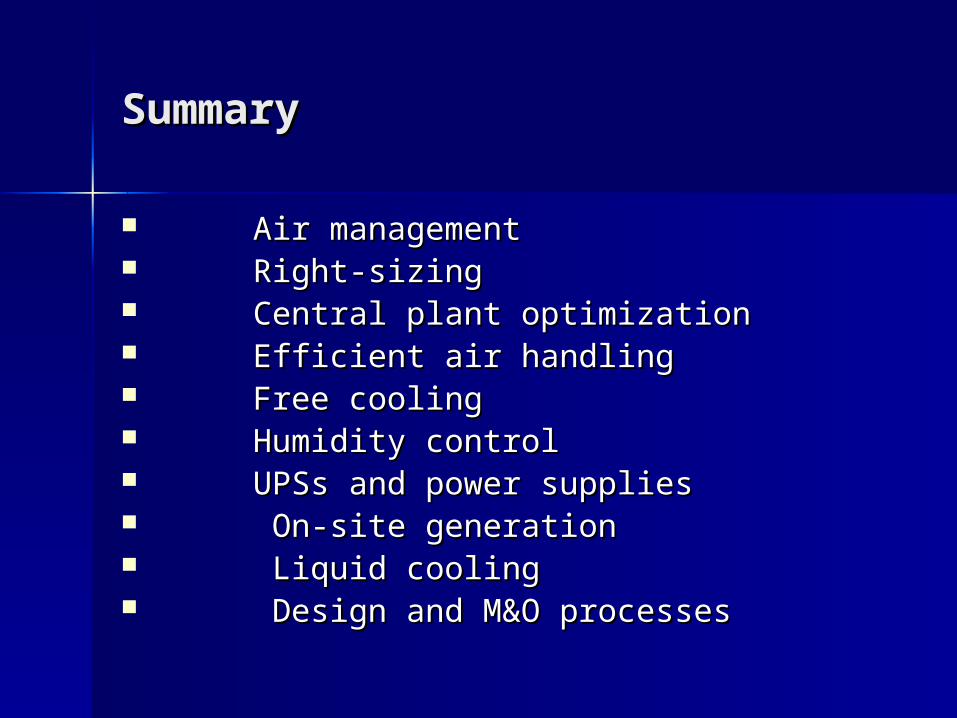
SummarySummary
Air managementAir management Right-sizingRight-sizing Central plant optimizationCentral plant optimization Efficient air handlingEfficient air handling Free coolingFree cooling Humidity controlHumidity control UPSs and power suppliesUPSs and power supplies On-site generationOn-site generation Liquid coolingLiquid cooling Design and M&O processesDesign and M&O processes
ConclusionConclusion
Energy benchmarking can be Energy benchmarking can be effective in helping to identify effective in helping to identify better performing designs and better performing designs and strategies. As new strategies are strategies. As new strategies are implemented (e.g. liquid cooling), implemented (e.g. liquid cooling), energy benchmarking will enable energy benchmarking will enable comparison of performance.comparison of performance.

Thank you!Thank you!
Questions??Questions??
For more info: For more info: http://hightech.lbl.gov/datacentershttp://hightech.lbl.gov/datacenters