berlin school district - edsightedsight.ct.gov/output/district/highschool/0070011_2014… · ·...
TRANSCRIPT
0070011 - Berlin School District Printed on 09/21/2016 - Page 1
Berlin School District
Mr. David Erwin, Superintendent • 860-828-6581 • http://www.berlinschools.org
District InformationDistrict InformationGrade Range PK-12Number of Schools/Programs 5
Enrollment 2,909
Per Pupil Expenditures¹ $15,102
Total Expenditures¹ $46,860,082
¹Expenditure data reflect the 2013-14 year.
Community Information CERC Town Profiles provide summary demographic and
economic information for Connecticut's municipalities
Related Reports/Publications CT Reports (CMT/CAPT) District and School Performance Reports
Special Education Annual Performance Reports
SAT®, AP®, PSAT® Report by High School (Class of 2015) (2015® The College Board)
Contents Students.......................................................................... 1 . Educators........................................................................ 2 . Instruction and Resources.............................................. 2 . Performance and Accountability.................................... 4 . Narratives....................................................................... 7 .
NotesUnless otherwise noted, all data are for 2014-15 andinclude all grades offered by the district.In most tables, data are displayed only for the three majorrace/ethnicity categories. For additional race/ethnicitycategories, please visit EdSight (EdSight.ct.gov).
State totals are not displayed as they are not comparableto district totals.
Special Education tables reflect only students for whomthe district is fiscally responsible.
* When an asterisk is displayed, data have beensuppressed to ensure student confidentiality.
N/A is displayed when a category is not applicable for adistrict or school.
StudentsOctober 1, 2014 Enrollment
District State
Count Percent of Total(%)
Percent of Total(%)
Female 1,347 46.3 48.3
Male 1,562 53.7 51.6
American Indian or Alaska Native * * 0.2
Asian 86 3.0 4.7
Black or African American 68 2.3 12.9
Hispanic or Latino 256 8.8 22.1
Pacific Islander * * 0.0
Two or More Races 74 2.5 2.5
White 2,421 83.2 57.2
English Language Learners 67 2.3 6.3
Eligible for Free or Reduced-Price Meals 414 14.2 37.6
Students with Disabilities¹ 324 11.1 13.3
¹Students in this category are students with Individualized Education Programs (IEPs) only. This categorydoes not include students with Section 504 Plans.
Chronic Absenteeism and Suspension/ExpulsionChronic Suspension/
Absenteeism² Expulsion³
Count Rate (%) Count Rate (%)
Female 77 5.8 32 2.3
Male 94 6.1 67 4.2
Black or African American 10 14.9 12 17.6
Hispanic or Latino 44 16.6 31 11.6
White 110 4.7 54 2.2
English Language Learners * * * *
Eligible for Free or Reduced-Price Meals 83 20.0 47 10.4
Students with Disabilities 59 18.3 29 7.5
District 171 6.0 99 3.3
State 10.6 7.2
Number of students in 2013-14 qualified as truant under state statute: 44
²A student is chronically absent if he/she misses ten percent or greater of the total number of days enrolled
in the school year for any reason. Pre-Kindergarten students are excluded from this calculation.
³The count and percentage of students who receive at least one in-school suspension, out-of-school
suspension or expulsion.
0070011 - Berlin School District Printed on 09/21/2016 - Page 2
District Profile and Performance Report for School Year 2014-15Berlin School District
Educators
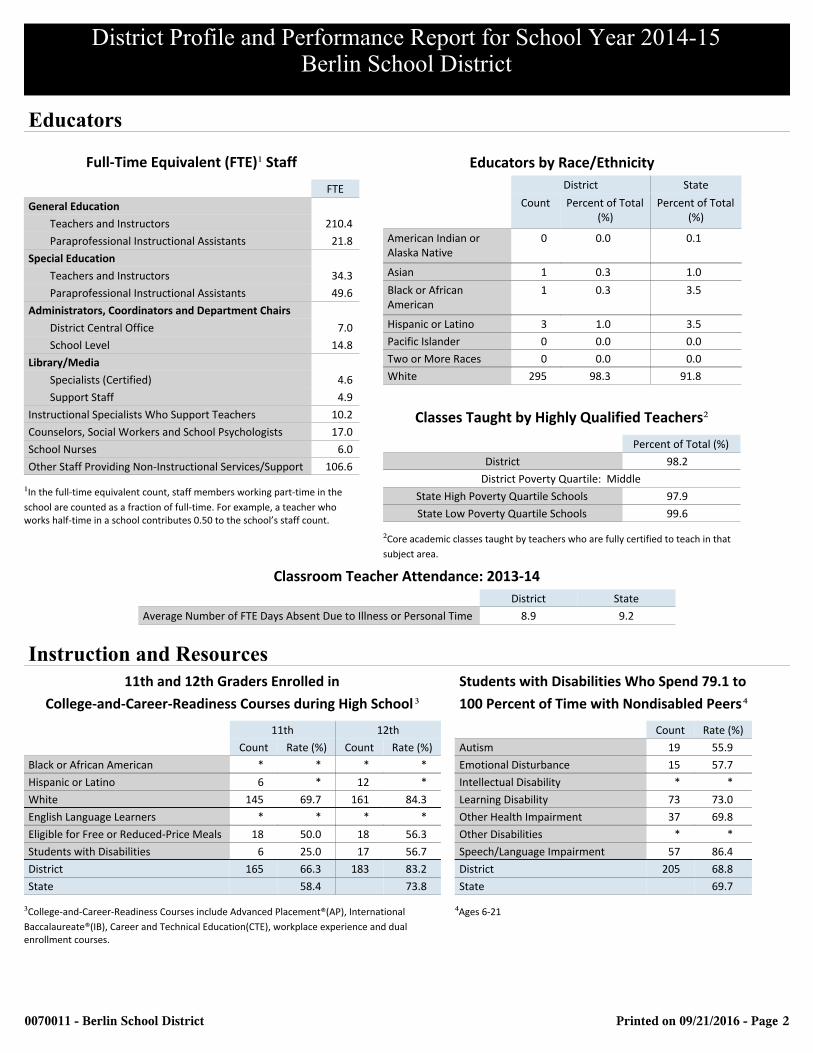
Full-Time Equivalent (FTE)¹ Staff
FTE
General Education
Teachers and Instructors 210.4
Paraprofessional Instructional Assistants 21.8
Special Education
Teachers and Instructors 34.3
Paraprofessional Instructional Assistants 49.6
Administrators, Coordinators and Department Chairs
District Central Office 7.0
School Level 14.8
Library/Media
Specialists (Certified) 4.6
Support Staff 4.9
Instructional Specialists Who Support Teachers 10.2
Counselors, Social Workers and School Psychologists 17.0
School Nurses 6.0
Other Staff Providing Non-Instructional Services/Support 106.6
¹In the full-time equivalent count, staff members working part-time in the
school are counted as a fraction of full-time. For example, a teacher whoworks half-time in a school contributes 0.50 to the school’s staff count.
Educators by Race/Ethnicity
District State
Count Percent of Total(%)
Percent of Total(%)
American Indian orAlaska Native
0 0.0 0.1
Asian 1 0.3 1.0
Black or AfricanAmerican
1 0.3 3.5
Hispanic or Latino 3 1.0 3.5
Pacific Islander 0 0.0 0.0
Two or More Races 0 0.0 0.0
White 295 98.3 91.8
Classes Taught by Highly Qualified Teachers²Percent of Total (%)
District 98.2
District Poverty Quartile: Middle
State High Poverty Quartile Schools 97.9
State Low Poverty Quartile Schools 99.6
²Core academic classes taught by teachers who are fully certified to teach in that
subject area.
Classroom Teacher Attendance: 2013-14
District State
Average Number of FTE Days Absent Due to Illness or Personal Time 8.9 9.2
Instruction and Resources11th and 12th Graders Enrolled in
College-and-Career-Readiness Courses during High School ³11th 12th
Count Rate (%) Count Rate (%)
Black or African American * * * *
Hispanic or Latino 6 * 12 *
White 145 69.7 161 84.3
English Language Learners * * * *
Eligible for Free or Reduced-Price Meals 18 50.0 18 56.3
Students with Disabilities 6 25.0 17 56.7
District 165 66.3 183 83.2
State 58.4 73.8
³College-and-Career-Readiness Courses include Advanced Placement®(AP), International
Baccalaureate®(IB), Career and Technical Education(CTE), workplace experience and dualenrollment courses.
Students with Disabilities Who Spend 79.1 to
100 Percent of Time with Nondisabled Peers⁴Count Rate (%)
Autism 19 55.9
Emotional Disturbance 15 57.7
Intellectual Disability * *
Learning Disability 73 73.0
Other Health Impairment 37 69.8
Other Disabilities * *
Speech/Language Impairment 57 86.4
District 205 68.8
State 69.7
⁴Ages 6-21
0070011 - Berlin School District Printed on 09/21/2016 - Page 3
District Profile and Performance Report for School Year 2014-15Berlin School District
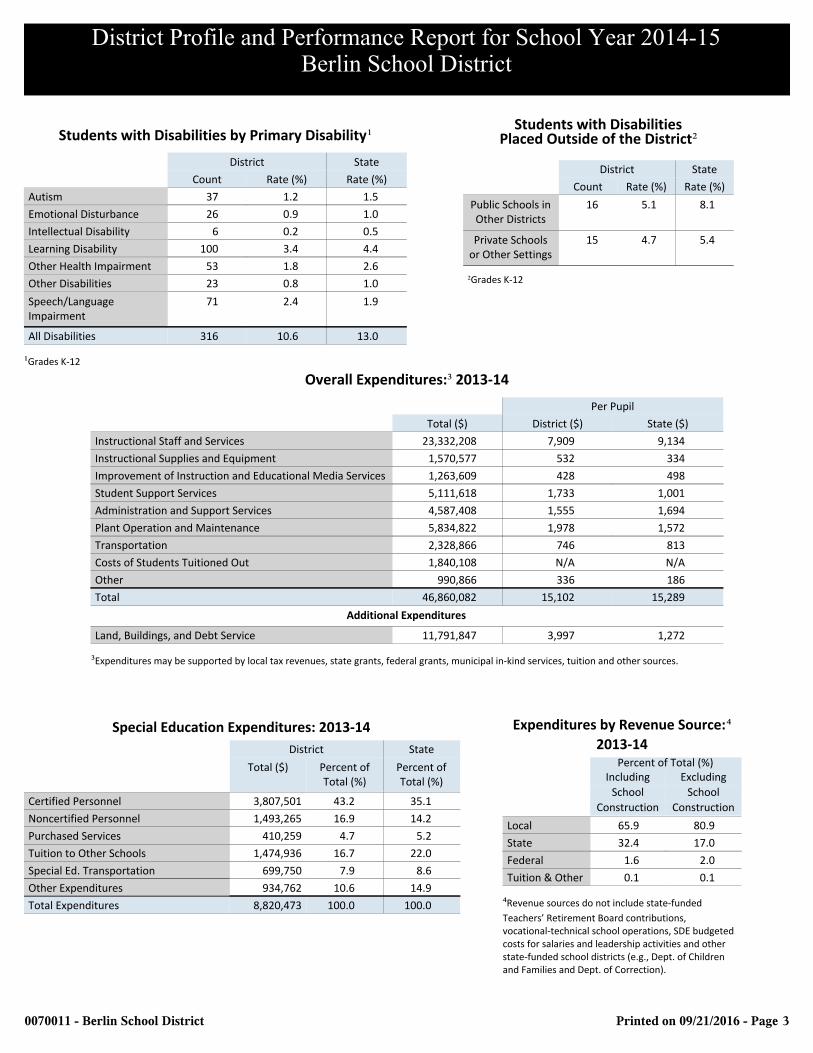
Students with Disabilities by Primary Disability¹District State
Count Rate (%) Rate (%)
Autism 37 1.2 1.5
Emotional Disturbance 26 0.9 1.0
Intellectual Disability 6 0.2 0.5
Learning Disability 100 3.4 4.4
Other Health Impairment 53 1.8 2.6
Other Disabilities 23 0.8 1.0
Speech/LanguageImpairment
71 2.4 1.9
All Disabilities 316 10.6 13.0
¹Grades K-12
Students with DisabilitiesPlaced Outside of the District²
District State
Count Rate (%) Rate (%)
Public Schools inOther Districts
16 5.1 8.1
Private Schoolsor Other Settings
15 4.7 5.4
²Grades K-12
Overall Expenditures:³ 2013-14
Per Pupil
Total ($) District ($) State ($)
Instructional Staff and Services 23,332,208 7,909 9,134
Instructional Supplies and Equipment 1,570,577 532 334
Improvement of Instruction and Educational Media Services 1,263,609 428 498
Student Support Services 5,111,618 1,733 1,001
Administration and Support Services 4,587,408 1,555 1,694
Plant Operation and Maintenance 5,834,822 1,978 1,572
Transportation 2,328,866 746 813
Costs of Students Tuitioned Out 1,840,108 N/A N/A
Other 990,866 336 186
Total 46,860,082 15,102 15,289
Additional Expenditures
Land, Buildings, and Debt Service 11,791,847 3,997 1,272
³Expenditures may be supported by local tax revenues, state grants, federal grants, municipal in-kind services, tuition and other sources.
Special Education Expenditures: 2013-14
District State
Total ($) Percent ofTotal (%)
Percent ofTotal (%)
Certified Personnel 3,807,501 43.2 35.1
Noncertified Personnel 1,493,265 16.9 14.2
Purchased Services 410,259 4.7 5.2
Tuition to Other Schools 1,474,936 16.7 22.0
Special Ed. Transportation 699,750 7.9 8.6
Other Expenditures 934,762 10.6 14.9
Total Expenditures 8,820,473 100.0 100.0
Expenditures by Revenue Source:⁴2013-14
Percent of Total (%)Including Excluding
School School
Construction Construction
Local 65.9 80.9
State 32.4 17.0
Federal 1.6 2.0
Tuition & Other 0.1 0.1
⁴Revenue sources do not include state-funded
Teachers’ Retirement Board contributions,vocational-technical school operations, SDE budgetedcosts for salaries and leadership activities and otherstate-funded school districts (e.g., Dept. of Childrenand Families and Dept. of Correction).
0070011 - Berlin School District Printed on 09/21/2016 - Page 4
District Profile and Performance Report for School Year 2014-15Berlin School District
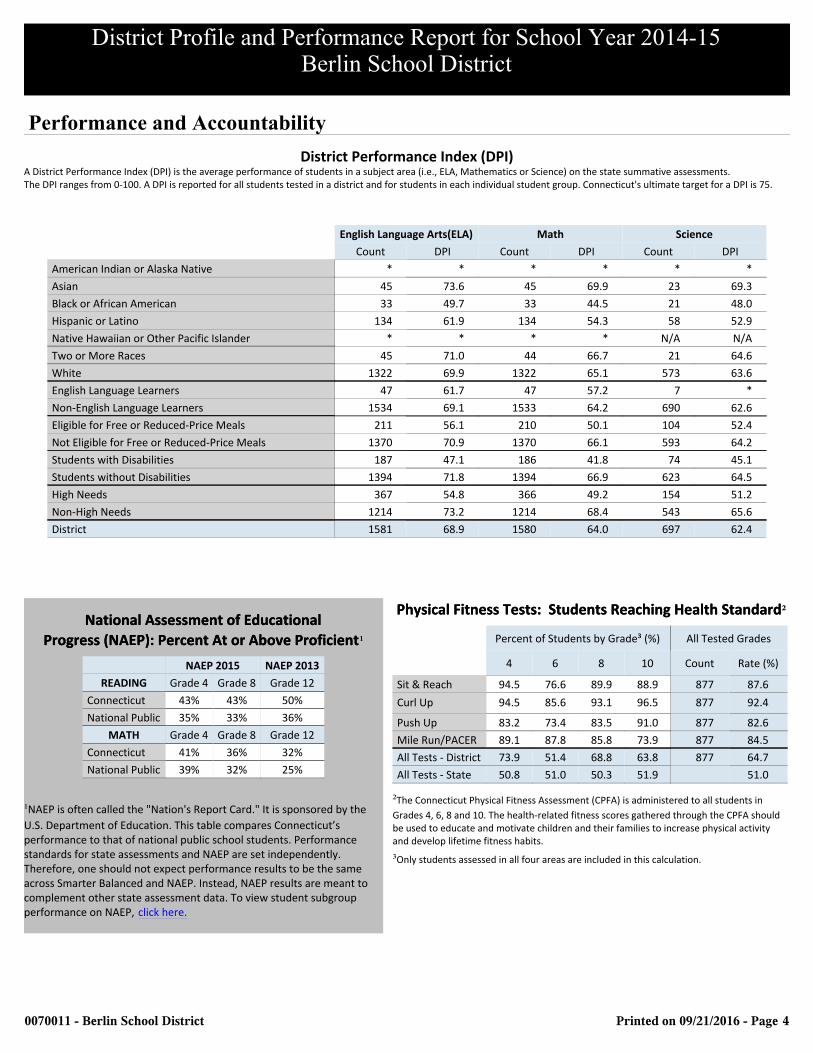
Performance and Accountability
District Performance Index (DPI)A District Performance Index (DPI) is the average performance of students in a subject area (i.e., ELA, Mathematics or Science) on the state summative assessments. The DPI ranges from 0-100. A DPI is reported for all students tested in a district and for students in each individual student group. Connecticut's ultimate target for a DPI is 75.
English Language Arts(ELA) Math Science
Count DPI Count DPI Count DPI
American Indian or Alaska Native * * * * * *
Asian 45 73.6 45 69.9 23 69.3
Black or African American 33 49.7 33 44.5 21 48.0
Hispanic or Latino 134 61.9 134 54.3 58 52.9
Native Hawaiian or Other Pacific Islander * * * * N/A N/A
Two or More Races 45 71.0 44 66.7 21 64.6
White 1322 69.9 1322 65.1 573 63.6
English Language Learners 47 61.7 47 57.2 7 *
Non-English Language Learners 1534 69.1 1533 64.2 690 62.6
Eligible for Free or Reduced-Price Meals 211 56.1 210 50.1 104 52.4
Not Eligible for Free or Reduced-Price Meals 1370 70.9 1370 66.1 593 64.2
Students with Disabilities 187 47.1 186 41.8 74 45.1
Students without Disabilities 1394 71.8 1394 66.9 623 64.5
High Needs 367 54.8 366 49.2 154 51.2
Non-High Needs 1214 73.2 1214 68.4 543 65.6
District 1581 68.9 1580 64.0 697 62.4
National Assessment of Educational
Progress (NAEP): Percent At or Above Proficient¹National Assessment of Educational
Progress (NAEP): Percent At or Above Proficient¹NAEP 2015 NAEP 2013
READING Grade 4 Grade 8 Grade 12
Connecticut 43% 43% 50%
National Public 35% 33% 36%
MATH Grade 4 Grade 8 Grade 12
Connecticut 41% 36% 32%
National Public 39% 32% 25%
¹NAEP is often called the "Nation's Report Card." It is sponsored by the
U.S. Department of Education. This table compares Connecticut’sperformance to that of national public school students. Performancestandards for state assessments and NAEP are set independently.Therefore, one should not expect performance results to be the sameacross Smarter Balanced and NAEP. Instead, NAEP results are meant tocomplement other state assessment data. To view student subgroupperformance on NAEP, click here.
Physical Fitness Tests: Students Reaching Health Standard²Physical Fitness Tests: Students Reaching Health Standard²Percent of Students by Grade³ (%) All Tested Grades
4 6 8 10 Count Rate (%)
Sit & Reach 94.5 76.6 89.9 88.9 877 87.6
Curl Up 94.5 85.6 93.1 96.5 877 92.4
Push Up 83.2 73.4 83.5 91.0 877 82.6
Mile Run/PACER 89.1 87.8 85.8 73.9 877 84.5
All Tests - District 73.9 51.4 68.8 63.8 877 64.7
All Tests - State 50.8 51.0 50.3 51.9 51.0
²The Connecticut Physical Fitness Assessment (CPFA) is administered to all students in
Grades 4, 6, 8 and 10. The health-related fitness scores gathered through the CPFA shouldbe used to educate and motivate children and their families to increase physical activityand develop lifetime fitness habits.
³Only students assessed in all four areas are included in this calculation.
0070011 - Berlin School District Printed on 09/21/2016 - Page 5
District Profile and Performance Report for School Year 2014-15Berlin School District
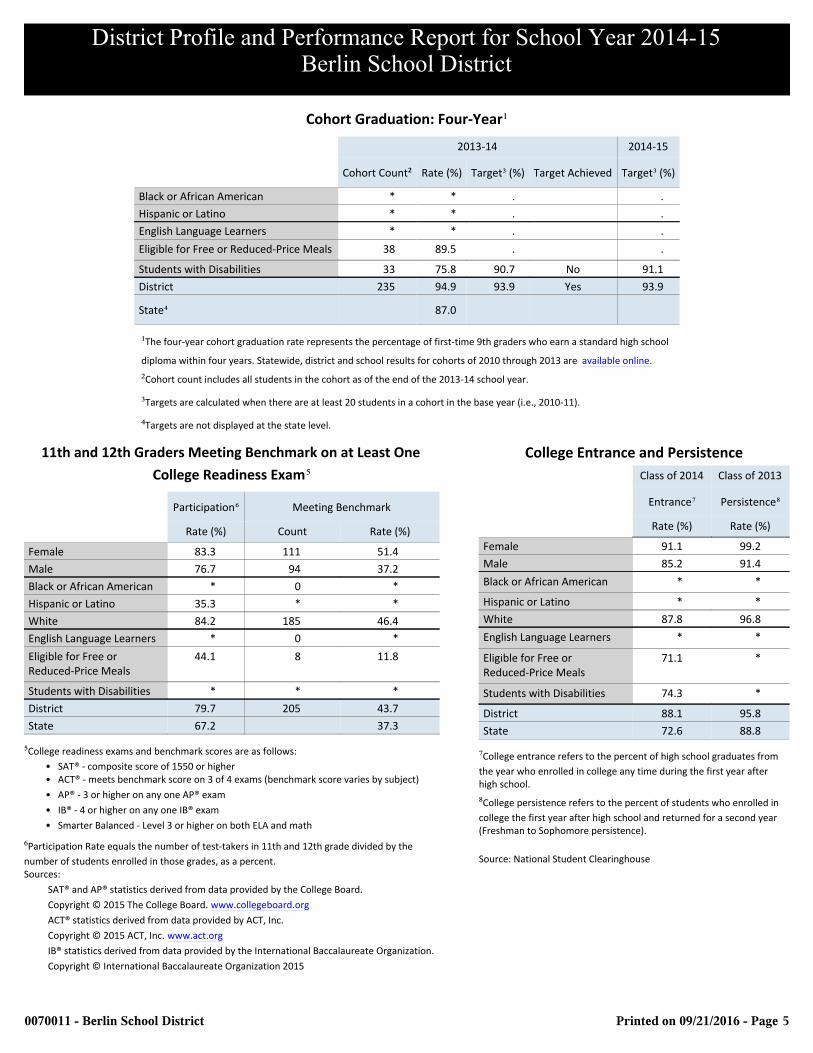
Cohort Graduation: Four-Year¹2013-14 2014-15
Cohort Count² Rate (%) Target³ (%) Target Achieved Target³ (%)
Black or African American * * . .
Hispanic or Latino * * . .
English Language Learners * * . .
Eligible for Free or Reduced-Price Meals 38 89.5 . .
Students with Disabilities 33 75.8 90.7 No 91.1
District 235 94.9 93.9 Yes 93.9
State⁴ 87.0
¹The four-year cohort graduation rate represents the percentage of first-time 9th graders who earn a standard high school
diploma within four years. Statewide, district and school results for cohorts of 2010 through 2013 are available online.
²Cohort count includes all students in the cohort as of the end of the 2013-14 school year.
³Targets are calculated when there are at least 20 students in a cohort in the base year (i.e., 2010-11).
⁴Targets are not displayed at the state level.
11th and 12th Graders Meeting Benchmark on at Least One
College Readiness Exam⁵Participation⁶ Meeting Benchmark
Rate (%) Count Rate (%)
Female 83.3 111 51.4
Male 76.7 94 37.2
Black or African American * 0 *
Hispanic or Latino 35.3 * *
White 84.2 185 46.4
English Language Learners * 0 *
Eligible for Free orReduced-Price Meals
44.1 8 11.8
Students with Disabilities * * *
District 79.7 205 43.7
State 67.2 37.3
⁵College readiness exams and benchmark scores are as follows:
• SAT® - composite score of 1550 or higher • ACT® - meets benchmark score on 3 of 4 exams (benchmark score varies by subject)
• AP® - 3 or higher on any one AP® exam
• IB® - 4 or higher on any one IB® exam
• Smarter Balanced - Level 3 or higher on both ELA and math
⁶Participation Rate equals the number of test-takers in 11th and 12th grade divided by the
number of students enrolled in those grades, as a percent.Sources:
SAT® and AP® statistics derived from data provided by the College Board.
Copyright © 2015 The College Board. www.collegeboard.org
ACT® statistics derived from data provided by ACT, Inc.
Copyright © 2015 ACT, Inc. www.act.org
IB® statistics derived from data provided by the International Baccalaureate Organization.
Copyright © International Baccalaureate Organization 2015
College Entrance and Persistence
Class of 2014 Class of 2013
Entrance⁷ Persistence⁸Rate (%) Rate (%)
Female 91.1 99.2
Male 85.2 91.4
Black or African American * *
Hispanic or Latino * *
White 87.8 96.8
English Language Learners * *
Eligible for Free orReduced-Price Meals
71.1 *
Students with Disabilities 74.3 *
District 88.1 95.8
State 72.6 88.8
⁷College entrance refers to the percent of high school graduates from
the year who enrolled in college any time during the first year afterhigh school.
⁸College persistence refers to the percent of students who enrolled in
college the first year after high school and returned for a second year(Freshman to Sophomore persistence).
Source: National Student Clearinghouse
0070011 - Berlin School District Printed on 09/21/2016 - Page 6
District Profile and Performance Report for School Year 2014-15Berlin School District
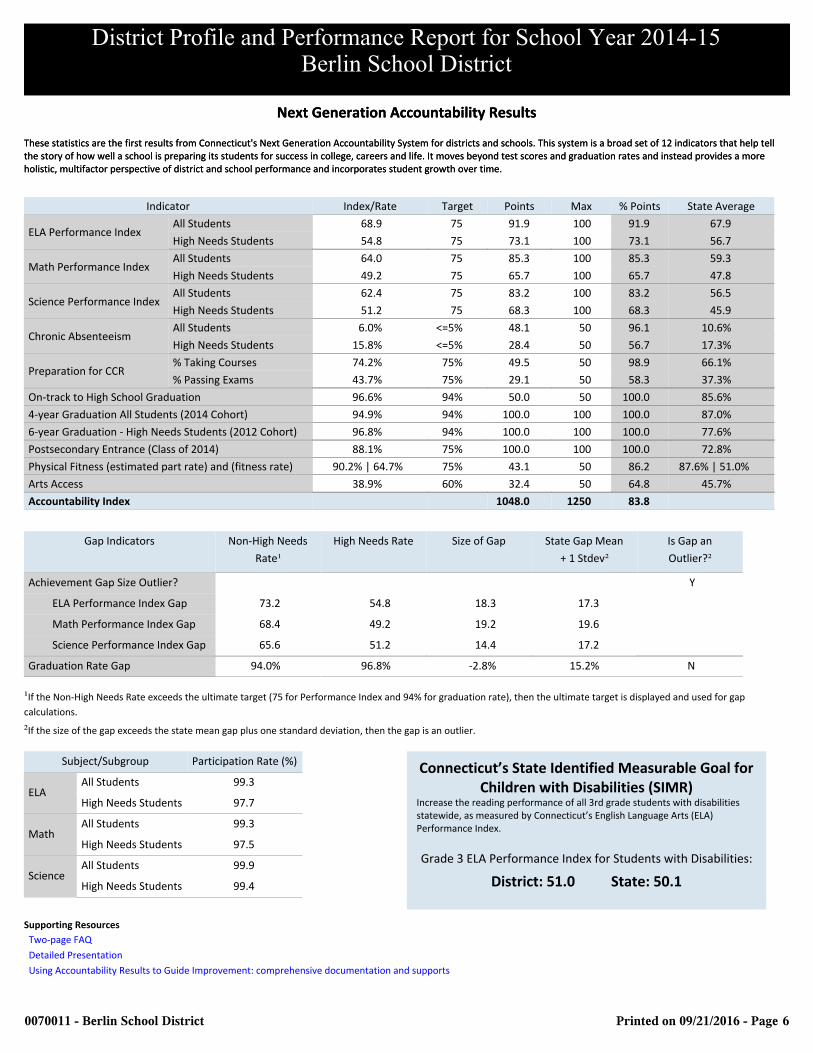
Next Generation Accountability Results
These statistics are the first results from Connecticut's Next Generation Accountability System for districts and schools. This system is a broad set of 12 indicators that help tellthe story of how well a school is preparing its students for success in college, careers and life. It moves beyond test scores and graduation rates and instead provides a moreholistic, multifactor perspective of district and school performance and incorporates student growth over time.
Indicator Index/Rate Target Points Max % Points State Average
ELA Performance IndexAll Students 68.9 75 91.9 100 91.9 67.9
High Needs Students 54.8 75 73.1 100 73.1 56.7
Math Performance IndexAll Students 64.0 75 85.3 100 85.3 59.3
High Needs Students 49.2 75 65.7 100 65.7 47.8
Science Performance IndexAll Students 62.4 75 83.2 100 83.2 56.5
High Needs Students 51.2 75 68.3 100 68.3 45.9
Chronic AbsenteeismAll Students 6.0% <=5% 48.1 50 96.1 10.6%
High Needs Students 15.8% <=5% 28.4 50 56.7 17.3%
Preparation for CCR% Taking Courses 74.2% 75% 49.5 50 98.9 66.1%
% Passing Exams 43.7% 75% 29.1 50 58.3 37.3%
On-track to High School Graduation 96.6% 94% 50.0 50 100.0 85.6%
4-year Graduation All Students (2014 Cohort) 94.9% 94% 100.0 100 100.0 87.0%
6-year Graduation - High Needs Students (2012 Cohort) 96.8% 94% 100.0 100 100.0 77.6%
Postsecondary Entrance (Class of 2014) 88.1% 75% 100.0 100 100.0 72.8%
Physical Fitness (estimated part rate) and (fitness rate) 90.2% | 64.7% 75% 43.1 50 86.2 87.6% | 51.0%
Arts Access 38.9% 60% 32.4 50 64.8 45.7%
Accountability Index 1048.0 1250 83.8
Gap Indicators Non-High Needs
Rate¹High Needs Rate Size of Gap State Gap Mean
+ 1 Stdev²Is Gap an
Outlier?²Achievement Gap Size Outlier? Y
ELA Performance Index Gap 73.2 54.8 18.3 17.3
Math Performance Index Gap 68.4 49.2 19.2 19.6
Science Performance Index Gap 65.6 51.2 14.4 17.2
Graduation Rate Gap 94.0% 96.8% -2.8% 15.2% N
¹If the Non-High Needs Rate exceeds the ultimate target (75 for Performance Index and 94% for graduation rate), then the ultimate target is displayed and used for gap
calculations.
²If the size of the gap exceeds the state mean gap plus one standard deviation, then the gap is an outlier.
Subject/Subgroup Participation Rate (%)
ELAAll Students 99.3
High Needs Students 97.7
MathAll Students 99.3
High Needs Students 97.5
ScienceAll Students 99.9
High Needs Students 99.4
Connecticut’s State Identified Measurable Goal forChildren with Disabilities (SIMR)
Increase the reading performance of all 3rd grade students with disabilitiesstatewide, as measured by Connecticut’s English Language Arts (ELA)Performance Index.
Grade 3 ELA Performance Index for Students with Disabilities:
District: 51.0 State: 50.1
Supporting Resources
Two-page FAQ
Detailed Presentation
Using Accountability Results to Guide Improvement: comprehensive documentation and supports
0070011 - Berlin School District Printed on 09/21/2016 - Page 7
District Profile and Performance Report for School Year 2014-15Berlin School District
Narratives
School District Improvement Plans and Parental Outreach Activities School District Improvement Plans and Parental Outreach ActivitiesThe Berlin Public School District is committed to a continuous improvement process. District goals are adopted annually by the Berlin Board of Educationand supported by measurable building goals, which are enhanced by team professional growth goals and student learning outcomes. This cycle forms theframework for continuous student achievement through focused instructional improvement. The capacity of teachers and administrators is developedthrough focused, ongoing, individual job-embedded professional development related to individual, team, school and district goals.
Student truancy has not been a concern. We have a K-12 policy which requires parents to contact the school should their child be absent. If a parentneglects to contact the school, school personnel make every effort to contact the parent on the day of the absence. Student attendance is closelymonitored, tracked and recorded throughout the district with set procedures being initiated based on the cumulative number of absences over a givenperiod of time.
We regularly look at data to inform our decisions regarding allocation of resources, instructional decisions and implementation of interventions. Theseefforts lead to the development of focused, data-driven action plans, performance indicators, and the continued implementation of a scientificresearch-based intervention (SRBI) model across the school district. Berlin Public Schools is committed to supporting students in their least restrictiveenvironment. The special education services provided to students have been developed to support this concept. The district has expanded programmingfor students with significant needs by developing a comprehensive team approach to address their unique learning styles. The programming has beenstrengthened by the district employing a full-time board certified behavioral analyst and an assistive technology specialist. In addition, all of our relatedservices staff members are employed by the district which allows for ongoing consultation, collaboration and direct services for students receiving specialeducation and 504 services. We also work closely with a psychiatrist to support the social and emotional needs of students.
We recognize that parent partnerships are a vital piece of the school district’s success, and to support this belief, system-wide efforts to increase parentalinvolvement are taking place at all levels. Throughout the district, parent volunteers are welcome at all schools and are considered a valuable resource. Numerous school-sponsored activities occur throughout the year and parent participation is typically high. Annual surveys are used to better understandparent perceptions regarding the school district and areas requiring improvement. All schools and the Board of Education utilize a number ofcommunication tools including the website, Blackboard Connect and monthly newsletters to ensure that all interested parents have access to events andhappenings occurring throughout the school district.
Information regarding workshops, events, and seminars for families is posted on the district website. Information regarding special education programsand services is shared at monthly parent advisory meetings held by the superintendent of schools. The district holds a yearly preschool screening forstudents between the ages of 2 -4.
Efforts to Reduce Racial, Ethnic and Economic IsolationThe Berlin Public Schools provide a variety of programs and experiences that are designed to reduce racial, ethnic, and economic isolation. We arepleased with the response to these efforts from students, staff, and members of the community. Our participation in the Open CHOICE Program isdistrictwide and during this year we had 114 CHOICE students in our five schools. There is a sincere commitment to reduce racial, ethnic and economicisolation. The Board of Education recognizes that Berlin is not a highly-diverse community and that the greater Berlin community also benefits fromparticipation in CHOICE. We continue to expand the CHOICE seats we offer in an attempt to bring additional students into our district. Many of ourCHOICE students spent time at the Berlin Fair and enjoyed the experience.
Each of our schools continues to participate in and provide a number of learning activities designed to promote diversity. When curriculum is revised,diligent attention is given to be certain it is reflective of diversity. Administration continues to offer updates to the Board of Education and communityoutlining the activities that are conducted as part of the district’s efforts to educate students about understanding differences among people.
0070011 - Berlin School District Printed on 09/21/2016 - Page 8
District Profile and Performance Report for School Year 2014-15Berlin School District
Equitable Allocation of Resources among District SchoolsIt is the practice of the Berlin Board of Education and its central office administration that each school in the district will have comparable resources whilerecognizing factors such as equipment and specialized supply needs at the secondary schools are inherently more costly in nature. The proposed budgetfor the district is created by administrators in the late fall. It is built on the assumption that the three elementary schools will receive a fixed amount foreach student enrolled in the school. This will “guarantee” an equitable allocation of resources among the schools. Once that assumption was met,adjustments were then made to determine what additional resources would be allocated to particular schools to adequately address needs particular to acertain school. The same process was then used at the two secondary schools. However, a different per student fixed amount was used because of thesignificantly higher costs as mentioned above.
Once the proposed budget was adopted, appropriate reductions, if necessary, were made “across the board,” and the same per student expenditure ratiodescribed above was maintained as closely as possible.