bendigo and adelaide bank
TRANSCRIPT
1
August 20, 2012
Bendigo and Adelaide Bank
2012 full year results

2
This document is a presentation of general background information about the Group’s activities current at the date of the presentation. It is information in a summary form and does not purport to be complete. It is to be read in conjunction with the Bank’s full year results filed with the Australian Securities Exchange on 20 August 2012. It is not intended to be relied upon as advice to investors or potential investors and does not take into account the investment objectives, financial situation or needs of any particular investor. These should be considered, with or without professional advice, when deciding if an investment is appropriate. This presentation may contain certain "forward-looking statements". The words "anticipate", “believe", "expect", "project", "forecast", "estimate", "likely", "intend", "should", "could", "may", "target", "plan" and other similar expressions are intended to identify forward-looking statements. Indications of, and guidance on, future earnings and financial position and performance are also forward-looking statements. Such forward-looking statements are not guarantees of future performance and involve known and unknown risks, uncertainties and other factors, many of which are beyond the control of the Group that may cause actual results to differ materially from those expressed or implied in such statements. There can be no assurance that actual outcomes will not differ materially from these statements. You are cautioned not to place undue reliance on forward-looking statements. Such forward-looking statements only speak as of the date of this presentation and the Group assumes no obligation to update such information. To the maximum extent permitted by law, the Group shall have no liability whatsoever for any loss or liability of any kind arising in respect of the information contained, or not being contained, in this document. Non-IFRS Financial Information: The discussion and analysis discloses the net profit after tax on both a ‘statutory basis’ and a ‘cash basis’. The statutory basis is prepared in accordance with the Corporations Act 2001 and the Australian Accounting Standards, which comply with International Financial Reporting Standards (IFRS). The cash basis is used by management to present a clear view of the Group’s underlying operating results, excluding a number of items that are deemed to be outside of our core activities and such items are not considered to be representative of the Group’s ongoing financial performance. Refer to the Appendix 4E for reconciliation to statutory profit. Copyright protection exists in this presentation.
Disclaimer

3
• Results overview • Financial performance • Strategy and outlook
Agenda

4
Mike Hirst
Results overview
Group Managing Director

5
Our result Financial performance - statutory profit after tax
• Statutory profit after tax $195.0m
• Statutory profit after tax before specific items $312.0m
• Statutory earnings affected by $95.1m goodwill write-down in wealth cash generating unit in 1H12
• Full year dividend of 60.0¢1, fully franked
Financial performance - cash basis earnings
• Cash earnings of $323.0m
• Cash earnings per share 84.2¢
• Cash basis earnings return on average tangible equity 14.1%
Results overview 1. Half-year dividend of 30.0 cents, fully franked paid on 31 March 2012

6
Our result Capital management
• Recent capital management initiatives1 materially boost Core Tier 1 levels by 42bps • Provides pro-forma Core Tier 1 levels of 8.09% and Tier 1 ratio of 8.82%
Business strength • 80% retail funded2 • Cost efficiencies reinvested into key strategic initiatives • Business strength reflected in ratings upgrades
Outlook and opportunity
• Markets remain challenging and outlook uncertain • Brand-specific demand through the Bendigo retail network • Margin squeeze in early 2H mitigated by active balance sheet management • Maintaining front office capacity for future growth • 35bps mortgage repricing only partially recovering increased funding costs • Opportunistic and strategic approach to non-organic investments (BOCA, NoQ)
Results overview 1. Capital management initiatives include sale of IOOF stake and sale of B-notes in TORRENS securitisation trusts 2. As at June 2012, based on total funding, including off-balance sheet

7
Results overview 1. Source: Recent company announcements and APS 330 disclosures. BEN core tier 1 ratio 7.67% as at June 2012, 2. 0.42% relates to post balance capital management initiatives including the sale of the IOOF stake and sale of B-notes in Torrens securitisation trusts 3. Subject to market conditions and relevant Board and regulatory approvals
Improved balance sheet strength Capital • Prudent and pro-active approach to
balance sheet management • Basel III Tier One Hybrid Capital issue to
be launched 1H133
• Recent non-dilutive capital initiatives include sale of stake in IOOF, and subordinated notes in Torrens RMBS program – providing Core Tier 1 benefit of 42bps or an equivalent $120m in capital

8
Results overview
A year of consolidation and investment • Material improvement in capital levels
• Equity raising (December 2011) and share purchase plan (March 2012) • Sale of IOOF stake (August 8) • Sale of Torrens RMBS B-notes (announced today) • BEN now exceeds all expected Basel III minimum standards • Further efficiency through proposed Basel III T1 Hybrid in 1H13
• Balance sheet continues to grow and remains low-risk • Retail mortgage origination above system growth • Low arrears and losses • Superior funding mix
• Brand, staff and customer engagement still # 1 • Staff engagement exceeds high performance benchmark by 2%

9
Richard Fennell
Financial overview
Chief Financial Officer

10
$m FY June 2010 FY June 2011 FY June 2012 change (pcp)
Net profit after tax ($m) 242.6m 342.1m 195.0m 43.0%
Cash earnings ($m) 291.0m 336.2m 323.0m 3.9%
Cash EPS 83.3¢ 92.3¢ 84.2¢ 8.8%
Dividend per share1 58.0¢ 60.0¢ 60.0¢ ––
Cost to income 58.1% 57.4% 59.1% 1.7%
Cost to average assets 1.39% 1.37% 1.34% 0.03%
Tax rate on cash earnings 28.4% 27.9% 30.0% 2.1%
Net interest margin 2.122 2.17 2.10 7 bps
Cash basis return on tangible equity 16.4% 16.9% 14.1% 2.8%
Cash basis return on equity 8.2% 9.1% 8.4% 0.7%
Balance sheet FY June 2012 % change pcp Capital and funding FY June 2012 change pcp
Total assets ($bn) 57.2 +4.1% Tier 1 capital (%) 8.39 54 bpts
Total liabilities ($bn) 53.0 +3.9% Total capital (%) 10.41 18 bpts
RWA’s ($bn) 28.3 +8.7% Deposit funding3 (%) 79.7 +4.8%
Note: Comparisons are with prior corresponding full year unless otherwise stated 1: Includes 30 cents per share dividend in 1st half for FY12. 2: Normalised NIM for FY2010 to include 12 month contribution of Rural Bank 3: Total funding position
Financial overview

Cash earnings movement
11
• Cash earnings impacted by Homesafe trust contribution, long service leave calculation adjustment, and staff related costs
Financial overview

12
Group performance
Financial overview
• EPS metrics impacted by December 2011 capital raising and share purchase plan in March 2012
• Dividends maintained at 30 cents • Steady cash basis earnings

13
Net interest margin (%)
• Impact on NIM in early 2H mitigated by active balance sheet management
• NIM recovery in late 2H through pricing initiatives
Financial overview

14
Net interest margin
Financial overview

15
$18bn
$11bn
Marginal retail funding
*Source: Company data
Financial overview
16
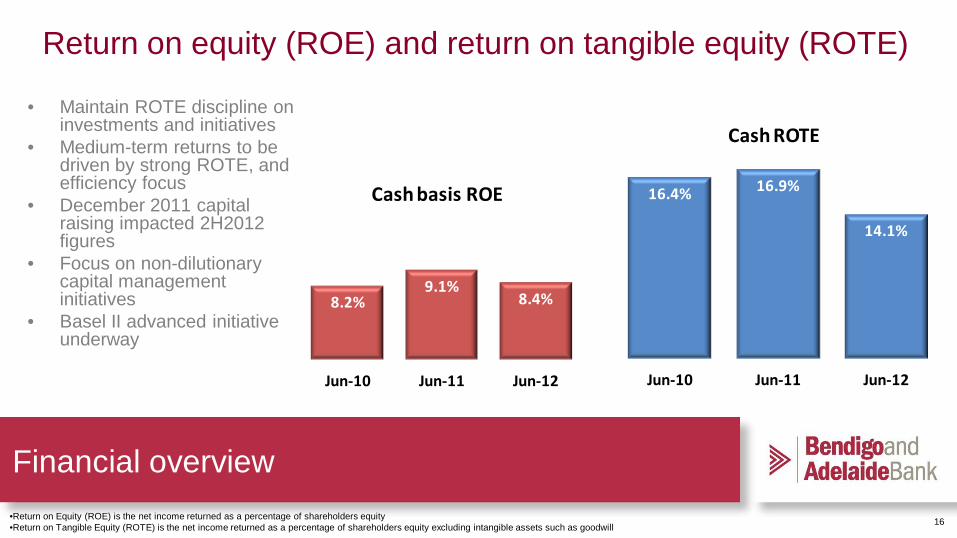
Return on equity (ROE) and return on tangible equity (ROTE) • Maintain ROTE discipline on
investments and initiatives • Medium-term returns to be
driven by strong ROTE, and efficiency focus
• December 2011 capital raising impacted 2H2012 figures
• Focus on non-dilutionary capital management initiatives
• Basel II advanced initiative underway
•Return on Equity (ROE) is the net income returned as a percentage of shareholders equity •Return on Tangible Equity (ROTE) is the net income returned as a percentage of shareholders equity excluding intangible assets such as goodwill
8.2%9.1%
8.4%
Jun-10 Jun-11 Jun-12
Cash basis ROE 16.4% 16.9%
14.1%
Jun-10 Jun-11 Jun-12
Cash ROTE
Financial overview

17
Efficiency focus remains Cost-to-income (CTI) • Increased CTI primarily a factor of new initiatives
and lower income • CTI of 59.1% for June-12 (including BOCA) • Long-term target of 55% remains • Cost to average assets shows continued
improvement Staff movement • BOCA and strategic initiatives including Basel II
advanced project key drivers of increase in FTE’s Operating expenses • Operating expenses (ex BOCA) up only 1.1% • No Executive STI bonus pool
Financial overview

18
Capitalised software
• Capitalised software held flat FY12 • FY11 increase includes significant
investment in customer facing systems (not core banking systems)
• Investment in Basel II Advanced systems will lead to further growth
Financial overview

19
• Profit up 1.7% vs pcp • Increased allocation of
central costs – amortisation of new CRM system
• Continued investment in branch distribution
• Interest income reflects volume off-setting margin compression
• Credit quality remains sound
Financial overview – retail banking

20
• Profit up 5.3pc v pcp driven
by portfolio growth • Operating expenses
reduced • Scalable business model,
with sustainable commission structure
Financial overview – third party banking

21
12
13
14
15
16
Jul-11 Aug-11 Sep-11 Oct-11 Nov-11 Dec-11 Jan-12 Feb-12 Mar-12 Apr-12 May-12 Jun-12
Portfolio movement
Retail mortgages portfolio TPM portfolio
$bn 9.3%
2.5%
Momentum in mortgages
• Retail mortgage growth above system • Third party mortgages have faced
strong price competition in FY12, however monthly originations starting to improve
100
200
300
400
500
Jun-11 Jul-11 Aug-11 Sep-11 Oct-11 Nov-11 Dec-11 Jan-12 Feb-12 Mar-12 Apr-12 May-12 Jun-12
$m TPM - originations per month
1. Source: APRA statistics June 2012. 2. BEN housing growth of 9.3% is for retail origination channel only
Financial overview – retail mortgages

22
• Profit up 28pc v pcp • Credit expenses returned to
long-term average • Further growth potential through
distribution alliances • Roll-out of Australia Post
distribution continues • Expense growth largely reflects
investment in distribution
Financial overview – Rural Bank
23
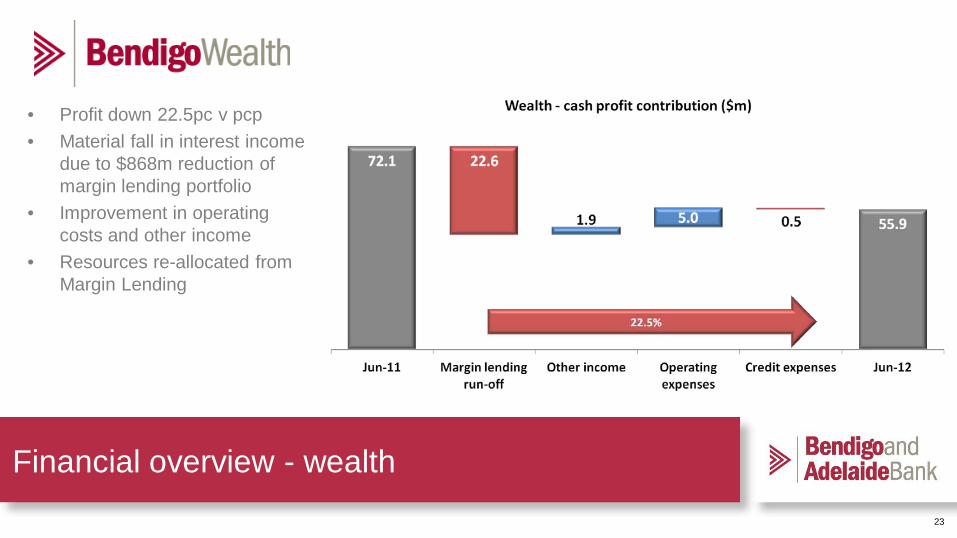
• Profit down 22.5pc v pcp • Material fall in interest income
due to $868m reduction of margin lending portfolio
• Improvement in operating costs and other income
• Resources re-allocated from Margin Lending
Financial overview - wealth

24
Bank of Cyprus integration
• Transfer of business completed 31 July 2012
• FY12 synergies exceeded target by over $800k
• FY13 target synergies also expected to exceeded
• Re-branding to be announced 1H13
Financial overview – Bank of Cyprus

25
Funding remains a strength • No Government Guaranteed wholesale funding
Financial overview

26
$18bn
$11bn
• Term deposits priced to manage liquidity • Successful growth and retention strategies in place • Not a price leader – value proposition driven • Term deposit retention rate consistently above 80%
Retail deposits
*Source: Company data
Financial overview

27
Capital • Material improvement in Tier 1 capital ratios over the reporting period • June 2012 Core Tier 1 approx 7.67% • Pro-forma Core Tier 1 after capital initiatives approx 8.09% • Significant hybrid capacity to improve capital efficiency (subject to market conditions and
relevant board and regulatory approvals)
Financial overview

28
• Continuing improvement in Core Tier 1 levels
• Post balance date initiatives: – IOOF and B-note sale
• August 17 Core Tier 1 of 8.09%
Core Tier 1 materially higher
Financial overview
29
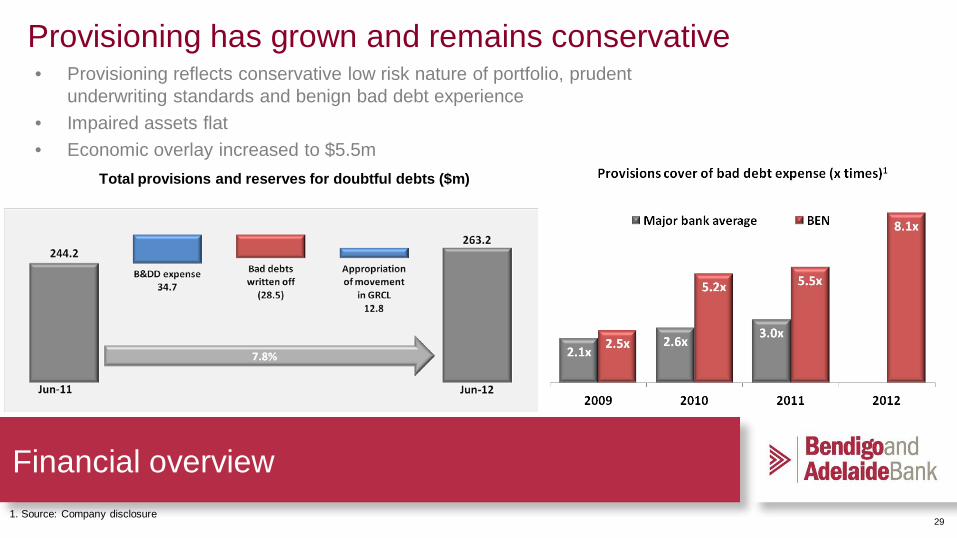
• Provisioning reflects conservative low risk nature of portfolio, prudent underwriting standards and benign bad debt experience
• Impaired assets flat • Economic overlay increased to $5.5m
Provisioning has grown and remains conservative
Financial overview
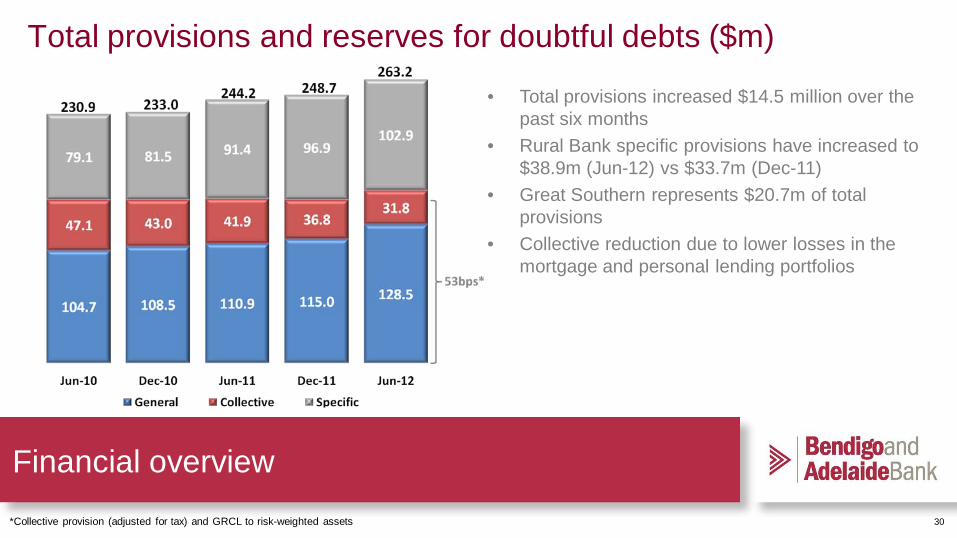
Total provisions and reserves for doubtful debts ($m)
1. Source: Company disclosure
30
• Total provisions increased $14.5 million over the past six months
• Rural Bank specific provisions have increased to $38.9m (Jun-12) vs $33.7m (Dec-11)
• Great Southern represents $20.7m of total provisions
• Collective reduction due to lower losses in the mortgage and personal lending portfolios
Total provisions and reserves for doubtful debts ($m)
*Collective provision (adjusted for tax) and GRCL to risk-weighted assets
Financial overview

31 1. ‘90d+ excluding arrangements’ data only excludes those retail residential mortgage arrangements from October 2011 to June 2012
Financial overview
32
Mike Hirst
Strategy and outlook
Group Managing Director
33 33
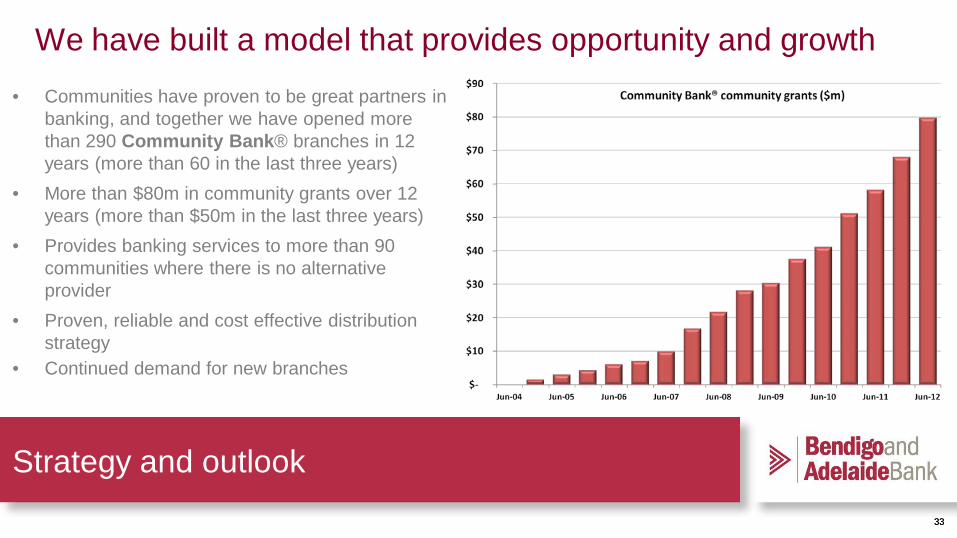
We have built a model that provides opportunity and growth • Communities have proven to be great partners in
banking, and together we have opened more than 290 Community Bank® branches in 12 years (more than 60 in the last three years)
• More than $80m in community grants over 12 years (more than $50m in the last three years)
• Provides banking services to more than 90 communities where there is no alternative provider
• Proven, reliable and cost effective distribution strategy
• Continued demand for new branches
Strategy and outlook

Community Bank® loans Community Bank® footings Community Bank® deposits
Community Bank® footings growth
34
Strategy and outlook

35
• Continued maturation of Community Bank®
and retail network • Opportunities in Bendigo Wealth • Rural Bank recovery • S&P rating upgrade in the past 12 months • Brand, staff and customer advocacy
Robust foundations for volatile times Customer satisfaction1
89.5%
78.0% 77.9% 77.5% 76.4%
50%
60%
70%
80%
90%
100%
BEN NAB ANZ CBA WBC
Business banking satisfaction2
82.9%
66.8%64.7%
61.6% 61.0%
50%
60%
70%
80%
90%
100%
BEN WBC NAB CBA ANZ
Notes: 1. Roy Morgan Research consumer banking in Australia report December 2011—main financial institution satisfaction 2. Roy Morgan Research business banking satisfaction survey May 2012 – main financial institution satisfaction
Strategy and outlook
13.9%
6.5%
12.0%10.1%
0%
5%
10%
15%
20%
Community Bank®
System Community Bank®
System
Deposit growthLoan growth
36
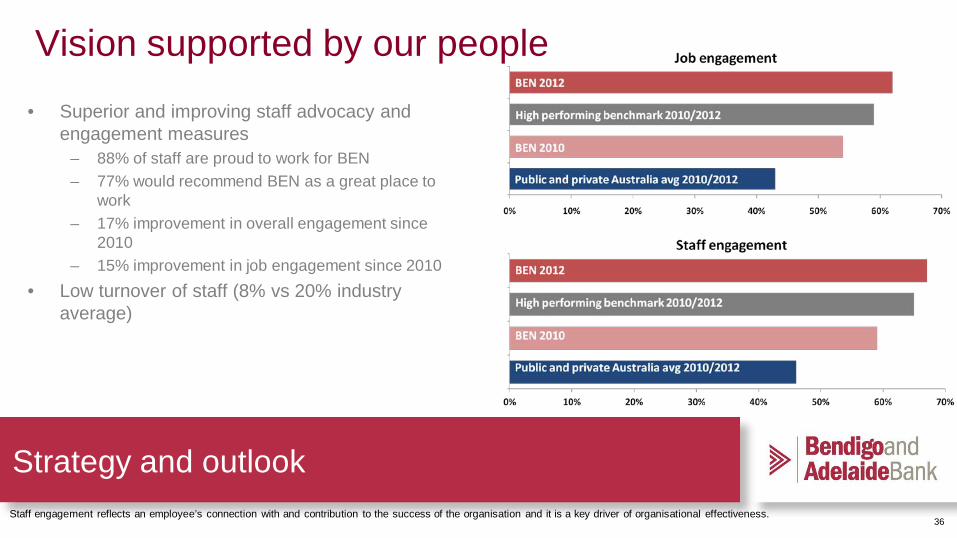
Vision supported by our people • Superior and improving staff advocacy and
engagement measures – 88% of staff are proud to work for BEN – 77% would recommend BEN as a great place to
work – 17% improvement in overall engagement since
2010 – 15% improvement in job engagement since 2010
• Low turnover of staff (8% vs 20% industry average)
Strategy and outlook Staff engagement reflects an employee’s connection with and contribution to the success of the organisation and it is a key driver of organisational effectiveness.
37
• Performance in line with industry experience • Providing a sound platform for growth • Material improvement in capital position with opportunity for further efficiency • Maintaining industry-leading funding profile • Strong liquidity position
• Maintenance of high credit standards • Recent ratings upgrades vindicate long-term approach • Opportunistic investment in growth opportunities • General market conditions remain difficult • Continue to scan for strategic bolt-on acquisitions
In summary….
Outlook

38
Appendices

39
Business Segment Business conditions
Domestic bank operating four distinct brands
• Difficult and uncertain market conditions remain • Unique community, customer, and partner proposition • Ratings upgrade reflects sound credit quality and capital position
Consumer and SME banking
• #1 banking brand for customer and business satisfaction, and advocacy • Unique business model – positioned for growth through business cycle • Liability-led strategy continues to perform • Retail residential mortgages growing above system
Third party channel • Strong independent brand • Upgrading key systems • Origination channel of choice for many consumers
A well diversified business
Overview
40
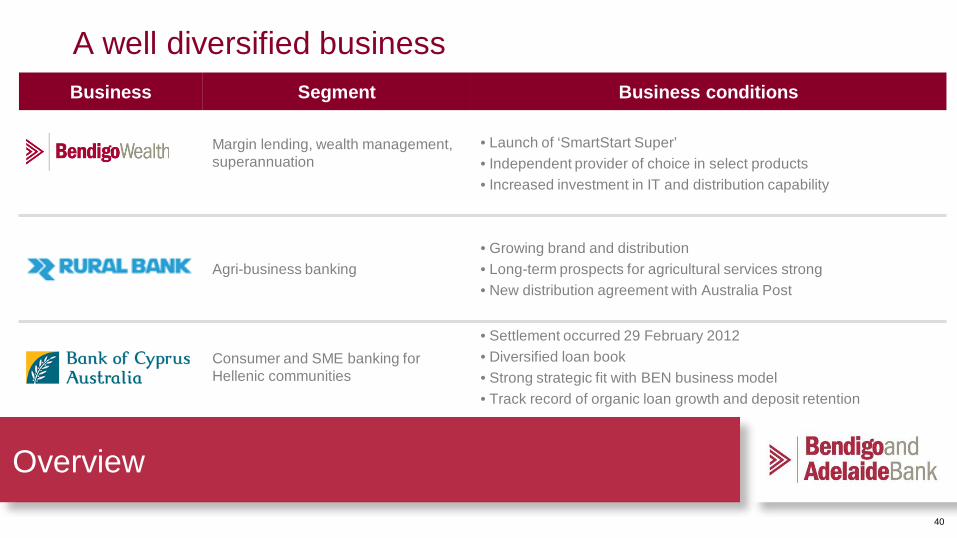
Business Segment Business conditions
Margin lending, wealth management, superannuation
• Launch of ‘SmartStart Super’ • Independent provider of choice in select products • Increased investment in IT and distribution capability
Agri-business banking • Growing brand and distribution • Long-term prospects for agricultural services strong • New distribution agreement with Australia Post
Consumer and SME banking for Hellenic communities
• Settlement occurred 29 February 2012 • Diversified loan book • Strong strategic fit with BEN business model • Track record of organic loan growth and deposit retention
A well diversified business
Overview
41
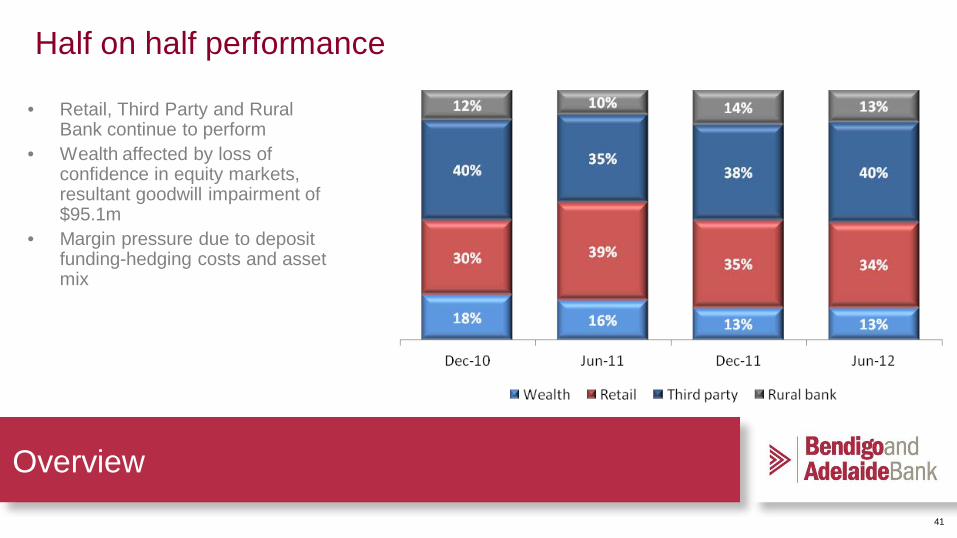
Half on half performance
Overview
• Retail, Third Party and Rural Bank continue to perform
• Wealth affected by loss of confidence in equity markets, resultant goodwill impairment of $95.1m
• Margin pressure due to deposit funding-hedging costs and asset mix

42
Operating expenses • Increase since June 2011
of 1.1pc (ex BOCA)
Financial overview
43
Business performance - credit
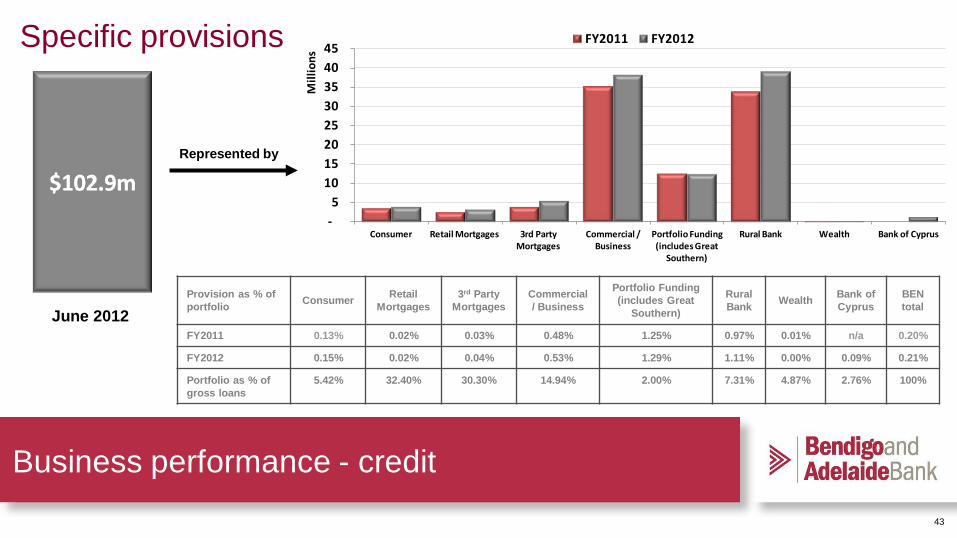
Specific provisions
Represented by
Provision as % of portfolio Consumer Retail
Mortgages 3rd Party
Mortgages Commercial/ Business
Portfolio Funding (includes Great
Southern)
Rural Bank Wealth Bank of
Cyprus BEN total
FY2011 0.13% 0.02% 0.03% 0.48% 1.25% 0.97% 0.01% n/a 0.20%
FY2012 0.15% 0.02% 0.04% 0.53% 1.29% 1.11% 0.00% 0.09% 0.21%
Portfolio as % of gross loans
5.42% 32.40% 30.30% 14.94% 2.00% 7.31% 4.87% 2.76% 100%
June 2012
-5
10 15 20 25 30 35 40 45
Consumer Retail Mortgages 3rd Party Mortgages
Commercial / Business
Portfolio Funding (includes Great
Southern)
Rural Bank Wealth Bank of Cyprus
Mill
ions
FY2011 FY2012
44
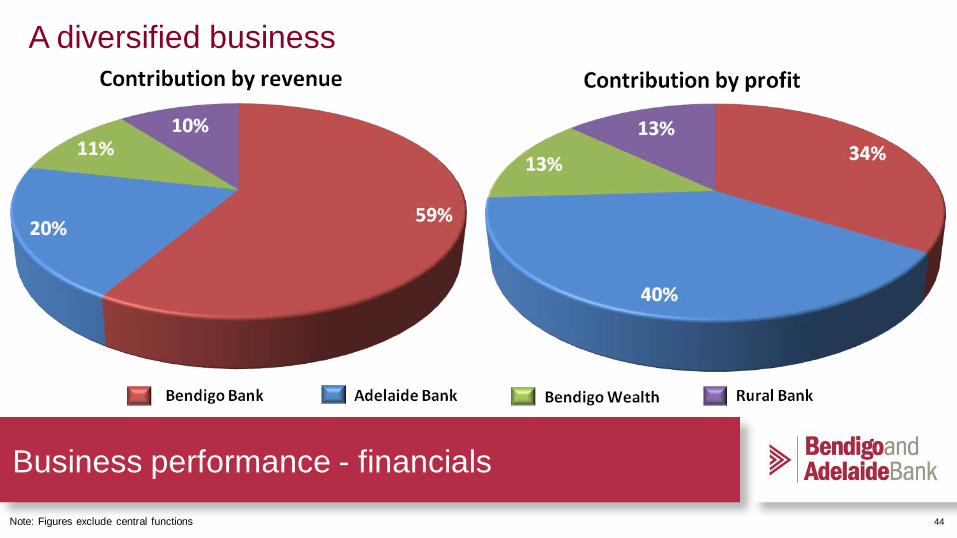
A diversified business
Note: Figures exclude central functions
Business performance - financials
45
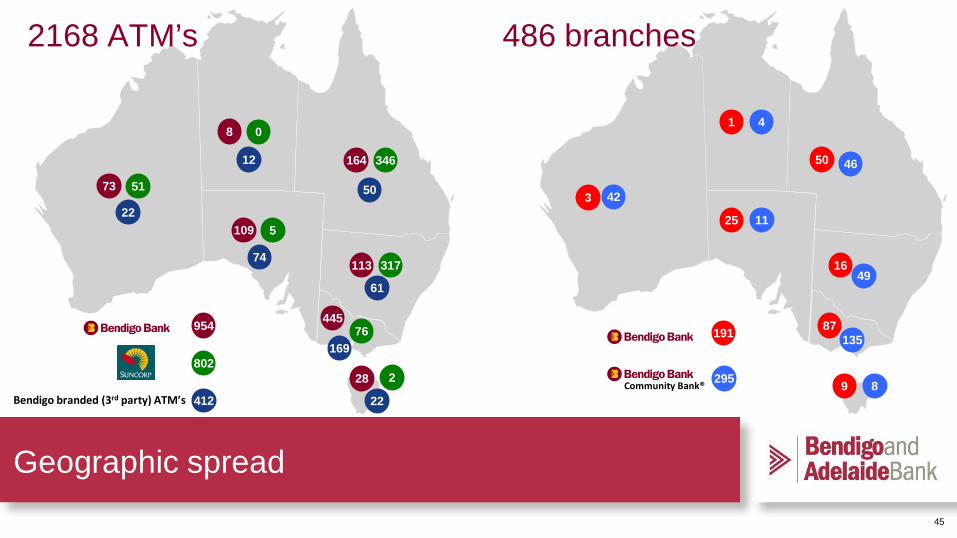
Geographic spread
4
42
11
49
46
135
8
191
164 346
113 317
8 0
73 51
109 5
445 76
28 2
2168 ATM’s 486 branches
Bendigo branded (3rd party) ATM’s
12
22
74
61
50
169
22
802
954
412 Community Bank®
50
16
1
3
25
87
9 295
46
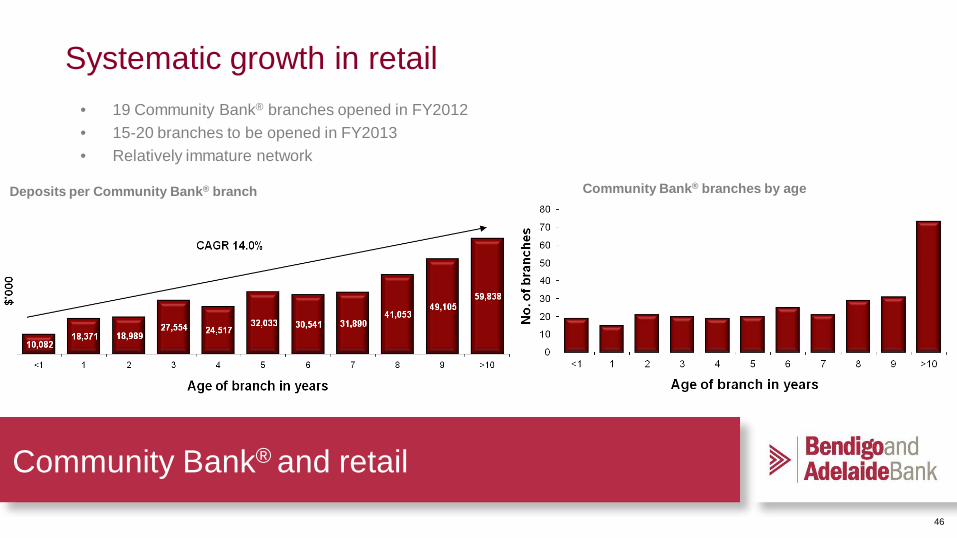
Systematic growth in retail
Community Bank® and retail
• 19 Community Bank® branches opened in FY2012 • 15-20 branches to be opened in FY2013 • Relatively immature network
Deposits per Community Bank® branch Community Bank® branches by age

47 Source: BEN internal data. Notes: 2001 includes FABS acquisition, 2007 includes ADB merger. Excludes alliances and private franchises.
Retail banking
Growth – retail banking
• Continued growth in retail network • Strong pipeline for Community Bank®
branches.

48
Third-Party Banking
• Fewer competitors in the market • Variable cost base • Strong price competition in FY12
Third-Party mortgage business

49
Margin Lending turnaround dependent on equity market risk appetite
• Wealth business affected by lack of confidence in markets
• Write-down in business of $95.1m • Strong long term relationships with
many financial advisory firms • Margins remain strong • Continued excellent credit quality
Business performance - wealth
50
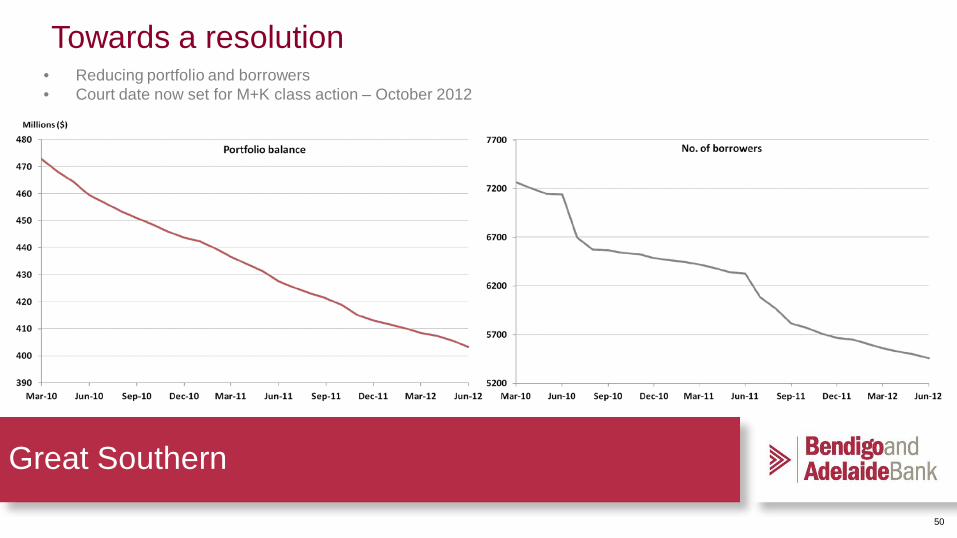
Great Southern
Towards a resolution • Reducing portfolio and borrowers • Court date now set for M+K class action – October 2012

51
• 98.2% secured • 97.8% secured by mortgages and listed securities • Residential lending
– arrears have improved in FY12 – average LVR 61.8%2
• Margin lending – average LVR 45% – 87% of portfolios held ≥ 4 stocks – negligible arrears
1. By security as at 30 June 2012. 2. At origination
Credit
Secure and low risk loan portfolios
52
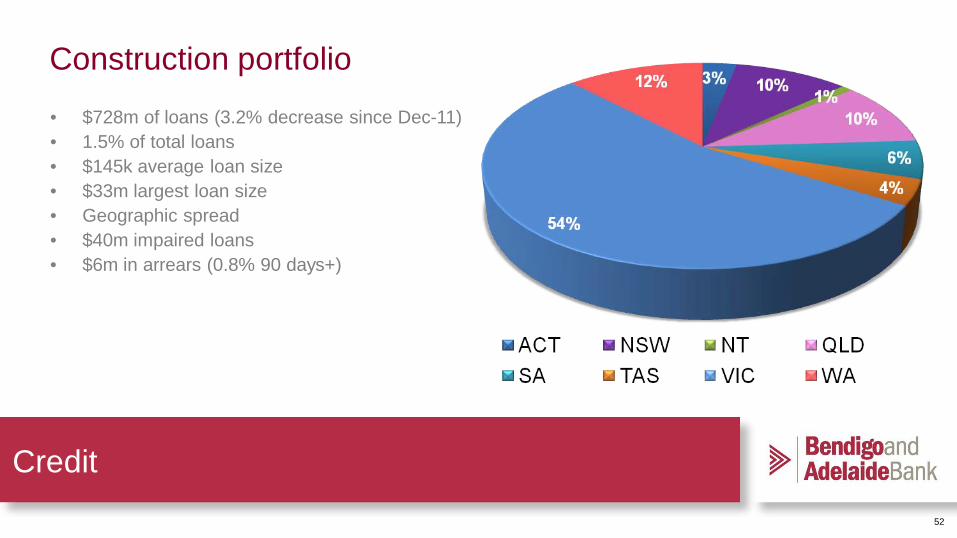
Construction portfolio
Credit
• $728m of loans (3.2% decrease since Dec-11) • 1.5% of total loans • $145k average loan size • $33m largest loan size • Geographic spread • $40m impaired loans • $6m in arrears (0.8% 90 days+)
3%

53
Credit
Group exposures – total $48.8bn Mortgages Jun-12 Dec-11 Jun-11
Owner occupied 63.2% 63.0% 62.7%
Investment 37.0% 37.0% 37.3%
Lo Doc 6.5% 7.0% 7.5%
Retail mortgages 51.7% 50.2% 49.4%
Third Party mortgages 48.3% 49.8% 50.6%
Mortgages with LMI 42.5% 42.7% 44.6%
Average LVR 61.8% 61.8% 61.8%
Average loan balance $183k $180k $170k
90+ arrears inc arrangements 1.2% 1.1% 1.2%
90+ arrears excl arrangements 0.82% 0.74% 0.87%
Impaired loans 0.1% 0.09% 0.10%
Specific provisions 0.03% 0.03% 0.02%
Loss rate 0.03% 0.01% 0.02%
Variable/Fixed 79%/21% 79%/21% 78%/22%
First home owners % portfolio 8.5% 8.6% 8.9%
First home owners average LVR 71.2% 70.4% NA
Note: All mortgage data above represented by loan purpose

54
Credit
• No material change in LVR trends of new business written
• LMI required for high LVR loans
LVR trends
55
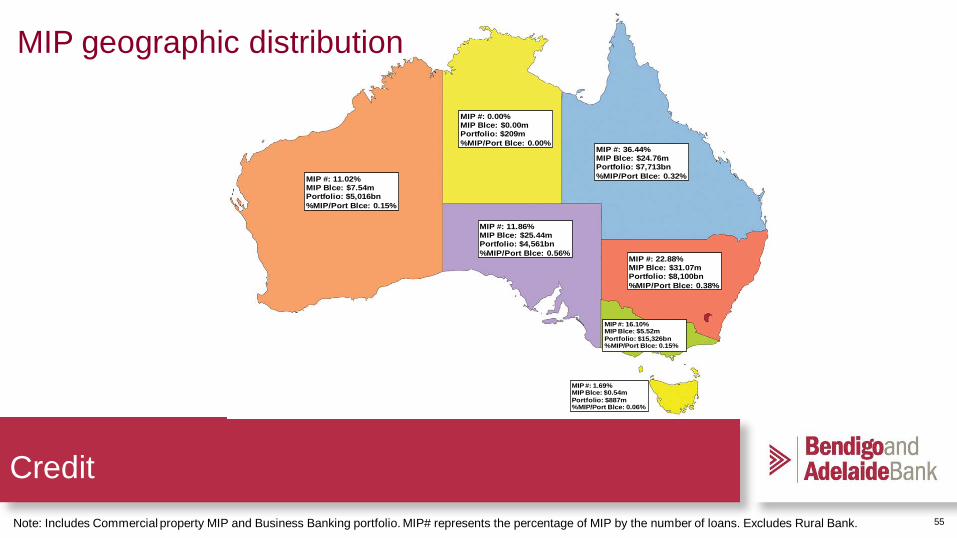
Credit Note: Includes Commercial property MIP and Business Banking portfolio. MIP# represents the percentage of MIP by the number of loans. Excludes Rural Bank.
MIP #: 11.02%MIP Blce: $7.54mPortfolio: $5,016bn%MIP/Port Blce: 0.15%
MIP #: 0.00%MIP Blce: $0.00mPortfolio: $209m%MIP/Port Blce: 0.00%
MIP #: 36.44%MIP Blce: $24.76mPortfolio: $7,713bn%MIP/Port Blce: 0.32%
MIP #: 11.86%MIP Blce: $25.44mPortfolio: $4,561bn%MIP/Port Blce: 0.56%
MIP #: 22.88%MIP Blce: $31.07mPortfolio: $8,100bn%MIP/Port Blce: 0.38%
MIP #: 16.10%MIP Blce: $5.52mPortfolio: $15,326bn%MIP/Port Blce: 0.15%
MIP #: 1.69%MIP Blce: $0.54mPortfolio: $887m%MIP/Port Blce: 0.06%
MIP geographic distribution
56
Credit
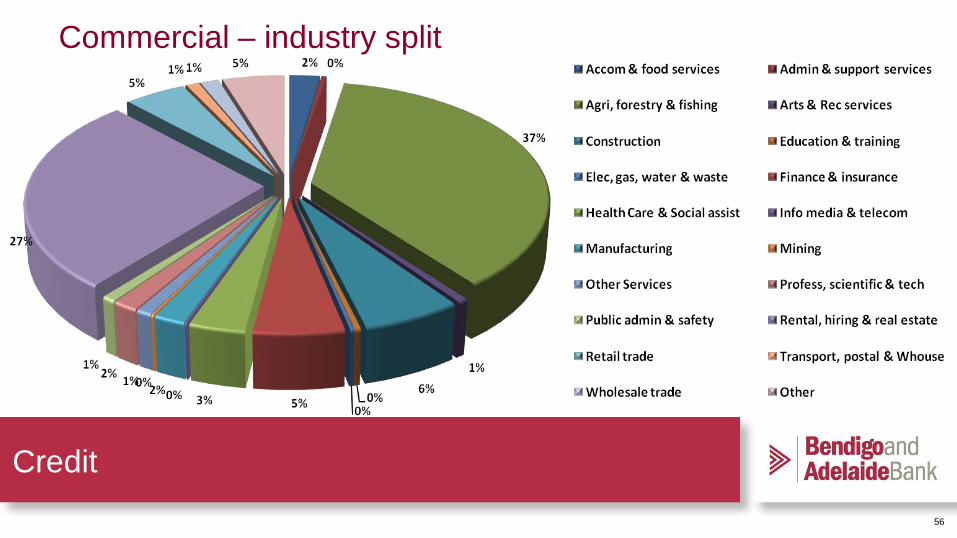
Commercial – industry split

57
Rural Bank – loan diversity
Loans under management

58
Analysts Will Rayner Head of Capital and Investor Relations Bendigo and Adelaide Bank Limited Tel: +61 8 8220 7764 Mob: +61 437 794 366 Email: [email protected] Terry Fountas Senior Manager Investor Relations Bendigo and Adelaide Bank Limited Tel: +61 8 8220 7730 Mob: +61 437 650 913 Email: [email protected]
Media Lauren Andrew Head of Media and Communications Bendigo and Adelaide Bank Limited Tel: +61 3 5485 7109 Mob: +61 407 340 283 Email: [email protected]
Contact