appendix 4e full year results 2019 - bendigo adelaide
TRANSCRIPT

Appendix 4EFull Year Results
For the year ended 30 June 2019 Released 12 August 2019
ABN 11 068 049 178
This report comprises information given to the ASX under listing rule 4.3A
For
per
sona
l use
onl
y

THIS PAGE HAS BEEN LEFT BLANK INTENTIONALLY
For
per
sona
l use
onl
y
1 Appendix 4E: Full year results 3 2 Full year results (continued)
1.1 3 2.3 Financial statements 19
1.2 3 2.3.1 Balance sheet metrics 19
1.3 3 2.3.2 Statement of comprehensive income 20
1.4 ASX Appendix 4E table 3 2.3.3 Balance sheet 20
1.5 4 2.3.4 Statement of changes in equity 21
1.6 Performance summary 4 2.3.5 Cash flow statement 22
1.7 4 2.3.6 Lending 23
1.8 4 2.3.7 Asset quality 24
2.3.8 Credit expenses 25
2 Full year results 2.3.9 Deposits and funds under management 26
2.1 Financial summary 5 2.3.10 Capital and shareholder returns 27
2.1.1 Statutory profit results 5 2.3.10.1 Assets and capital 27
2.1.2 Cash earnings results 6 2.3.10.2 Capital adequacy 27
2.1.3 Cash earnings reconciliation 7 2.3.10.3 Shareholder returns 29
2.2 Results commentary 9 2.3.10.4 Dividends 30
2.2.1 Specific items 9 2.4 Additional notes 31
2.2.2 Net interest margin 10 2.4.1 Analysis of intangible assets 31
2.2.3 Income 11 2.4.2 Net tangible assets per ordinary share 31
2.2.4 Homesafe Trust 12 2.4.3 Investments accounted for using the equity method 31
2.2.5 Operating expenses 13 2.4.4 Credit ratings 32
2.2.6 Average balance sheet 14 2.4.5 Issued capital 32
2.2.7 Segment results 17 2.4.6 AASB 16 Leases 32
Results snapshot
Appendix 4E: Full Year Results
Contents
Company details and reporting period
Results for announcement to the market
Cash earnings results
Annual general meeting
Subsequent events
Appendix 4E: Full year results
Year ended 30 June 2019 2
For
per
sona
l use
onl
y

1.1 Company details and reporting period
Bendigo and Adelaide Bank Limited
ABN 11 068 049 178
Reporting period - twelve months ended: 30 June 2019
Previous corresponding period - twelve months ended: 30 June 2018
1.2 Results for announcement to the market
Income from operations 4.6% to $1,567.5 m
Profit after tax from ordinary activities 13.3% to $376.8 m
Net profit after tax attributable to Owners of the Company 13.3% to $376.8 m
Dividends Date Payable/Paid Amount per security
Current year 2019
Record date for determining entitlements 3 September 2019
Final dividend - fully franked 30 September 2019 35.0 cents
Interim dividend - fully franked 29 March 2019 35.0 cents
Previous year 2018
Final dividend - fully franked 28 September 2018 35.0 cents
Interim dividend - fully franked 29 March 2018 35.0 cents
1.3 Cash earnings results
Cash earnings attributable to Owners of the Company 6.6% to $415.7 m
Cash earnings per share 7.7% to 85.0 cents
See note 2.1.2 and 2.3.10.3 for full details
This Appendix 4E: Full year results should be read in conjunction with the media release and results presentation released to the
ASX on 12 August 2019.
1.4 ASX Appendix 4E table Page
Details of reporting period and previous period 3
Results for announcement to the market 3
Commentary on results 9
Net tangible assets per ordinary share 31
Details of individual and total dividends 30
Dividend dates 3
Details of any dividend or distribution reinvestment plans in operation 30
Details of associates and joint arrangement entities 31
Details of entities over which control has been gained or lost during the period
During the financial period there have been no changes to the entities in the Group.
Accounting standards used for foreign entities
Not applicable.
Dispute or qualifications if audited
This report is based on financial accounts that are in the process of being audited by our external auditors, Ernst & Young.
Appendix 4E: Full year results
Appendix 4E: Full year results
Year ended 30 June 2019 3
For
per
sona
l use
onl
y

1.5 Results snapshot
Statutory profit 13.3% to $376.8m
Statutory earnings per share 14.2% to 77.1 cents
Cash earnings 6.6% to $415.7m
Cash earnings per share 7.7% to 85.0 cents
Net interest margin remains flat at 2.36% compared to June 2018
CET1 ratio of 8.92% up 30 basis points compared to June 2018
1.6 Performance summary
On a statutory basis, net profit was $376.8m compared to $434.5m in June 2018.
Cash earnings was $415.7m compared to $445.1m in June 2018.
On a cash earnings basis:
Net interest income decreased $19.4m to $1,304.2m. Net interest margin (before revenue share arrangements) for the year
remained unchanged at 2.36% compared to the prior corresponding period.
Other operating income increased $14.1m or 5.0% mainly due to an increase in trading book revaluation income.
Operating expenses increased by $53.6m or 5.9% mainly due to an increase in staff and redundancy costs, remediation costs,
software amortisation and technology costs.
Credit expenses decreased by $20.3m or 28.8%.
Net impaired assets decreased by $34.2m or 15.7%.
Great Southern past due 90 days has reduced by $15.6m or 30.9%, other lending past due 90 days has decreased by $9.9m or 2.4%.
Common Equity Tier 1 ratio was up 30 basis points to 8.92% compared to June 2018. Total capital was 13.14% compared to 12.85% in
June 2018.
The final dividend has been maintained at 35.0 cents for June 2019.
Cash earnings adjustments are outlined in section 2.1.2, 2.1.3, and 2.2.1.
1.7 Annual general meetingThe annual general meeting will be held as follows:
Place: The Bendigo Centre, Bath Lane, Bendigo, Victoria
Date: 29 October 2019
Time: 11 a.m. (Australian Eastern Daylight Saving Time)
1.8 Subsequent eventsOn 1 July 2019 the Group completed the sale of its specialist self-managed superannuation fund business located in Geelong West
pursuant to an Asset Purchase Agreement with LBWFP Pty Ltd. The Group also entered into an Asset Purchase Agreement to sell its financial
planning business, Bendigo Financial Planning Pty Ltd, to Bridges Financial Services Group Pty Limited with an effective date of 1 August 2019.
This agreement saw Bridges Financial Services Group Pty Limited assume the provision of financial planning services to existing
Bendigo Financial Planning Pty Ltd customers and also saw the commencement of an ongoing referral arrangement. As at 30 June 2019,
both of these business were recorded as held-for-sale.
No other matters or circumstances have arisen since the end of the financial year to the date of this report which significantly affected or
may significantly affect the operations of the Group, the results of those operations, or the state of affairs of the Group in subsequent
financial periods.
1
Appendix 4E: Full year results
Year ended 30 June 2019 4
1
For
per
sona
l use
onl
y
2.0 Full year results
2.1 Financial summary
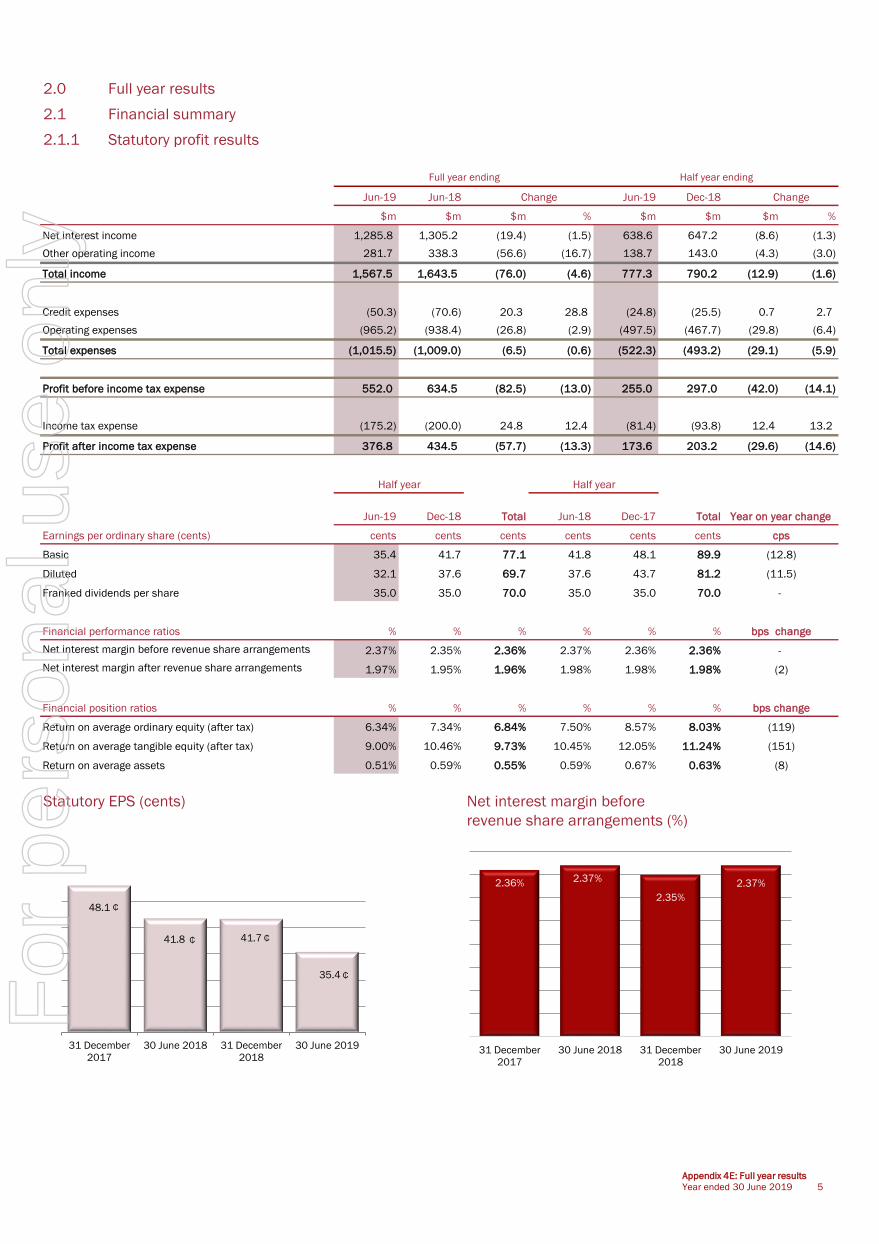
2.1.1 Statutory profit results
Jun-19 Jun-18 Jun-19 Dec-18
$m $m $m % $m $m $m %
Net interest income 1,285.8 1,305.2 (19.4) (1.5) 638.6 647.2 (8.6) (1.3)
Other operating income 281.7 338.3 (56.6) (16.7) 138.7 143.0 (4.3) (3.0)
Total income 1,567.5 1,643.5 (76.0) (4.6) 777.3 790.2 (12.9) (1.6)
Credit expenses (50.3) (70.6) 20.3 28.8 (24.8) (25.5) 0.7 2.7
Operating expenses (965.2) (938.4) (26.8) (2.9) (497.5) (467.7) (29.8) (6.4)
Total expenses (1,015.5) (1,009.0) (6.5) (0.6) (522.3) (493.2) (29.1) (5.9)
Profit before income tax expense 552.0 634.5 (82.5) (13.0) 255.0 297.0 (42.0) (14.1)
Income tax expense (175.2) (200.0) 24.8 12.4 (81.4) (93.8) 12.4 13.2
376.8 434.5 (57.7) (13.3) 173.6 203.2 (29.6) (14.6)
Jun-19 Dec-18 Total Jun-18 Dec-17 Total
Earnings per ordinary share (cents) cents cents cents cents cents cents
Basic 35.4 41.7 77.1 41.8 48.1 89.9
Diluted 32.1 37.6 69.7 37.6 43.7 81.2
Franked dividends per share 35.0 35.0 70.0 35.0 35.0 70.0
Financial performance ratios % % % % % %
Net interest margin before revenue share arrangements 2.37% 2.35% 2.36% 2.37% 2.36% 2.36%
1.97% 1.95% 1.96% 1.98% 1.98% 1.98%
Financial position ratios % % % % % %
Return on average ordinary equity (after tax) 6.34% 7.34% 6.84% 7.50% 8.57% 8.03%
Return on average tangible equity (after tax) 9.00% 10.46% 9.73% 10.45% 12.05% 11.24%
Return on average assets 0.51% 0.59% 0.55% 0.59% 0.67% 0.63%
Statutory EPS (cents) Net interest margin before
revenue share arrangements (%)
Net interest margin after revenue share arrangements (2)
Full year ending Half year ending
(11.5)
-
Change Change
Profit after income tax expense
(12.8)
cps
Half year Half year
Year on year change
(151)
(8)
bps change
(119)
bps change
-
48.1
41.8 41.7
35.4
31 December
2017
30 June 2018 31 December
2018
30 June 2019
2.36% 2.37%
2.35%
2.37%
31 December
2017
30 June 2018 31 December
2018
30 June 2019
Appendix 4E: Full year results
Year ended 30 June 2019 5
₵
₵ ₵
₵
For
per
sona
l use
onl
y

2.1 Financial summary (continued)
2.1.2 Cash earnings results
Jun-19 Jun-18 Jun-19 Dec-18
$m $m $m % $m $m $m %
Net interest income 1,304.2 1,323.6 (19.4) (1.5) 647.7 656.5 (8.8) (1.3)
Other operating income 295.3 281.2 14.1 5.0 148.7 146.6 2.1 1.4
Total income 1,599.5 1,604.8 (5.3) (0.3) 796.4 803.1 (6.7) (0.8)
Credit expenses (50.3) (70.6) 20.3 28.8 (24.8) (25.5) 0.7 2.7
Operating expenses (954.5) (900.9) (53.6) (5.9) (490.3) (464.2) (26.1) (5.6)
Total expenses (1,004.8) (971.5) (33.3) (3.4) (515.1) (489.7) (25.4) (5.2)
Income tax expense (188.9) (199.5) 10.6 5.3 (90.3) (98.6) 8.3 8.4
405.8 433.8 (28.0) (6.5) 191.0 214.8 (23.8) (11.1)
Net Homesafe realised income (after tax) 9.9 11.3 (1.4) (12.4) 4.9 5.0 (0.1) (2.0)
415.7 445.1 (29.4) (6.6) 195.9 219.8 (23.9) (10.9)
Jun-19 Dec-18 Total Jun-18 Dec-17 Total
Earnings per ordinary share (cents) cents cents cents cents cents cents
Cash 40.0 45.1 85.0 45.3 46.8 92.1
Financial performance ratios (cash) % % % % % %
Cost to income ratio 61.0% 57.3% 59.2% 57.0% 54.2% 55.6%
Adjusted cost to income ratio 1
57.8% 57.0% 57.4% 56.8% 54.0% 55.4%
Financial position ratios (cash) % % % % % %
Return on average ordinary equity 7.15% 7.94% 7.55% 8.13% 8.33% 8.23%
Return on average tangible equity 10.15% 11.32% 10.73% 11.33% 11.71% 11.52%
Return on average assets 0.58% 0.63% 0.61% 0.64% 0.65% 0.65%
Cash ROE and ROTE (%) Adjusted cost to income ratio (%) 1
1 This ratio has been adjusted to exclude the impact of remediation costs before tax (June 19 FY: $16.7m, June 18 FY: $0.5m, June 19 HY: $16.3m,
December 18 HY: $0.4m, June 18 HY: $0.5m, December 17 HY: $nil) and redundancy costs before tax (June 19 FY: $11.9m, June 18 FY: $2.3m,
June 19 HY: $9.7m, December 18 HY $2.2m, June 18 HY: $0.4m, December 17 HY: $1.8m).
Half year Half year
Year on year change
Cash earnings after income tax expense
Full year ending Half year ending
Change Change
Cash earnings before Homesafe realised income
(4)
(68)
(79)
bps
cps
360
bps
(7.1)
200
8.33% 8.13% 7.94%7.15%
11.71%11.33% 11.32%
10.15%
31 December 2017 30 June 2018 31 December 2018 30 June 2019
Cash ROE Cash ROTE
54.0%
56.8%
57.0%
57.8%
31 December
2017
30 June 2018 31 December
2018
30 June 2019
Appendix 4E: Full year results
Year ended 30 June 2019 6
For
per
sona
l use
onl
y

2.1 Financial summary (continued)
2.1.3 Cash earnings reconciliation
For the year ended 30 June 2019
Statutory
profit
Fair
value
Homesafe
unrealised
Hedging
revaluat-
ion
Loss on
sale of
business
Integrat-
ion costs
Impair-
ment
charge
Operating
expenses 1
Amortisat-
ion of
acquired
intangibles
Cash
earnings
sub-total 2
Homesafe
realised
income
Cash
earnings
$m $m $m $m $m $m $m $m $m $m $m $m
Net interest income 1,285.8 0.4 18.0 - - - - - - 1,304.2 (7.3) 1,296.9
Other income 281.7 - 24.1 (10.5) - - - - - 295.3 21.4 316.7
Total income 1,567.5 0.4 42.1 (10.5) - - - - - 1,599.5 14.1 1,613.6
Credit expenses (50.3) - - - - - - - - (50.3) - (50.3)
Operating expenses (965.2) - - - 3.7 0.7 0.7 1.9 3.7 (954.5) - (954.5)
Net profit before tax 552.0 0.4 42.1 (10.5) 3.7 0.7 0.7 1.9 3.7 594.7 14.1 608.8
Tax expense (175.2) (0.1) (12.6) 3.1 (2.1) (0.2) (0.2) (0.5) (1.1) (188.9) (4.2) (193.1)
376.8 0.3 29.5 (7.4) 1.6 0.5 0.5 1.4 2.6 405.8 9.9 415.7
1 Includes legal and compensation costs.
For the year ended 30 June 2018
Statutory
profit
Fair
value
Homesafe
unrealised
Hedging
revaluat-
ion
Loss on
sale of
business
Integrat-
ion costs
Impair-
ment
charge
Operating
expenses 1
Amortisat-
ion of
acquired
intangibles
Cash
earnings
sub-total 2
Homesafe
realised
income
Cash
earnings
$m $m $m $m $m $m $m $m $m $m $m $m
Net interest income 1,305.2 1.2 17.2 - - - - - - 1,323.6 (7.5) 1,316.1
Other income 338.3 - (55.4) (1.7) - - - - - 281.2 23.7 304.9
Total income 1,643.5 1.2 (38.2) (1.7) - - - - - 1,604.8 16.2 1,621.0
Credit expenses (70.6) - - - - - - - - (70.6) - (70.6)
Operating expenses (938.4) - - - 1.6 7.6 0.4 19.7 8.2 (900.9) - (900.9)
Net profit before tax 634.5 1.2 (38.2) (1.7) 1.6 7.6 0.4 19.7 8.2 633.3 16.2 649.5
Tax expense (200.0) (0.4) 11.4 0.5 (0.4) (2.3) - (5.9) (2.4) (199.5) (4.9) (204.4)
434.5 0.8 (26.8) (1.2) 1.2 5.3 0.4 13.8 5.8 433.8 11.3 445.1
1 Includes legal, litigation and Wheeler's 'fee for no service' compensation costs.
2 Cash earnings sub-total is equal to cash earnings before Homesafe realised income.
Statutory profit and cash profit ($m)
Cash earnings adjustments
Net profit after tax
Cash earnings adjustments
Net profit after tax
$231.7
$202.8 $203.2
$173.6
$225.3 $219.8 $219.8
$195.9
31 December 2017 30 June 2018 31 December 2018 30 June 2019
Statutory profit after tax Cash profit after tax
Appendix 4E: Full year results
Year ended 30 June 2019 7
For
per
sona
l use
onl
y
2.1 Financial summary (continued)
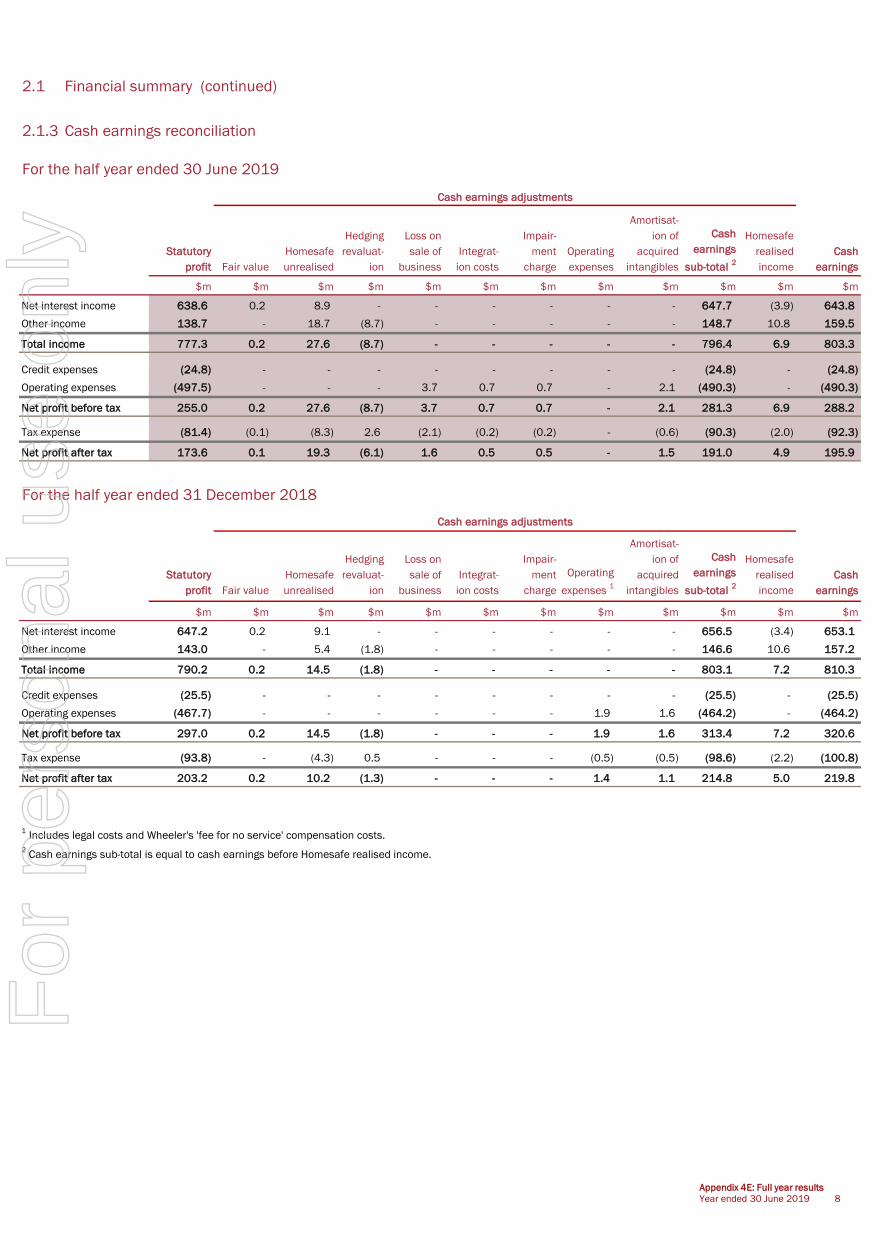
2.1.3 Cash earnings reconciliation
For the half year ended 30 June 2019
Statutory
profit Fair value
Homesafe
unrealised
Hedging
revaluat-
ion
Loss on
sale of
business
Integrat-
ion costs
Impair-
ment
charge
Operating
expenses
Amortisat-
ion of
acquired
intangibles
Cash
earnings
sub-total 2
Homesafe
realised
income
Cash
earnings
$m $m $m $m $m $m $m $m $m $m $m $m
Net interest income 638.6 0.2 8.9 - - - - - - 647.7 (3.9) 643.8
Other income 138.7 - 18.7 (8.7) - - - - - 148.7 10.8 159.5
Total income 777.3 0.2 27.6 (8.7) - - - - - 796.4 6.9 803.3
Credit expenses (24.8) - - - - - - - - (24.8) - (24.8)
Operating expenses (497.5) - - - 3.7 0.7 0.7 - 2.1 (490.3) - (490.3)
Net profit before tax 255.0 0.2 27.6 (8.7) 3.7 0.7 0.7 - 2.1 281.3 6.9 288.2
Tax expense (81.4) (0.1) (8.3) 2.6 (2.1) (0.2) (0.2) - (0.6) (90.3) (2.0) (92.3)
173.6 0.1 19.3 (6.1) 1.6 0.5 0.5 - 1.5 191.0 4.9 195.9
For the half year ended 31 December 2018
Statutory
profit Fair value
Homesafe
unrealised
Hedging
revaluat-
ion
Loss on
sale of
business
Integrat-
ion costs
Impair-
ment
charge
Operating
expenses 1
Amortisat-
ion of
acquired
intangibles
Cash
earnings
sub-total 2
Homesafe
realised
income
Cash
earnings
$m $m $m $m $m $m $m $m $m $m $m $m
Net interest income 647.2 0.2 9.1 - - - - - - 656.5 (3.4) 653.1
Other income 143.0 - 5.4 (1.8) - - - - - 146.6 10.6 157.2
Total income 790.2 0.2 14.5 (1.8) - - - - - 803.1 7.2 810.3
Credit expenses (25.5) - - - - - - - - (25.5) - (25.5)
Operating expenses (467.7) - - - - - - 1.9 1.6 (464.2) - (464.2)
Net profit before tax 297.0 0.2 14.5 (1.8) - - - 1.9 1.6 313.4 7.2 320.6
Tax expense (93.8) - (4.3) 0.5 - - - (0.5) (0.5) (98.6) (2.2) (100.8)
203.2 0.2 10.2 (1.3) - - - 1.4 1.1 214.8 5.0 219.8
1 Includes legal costs and Wheeler's 'fee for no service' compensation costs.
2 Cash earnings sub-total is equal to cash earnings before Homesafe realised income.
Cash earnings adjustments
Net profit after tax
Cash earnings adjustments
Net profit after tax
Appendix 4E: Full year results
Year ended 30 June 2019 8
For
per
sona
l use
onl
y
2.2 Results commentary
2.2.1 Specific items
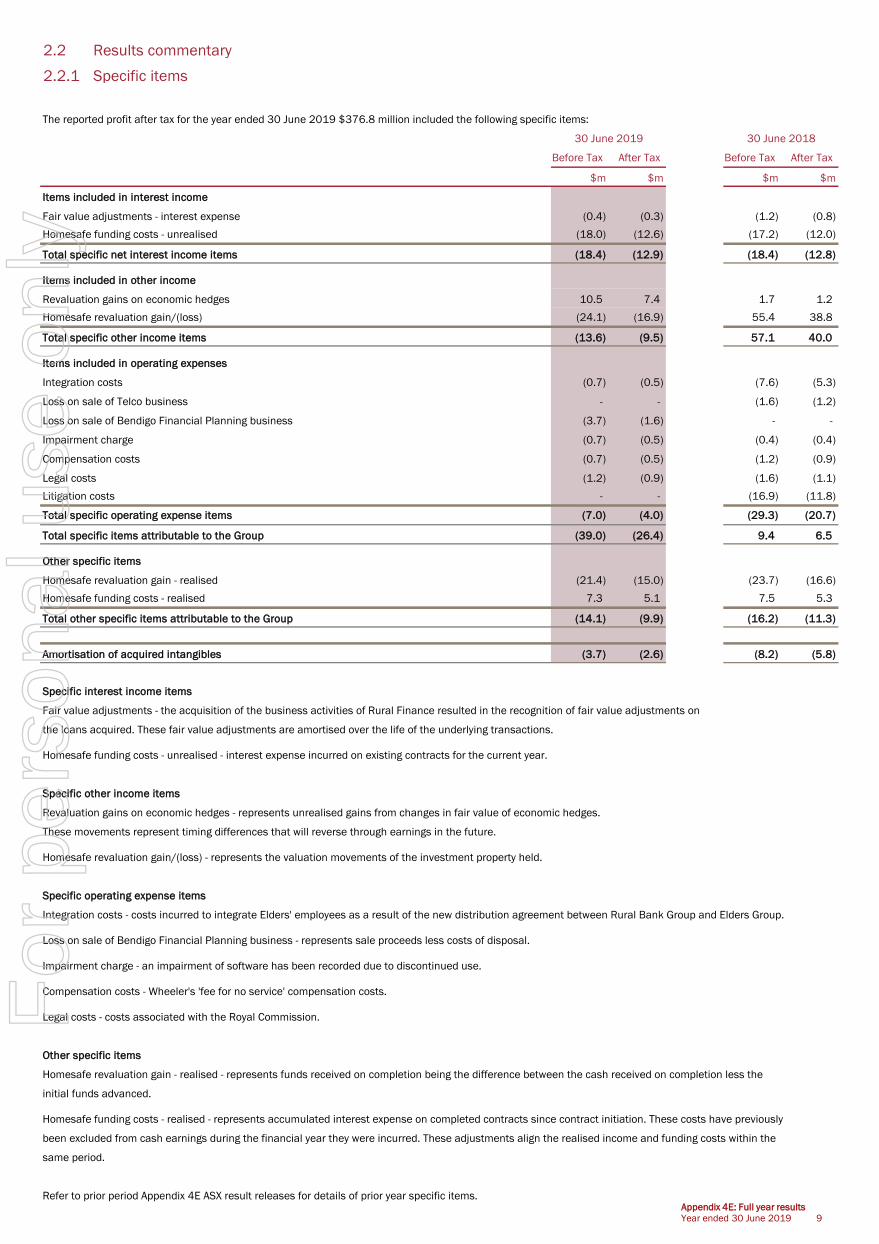
The reported profit after tax for the year ended 30 June 2019 $376.8 million included the following specific items:
Before Tax After Tax Before Tax After Tax
$m $m $m $m
Items included in interest income
Fair value adjustments - interest expense (0.4) (0.3) (1.2) (0.8)
Homesafe funding costs - unrealised (18.0) (12.6) (17.2) (12.0)
Total specific net interest income items (18.4) (12.9) (18.4) (12.8)
Items included in other income
Revaluation gains on economic hedges 10.5 7.4 1.7 1.2
Homesafe revaluation gain/(loss) (24.1) (16.9) 55.4 38.8
Total specific other income items (13.6) (9.5) 57.1 40.0
Items included in operating expenses
Integration costs (0.7) (0.5) (7.6) (5.3)
Loss on sale of Telco business - - (1.6) (1.2)
Loss on sale of Bendigo Financial Planning business (3.7) (1.6) - -
Impairment charge (0.7) (0.5) (0.4) (0.4)
Compensation costs (0.7) (0.5) (1.2) (0.9)
Legal costs (1.2) (0.9) (1.6) (1.1)
Litigation costs - - (16.9) (11.8)
Total specific operating expense items (7.0) (4.0) (29.3) (20.7)
Total specific items attributable to the Group (39.0) (26.4) 9.4 6.5
Other specific items
Homesafe revaluation gain - realised (21.4) (15.0) (23.7) (16.6)
Homesafe funding costs - realised 7.3 5.1 7.5 5.3
Total other specific items attributable to the Group (14.1) (9.9) (16.2) (11.3)
Amortisation of acquired intangibles (3.7) (2.6) (8.2) (5.8)
Specific interest income items
Fair value adjustments - the acquisition of the business activities of Rural Finance resulted in the recognition of fair value adjustments on
the loans acquired. These fair value adjustments are amortised over the life of the underlying transactions.
Homesafe funding costs - unrealised - interest expense incurred on existing contracts for the current year.
Specific other income items
Revaluation gains on economic hedges - represents unrealised gains from changes in fair value of economic hedges.
These movements represent timing differences that will reverse through earnings in the future.
Homesafe revaluation gain/(loss) - represents the valuation movements of the investment property held.
Specific operating expense items
Integration costs - costs incurred to integrate Elders' employees as a result of the new distribution agreement between Rural Bank Group and Elders Group.
Loss on sale of Bendigo Financial Planning business - represents sale proceeds less costs of disposal.
Impairment charge - an impairment of software has been recorded due to discontinued use.
Compensation costs - Wheeler's 'fee for no service' compensation costs.
Legal costs - costs associated with the Royal Commission.
Other specific items
Homesafe revaluation gain - realised - represents funds received on completion being the difference between the cash received on completion less the
initial funds advanced.
Homesafe funding costs - realised - represents accumulated interest expense on completed contracts since contract initiation. These costs have previously
been excluded from cash earnings during the financial year they were incurred. These adjustments align the realised income and funding costs within the
same period.
Refer to prior period Appendix 4E ASX result releases for details of prior year specific items.
30 June 2019 30 June 2018
Appendix 4E: Full year results
Year ended 30 June 2019 9
For
per
sona
l use
onl
y

2.2.2 Net interest margin (before revenue share arrangements)
Asset impact - pricing pressure continued on variable lending portfolios. This was partially offset by reduced hedging expense.
Asset mix - a reduction in average balance of liquid assets through ongoing management of liquid position.
Liability pricing - rate repricing continued on at-call and term deposits as the Group managed its funding requirements, however, this has been
partially offset by the higher cost of wholesale funding in the first half due to increases in BBSW rates.
Liability mix - the continued strong at-call deposit growth has had a positive impact on the total cost of deposit funding.
Asset impact - pricing pressure continued on variable lending portfolios and impact on liquid portfolios due to decreases in BBSW rates. This was
partially offset by reduced hedging expense.
Liability pricing - rate repricing continued on at-call and term deposits as the Group managed its funding requirements, aided by lower costs of
wholesale funding due to the decreases in BBSW rates.
Liability mix - the continued strong at-call deposit growth has had a positive impact on the total cost of deposits funding.
Equity contribution - the contribution to margin from net free liabilities and equity increased marginally.
Cash Net Interest Income 1
Jun-19 Jun-18 Jun-19 Dec-18
$m $m $m $m
Net interest income including specific items 2
1,285.8 1,305.2 638.6 647.2
Adjustments:
Fair value adjustments 3
0.4 1.2 0.2 0.2
Net interest income used in NIM calculation 1,286.2 1,306.4 638.8 647.4
Average interest earning assets 4
65,696.6 66,007.3 65,551.8 65,867.0
Average interest earning liabilities 4
62,068.9 62,326.1 61,908.8 62,281.7
Net interest margin 1.96% 1.98% 1.97% 1.95%
Net interest margin before revenue share arrangement 2.36% 2.36% 2.37% 2.35%
1 Cash net interest income includes Homesafe unrealised funding costs.
2 Refer to section 2.2.3 - Income.
3 Fair value adjustments represent entries created on a business acquisition (Rural Finance).
4 Offset products have been reclassified from deposits and netted against the corresponding loan balance.
(June 19 FY: $2,836.4m, June 18 FY: $2,551.4m); (June 19 HY: $2,937.1m, December 18 HY: $2,739.6m, June 18 HY $2,596.0m).
Half yearFull year
Net interest margin June 2018 to June 2019
Net interest margin December 2018 to June 2019
2.36% 2.36%
0.03 0.01 0.02
0.06
June 2018 Asset impact Asset mix Liability pricing Liability mix June 2019
2.35%2.37%
0.05
0.01 0.01
0.05
December 2018 Asset impact Liability pricing Liability mix Equity contribution June 2019
Appendix 4E: Full year results
Year ended 30 June 2019 10
For
per
sona
l use
onl
y

2.2.3 Income
Jun-19 Jun-18 Jun-19 Dec-18
$m $m $m % $m $m $m %
Net interest income 1,304.2 1,323.6 (19.4) (1.5) 647.7 656.5 (8.8) (1.3)
Homesafe funding costs - unrealised (18.0) (17.2) (0.8) (4.7) (8.9) (9.1) 0.2 2.2
Fair value adjustments - interest expense (0.4) (1.2) 0.8 66.7 (0.2) (0.2) - -
Total net interest income including specific items 1,285.8 1,305.2 (19.4) (1.5) 638.6 647.2 (8.6) (1.3)
Other income
Fee Income 163.8 167.9 (4.1) (2.4) 79.0 84.8 (5.8) (6.8)
Commissions 73.5 71.7 1.8 2.5 36.2 37.3 (1.1) (2.9)
Foreign exchange income 22.4 18.8 3.6 19.1 11.2 11.2 - -
Trading book income 12.2 0.8 11.4 1,425.0 10.7 1.5 9.2 613.3
Other 23.4 22.0 1.4 6.4 11.6 11.8 (0.2) (1.7)
Total other income 295.3 281.2 14.1 5.0 148.7 146.6 2.1 1.4
Specific other income items
Homesafe revaluation (loss)/gain (24.1) 55.4 (79.5) (143.5) (18.7) (5.4) (13.3) (246.3)
Revaluation gains on economic hedges 10.5 1.7 8.8 517.6 8.7 1.8 6.9 383.3
Total other specific income (13.6) 57.1 (70.7) (123.8) (10.0) (3.6) (6.4) (177.8)
Total other income including specific items 281.7 338.3 (56.6) (16.7) 138.7 143.0 (4.3) (3.0)
Total income 1,567.5 1,643.5 (76.0) (4.6) 777.3 790.2 (12.9) (1.6)
Comments on total income when compared to the previous corresponding period:
Net interest income decreased by $19.4m or 1.5%. Refer to 2.2.2 for further analysis.
Fee income decreased by $4.1m or 2.4% primarily due to a reduction in fees charged.
Trading book income increased by $11.4m due to the reduction in interest rates and contraction in the cash/bill spread.
Homesafe revaluation (loss)/gain was $79.5m or 143.5% lower due to continued declines in residential property prices in the markets of Melbourne
and Sydney. Refer to section 2.2.4 for further detail.
Revaluation gains on economic hedges increased by $8.8m. Refer to 2.2.1 for further detail.
Other income ($m)
Change Change
Full year ending Half year ending
167.9
71.7
18.8
0.8
22.0
55.4
1.7
163.8
73.5
22.4
12.2
23.4
(24.1)
10.5
Fee income Commissions Foreign exchange
income
Trading book
income
Other income Homesafe
revaluation
gain/(loss)
Revaluation gains
on economic
hedges
30 June 2018 30 June 2019
Appendix 4E: Full year results
Year ended 30 June 2019 11
For
per
sona
l use
onl
y

2.2.4 Homesafe Trust
Full Year Full Year
Jun-19 Jun-19 Dec-18 Jun-18 Jun-18 Dec-17
Homesafe Income $m $m $m $m $m $m
Discount unwind 22.4 11.2 11.2 20.5 10.1 10.4
Profit/(loss) on sale 0.5 0.7 (0.2) 2.3 1.3 1.0
Property revaluations (47.0) (30.6) (16.4) 32.6 4.4 28.2
Total income/(loss) (24.1) (18.7) (5.4) 55.4 15.8 39.6
Homesafe income - This includes the unwind of the discount and property revaluation movements.
Profit/(loss) on sale represents the difference between cash received on completion versus the carrying value at the time of completion.
Full Year Full Year
Jun-19 Jun-19 Dec-18 Jun-18 Jun-18 Dec-17
$m $m $m $m $m $m
Homesafe realised income 21.4 10.8 10.6 23.7 10.2 13.5
Realised income - The difference between cash received on completion and the initial funds advanced.
Full Year Full Year
Jun-19 Jun-19 Dec-18 Jun-18 Jun-18 Dec-17
Funding Costs $m $m $m $m $m $m
Funding costs - unrealised (18.0) (8.9) (9.1) (17.2) (7.6) (9.6)
Funding costs - realised (7.3) (3.9) (3.4) (7.5) (3.0) (4.5)
Funding costs realised - Accumulated interest expense on completed contracts since initial funding.
Funding costs unrealised - Interest expense on existing contracts.
As at As at As at As at
Jun-19 Dec-18 Jun-18 Dec-17
Portfolio balance $m $m $m $m
Funded balance 452.3 433.3 408.1 387.4
Property revaluation balance 282.2 311.9 327.6 322.4
Total investment portfolio balance 734.5 745.2 735.7 709.8
Total realised gains and realised funding costs ($m)
Half Year Half Year
Half Year Half Year
Half Year Half Year
13.5
10.210.6 10.8
4.5
3.0 3.4 3.9
31 December 2017 30 June 2018 31 December 2018 30 June 2019
Total realised gains Total realised funding costs
Appendix 4E: Full year results
Year ended 30 June 2019 12
For
per
sona
l use
onl
y

2.2.5 Operating expenses
Jun-19 Jun-18 Jun-19 Dec-18
$m $m $m % $m $m $m %
Staff and related costs 518.5 497.3 (21.2) (4.3) 262.9 255.6 (7.3) (2.9)
Occupancy costs 91.3 91.0 (0.3) (0.3) 45.4 45.9 0.5 1.1
Information technology costs 74.9 70.2 (4.7) (6.7) 39.2 35.7 (3.5) (9.8)
Amortisation of acquired intangibles 3.7 8.2 4.5 54.9 2.1 1.6 (0.5) (31.3)
Amortisation of software intangibles 33.8 28.0 (5.8) (20.7) 17.8 16.0 (1.8) (11.3)
Property, plant and equipment costs 10.6 11.5 0.9 7.8 5.0 5.6 0.6 10.7
Fees and commissions 31.1 35.2 4.1 11.6 13.8 17.3 3.5 20.2
Communications, postage and stationery 37.2 36.4 (0.8) (2.2) 18.0 19.2 1.2 6.3
Advertising and promotion 29.5 28.0 (1.5) (5.4) 15.7 13.8 (1.9) (13.8)
Other product and services delivery costs 31.0 30.2 (0.8) (2.6) 14.8 16.2 1.4 8.6
Other administration expenses 96.6 73.1 (23.5) (32.1) 57.7 38.9 (18.8) (48.3)
958.2 909.1 (49.1) (5.4) 492.4 465.8 (26.6) (5.7)
Specific items 7.0 29.3 22.3 76.1 5.1 1.9 (3.2) (168.4)
Total expenses 965.2 938.4 (26.8) (2.9) 497.5 467.7 (29.8) (6.4)
Jun-19 Jun-18 % Jun-19 Dec-18 %
Cost to income 1
59.2% 55.6% 3.6 6.5 61.0% 57.3% 3.7 6.5
Adjusted cost to income 2
57.4% 55.4% 2.0 3.6 57.8% 57.0% 0.8 1.4
Expenses to average assets 1.39% 1.31% 0.08 6.1 1.44% 1.34% 0.10 7.5
Number of staff (full-time equivalent) 4,540 4,426 114 2.6 4,540 4,420 120 2.7
Staff and related costs to income 3
31.4% 30.5% 0.9 3.0 31.5% 31.3% 0.2 0.6
1 Expenses used in the above ratios are expenses less specific expense items and acquired intangibles amortisation.
Income used in the above ratios is income less specific net interest income items and other specific income items.
2 This ratio has been adjusted to exclude the impact of remediation costs before tax (June 19 FY: $16.7m, June 18 FY: $0.5m, June 19 HY: $16.3m,
December 18 HY: $0.4m) and redundancy costs before tax (June 19 FY: $11.9m, June 18 FY: $2.3m, June 19 HY: $9.7m, December 18 HY: $2.2m).
3 Excludes redundancy costs.
Comments on individual expense categories when compared to the previous corresponding period are:
Staff and related costs - increased by $21.2m or 4.3% which includes redundancy costs of $11.9m (June 18: $2.3m), additional costs relating to the
Elders Agri-finance staff intergrated into the Rural Bank Group, and wage and salary increases.
Information technology costs - increased by $4.7m or 6.7% due to an increase in software licence fees.
Amortisation of acquired intangibles decreased by $4.5m or 54.9% due to the completion of amortisation for prior business acquisition intangible assets.
Software amortisation - increased by $5.8m or 20.7% due to the commencement of the amortisation of several large technology projects.
Other administration expenses - increased by $23.5m or 32.1% mainly due to remediation costs of $16.7m (June 18: $0.5m) and insurance premiums
of $6.1m (June 18: $3.8m).
Specific items - other expenses - decreased by $22.3m or 76.1%. Refer to 2.2.1 for further detail.
Operating expenses ($m)
Change Change
Total operating expenses
Full year ending Half year ending
Change Change
497.3
91.0 70.2
35.2 11.5
36.2
167.7
29.3
518.5
91.3 74.9
31.1 10.6
37.5
194.3
7.0
Staff and related
costs
Occupancy costs Information
technology costs
Fees and
commissions
Property, plant
and equipment
costs
Intangibles
amortisation
Other operating
expenses
Other specific
expenses
30 June 2018 30 June 2019
Appendix 4E: Full year results
Year ended 30 June 2019 13
For
per
sona
l use
onl
y
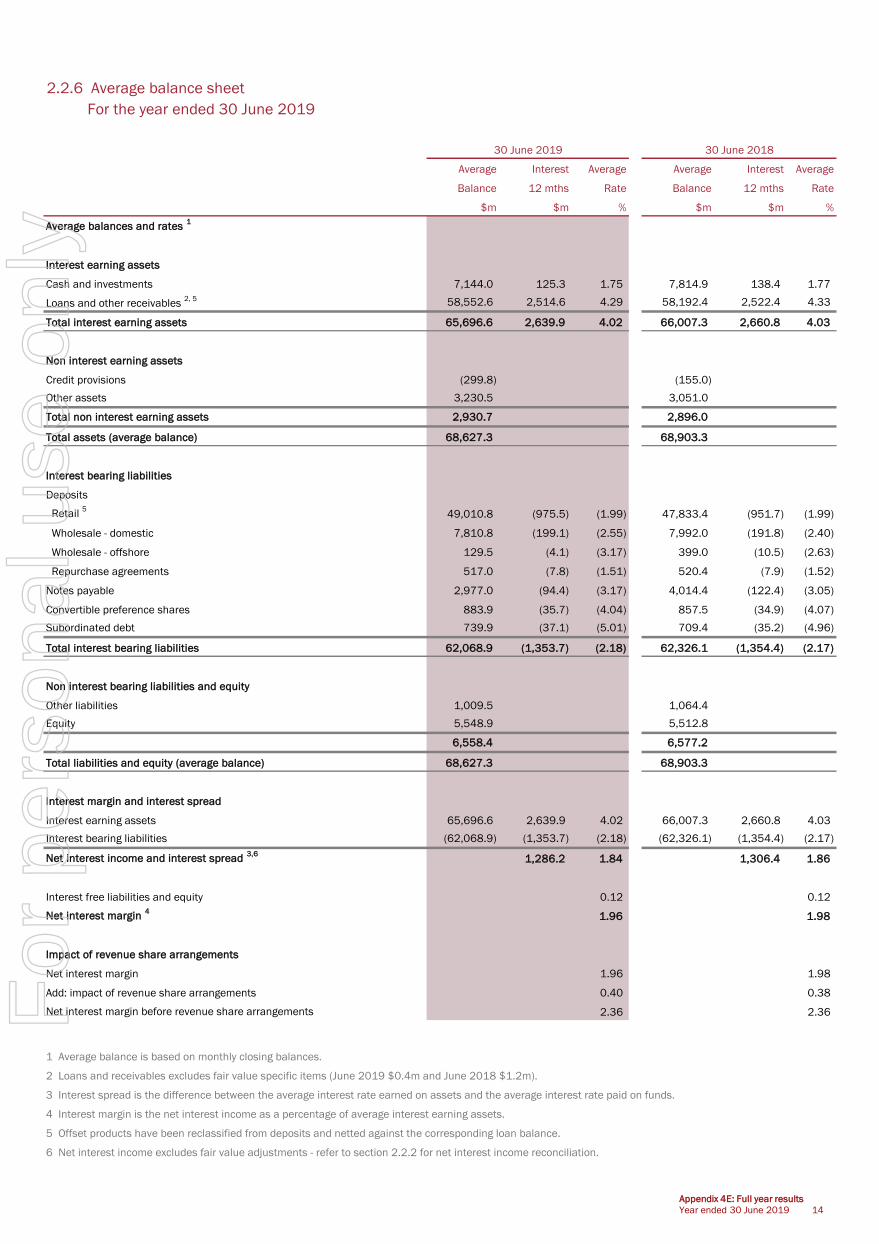
2.2.6 Average balance sheet
For the year ended 30 June 2019
Average Interest Average Average Interest Average
Balance 12 mths Rate Balance 12 mths Rate
$m $m % $m $m %
Average balances and rates 1
Interest earning assets
Cash and investments 7,144.0 125.3 1.75 7,814.9 138.4 1.77
Loans and other receivables 2, 5 58,552.6 2,514.6 4.29 58,192.4 2,522.4 4.33
Total interest earning assets 65,696.6 2,639.9 4.02 66,007.3 2,660.8 4.03
Non interest earning assets
Credit provisions (299.8) (155.0)
Other assets 3,230.5 3,051.0
Total non interest earning assets 2,930.7 2,896.0
Total assets (average balance) 68,627.3 68,903.3
Interest bearing liabilities
Deposits
Retail 5
49,010.8 (975.5) (1.99) 47,833.4 (951.7) (1.99)
Wholesale - domestic 7,810.8 (199.1) (2.55) 7,992.0 (191.8) (2.40)
Wholesale - offshore 129.5 (4.1) (3.17) 399.0 (10.5) (2.63)
Repurchase agreements 517.0 (7.8) (1.51) 520.4 (7.9) (1.52)
Notes payable 2,977.0 (94.4) (3.17) 4,014.4 (122.4) (3.05)
Convertible preference shares 883.9 (35.7) (4.04) 857.5 (34.9) (4.07)
Subordinated debt 739.9 (37.1) (5.01) 709.4 (35.2) (4.96)
Total interest bearing liabilities 62,068.9 (1,353.7) (2.18) 62,326.1 (1,354.4) (2.17)
Non interest bearing liabilities and equity
Other liabilities 1,009.5 1,064.4
Equity 5,548.9 5,512.8
6,558.4 6,577.2
Total liabilities and equity (average balance) 68,627.3 68,903.3
Interest margin and interest spread
Interest earning assets 65,696.6 2,639.9 4.02 66,007.3 2,660.8 4.03
Interest bearing liabilities (62,068.9) (1,353.7) (2.18) (62,326.1) (1,354.4) (2.17)
Net interest income and interest spread 3,6
1,286.2 1.84 1,306.4 1.86
Interest free liabilities and equity 0.12 0.12
Net interest margin 4
1.96 1.98
Net interest margin 1.96 1.98
Add: impact of revenue share arrangements 0.40 0.38
Net interest margin before revenue share arrangements 2.36 2.36
1 Average balance is based on monthly closing balances.
2 Loans and receivables excludes fair value specific items (June 2019 $0.4m and June 2018 $1.2m).
3 Interest spread is the difference between the average interest rate earned on assets and the average interest rate paid on funds.
4 Interest margin is the net interest income as a percentage of average interest earning assets.
5 Offset products have been reclassified from deposits and netted against the corresponding loan balance.
6 Net interest income excludes fair value adjustments - refer to section 2.2.2 for net interest income reconciliation.
30 June 2019 30 June 2018
Impact of revenue share arrangements
Appendix 4E: Full year results
Year ended 30 June 2019 14
For
per
sona
l use
onl
y

2.2.6 Average balance sheet
For the half year ended 30 June 2019
Average Interest Average Average Interest Average
Balance 6 mths Rate Balance 6 mths Rate
$m $m % $m $m %
Average balances and rates 1
Interest earning assets
Cash and investments 7,181.7 60.4 1.69 7,183.1 64.9 1.79
Loans and other receivables 2, 5 58,370.1 1,237.8 4.28 58,683.9 1,276.8 4.32
Total interest earning assets 65,551.8 1,298.2 3.99 65,867.0 1,341.7 4.04
Non interest earning assets
Credit provisions (298.9) (301.8)
Other assets 3,251.1 3,213.1
Total non interest earning assets 2,952.2 2,911.3
Total assets (average balance) 68,504.0 68,778.3
Interest bearing liabilities
Deposits
Retail 5
49,180.3 (480.0) (1.97) 48,894.3 (495.5) (2.01)
Wholesale - domestic 7,778.0 (96.7) (2.51) 7,833.0 (102.4) (2.59)
Wholesale - offshore 76.6 (1.2) (3.16) 190.0 (2.9) (3.03)
Repurchase agreements 514.6 (3.9) (1.53) 519.6 (3.9) (1.49)
Notes payable 2,747.3 (42.3) (3.10) 3,174.1 (52.1) (3.26)
Convertible Preference Shares 885.5 (17.6) (4.01) 882.5 (18.1) (4.07)
Subordinated debt 726.5 (17.7) (4.91) 788.2 (19.4) (4.88)
Total interest bearing liabilities 61,908.8 (659.4) (2.15) 62,281.7 (694.3) (2.21)
Non interest bearing liabilities and equity
Other liabilities 1,019.7 969.0
Equity 5,575.5 5,527.6
6,595.2 6,496.6
Total liabilities and equity (average balance) 68,504.0 68,778.3
Interest margin and interest spread
Interest earning assets 65,551.8 1,298.2 3.99 65,867.0 1,341.7 4.04
Interest bearing liabilities (61,908.8) (659.4) (2.15) (62,281.7) (694.3) (2.21)
Net interest income and interest spread 3,6
638.8 1.84 647.4 1.83
Interest free liabilities and equity 0.13 0.12
Net interest margin 4
1.97 1.95
Net interest margin 1.97 1.95
Add: impact of revenue share arrangements 0.40 0.40
Net interest margin before revenue share arrangements 2.37 2.35
1 Average balance is based on monthly closing balances.
2 Loans and receivables excludes fair value specific items (June 2019 $0.2m and December 2018 $0.2m).
3 Interest spread is the difference between the average interest rate earned on assets and the average interest rate paid on funds.
4 Interest margin is the net interest income as a percentage of average interest earning assets.
5 Offset products have been reclassified from deposits and netted against the corresponding loan balance.
6 Net interest income excludes fair value adjustments - refer to section 2.2.2 for net interest income reconciliation.
30 June 2019 31 December 2018
Appendix 4E: Full year results
Year ended 30 June 2019 15
For
per
sona
l use
onl
y

2.2.6 Average balance sheet
For the half year ended 30 June 2018
Average Interest Average Average Interest Average
Balance 6 mths Rate Balance 6 mths Rate
$m $m % $m $m %
Average balances and rates 1
Interest earning assets
Cash and Investments 7,622.2 67.9 1.80 8,011.4 70.5 1.75
Loans and other receivables 2, 5 58,246.4 1,248.8 4.32 58,098.5 1,273.6 4.35
Total interest earning assets 65,868.6 1,316.7 4.03 66,109.9 1,344.1 4.03
Non interest earning assets
Credit provisions (164.7) (146.8)
Other assets 3,054.0 3,053.7
Total non interest earning assets 2,889.3 2,906.9
Total assets (average balance) 68,757.9 69,016.8
Interest bearing liabilities and equity
Deposits
Retail 5
47,649.2 (464.4) (1.97) 48,002.5 (487.3) (2.01)
Wholesale - domestic 8,237.2 (101.3) (2.48) 7,720.0 (90.5) (2.33)
Wholesale - offshore 339.7 (4.7) (2.79) 456.9 (5.8) (2.52)
Repurchase agreements 521.0 (4.0) (1.55) 519.9 (3.9) (1.49)
Notes payable 3,814.0 (59.2) (3.13) 4,236.9 (63.2) (2.96)
Convertible Preference Shares 880.0 (17.4) (3.99) 838.1 (17.5) (4.14)
Subordinated debt 709.5 (17.7) (5.03) 709.3 (17.5) (4.89)
Total interest bearing liabilities 62,150.6 (668.7) (2.17) 62,483.6 (685.7) (2.18)
Non interest bearing liabilities and equity
Other liabilities 1,043.0 1,065.6
Equity 5,564.3 5,467.6
6,607.3 6,533.2
Total liabilities and equity (average balance) 68,757.9 69,016.8
Interest margin and interest spread
Interest earning assets 65,868.6 1,316.7 4.03 66,109.9 1,344.1 4.03
Interest bearing liabilities (62,150.6) (668.7) (2.17) (62,483.6) (685.7) (2.18)
Net interest income and interest spread 3,6
648.0 1.86 658.4 1.85
Interest free liabilities and equity 0.12 0.13
Net interest margin 4
1.98 1.98
Net interest margin 1.98 1.98
Add: impact of revenue share arrangements 0.39 0.38
Net interest margin before revenue share arrangements 2.37 2.36
1 Average balance is based on monthly closing balances.
2 Loans and receivables excludes fair value specific items (June 2018 $0.5m and December 2017 $0.7m).
3 Interest spread is the difference between the average interest rate earned on assets and the average interest rate paid on funds.
4 Interest margin is the net interest income as a percentage of average interest earning assets.
5 Offset products have been reclassified from deposits and netted against the corresponding loan balance.
6 Net interest income excludes fair value adjustments - refer to section 2.2.2 for net interest income reconciliation.
30 June 2018 31 December 2017
Year ended 30 June 2019 15
Appendix 4E: Full year results
Year ended 30 June 2019 16
For
per
sona
l use
onl
y

2.2.7 Segment results
Segment reporting
An operating segment is a component of the Group that engages in business activities from which it earns revenues and incurs expenses.
Segment reporting reflects the information that is used by the Managing Director for the purposes of resource allocation and performance assessment,
hence it is consistent with the internal reporting provided to the Managing Director and the Executive Team.
Following the announcement and implementation of the organisational restructure effective from 10 August 2018, the Group's reportable segments have
been amended. The Group now has the following reportable segments: Consumer, Business and Agribusiness. Segment comparatives reflect any
organisational changes that have occurred since the prior reporting period.
Consumer
Consumer focuses on engaging with and servicing consumer customers and includes the branch network (including Community Banks and Alliance Banks),
mobile relationship managers, third party banking channels, wealth services, Homesafe, call centres, and consumer support functions such as the
processing centres.
Business
Business focuses on servicing business customers and includes Business Banking, Portfolio Funding, Delphi Bank, Community Sector Banking and
Great Southern.
Agribusiness
Agribusiness includes all banking services provided to agribusiness, rural and regional Australian communities through Rural Bank.
Central functions
The 'Corporate' category includes all functions that are not directly related to a reportable operating segment.
Accounting policies and inter-segment transactions
Measurement of segmental assets, liabilities, income and expenses is in accordance with the Group's accounting policies. Segment results are determined
by including all revenue and expenses associated with each business. Transactions between business segments are conducted at arm's length, and are
eliminated on consolidation.
Segment net interest income is recognised based on an internally set funds transfer pricing policy, based on pre-determined market rates of return on the
assets and liabilities of the segment.
Major customers
Revenues from no individual customer amount to greater than 10% of the Group's revenue.
Geographic Information
The allocation of revenue and assets is based on the geographic location of the customer. The Group operates in all Australian states and territories,
providing banking and other financial services.
Consumer Business Agribusiness
Total
operating
segments
Central
functions Total
$m $m $m $m $m $m
Net interest income 798.9 324.0 162.9 1,285.8 - 1,285.8
Other income 198.7 38.7 15.2 252.6 29.1 281.7
997.6 362.7 178.1 1,538.4 29.1 1,567.5
Operating expenses (642.4) (239.6) (82.0) (964.0) (1.2) (965.2)
Credit expenses (19.2) (33.7) 2.6 (50.3) - (50.3)
336.0 89.4 98.7 524.1 27.9 552.0
Tax expense (106.7) (28.4) (31.3) (166.4) (8.8) (175.2)
Segment result (statutory basis) 229.3 61.0 67.4 357.7 19.1 376.8
Cash basis adjustments:
Specific income & expense items 32.1 - 0.8 32.9 (6.5) 26.4
Homesafe net realised income 9.9 - - 9.9 - 9.9
Amortisation of intangibles 0.4 1.8 0.4 2.6 - 2.6
Segment result (cash basis) 271.7 62.8 68.6 403.1 12.6 415.7
For the year ended 30 June 2019
Operating segments
Segment result (before tax)
Total segment income
Appendix 4E: Full year results
Year ended 30 June 2019 17
For
per
sona
l use
onl
y
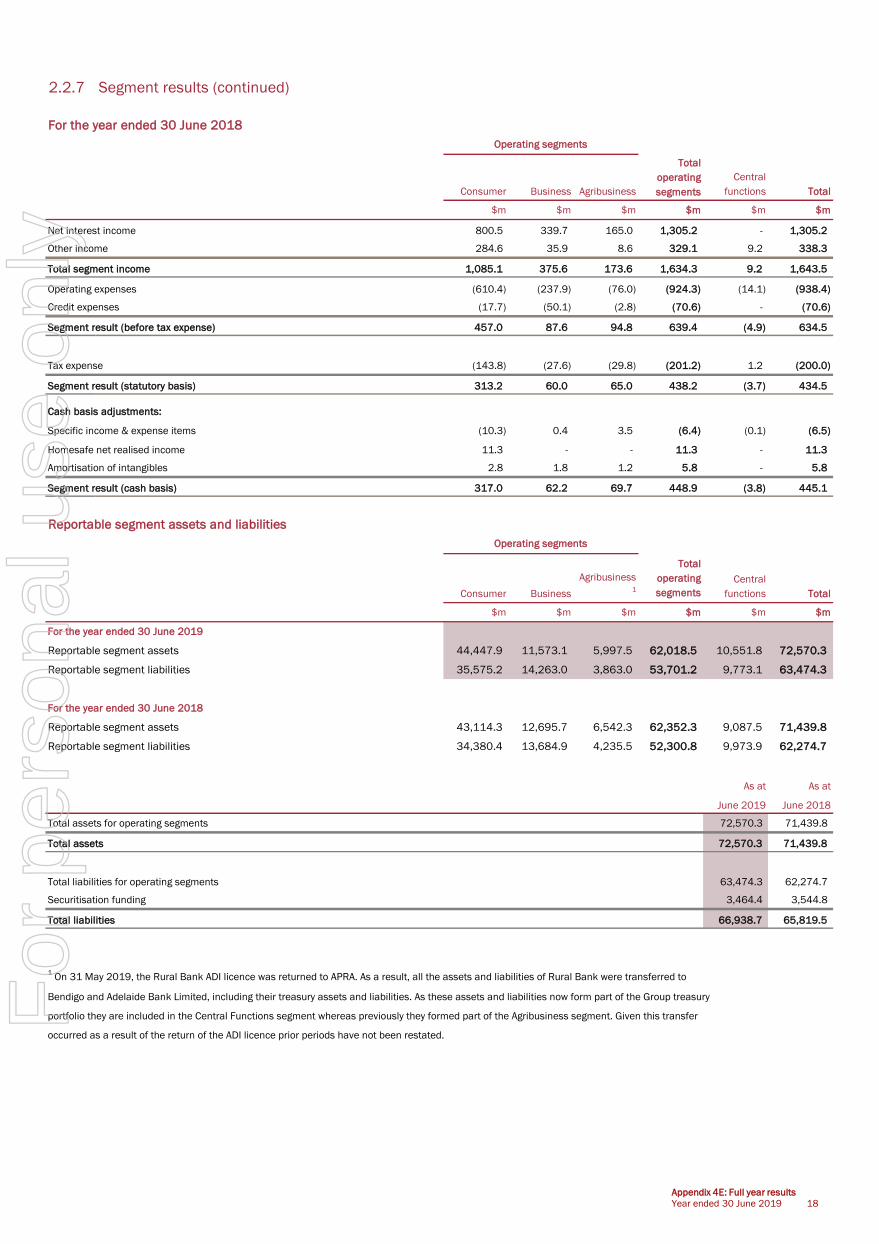
2.2.7 Segment results (continued)
Consumer Business Agribusiness
Total
operating
segments
Central
functions Total
$m $m $m $m $m $m
Net interest income 800.5 339.7 165.0 1,305.2 - 1,305.2
Other income 284.6 35.9 8.6 329.1 9.2 338.3
1,085.1 375.6 173.6 1,634.3 9.2 1,643.5
Operating expenses (610.4) (237.9) (76.0) (924.3) (14.1) (938.4)
Credit expenses (17.7) (50.1) (2.8) (70.6) - (70.6)
Segment result (before tax expense) 457.0 87.6 94.8 639.4 (4.9) 634.5
Tax expense (143.8) (27.6) (29.8) (201.2) 1.2 (200.0)
Segment result (statutory basis) 313.2 60.0 65.0 438.2 (3.7) 434.5
Cash basis adjustments:
Specific income & expense items (10.3) 0.4 3.5 (6.4) (0.1) (6.5)
Homesafe net realised income 11.3 - - 11.3 - 11.3
Amortisation of intangibles 2.8 1.8 1.2 5.8 - 5.8
Segment result (cash basis) 317.0 62.2 69.7 448.9 (3.8) 445.1
Consumer Business
Agribusiness 1
Total
operating
segments
Central
functions Total
$m $m $m $m $m $m
For the year ended 30 June 2019
Reportable segment assets 44,447.9 11,573.1 5,997.5 62,018.5 10,551.8 72,570.3
Reportable segment liabilities 35,575.2 14,263.0 3,863.0 53,701.2 9,773.1 63,474.3
For the year ended 30 June 2018
Reportable segment assets 43,114.3 12,695.7 6,542.3 62,352.3 9,087.5 71,439.8
Reportable segment liabilities 34,380.4 13,684.9 4,235.5 52,300.8 9,973.9 62,274.7
As at As at
June 2019 June 2018
Total assets for operating segments 72,570.3 71,439.8
Total assets 72,570.3 71,439.8
Total liabilities for operating segments 63,474.3 62,274.7
Securitisation funding 3,464.4 3,544.8
Total liabilities 66,938.7 65,819.5
1 On 31 May 2019, the Rural Bank ADI licence was returned to APRA. As a result, all the assets and liabilities of Rural Bank were transferred to
Bendigo and Adelaide Bank Limited, including their treasury assets and liabilities. As these assets and liabilities now form part of the Group treasury
portfolio they are included in the Central Functions segment whereas previously they formed part of the Agribusiness segment. Given this transfer
occurred as a result of the return of the ADI licence prior periods have not been restated.
For the year ended 30 June 2018
Operating segments
Operating segments
Reportable segment assets and liabilities
Total segment income
Year ended 30 June 2019 17
Appendix 4E: Full year results
Year ended 30 June 2019 18
For
per
sona
l use
onl
y

2.3 Financial statements
2.3.1 Balance sheet metrics
Total Total
Jun-19 Dec-18 FY19 Jun-18 Dec-17 FY18
$m $m $m $m $m $m $m %
Financial position metrics
Ordinary equity 5,563.2 5,539.4 5,563.2 5,505.8 5,444.9 5,505.8 57.4 1.0
Retail deposits 52,301.2 52,245.1 52,301.2 50,614.5 50,308.9 50,614.5 1,686.7 3.3
Funds under management 6,748.7 6,013.0 6,748.7 5,833.2 5,630.3 5,833.2 915.5 15.7
Loans under management 63,188.8 62,207.7 63,188.8 62,926.9 61,614.8 62,926.9 261.9 0.4
New loan approvals 7,517.1 7,732.2 15,249.3 8,089.3 8,110.7 16,200.0 (950.7) (5.9)
> Residential 4,973.0 5,590.3 10,563.3 5,437.7 5,881.2 11,318.9 (755.6) (6.7)
> Non-residential 2,544.1 2,141.9 4,686.0 2,651.6 2,229.5 4,881.1 (195.1) (4.0)
Total provisions and reserves for doubtful debts 362.8 379.9 362.8 307.8 306.2 307.8 55.0 17.9
Total Total
Capital management metrics Jun-19 Dec-18 FY19 Jun-18 Dec-17 FY18 bps
Common Equity Tier 1 (%) 8.92% 8.76% 8.92% 8.62% 8.61% 8.62% 30
$m %
Credit risk weighted assets ($m) 33,424.1 33,656.7 33,424.1 34,367.6 33,754.6 34,367.6 (943.5) (2.7)
Total risk weighted assets ($m) 37,483.1 37,539.0 37,483.1 38,256.4 37,689.6 38,256.4 (773.3) (2.0)
Liquidity risk bps
Liquidity coverage ratio (LCR) 1
126.3% 129.8% 128.1% 127.1% 125.3% 126.2% 190
Net stable funding ratio (NSFR) 2,3
112.8% 112.0% 112.4% 110.2%
Impaired assets $m %
Gross impaired assets ($m) 310.9 346.0 310.9 335.8 288.8 335.8 (24.9) (7.4)
Net impaired assets ($m) 183.3 221.3 183.3 217.5 176.3 217.5 (34.2) (15.7)
bps
Net impaired loans to gross loans (%) 0.30% 0.36% 0.30% 0.35% 0.29% 0.35% (5)
1 Represents average daily LCR over respective 6 monthly period.
2 Represents average end of month NSFR over respective 6 month period.
3 Net stable funding ratio calculated from 1st January 2018.
Half year
Half year Half year
Half year
Year on year change
Year on year change
Appendix 4E: Full year results
Year ended 30 June 2019 19
For
per
sona
l use
onl
y

2.3.2 Statement of comprehensive incomeFor the year ended 30 June 2019
Jun-19 Jun-18
$m $m
Profit for the period ended 30 June 376.8 434.5
Items which may be reclassified subsequently to profit or loss:
Net gain on available for sale - equity investments - 0.2
Net unrealised loss on available for sale - debt securities - (0.1)
0.1 -
Restatement due to adoption of new accounting standards 1 0.1 -
Transfer from asset revaluation reserve to income (0.2) -
Net gain on cash flow hedges taken to equity 19.5 10.9
Tax effect on items taken directly to or transferred from equity (5.8) (3.3)
Total items that may be reclassified to profit or loss 13.7 7.7
Items which will not be reclassifed subsequently to profit or loss:
Actuarial (loss)/gain on superannuation defined benefits plan (0.1) 0.4
Tax effect on items taken directly to or transferred from equity - (0.1)
Total items that will not be reclassified to profit or loss (0.1) 0.3
Total comprehensive income for the period 390.4 442.5
2.3.3 Balance sheet
As at 30 June 2019 Jun-19 Jun-18
$m $m
Assets
Cash and cash equivalents ag001 1,072.0 1,137.4
Due from other financial institutions ag002 270.6 283.0
Financial assets fair value through profit or loss (FVTPL) ag004 5,836.9 4,499.5
Financial assets available for sale ag005 - 469.0
Financial assets held to maturity ag006 - 413.2
Financial assets - amortised cost ag052 293.1 -
Financial assets fair value through other comprehensive income (FVOCI) ag053 55.7 -
Derivatives ag010 150.6 29.7
Net loans and other receivables ag012 61,791.8 61,601.8
Investments in joint ventures accounted for using the equity method ag013 9.3 8.9
Property, plant and equipment ag015 63.1 69.9
Deferred tax assets ag016 170.6 117.0
Investment property ag017 734.5 735.7
Goodwill and other intangible assets ag019 1,685.6 1,650.0
Other assets ag008 436.5 424.7
Total Assets 72,570.3 71,439.8
Liabilities
Due to other financial institutions ag020 420.6 352.5
Deposits ag021 60,566.6 59,529.5
Notes payable ag022 3,464.4 3,544.8
Derivatives ag023 135.0 34.8
Income tax payable ag026 6.4 51.5
Provisions ag027 119.6 136.6
Deferred tax liabilities ag028 165.3 130.9
Other payables ag024 493.0 448.8
Preference shares ag030 886.4 880.9
Subordinated debt ag031 681.4 709.2
Total Liabilities 66,938.7 65,819.5
Net Assets 5,631.6 5,620.3
Equity
Share capital ag032 4,570.5 4,523.3
Reserves ag036 73.8 121.1
Retained earnings ag037 987.3 975.9
Total Equity 5,631.6 5,620.3
1 June 2019 results have been prepared in accordance with AASB 9; prior periods have not been restated. Refer to 31 December 2018 financial
statements, Note 3.7.2.2 'Changes in Accounting Policies' for further information.
Revaluation gain on debt instruments at fair value through other comprehensive income
1
1As at As at
As atAs at
Appendix 4E: Full year results
Year ended 30 June 2019 20
For
per
sona
l use
onl
y

2.3.4 Statement of changes in equity
For the year ended 30 June 2019
Issued Other
ordinary issued Retained Total
capital capital earnings Reserves equity
$m $m $m $m $m
Opening balance at 1 July 2018 4,529.9 (6.6) 975.9 121.1 5,620.3
Restated for adoption of new accounting standards 1
- - (11.1) (82.8) (93.9)
Comprehensive income:
Profit for the period - - 376.8 - 376.8
Restatement due to adoption of new accounting standards 1
- - - 0.1 0.1
Other comprehensive income - - (0.1) 13.6 13.5
Total comprehensive income for the period - - 376.7 13.7 390.4
Transactions with owners in their capacity as owners:
Shares issued 46.0 - - - 46.0
Reduction in employee share ownership plan (ESOP) shares - 1.2 - - 1.2
Movement in general reserve for credit losses (GRCL) - - (19.9) 19.9 -
Movement in operational risk reserve - - (0.6) 0.6 -
Movement in share based payment - - 1.0 1.3 2.3
Equity dividends - - (334.7) - (334.7)
Closing balance at 30 June 2019 4,575.9 (5.4) 987.3 73.8 5,631.6
1 June 2019 results have been prepared in accordance with AASB 9; prior periods have not been restated. Refer to 31 December 2018 financial
statements, Note 3.7.2.2 'Changes in Accounting Policies' for further information.
For the year ended 30 June 2018
Issued Other
ordinary issued Retained Total
capital capital earnings Reserves equity
$m $m $m $m $m
Opening balance at 1 July 2017 4,456.7 (8.0) 864.6 112.3 5,425.6
Comprehensive income:
Profit for the period - - 434.5 - 434.5
Other comprehensive income - - 0.3 7.7 8.0
Total comprehensive income for the period - - 434.8 7.7 442.5
Transactions with owners in their capacity as owners:
Shares issued 73.2 - - - 73.2
Transfer from asset revaluation reserve - - 0.4 (0.4) -
Reduction in employee share ownership plan (ESOP) shares - 1.4 - - 1.4
Movement in operational risk reserve - - (1.5) 1.4 (0.1)
Movement in share based payment - - 2.6 0.1 2.7
Equity dividends - - (325.0) - (325.0)
Closing balance at 30 June 2018 4,529.9 (6.6) 975.9 121.1 5,620.3
Attributable to owners of Bendigo and Adelaide Bank Limited
Attributable to owners of Bendigo and Adelaide Bank Limited
Appendix 4E: Full year results
Year ended 30 June 2019 21
For
per
sona
l use
onl
y

2.3.5 Cash flow statement
For the year ended 30 June 2019
Jun-19 Jun-18
$m $m
Cash flows from operating activities
Interest and other items of a similar nature received 2,646.2 2,661.9
Interest and other costs of finance paid (1,361.4) (1,379.9)
Receipts from customers (excluding effective interest) 280.4 284.8
Payments to suppliers and employees (1,000.3) (998.4)
Dividends received 0.9 1.3
Income taxes paid (205.9) (175.2)
Cash flows from operating activities before changes in operating assets and liabilities 359.9 394.5
(Increase)/decrease in operating assets
Net increase in balance of loans and other receivables (337.6) (904.1)
Net (increase)/decrease in balance of investment securities (773.1) 1,039.4
Increase/(decrease) in operating liabilities
Net increase in balance of deposits 1,037.0 235.4
Net decrease in balance of notes payable (80.4) (413.6)
Cash flows from operating activities 205.8 351.6
Cash flows related to investing activities
Cash paid for purchases of property, plant and equipment (12.6) (15.4)
Cash proceeds from sale of property, plant and equipment 0.9 1.3
Cash paid for purchases of investment property (67.0) (59.0)
Cash proceeds from sale of investment property 44.2 45.0
Cash paid for purchases of equity investments (0.3) (0.1)
Proceeds from return of capital/dividend from JV partners 2.0 2.0
Cash paid for purchases of intangible assets (3.7) (2.9)
Net cash flows used in investing activities (36.5) (29.1)
Cash flows from financing activities
Proceeds from issue of ordinary/convertible preference shares - 55.8
Proceeds from issue of subordinated debt 272.3 0.5
Repayment of subordinated debt (300.0) -
Dividends paid (288.6) (251.8)
Repayment received for ESOP shares 1.1 1.4
Payment of share issue costs - (6.5)
Net cash flows from financing activities (315.2) (200.6)
Net (decrease)/increase in cash and cash equivalents (145.9) 121.9
Cash and cash equivalents at the beginning of the period 1,067.9 946.0
Cash and cash equivalents at the end of period 922.0 1,067.9
Appendix 4E: Full year results
Year ended 30 June 2019 22
For
per
sona
l use
onl
y

2.3.6 Lending
Jun-19 Jun-18 Jun-19 Dec-18
$m $m $m % $m $m $m %
Approvals - by security
Residential 10,563.3 11,318.9 (755.6) (6.7) 4,973.0 5,590.3 (617.3) (11.0)
Non-residential 4,686.0 4,881.1 (195.1) (4.0) 2,544.1 2,141.9 402.2 18.8
Total approvals 15,249.3 16,200.0 (950.7) (5.9) 7,517.1 7,732.2 (215.1) (2.8)
As at As at As at As at
Jun-19 Jun-18 Jun-19 Dec-18
$m $m $m % $m $m $m %
Gross loan balance - by security
Residential 45,538.7 44,139.7 1,399.0 3.2 45,538.7 44,690.8 847.9 1.9
Business
Accommodation and food services 341.5 350.5 (9.0) (2.6) 341.5 316.6 24.9 7.9
Administrative and support services 28.1 33.5 (5.4) (16.1) 28.1 29.9 (1.8) (6.0)
Agriculture, forestry and fishing 6,201.8 6,229.3 (27.5) (0.4) 6,201.8 5,964.1 237.7 4.0
Arts and recreation services 66.1 86.8 (20.7) (23.8) 66.1 89.3 (23.2) (26.0)
Construction 787.7 1,123.6 (335.9) (29.9) 787.7 936.1 (148.4) (15.9)
Education and training 59.0 61.4 (2.4) (3.9) 59.0 55.8 3.2 5.7
Electricity, gas, water and waste services 35.0 20.6 14.4 69.9 35.0 36.1 (1.1) (3.0)
Financial and insurance services 640.4 432.6 207.8 48.0 640.4 435.9 204.5 46.9
Health care and social assistance 533.8 531.6 2.2 0.4 533.8 545.2 (11.4) (2.1)
Information media & telecommunications 32.4 33.2 (0.8) (2.4) 32.4 35.2 (2.8) (8.0)
Manufacturing 251.0 273.6 (22.6) (8.3) 251.0 248.0 3.0 1.2
Mining 28.1 17.4 10.7 61.5 28.1 24.3 3.8 15.6
Other Services 201.3 220.4 (19.1) (8.7) 201.3 203.5 (2.2) (1.1)
Professional, scientific & technical services 210.2 238.4 (28.2) (11.8) 210.2 223.8 (13.6) (6.1)
Public administration and safety 47.5 53.0 (5.5) (10.4) 47.5 48.3 (0.8) (1.7)
Rental, hiring and real estate services 3,502.6 3,924.6 (422.0) (10.8) 3,502.6 3,661.4 (158.8) (4.3)
Retail trade 413.0 434.8 (21.8) (5.0) 413.0 412.0 1.0 0.2
Transport, postal and warehousing 148.2 145.6 2.6 1.8 148.2 157.3 (9.1) (5.8)
Wholesale trade 148.5 168.7 (20.2) (12.0) 148.5 156.9 (8.4) (5.4)
Other 103.1 249.2 (146.1) (58.6) 103.1 97.3 5.8 6.0
Total business 13,779.3 14,628.8 (849.5) (5.8) 13,779.3 13,677.0 102.3 0.7
Margin lending 1,528.6 1,694.7 (166.1) (9.8) 1,528.6 1,553.9 (25.3) (1.6)
Unsecured 992.2 1,017.2 (25.0) (2.5) 992.2 960.8 31.4 3.3
Other 271.6 313.1 (41.5) (13.3) 271.6 305.8 (34.2) (11.2)
Total gross loan balance 62,110.4 61,793.5 316.9 0.5 62,110.4 61,188.3 922.1 1.5
Gross loan balance - by purpose
Residential 43,592.9 42,365.9 1,227.0 2.9 43,592.9 42,807.7 785.2 1.8
Consumer 2,342.2 2,559.8 (217.6) (8.5) 2,342.2 2,365.3 (23.1) (1.0)
Margin lending 1,528.6 1,694.7 (166.1) (9.8) 1,528.6 1,553.9 (25.3) (1.6)
Business 14,646.7 15,173.1 (526.4) (3.5) 14,646.7 14,461.4 185.3 1.3
Total gross loan balance 62,110.4 61,793.5 316.9 0.5 62,110.4 61,188.3 922.1 1.5
On-balance sheet 62,110.4 61,793.5 316.9 0.5 62,110.4 61,188.3 922.1 1.5
1,078.4 1,133.4 (55.0) (4.9) 1,078.4 1,019.4 59.0 5.8
63,188.8 62,926.9 261.9 0.4 63,188.8 62,207.7 981.1 1.6
Loans under management represents the gross balance of loans held and managed by the Group categorised as follows:
On-balance sheet loans are the gross balance of loans and factoring receivables held by the consolidated Group.
Off-balance sheet loans under management represents the gross balance of off-balance sheet loans managed by wholly-owned subsidiaries
of Bendigo and Adelaide Bank Limited.
Full year ending Half year ending
Off-balance sheet loans under management
Total Group loans under management
Loans under management (gross balance)
Change Change
Change Change
Appendix 4E: Full year results
Year ended 30 June 2019 23
For
per
sona
l use
onl
y

2.3.7 Asset quality
As at As at As at As at
Jun-19 Jun-18 Jun-19 Dec-18
Impaired loans 1
$m $m $m % $m $m $m %
Full-performing 2
8.3 13.9 (5.6) (40.3) 8.3 14.9 (6.6) (44.3)
Part-performing 3
82.2 56.6 25.6 45.2 82.2 83.9 (1.7) (2.0)
Non-performing 217.1 261.3 (44.2) (16.9) 217.1 243.8 (26.7) (11.0)
Restructured loans 4
3.3 4.0 (0.7) (17.5) 3.3 3.4 (0.1) (2.9)
Total impaired assets 310.9 335.8 (24.9) (7.4) 310.9 346.0 (35.1) (10.1)
Less: specific impairment provisions (127.6) (118.3) (9.3) (7.9) (127.6) (124.7) (2.9) (2.3)
Net impaired assets 183.3 217.5 (34.2) (15.7) 183.3 221.3 (38.0) (17.2)
Portfolio facilities - past due 90 days, not well secured 4.6 4.8 (0.2) (4.2) 4.6 3.7 0.9 24.3
Less: specific impairment provisions (0.9) (1.0) 0.1 10.0 (0.9) (0.7) (0.2) (28.6)
Net portfolio facilities 3.7 3.8 (0.1) (2.6) 3.7 3.0 0.7 23.3
Past due 90 days
404.1 414.0 (9.9) (2.4) 404.1 380.7 23.4 6.1
Great Southern portfolio 34.9 50.5 (15.6) (30.9) 34.9 41.4 (6.5) (15.7)
Ratios % % bps change % % bps change
Total impaired loans to gross loans 0.50% 0.54% (4) 0.50% 0.57% (7)-
Total impaired loans to total assets 0.43% 0.47% (4) 0.43% 0.48% (5)-
Net impaired loans to gross loans 0.30% 0.35% (5) 0.30% 0.36% (6)-
Provision coverage 5
116.7% 91.7% 2,500 116.7% 109.8% 690
1 A facility is classified as impaired regardless of whether it is 90 days or more past due (arrears) when there is doubt as to whether the full
amounts due (interest and principal) will be achieved in a timely manner. This is the case even if the full extent of the loss cannot be
clearly determined.
2 Includes loans where the value of the security has reduced below the value of the outstanding loans but repayments are being
made in accordance with the loan contract.
3 Includes loans where the value of the security has reduced below the value of the outstanding loans but partial repayments are being made
in accordance with the loan contract.
4 Restructured loans are facilities in which the original contractual terms have been modified for reasons related to the financial difficulties of the
5 Provision coverage is calculated as total provisions and reserves for doubtful debts - divided by total impaired assets.
customers.
Change Change
Well secured (excluding commercial arrangement loans)
Appendix 4E: Full year results
Year ended 30 June 2019 24
For
per
sona
l use
onl
y

2.3.8 Credit expenses
Jun-19 Jun-18 Jun-19 Dec-18
Credit expense $m $m $m % $m $m $m %
Bad debts written off 10.0 3.6 (6.4) (177.8) 7.1 2.9 (4.2) (144.8)
Provision doubtful debts - expense 44.6 75.3 30.7 40.8 21.2 23.4 2.2 9.4
Total credit expense 54.6 78.9 24.3 30.8 28.3 26.3 (2.0) (7.6)
Bad debts recovered (4.3) (8.3) (4.0) (48.2) (3.5) (0.8) 2.7 337.5
Credit expenses net of recoveries 50.3 70.6 20.3 28.8 24.8 25.5 0.7 2.7
As at As at As at As at
Jun-19 Jun-18 Jun-19 Dec-18
Provisions and reserves $m $m $m % $m $m $m %
Provision for doubtful debts - specific 128.5 119.3 (9.2) (7.7) 128.5 125.4 (3.1) (2.5)
Provision for doubtful debts - collective 157.0 48.2 (108.8) (225.7) 157.0 181.5 24.5 13.5
General reserve for credit losses 77.3 140.3 63.0 44.9 77.3 73.0 (4.3) (5.9)
Total provisions and reserve for doubtful debts 362.8 307.8 (55.0) (17.9) 362.8 379.9 17.1 4.5
As at As at As at As at
Jun-19 Jun-18 Change Jun-19 Dec-18 Change
Ratios % % bps % % bps
Credit expenses to gross loans 0.08% 0.11% (3) 0.08% 0.08% -
Credit expenses (excluding Great Southern) to gross loans 0.04% 0.10% (6) 0.02% 0.05% (3)
Total provision/reserve for doubtful debts to gross loans 0.58% 0.50% 8 0.58% 0.62% (4)
Collective provision and GRCL to risk-weighted assets 0.63% 0.49% 14 0.63% 0.68% (5)
Collective
provision 1
Collective
provision
12-mth
ECL
Collective
provision
lifetime
ECL not
credit
impaired
Collective
provision
lifetime
ECL credit
impaired
Specific
provision
lifetime
ECL credit
impaired
General
reserve for
credit
losses 1
Total
Movements in provisions and reserves $m $m $m $m $m $m $m
Balance as at 30 June 2018 48.2 - - - 119.3 140.3 307.8
Restated for adoption of new accounting standards 1
(48.2) 33.1 79.0 70.4 - (82.9) 51.4
Transfer from retained earnings - - - - - 19.9 19.9
Transferred to 12-month ECL - 2.9 (2.8) (0.1) - - -
Transferred to lifetime ECL not credit impaired - (29.1) 31.5 (2.4) - - -
Transfer to lifetime ECL credit impaired - collective provision - (9.9) (15.7) 25.6 - - -
Charge to income statement - 21.1 (7.5) (39.1) 70.1 - 44.6
Bad debts written off previously provided for - - - - (60.9) - (60.9)
Total provision for doubtful debts as at 30 June 2019 - 18.1 84.5 54.4 128.5 77.3 362.8
1 June 2019 results have been prepared in accordance with AASB 9; prior periods have not been restated. Refer to 31 December 2018 financial
statements, Note 3.7.2.2 'Changes in Accounting Policies' for further information.
Specific Collective GRCL Total
Movements in provisions and reserves $m $m $m $m
Balance at July 2017 89.5 52.7 140.3 282.5
Provision for doubtful debts expense to profit and loss 79.8 (4.5) - 75.3
Bad debts written off - previously provided for (50.0) - - (50.0)
Balance at 30 June 2018 119.3 48.2 140.3 307.8
Movements in specific and collective provisions are reflected as an expense in the income statement.
Movements in the general reserve for credit losses are reflected as an appropriation in retained earnings.
Change
Full year ending Half year ending
Change Change
Change
Changes due to financial assets recognised in the opening balance that have:
Appendix 4E: Full year results
Year ended 30 June 2019 25
For
per
sona
l use
onl
y

2.3.9 Deposits and funds under management
As at As at As at As at
Jun-19 Jun-18 Jun-19 Dec-18
$m $m $m % $m $m $m %
Deposits and funds under management
Deposits 60,566.6 59,529.5 1,037.1 1.7 60,566.6 60,682.1 (115.5) (0.2)
Securitisation 3,464.4 3,544.8 (80.4) (2.3) 3,464.4 2,748.5 715.9 26.0
Managed funds 6,748.7 5,833.2 915.5 15.7 6,748.7 6,013.0 735.7 12.2
70,779.7 68,907.5 1,872.2 2.7 70,779.7 69,443.6 1,336.1 1.9
Deposits dissection - $m
Retail 52,301.2 50,614.5 1,686.7 3.3 52,301.2 52,245.1 56.1 0.1
Wholesale 8,265.4 8,915.0 (649.6) (7.3) 8,265.4 8,437.0 (171.6) (2.0)
Securitisation 3,464.4 3,544.8 (80.4) (2.3) 3,464.4 2,748.5 715.9 26.0
Total deposits 64,031.0 63,074.3 956.7 1.5 64,031.0 63,430.6 600.4 0.9
Deposits dissection - %
Retail 81.7% 80.2% 81.7% 82.4%
Wholesale 12.9% 14.1% 12.9% 13.3%
Securitisation 5.4% 5.7% 5.4% 4.3%
100.0% 100.0% 100.0% 100.0%
Managed funds dissection
Assets under management 2,536.7 2,200.0 336.7 15.3 2,536.7 2,358.4 178.3 7.6
Other managed funds 4,212.0 3,633.2 578.8 15.9 4,212.0 3,654.6 557.4 15.3
Total managed funds 6,748.7 5,833.2 915.5 15.7 6,748.7 6,013.0 735.7 12.2
Assets under management include those funds deposited in the Sandhurst Trustees Limited Common Funds, which are invested in cash,
cash enhanced and mortgage investments on behalf of investors. These funds are off-balance sheet.
Other managed funds include funds deposited for investment in managed investment products and superannuation funds managed
off-balance sheet by Sandhurst Trustees Limited and Adelaide Managed Funds Limited. Also included are portfolios of loans managed by the
Bank and third parties who contribute to first loss coverage.
Funding mix ($m) Retail deposits and funds under management ($m)
Change Change
Total deposits
Total deposits and funds under management
50,615 52,245 52,301
8,915 8,437 8,265
3,545 2,749 3,464
30 June 2018 31 December 2018 30 June 2019
Retail Wholesale Securitisation
Appendix 4E: Full year results
Year ended 30 June 2019 26
50,615 52,245 52,301
5,833 6,013 6,749
30 June 2018 31 December 2018 30 June 2019
On balance sheet Funds under managementFor
per
sona
l use
onl
y

2.3.10 Capital and shareholder returns
2.3.10.1 Assets and capital
As at As at As at As at
Jun-19 Jun-18 Jun-19 Dec-18
$m $m $m % $m $m $m %
Group assets 72,570.3 71,439.8 1,130.5 1.6 72,570.3 71,685.1 885.2 1.2
Capital adequacy
Total regulatory capital 4,925.0 4,916.0 9.0 0.2 4,925.0 5,193.7 (268.7) (5.2)
Risk-weighted assets 37,483.1 38,256.4 (773.3) (2.0) 37,483.1 37,539.0 (55.9) (0.1)
% % % % % %
Risk-weighted capital adequacy 13.14% 12.85% 0.29% 2.3 13.14% 13.84% (0.70%) (5.1)
- Tier 1 11.31% 10.96% 0.35% 3.2 11.31% 11.15% 0.16% 1.4
- Tier 2 1.83% 1.89% (0.06%) (3.2) 1.83% 2.69% (0.86%) (32.0)
- Common Equity Tier 1 8.92% 8.62% 0.30% 3.5 8.92% 8.76% 0.16% 1.8
2.3.10.2 Capital adequacy
The Australian Prudential Regulation Authority (APRA) guidelines require capital to be allocated against credit, operational and market risk.
Banks must maintain a ratio of qualifying capital (comprising Common Equity Tier 1, Additional Tier 1 and Tier 2 capital), to risk weighted assets.
The Bank adopts the "standard model" approach prescribed by APRA to calculate the Bank's capital position.
Risk weighted capital ratios Jun-19 Dec-18 Jun-18
Tier 1 11.31% 11.15% 10.96%
Tier 2 1.83% 2.69% 1.89%
Total capital ratio 13.14% 13.84% 12.85%
Common Equity Tier 1 8.92% 8.76% 8.62%
Regulatory capital $m $m $m
Common Equity Tier 1
Contributed capital 4,576.0 4,553.0 4,529.9
Retained profits and reserves 735.2 719.8 707.9
Accumulated other comprehensive income (and other reserves) (9.0) (26.0) (23.9)
Less:
Intangible assets, cash flow hedges and capitalised expenses 1,827.1 1,814.4 1,813.2
Net deferred tax assets 91.4 104.9 64.7
Equity exposures 37.5 36.9 36.8
Other adjustments as per APRA advice 1.4 1.2 1.5
Total common equity tier 1 capital 3,344.8 3,289.4 3,297.7
Additional Tier 1 capital instruments 895.9 895.9 895.9
895.9 895.9 895.9
Total Tier 1 Capital 4,240.7 4,185.3 4,193.6
Tier 2
Tier 2 capital instruments 494.3 822.4 547.4
General reserve for credit losses/collective provision (net of tax effect) 190.0 186.0 175.0
Total Tier 2 Capital 684.3 1,008.4 722.4
Total regulatory capital 4,925.0 5,193.7 4,916.0
Total risk weighted assets 37,483.1 37,539.0 38,256.4
Total Additional Tier 1 Capital
Change Change
Appendix 4E: Full year results
Year ended 30 June 2019 27
For
per
sona
l use
onl
y

2.3.10.2 Capital adequacy (continued)
As at As at As at As at
Jun-19 Jun-18 Jun-19 Dec-18
Risk- weighted assets $m $m $m % $m $m $m %
Credit risk 33,424.1 34,367.6 (943.5) (2.7) 33,424.1 33,656.7 (232.6) (0.7)
Market risk 343.6 212.4 131.2 61.8 343.6 175.7 167.9 95.6
Operational risk 3,715.4 3,676.4 39.0 1.1 3,715.4 3,706.6 8.8 0.2
Total risk-weighted assets 37,483.1 38,256.4 (773.3) (2.0) 37,483.1 37,539.0 (55.9) (0.1)
Key movements in the June 2019 year include:
> Common Tier 1
Dividend reinvestment plan increased capital by $46.0m.
Retained earnings and net deferred tax assets increased by $54.0m net of Homesafe unrealised revaluation gains.
> Risk weighted assets
Risk weighted assets decreased during the year due to the securitisation of residential mortgages partially offset by loan growth.
Capital adequacy (%)
Capital adequacy is calculated in accordance with regulations set down by APRA.
Pillar 3 Disclosures
Details on the market disclosures required under Pillar 3, per prudential standard APS 330 “Public Disclosure”, are provided on the Group’s website at:
http://www.bendigoadelaide.com.au/public/shareholders/announcements/aps_330.asp
Change Change
8.62% 8.76% 8.92%
2.34% 2.39% 2.39%
1.89%2.69%
1.83%
30 June 2018 31 December 2018 30 June 2019
Common Equity Tier 1 Additional Tier 1 Tier 2
13.14%13.84%12.85%
Appendix 4E: Full year results
Year ended 30 June 2019 28
For
per
sona
l use
onl
y
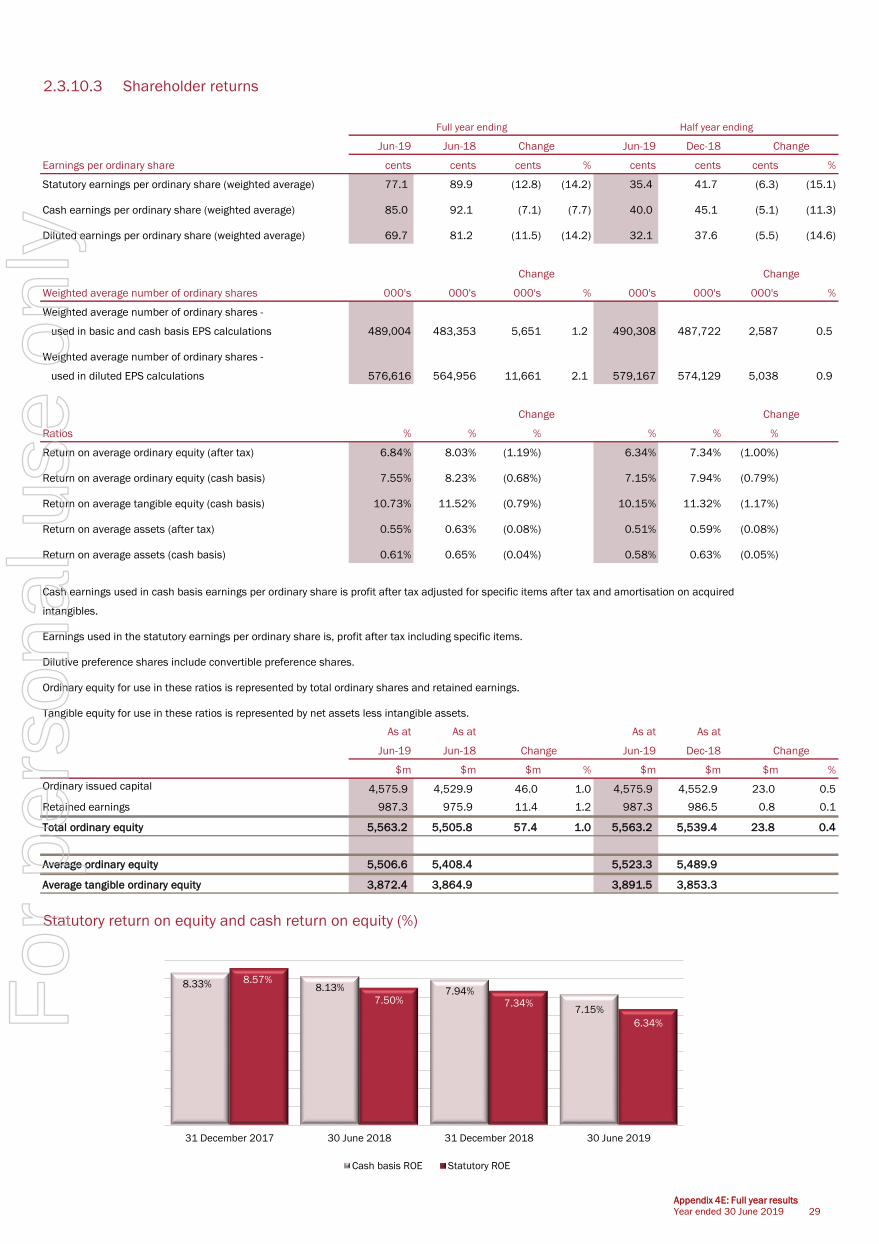
2.3.10.3 Shareholder returns
Jun-19 Jun-18 Jun-19 Dec-18
Earnings per ordinary share cents cents cents % cents cents cents %
77.1 89.9 (12.8) (14.2) 35.4 41.7 (6.3) (15.1)
85.0 92.1 (7.1) (7.7) 40.0 45.1 (5.1) (11.3)
69.7 81.2 (11.5) (14.2) 32.1 37.6 (5.5) (14.6)
Weighted average number of ordinary shares 000's 000's 000's % 000's 000's 000's %
Weighted average number of ordinary shares -
used in basic and cash basis EPS calculations 489,004 483,353 5,651 1.2 490,308 487,722 2,587 0.5
Weighted average number of ordinary shares -
used in diluted EPS calculations 576,616 564,956 11,661 2.1 579,167 574,129 5,038 0.9
Ratios % % % % % %
Return on average ordinary equity (after tax) 6.84% 8.03% (1.19%) 6.34% 7.34% (1.00%)
Return on average ordinary equity (cash basis) 7.55% 8.23% (0.68%) 7.15% 7.94% (0.79%)
Return on average tangible equity (cash basis) 10.73% 11.52% (0.79%) 10.15% 11.32% (1.17%)
Return on average assets (after tax) 0.55% 0.63% (0.08%) 0.51% 0.59% (0.08%)
Return on average assets (cash basis) 0.61% 0.65% (0.04%) 0.58% 0.63% (0.05%)
Cash earnings used in cash basis earnings per ordinary share is profit after tax adjusted for specific items after tax and amortisation on acquired
intangibles.
Earnings used in the statutory earnings per ordinary share is, profit after tax including specific items.
Dilutive preference shares include convertible preference shares.
Ordinary equity for use in these ratios is represented by total ordinary shares and retained earnings.
Tangible equity for use in these ratios is represented by net assets less intangible assets.
As at As at As at As at
Jun-19 Jun-18 Jun-19 Dec-18
$m $m $m % $m $m $m %
Ordinary issued capital 4,575.9 4,529.9 46.0 1.0 4,575.9 4,552.9 23.0 0.5
Retained earnings 987.3 975.9 11.4 1.2 987.3 986.5 0.8 0.1
Total ordinary equity 5,563.2 5,505.8 57.4 1.0 5,563.2 5,539.4 23.8 0.4
Average ordinary equity 5,506.6 5,408.4 5,523.3 5,489.9
Average tangible ordinary equity 3,872.4 3,864.9 3,891.5 3,853.3
Statutory return on equity and cash return on equity (%)
Change Change
Change
Change Change
Change Change
Full year ending Half year ending
Cash earnings per ordinary share (weighted average)
Statutory earnings per ordinary share (weighted average)
Diluted earnings per ordinary share (weighted average)
Change
Appendix 4E: Full year results
Year ended 30 June 2019 29
8.33% 8.13% 7.94%
7.15%
8.57%
7.50% 7.34%
6.34%
31 December 2017 30 June 2018 31 December 2018 30 June 2019
Cash basis ROE Statutory ROE
For
per
sona
l use
onl
y

2.3.10.3 Shareholder returns (continued)
Reconciliation of earnings used in the calculation of Jun-19 Jun-18 Jun-19 Dec-18
earnings per ordinary share $m $m $m $m
Net Profit after tax 376.8 434.5 173.6 203.2
Total basic earnings 376.8 434.5 173.6 203.2
Earnings used in calculating basic earnings per ordinary share 376.8 434.5 173.6 203.2
Add back : Dividends accrued and/or paid on dilutive convertible preference shares 25.0 24.5 12.3 12.7
Total diluted earnings 401.8 459.0 185.9 215.9
Earnings used in calculating basic earnings per ordinary share 376.8 434.5 173.6 203.2
Add back: Amortisation of acquired intangibles (after tax) 2.6 5.8 1.5 1.1
Add back: Specific income and expense items (after tax) 26.4 (6.5) 15.9 10.5
Add back: Homesafe net realised income 9.9 11.3 4.9 5.0
Total cash earnings 415.7 445.1 195.9 219.8
Earnings per share and dividend per share (cents)
2.3.10.4 Dividends
Jun-19 Jun-18 Jun-19 Dec-18
% %
Dividend per share - cents 70.0 70.0 - - 35.0 35.0 - -
Dividend amount payable/paid - $m 338.3 331.1 7.2 2.2 169.6 168.7 0.9 0.5
Payout ratio - earnings per ordinary share 1
90.8% 77.9% 12.9% 16.6 98.9% 83.9% 15.0% 17.9
Payout ratio - cash basis per ordinary share 1
82.4% 76.0% 6.4% 8.4 87.5% 77.6% 9.9% 12.8
78.6% 75.7% 2.9% 3.8 80.1% 77.1% 3.0% 3.9
1 Payout ratio is calculated as dividend per share divided by the applicable earnings per ordinary share.
2 This ratio has been adjusted to exclude the impact of remediation costs after tax (June 19 FY: $11.7m, June 18 FY: $0.4m, June 19 HY: $11.4m,
December 18 HY: $0.3m) and redundancy costs after tax (June 19 FY: $8.3m, June 18 FY: $1.6m, June 19 HY: $6.8m, December 18 HY $1.5m).
Dividend Reinvestment Plan
The Dividend Reinvestment Plan provides shareholders with the opportunity of converting their entitlement to a dividend into new shares. The issue price of
the shares is equal to the volume weighted average share price of Bendigo and Adelaide Bank shares traded on the Australian Securities Exchange
over the seven trading days commencing 5 September 2019. Shares issued under this Plan rank equally with all other ordinary shares.
Bonus Share Scheme
The Bonus Share Scheme provides shareholders with the opportunity to elect to receive a number of bonus shares issued for no consideration instead of
receiving a dividend. The issue price of the shares is equal to the volume weighted average share price of Bendigo and Adelaide Bank shares traded on the
Australian Securities Exchange over the seven trading days commencing 5 September 2019. Shares issued under this scheme rank equally with all other
ordinary shares.
The last date for the receipt of an election notice for participation in either the Dividend Reinvestment Plan or Bonus Share Scheme
for the 2019 final dividend is 4 September 2019.
Adjusted payout ratio - cash basis per ordinary
share 2
Full year ending Half year ending
Change Change
Full year ending Half year ending
48.1
41.8 41.7
35.4
46.8 45.3 45.1
40.0
35.0 35.0 35.0 35.0
31 December 2017 30 June 2018 31 December 2018 30 June 2019
Statutory EPS Cash EPS Dividend per share
Appendix 4E: Full year results
Year ended 30 June 2019 30
For
per
sona
l use
onl
y
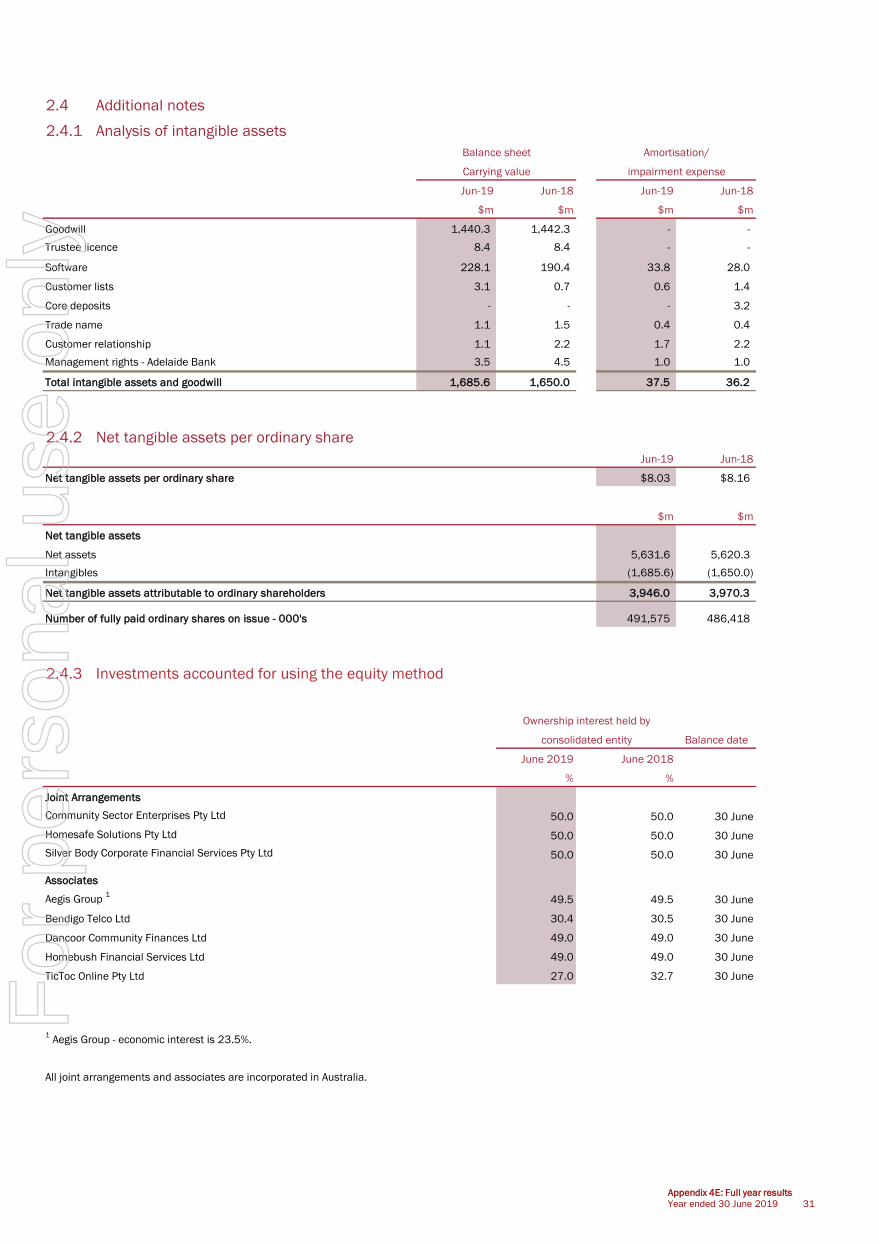
2.4 Additional notes
2.4.1 Analysis of intangible assets
Jun-19 Jun-18 Jun-19 Jun-18
$m $m $m $m
Goodwill 1,440.3 1,442.3 - -
Trustee licence 8.4 8.4 - -
Software 228.1 190.4 33.8 28.0
Customer lists 3.1 0.7 0.6 1.4
Core deposits - - - 3.2
Trade name 1.1 1.5 0.4 0.4
Customer relationship 1.1 2.2 1.7 2.2
Management rights - Adelaide Bank 3.5 4.5 1.0 1.0
Total intangible assets and goodwill ag019 1,685.6 1,650.0 37.5 36.2
2.4.2 Net tangible assets per ordinary share
Jun-19 Jun-18
Net tangible assets per ordinary share $8.03 $8.16
$m $m
Net tangible assets
Net assets 5,631.6 5,620.3
Intangibles (1,685.6) (1,650.0)
Net tangible assets attributable to ordinary shareholders 3,946.0 3,970.3
Number of fully paid ordinary shares on issue - 000's 491,575 486,418
2.4.3 Investments accounted for using the equity method
Balance date
June 2019 June 2018
% %
Joint Arrangements
Community Sector Enterprises Pty Ltd 50.0 50.0 30 June
Homesafe Solutions Pty Ltd 50.0 50.0 30 June
50.0 50.0 30 June
Associates
Aegis Group 1
49.5 49.5 30 June
Bendigo Telco Ltd 30.4 30.5 30 June
Dancoor Community Finances Ltd 49.0 49.0 30 June
Homebush Financial Services Ltd 49.0 49.0 30 June
TicToc Online Pty Ltd 27.0 32.7 30 June
1 Aegis Group - economic interest is 23.5%.
All joint arrangements and associates are incorporated in Australia.
Amortisation/
impairment expense
Silver Body Corporate Financial Services Pty Ltd
consolidated entity
Ownership interest held by
Balance sheet
Carrying value
Appendix 4E: Full year results
Year ended 30 June 2019 31
For
per
sona
l use
onl
y

2.4.4 Credit ratings
Short term Long term Outlook
Standard & Poor's A-2 BBB+ Stable
Fitch Ratings F2 A- Stable
Moody's P-2 A3 Stable
On 21 December 2018, Standard & Poor's Global Ratings affirmed its long-term counterparty credit rating on Bendigo and Adelaide Bank Limited
at 'BBB+', and affirmed the short-term rating at 'A-2'. The outlook remains stable. Standard and Poor's commented that they expect the Bank's
capitalization to remain strong given low-mid single digit growth and stable profitability, which is likely to offset its sizable dividend payment.
Bendigo and Adelaide Bank Ltd's low risk lending book is dominated by housing loans that support the Bank's asset quality at a level consistent with
that of the Australian banking system as a whole.
On 19 December 2018, Fitch Ratings, the international ratings agency affirmed Bendigo and Adelaide Bank Ltd's long term rating at 'A-', and affirmed the
short term rating of 'F2' and its support rating of '3', and the Bank's viability rating of 'A-'. The outlook remains stable. Fitch commented that the ratings
reflect the Bank's conservative risk appetite and improved risk controls, which supports its consistently strong asset quality, while maintaining solid
profitability.
On 27 June 2019, Moody’s affirmed its long-term issuer rating at ‘A3’ and short term rating at ‘P-2’, with a stable outlook. Moody’s commented that
the ratings reflect the Bank's strong credit profile characterized by its well-developed franchise centered around community banking, conservative
management historically focused on low-risk lending, stable asset quality, strong funding structure and good capital adequacy.
2.4.5 Issued capital
Changes to issued and quoted securities during the period:
Ordinary Shares 1
Number of Shares $m
Fully paid ordinary shares at 30 June 2018 486,418,481 4,529.9
Shares issued:
30 September 2018 - Dividend reinvestment plan at $10.74 2,151,250 23.0
30 September 2018 - Bonus share scheme (in lieu of dividend payment) at $10.74 399,626 -
March 2019 - Dividend reinvestment plan at $9.75 2,359,434 23.0
March 2019 - Bonus share scheme (in lieu of dividend payment) at $9.75 246,366 -
Total ordinary shares at 30 June 2019 ag032 491,575,157 4,575.9
2.4.6 AASB 16 Leases
AASB 16 Leases replaces AASB 117 Leases and is effective for annual reporting periods beginning on or after 1 January 2019, hence the Group will
adopt the standard from 1 July 2019. The new standard requires all leases to be recognised on-balance sheet, except for leases with a term of less than
12 months and leases of low-value assets. Under the requirements of the new standard, a lessee is required to recognise a right-of-use asset
representing its right to use the underlying leased asset along with a lease liability representing its obligation to make lease payments. The Group can
choose either a full retrospective or a modified retrospective transition approach with the standard providing practical options and exemptions to ease
the costs of transition. Lessor accounting remains substantially unchanged.
The Group has performed a detailed impact assessment of AASB 16 and will apply the modified retrospective approach as permitted by the standard.
The Group will calculate the right-of-use asset at the date of initial application as if AASB 16 had been applied from the lease commencement using the
incremental borrowing rate at the date of transition, being 1 July 2019. The lease liability will be measured at an amount equal to the outstanding lease
payments at the date of initial application, considering extension and termination options, discounted at the Group’s incremental borrowing rate in the
economic environment of the lease. The capitalised right-of-use asset will mainly consist of property, namely the head office buildings and the retail
branches. The right-of-use asset will total approximately $230 million and the lease liability $270 million. The difference between these two amounts,
subsequent to relevant tax adjustments, will be posted as a retained earnings adjustment. CET 1 capital is expected to decrease by 15 bps, as a result
of the increase in the risk-weighted assets (treated as 100% risk-weighted, consistent with the nature of the underlying asset).
1 BEN - ASX code Ordinary Fully Paid Shares
Appendix 4E: Full year results
Year ended 30 June 2019 32
For
per
sona
l use
onl
y

THIS PAGE HAS BEEN LEFT BLANK INTENTIONALLY
For
per
sona
l use
onl
y

Bendigo and Adelaide Bank LtdABN 11 068 049 178
For
per
sona
l use
onl
y