‘bend it like beckham’: identity, socialization, and ...figures.pdf · ‘bend it like...
TRANSCRIPT

‘Bend It Like Beckham’:
Identity, Socialization, and Assimilation
Alberto Bisin∗ Eleonora Patacchini† Thierry Verdier‡ Yves Zenou§
March, 2006¶
Abstract
This paper is about ethnic identity. We first develop a model of identity forma-tion resulting from the interaction of cultural transmission and socialization inside thefamily, peer effects and social interactions, and identity choice.
We then put the model to data using the UK Fourth National Survey of EthnicMinorities. We show that the main determinants of ethnic identity include past racialharassment experiences, language spoken at home and with friends, quality of housing,and structure of the family. Most importantly, we find that, consistently with ourtheoretical analysis, identity and socialization to an ethnic minority are, other thingsequal, more intense in mixed neighborhood than in segregated neighborhoods. Weargue that this last result has important and up-to-now unnoticed implications forintegration and assimilation policies.
Key words: Ethnicity, identity, intermarriage, cultural transmission.JEL Classification: A14, J15
∗New York University, Department of Economics, 269 Mercer Street, New York, NY 10003, USA. E-mail:[email protected]
†Universita’ di Roma ”La Sapienza,” Facolta’ di Scienze Statistiche, P.le Aldo Moro, 5 - 00185, Roma,Italy. E-mail: [email protected]
‡PSE, 48 boulevard Jourdan, 75014 Paris, France and CEPR. E-mail: [email protected]§IUI, The Research Institute of Industrial Economics, P.O. Box 55665, 102 15 Stockholm, Sweden, GAINS
and CEPR. E-mail: [email protected]¶Thanks to Andrew Clark for Morissey’s quote. This paper is part of the Polarization and Conflict Project
CIT-2-CT-2004-506084 funded by the European Commission-DG Research Sixth Framework Programme.
1
Bengali, bengali / Bengali, bengali / No no no / He does not want to depress you/
Oh no no no no no / He only wants to impress you / Oh.. Bengali in platforms /
He only wants to embrace your culture / And to be your friend forever. [‘Bengali
in Platform,’ Morissey, Viva Hate, 1988, Reprise/Wea]
1 Introduction
In April 1992, when a mostly white jury acquitted four police officers accused in the video-
taped beating of a black motorist, thousands of people in Los Angeles, mainly young black
and Latino males, joined in what has often been characterized as a race riot. In the Summer
of 2001, ethnic riots occurred on the streets of towns and cities in the north of England (e.g.,
Oldham, Leeds, Burnley, Bradford), involving young British Asian men and young White
British men. More recently, in November 2005, riots emerged in Paris’ suburbs, sparked
by the accidental deaths of two Muslim teenagers, and then spread to 300 French towns
and cities. Most of the rioters were the French-born children of immigrants from Arab and
African countries, a large percentage being Muslim.
These race and ethnic riots1 have all recently placed the issue of racial and ethnic identity
at the forefront of political debate in the United States and in Europe. In this paper, we
endeavor to study the issue of ethnic identity both theoretically and empirically. Identity is
the result of an individual’s choice, often the choice not to conform to the accepted norms of
behavior but rather to different norms which characterize e.g., a social, ethnic, or religious
group.2 Furthermore, ethnic identities often take the form of “oppositional” identities, that
is, they require rejection of the dominant ethnic (e.g., white) behavioral norms; see, in
particular, Ainsworth-Darnell and Downey (1998). This is the case, for instance, of “ghetto
culture” in the US (Wilson, 1987). Also, studies in the U.S. have found, for example, that
African American students in poor areas may be ambivalent about learning standard English
and performing well at school because this may be regarded as “acting white” and adopting
mainstream identities (Delpit, 1995, Fordham and Ogbu, 1986, Ogbu, 1997, Austen-Smith
1But also, e.g., the terrorist attacks in the U.S. and Europe (September 11, the March 2004 Madridtrain bombings, the July 2005 London bombings), the killing of the author of a documentary about Mus-lim immigrants by a young Dutch-Moroccan in Amsterdam on November 2004, the riots in many Muslimcommunities in February 2006 after the publications of vignettes representing the prophet Mohammed in aDanish newspaper, and several others.
2In this perspective, identity is related to conformity effects. Identity and conformity are nonethelessclearly distinct. Preferences for conformity in fact limit the choice of individuals, inducing them to conforme.g., to social norms of behavior (see e.g., Bernheim, 1994, and Akerlof, 1997).
2
and Fryer, 2005, Battu, Mwale, and Zenou, 2005, Fryer and Torelli, 2005, Selod and Zenou,
2006).
Oppositional identities often produce significant economic and social conflicts,3 as in the
case of the ethnic and race riots cited. But how are intense and oppositional identities
formed? Which economic and sociological factors mostly contribute to their formation? In
particular, does neighborhood segregation induce intense and oppositional identities, as is
commonly observed? In this paper we attempt some first answers to these questions.
A large literature in the economics, sociology and anthropology studies how ethnic traits
are transmitted from parents to children and how ethnic identity is adopted.4 In our reading
of the evidence, parents directly make various socialization choices, e.g., the rules and beliefs
the family conforms to and how much time they spend with their children. Parents also
realize that socialization is partially the product of the social interaction their children
engage into, which they affect by choosing e.g., which neighborhood to live in, the school
children attend, their social circle of friends and acquaintances, the civic/social clubs and
churches they belong to. The role of parents in the socialization of their own children is
nonetheless limited by the children’s pro-active role in choosing who to imitate and learn
from, thereby directly shaping their own cultural identity. An individual’s general identity,
in the words of Akerlof and Kranton (2000, p. 720), “is bound to social categories; and
individuals identify with people in some categories and differentiate themselves from those
in others.”
We model the formation of ethnic traits along these lines, that is, as a mechanism which
interacts cultural transmission and socialization inside the family,5 peer effects and social
interactions, and identity choice.
We study theoretically the process of ethnic assimilation (or lack thereof) of minorities
and we study its dependence on the ethnic distribution of the population in the neighborhood
in which the family lives and the child is raised. Importantly, we show that it is possible that
(and we identify sufficient conditions on preferences such that) ethnic identity and socializa-
3The relationship between ethnic diversity and economic performance is extensively studied and surveyedby Alesina and La Ferrara, 2004.
4See in particular, Alba, 1990, Bernal and Knight, 1993, Bisin and Verdier, 2000, Bisin, Topa, and Verdier,2004, Boyd and Richerson, 1985, Cavalli-Sforza and Feldman, 1981; Phinney, 1990) for theory and evidenceon cultural transmission. See Akerlof and Kranton, 2000 for identity formation.
5See Bisin and Verdier (2000, 2001) for a formal study of cultural transmission, and Bisin, Topa, andVerdier (2004), Cohen Zada (2003), Jellal and Wolff (2002), and Patacchini and Zenou (2004) for empiricalstudies of cultural transmission and socialization of, respectively, religious traits, altruism, and preferencesfor education.
3

tion effort are more intense in mixed rather than in segregated neighborhoods. We show that
this is the case, for instance, if preferences are such that individuals react to an hostile racial
or ethnic environment accentuating their ethnic lifestyle, identity and ethnic segregation act
as substitutes in their identity formation choice problem, children leave in more segregated
neighborhoods than their parents were raised in (or in similar neighborhoods in terms of
composition), and finally parents expect for their children a less hostile environment than
they have themselves experienced.
We then put the model to data in the context of the assimilation of ethnic minority
populations in the UK. We use data from the Fourth National Survey of Ethnic Minorities
(FNSEM), collected in 1993/94 by the Policy Studies Institute (PSI) in the U.K., regarding
six ethnic groups: Caribbean, Indian, Pakistani, African-Asian, Bangladeshi, and Chinese.
Our objective is to uncover the main determinants of the process of ethnic assimilation
and to assess their relative empirical relevance.6 In this respect, we find that the main
determinants of ethnic identity include past racial harassment experiences, language spoken
at home and with friends, quality of housing, and structure of the family.
Most importantly, we aim at uncovering in the data if identity and socialization effort
are in fact reduced in more segregated neighborhoods. In this respect, we find evidence that
living in a neighborhood with a higher percentage of own ethnic minority group is associated
with a lower sense of identity and with a lower probability of homogamy (i.e., with a higher
inclination to ethnic assimilation), other things equal. (Following the literature, e.g., Bisin-
Verdier (2000), we consider homogamy a measure of the effort to socialize children to the
minority ethnic trait.) Indeed, in the range of ethnic compositions we observe in the data, the
predicted probability of having a strong identity (measured as the probability of reporting
the highest allowed value of ethnic identity in the survey) goes from roughly 0.6 to 0.4,
respectively, going from relatively mixed neighborhoods (in which the minority accounts for
less that 2 percent) to segregated neighborhoods (in which the minority accounts for more
than 33 percent of the population). Similarly, the estimated probability of homogamy of a
minority (depurated of the effects of controls) increases of more than 10 percentage points
going from segregated to mixed neighborhood.7
6The interaction of socialization, social interactions, and identity formation in the assimilation process inthe U.K. is masterly described in several recent motion pictures, Bend it like Beckham (2002), East is East(2000), and My Son the Fanatic (1997).
7Differently stated, the increase in the probability of homogamy following a marginal increase in identityis roughly doubled (from about 2-3.5% to about 4-6.5%, depending on the chosen proxy for identity) whenthe percentage of own ethnic minority group in the neighborhood where a minority individual lives decreasesfrom more than 33% to less than 2%.
4

We conclude that intense forms of ethnic identity and socialization appear to be formed
in social contexts in which the minority ethnic trait is mostly ”threatened” either directly
by the actions of the majority group (e.g., through explicit acts of rejection or harassment),
or indirectly simply by being exposed to the interaction with the majority norm of behavior
in mixed neighborhood.
This is consistent with other documented evidence of identity formation. Notably, using
a nationally representative sample of more than 90,000 students, from 175 schools, who
entered grades 7 through 12 in 1994 in the US (the National Longitudinal Study of Adolescent
Health), Fryer and Torelli (2005) find that “acting white” behaviors among blacks (i.e. the
higher the test score the less popular a student is) are more developed in racially mixed
schools.8 Also, Bisin, Topa, and Verdier (2004) document that religious socialization across
U.S. states is more intense when a religious faith is a minority.9
Furthermore, our finding that a stronger identity is induced by whether an individual
has experienced harassment or discrimination for racial or ethnic reasons might tend to
exacerbate the effects of mixed neighborhoods on identity formation and socialization effort
(as measured by homogamy). In mixed neighborhoods, in fact, episodes of harassment and
discrimination tend to have relatively higher frequency.10
We also address the issue of the alleged specificity of Muslim immigrants with regards
to the strength of their identity and their (lack of) assimilation tendencies; an issue which
recently surged at the center of the political debate in Europe (see, e.g., Gallis, 2005). We
estimate our identity and socialization model on the restricted sample of Muslim respondents.
We find that Muslims tend in fact to have stronger identity effects on their assimilation effort
for every neighborhood ethnic composition, but these effects are not qualitatively different
from the ones found using the whole sample: identity and socialization effort still appear to
be reduced in more segregated neighborhoods. This evidence suggests that the relationship
8Anthropologists have also observed that social groups seek to preserve their identity, an activity thataccelerates when threats to internal cohesion intensify. Thus, groups may try to reinforce their identityby penalizing members for differentiating themselves from the group. The penalties are likely to increasewhenever the threats to group cohesion intensify; for an early analysis of this issues, see W.F. Whyte, StreetCorner Society, 1943.
9Relatedly, Bisin and Verdier (2000) provide many examples of the resilience of ethnic and other culturaltraits which can be explained by a similar mechanism, from the case of Orthodox Jews in Brooklyn to thecase of aristocrats in France.
10Although this evidence holds for most of the distinct types of harassment and discrimination classifiedby our data, it not however completely univocal. Serious episodes of racial harassment (like e.g., attacks)and serious job-related language problems (like, e.g. in getting work) seem to be less frequent in mixedneighborhoods (see Table 2).
5

between ethnic assimilation effort and ethnic neighborhood composition is not significantly
different for Muslims with respect to other minorities.
The analysis of the dependence of socialization and identity on the ethnic composition
of the neighborhood is of great interest from a policy perspective whenever assimilation is a
policy objective and, more generally, when intense socialization practices and the formation
of oppositional ethnic identities have important negative externalities. While the failure
of assimilation and integration policies in Europe and the U.S. is certainly reflected in the
recent ethnic and racial riots, our empirical results suggest that, contrary to presumptions
often exposed by social scientists and commentators, the intense and oppositional identities
which give rise to such social conflicts are not directly favored by the segregation of the
neighborhood in which ethnic and racial minorities tend to live.
Our analysis suggests on the contrary that integration and assimilation policies favoring
the formation of mixed neighborhoods, fearing the effects of geographical segregation, are
possibly minimally effective if not counterproductive. Integrationist policies, which include
school busing, affirmative action in public schools and in the workplace, forced integration
of public housing, and laws barring discrimination in housing and employment, have in fact
often had limited effects, consistently with our analysis, and are even being at times opposed
by the same minority groups in whose interest they have been pursued (see e.g., Jacoby, 1998,
and Thernstrom and Thernstrom, 2002). J. Coleman, for instance, fifteen years after the
Coleman Report (1966) which originally proposed busing, admitted that, ”the assumption
that busing would improve achievement of lower-class black children has now been shown
to be fiction;” (cited in Jacoby, 1999).11 But Moving to Opportunity (MTO) programs in
the United States that relocates families from high- to low-poverty neighborhoods (and from
racially segregated to mixed neighborhoods) also have had positive but arguably small effects
(see, in particular, Ludwig, Duncan, and Hirschfield, 2001, and Kling, Ludwig, and Katz,
2005).12 In Europe different integration policies and ambitious social programs have been
implemented in urban areas where immigrants live but they also have had limited results.
This is the case, for instance, for the creations of Zones of Educational Priority (ZEP’s, ‘Zones
d’Education Prioritaire’) and for the rehabilitation of bleak housing projects in immigrant
neighborhoods under the guise of urban policy (‘politique de la ville’) in France.Finally,
even racially integrated schools have recently lost much of their appeal in African-American
11The failure of the busing and other cib=vil rights policies is certainly also due to the whites’ flying fromde-segregated schools and neighborhoods.
12Similarly, the Toronto housing program where adults were assigned as children to different residentialhousing projects (Oreopoulos, 2003) did not give the expected results in terms of education outcomes.
6

communities (see e.g., the ethnographic study of Gussin Paley, 1995, for schooling).
Far from supporting policies to establish segregated neighborhoods, in this paper, we
simply document that the effect of mixed neighborhood on identity formation and social-
ization might be perverse. This is particularly so if mixed neighborhood are conducive of
explicit acts of rejection on the part of the majority.
The paper is organized as follows. In the next section, we present the theoretical model,
which will ground the empirical approach. Section 3 deals with the empirical analysis. In
section 4, we discuss some policy issues. All proofs are relegated to Appendix 1.
2 The theoretical model
Suppose that the population is composed of a majority and a minority ethnic trait.13 We
denote with apex i the minority trait. We denote instead with apex 0 the trait of the majority,
to which minority individuals might assimilate. We consider the formation of ethnic traits
through a mechanism which interacts (i) cultural transmission and socialization inside the
family, (ii) social interactions and peer effects, via imitation and learning and (iii) identity
choice.
Only parents of the minority ethnic trait i are interesting in our model, as we assume
for simplicity that parents of the ethnic majority have children of the ethnic majority with
no socialization effort. (Consequently we drop the index i when not necessary.) We model
the formation of ethnic traits as follows (see also Figure 1). i) Families are composed of
one parent and a child (both without specified gender). All children are born without
defined preferences or cultural traits, and are first exposed to their parent’s trait. Cultural
transmission inside the family to the parent’s trait, i, occurs with a probability which is the
result of (increases with) costly socialization effort on the part of the parent (see Bisin and
Verdier, 2000, 2001). ii) If a child from a family with trait i is not directly socialized, he/she
interacts with peers, role models, and other cultural parents in the neighborhood in which
he/she is raised. As a consequence of such social interactions the child adopts the minority
trait with a probability which depends on the ethnic composition of the neighborhood. iii)
Suppose that either cultural transmission inside the family is successful or that a child
adopts the ethnic trait of his/her parents through peer effects. The intensity of his/her
ethnic identity is nonetheless his/her personal choice, that is, it is not transmitted by the
13This is just for notational simplicity. The extension of our theoretical analysis to multiple minority traitsis straightforward. In the empirical analysis we shall study four minority populations, Pakistani, Indian,Carribean, and Chinese, and their assimilation process to the Anglo-Saxon culture.
7

family. We conceptualize identity as a psychological defense against the costs of behaving
distinctively from the accepted social norm (the preferred behavior of the majority). By
choosing a stronger identity an individual can and will behave more closely to his/her ethnic
ideal.
[Insert F igure 1 here]
2.1 Preferences
Consider a parent and a child. We index variables related to the parent (resp. the child)
with apex p (resp. c). We describe the preferences and the associated decision problems we
study from the vantage point of parents, because this is how the empirical analysis in the
next section can be formulated. A parent of trait i derives utility both from his/her own
actions, xp, and from the actions of his/her child xc. In our analysis, these two components
of preferences are independent and hence can be introduced in turn.
Own component of preferences. An ethnic trait i is represented by a system of values and
preferences summarized by the utility function ui(xp, zp), where xp is an abstract argument
indicating the whole set of choices of the individual (a parent), and zp ≥ 0 represents a
measure of his/her personal negative experiences/environment, e.g., having being harassed
for racial or ethnic reasons, living in an hostile environment.
Living the life prescribed by ethnic trait i, in our model, means choosing
xi(zp) = arg max ui(x, zp).
Choosing xi(zp) is however costly in a socio-economic environment in which the accepted
social norm is x0, the behavior of the majority.
We postulate that the construction of an individual’s ethnic identity is the psycho-
logical mechanism by which the individual reduces these costs. Formally, let αp denote
the identity of a parent. The fraction of individuals with trait i is denoted by qi. Let
λ (αp, qi,p) (x− x0)2 /2 denote the psychological costs associated to choice x.14 The function
λ (αp, qi,p) represents the unit costs of lack of assimilation. Such costs depend on identity,
αp, and on the fraction of the population with ethnic trait i in the neighborhood in which
14Observe the fundamental difference with conformity models (see, among others, Akerlof, 1980; Akerlof,1997; Ballester, Calvo Armengol, and Zenou, 2005; Battu, Mwale, and Zenou, 2005; Bernheim, 1994; Glaeserand Scheinkman, 2001; Kandel and Lazear, 1992; Fershtman and Weiss, 1998) where it is failing to conformto own group identity that is costly.
8

the parent lives when forming his/her ethnic identity, qi,p.15 The variable αp represents the
parent’s identity in the sense that the higher is αp, the lower are the psychological costs
associated to a choice x 6= x0.16
Each parent of ethnic trait i chooses αp given qi,p and zp. Identity formation is costly
in itself. Higher values of αp are formed at convexly increasing psychological costs (αp)2 /2.
Summarizing, a parent of trait i has own utility given by:
ui(xp, zp)− λ(αp, qi,p
) (xp − x0)2
2− (αp)2
2(1)
We impose standard assumptions on preferences.17 An important element of the analysis
of the paper will revolve around the sign of the cross derivative uxz ≡ ∂2ui(xp,zp)∂xp∂zp of the utility
function. When uxz > 0 (resp. < 0), then xi(zp) increases (resp. decreases) with zp; namely,
an agent would react to an hostile environment by accentuating (resp. moderating) his/her
ethnic lifestyle.
The unit costs of lack of assimilation of parents of ethnic trait i are defined to decrease
in their identity,
λα ≡∂λ (αp, qi,p)
∂αp< 0, (3)
and also are required to satisfy standard assumptions.18 Furthermore, they are assumed to
15We assume that qi,p is not chosen by parents. We discuss and find support for this assumption in ourdata (see Section 3.4 below).
16Our model of identity formation is inspired by Akerlof and Kranton (2000). Using their terminology,we have two categories, traits i and 0, whose prescription are respectively represented by xi(zp) and x0;and identity affects the individual’s utility. Saez-Marti’ and Sjogren (2006) also study theoretically theinteractions between cultural transmission and identity. They model identity formation, however, as a biasin the transmission of culture rather than as a choice of the individual.
17That is, ui(xp, zp) is twice continuously differentiable with uxx ≡ ∂2ui(xp,zp)
∂(xp)2< 0. Naturally, we require
uz ≡ ∂ui(xp,zp)∂zp < 0. Furthermore, to avoid trivial cases, we assume that xi(zp) = arg max ui(xp, zp) 6= x0;
in fact, without loss of generality, we can assume
xi(zp) > x0 for all zp (2)
18In particular, when αp → 0, costs are so high, λ(αp, qi,p
)→ ∞, that the agent chooses xp = x0. We
also assume that
λαα ≡∂2λ
(αp, qi,p
)∂ (αp)2
> 0 (4)
so as to guarantee concavity of the identity formation process.
9

decrease with the fraction of the population sharing the trait, qi,p,
λq ≡∂λ (αp, qi,p)
∂qi,p< 0, (5)
In other words, deviating from the behavioral norm of the majority is less costly the less
widespread is the norm in the population.
Imperfect empathy component of preferences. Parents are altruistic but in a paternalistic
manner. That is, parents care about their child’s future well-being, but they evaluate their
children’ future utility as if it were their own. Bisin and Verdier (2000, 2001) refer to this
form of paternalistic altruism in the context of cultural transmission models as imperfect
empathy.
Thus, the utility a parent obtains from the socialization of his/her son to trait i is equal
to:
ui (xc∗, zp)− λ(αp, qi,p
) [xc∗ − x0]2
2
where xc∗ represents the child’s decisions (as expected by the parent), given the child’s
environment zc. Therefore, while parents perceive and evaluate altruistically the behavior of
their children, xc∗, through the lenses of their own identity and experiences, λ (αp, qi,p) and
zp, they anticipate correctly the environment zc of their child (possibly different from the
environment zp of the parent) and his/her choice xc∗.
On the contrary, a parent of ethnic trait i whose socialization effort is not successful, and
hence who has an assimilated child, has perceives altruistically a utility ui (x0, zp) from the
behavior of his child.
2.2 Socialization and identity choice
Consider one of our families composed of a parent of trait i and a child. The parent chooses
his/her own identity αp as well as xp. He/she also chooses τ , the direct socialization of his/her
child. His/her child then, in turn, possibly acquires his/her particular trait i through an
intergenerational transmission mechanism which depends on parents’ socialization effort, τ ,
and on the social environment where parent lives and the child is raised, qi,c). If socialization
to trait i is not successful, the child is assimilated to the majority and chooses x0. If on the
contrary socialization to trait i is successful, the child’s identity formation process determines
his/her final choice xc.
10
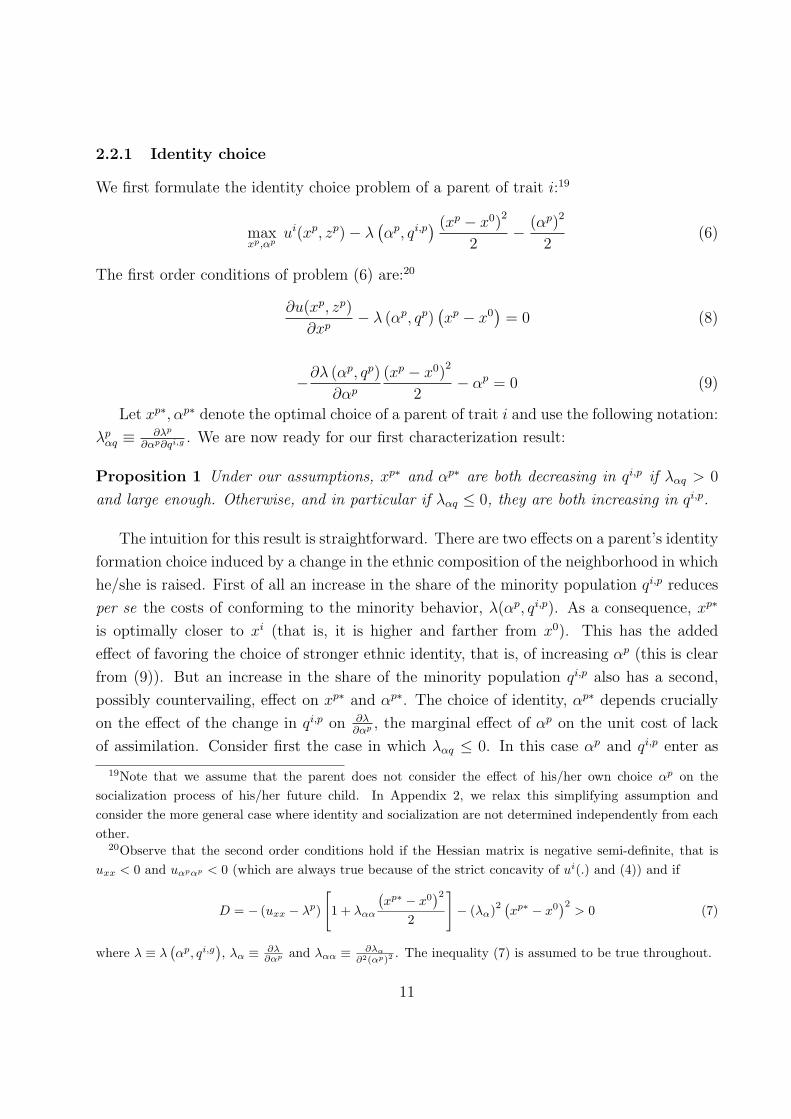
2.2.1 Identity choice
We first formulate the identity choice problem of a parent of trait i:19
maxxp,αp
ui(xp, zp)− λ(αp, qi,p
) (xp − x0)2
2− (αp)2
2(6)
The first order conditions of problem (6) are:20
∂u(xp, zp)
∂xp− λ (αp, qp)
(xp − x0
)= 0 (8)
−∂λ (αp, qp)
∂αp
(xp − x0)2
2− αp = 0 (9)
Let xp∗, αp∗ denote the optimal choice of a parent of trait i and use the following notation:
λpαq ≡ ∂λp
∂αp∂qi,g . We are now ready for our first characterization result:
Proposition 1 Under our assumptions, xp∗ and αp∗ are both decreasing in qi,p if λαq > 0
and large enough. Otherwise, and in particular if λαq ≤ 0, they are both increasing in qi,p.
The intuition for this result is straightforward. There are two effects on a parent’s identity
formation choice induced by a change in the ethnic composition of the neighborhood in which
he/she is raised. First of all an increase in the share of the minority population qi,p reduces
per se the costs of conforming to the minority behavior, λ(αp, qi,p). As a consequence, xp∗
is optimally closer to xi (that is, it is higher and farther from x0). This has the added
effect of favoring the choice of stronger ethnic identity, that is, of increasing αp (this is clear
from (9)). But an increase in the share of the minority population qi,p also has a second,
possibly countervailing, effect on xp∗ and αp∗. The choice of identity, αp∗ depends crucially
on the effect of the change in qi,p on ∂λ∂αp , the marginal effect of αp on the unit cost of lack
of assimilation. Consider first the case in which λαq ≤ 0. In this case αp and qi,p enter as
19Note that we assume that the parent does not consider the effect of his/her own choice αp on thesocialization process of his/her future child. In Appendix 2, we relax this simplifying assumption andconsider the more general case where identity and socialization are not determined independently from eachother.
20Observe that the second order conditions hold if the Hessian matrix is negative semi-definite, that isuxx < 0 and uαpαp < 0 (which are always true because of the strict concavity of ui(.) and (4)) and if
D = − (uxx − λp)
[1 + λαα
(xp∗ − x0
)22
]− (λα)2
(xp∗ − x0
)2> 0 (7)
where λ ≡ λ(αp, qi,g
), λα ≡ ∂λ
∂αp and λαα ≡ ∂λα
∂2(αp)2. The inequality (7) is assumed to be true throughout.
11
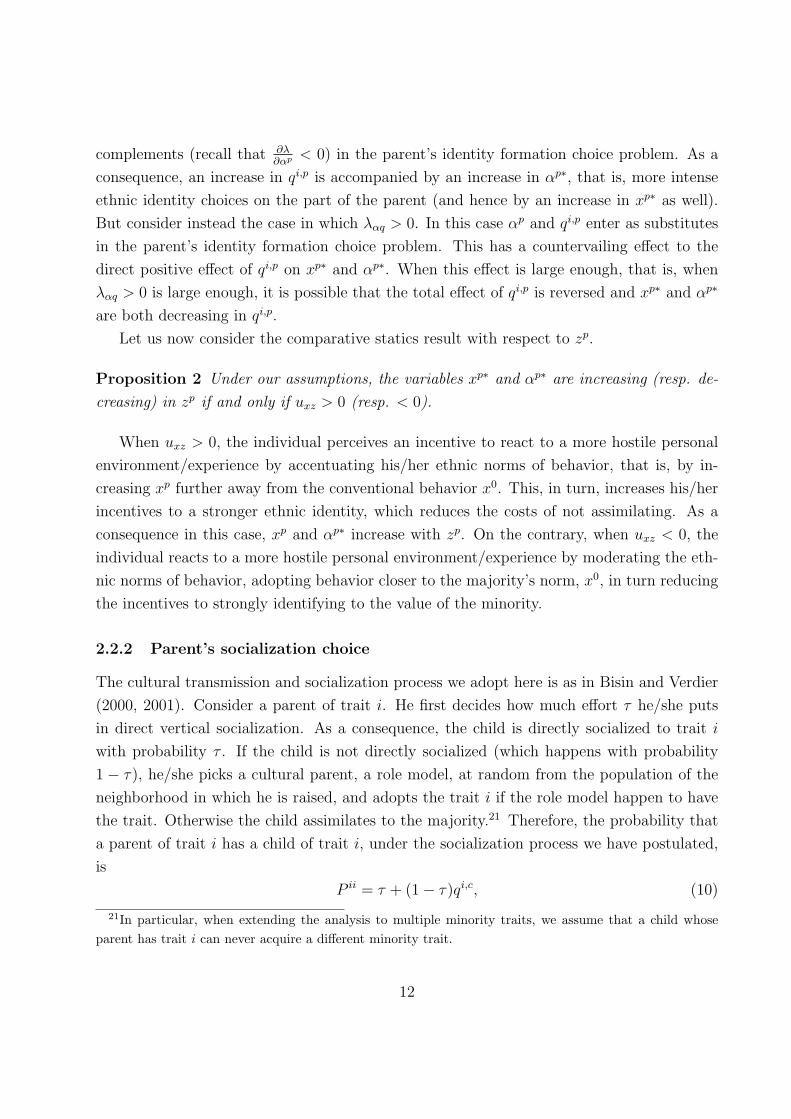
complements (recall that ∂λ∂αp < 0) in the parent’s identity formation choice problem. As a
consequence, an increase in qi,p is accompanied by an increase in αp∗, that is, more intense
ethnic identity choices on the part of the parent (and hence by an increase in xp∗ as well).
But consider instead the case in which λαq > 0. In this case αp and qi,p enter as substitutes
in the parent’s identity formation choice problem. This has a countervailing effect to the
direct positive effect of qi,p on xp∗ and αp∗. When this effect is large enough, that is, when
λαq > 0 is large enough, it is possible that the total effect of qi,p is reversed and xp∗ and αp∗
are both decreasing in qi,p.
Let us now consider the comparative statics result with respect to zp.
Proposition 2 Under our assumptions, the variables xp∗ and αp∗ are increasing (resp. de-
creasing) in zp if and only if uxz > 0 (resp. < 0).
When uxz > 0, the individual perceives an incentive to react to a more hostile personal
environment/experience by accentuating his/her ethnic norms of behavior, that is, by in-
creasing xp further away from the conventional behavior x0. This, in turn, increases his/her
incentives to a stronger ethnic identity, which reduces the costs of not assimilating. As a
consequence in this case, xp and αp∗ increase with zp. On the contrary, when uxz < 0, the
individual reacts to a more hostile personal environment/experience by moderating the eth-
nic norms of behavior, adopting behavior closer to the majority’s norm, x0, in turn reducing
the incentives to strongly identifying to the value of the minority.
2.2.2 Parent’s socialization choice
The cultural transmission and socialization process we adopt here is as in Bisin and Verdier
(2000, 2001). Consider a parent of trait i. He first decides how much effort τ he/she puts
in direct vertical socialization. As a consequence, the child is directly socialized to trait i
with probability τ . If the child is not directly socialized (which happens with probability
1 − τ), he/she picks a cultural parent, a role model, at random from the population of the
neighborhood in which he is raised, and adopts the trait i if the role model happen to have
the trait. Otherwise the child assimilates to the majority.21 Therefore, the probability that
a parent of trait i has a child of trait i, under the socialization process we have postulated,
is
P ii = τ + (1− τ)qi,c, (10)
21In particular, when extending the analysis to multiple minority traits, we assume that a child whoseparent has trait i can never acquire a different minority trait.
12

while the probability that a child does not adopt the trait i and is assimilated to the majority
is instead
P i0 = (1− τ)(1− qi,c
)(11)
Note that P ii and P i0 depend on qi,c, the ethnic composition of the neighborhood in which
the parent raise the child, which is not necessarily the same in which the parent himself has
been raised and which has influenced the parent’s identity choice, qi,p
If the child adopts trait i, he/she then chooses xc∗, αc∗. The child identity formation
process is analogous to the problem of his/her parent, characterized in the previous section:
(xc∗, αc∗) = arg max ui(xc, zc)− λ(αc, qi,c
) (xc − x0)2
2− (αc)2
2(12)
When making socialization choices parents correctly anticipate the identity formation
process that their children will possibly undergo. Thus, the parent’s socialization problem
consists in:
maxτ
(τ + (1− τ)qi,c
)(ui (xc∗, zp)− λ
(αp, qi,p
) (xc∗ − x0)2
2
)+(1−τ)
(1− qi,c
)ui(x0, zp
)−(τ)2
2
(13)
subject to (10),(11), and (12).
The first order condition of this problem is given by:
τ =(1− qi,c
)∆V (14)
where
∆V = ui (xc∗, zp)− λ(αp, qi,p
) (xc∗ − x0)2
2− ui
(x0, zP
)(15)
is the perceived altruistic utility gains of parents of trait i from having a non-assimilated
child. In this respect, ∆V captures the identity of the parent since it measures how important
it is for him/her that his/her child adopts his/her own trait i. Let τ ∗ denote the parent’s
socialization choice, the solution of socialization problem (13). Then we are ready for our
second characterization result.
Proposition 3 Under our assumptions, τ ∗ is decreasing in qi,c if either
1) zp, zc, qi,p, qi,c are such that xc ≤ xp and λcαq > 0 and large enough (so that xc is decreasing
in qi,c), or
2) zp, zc, qi,p, qi,c are such that xc ≥ xp and λcαq ≤ 0 (so that xc is increasing in qi,c).
13

Otherwise, and in particular if e.g., zp, zc, qi,p, qi,c are such that xc > xp and λcαq > 0 τ ∗
might be increasing in qi,c.
We provide an intuition for this result which identifies the different effects of a change
in the ethnic composition of the neighborhood in which the child grows up on the parent’s
socialization choice.22 An increase in qi,c increases the chance to transmit trait i, keeping
constant socialization effort τ (that is, P ii increases and P i0 decreases, see (10-11)). Even
if direct parental socialization is not successful, the child has therefore a higher probability
of adopting trait i through his/her interactions with a (random) cultural parent in the
population of the neighborhood. As a result, an increase in qi,c directly induces parents to
reduce their socialization effort τ (this effect is referred to in Bisin-Verdier (2000, 2001) as
cultural substitution). However, the expected utility of socialization for a parent depends
also on ∆V , the perceived altruistic utility gains from having a non-assimilated child. If∂∆V∂qi,c > 0 an increase in qi,c can have a countervailing effect on τ ∗23 which dominates the
cultural substitution effect. In this case τ ∗ is instead increasing with qi,c.
Sufficient conditions for ∂∆V∂qi,c ≤ 0 and hence for ∂τ∗
∂qi,c < 0, as 1) and 2) in the statement of
the proposition, are easily derived. We provide here the intuition for 1) and leave 2) to the
reader. Imperfect empathy implies that the parent’s altruistic utility gains are maximized
when xc∗ = xp∗. This is only the case, however when zc = zp, qi,c = qi,p. Suppose instead
that zp, zc, qi,p, qi,c are such that xc < xp, that is, the parent expect his/her child to behave
in a less characteristically ethnic manner than himself/herself (recall that, without loss of
generality, we ordered x so that x0 < xi, see (2), and hence x0 < xc < xp < xi). In this case,
the parent’s altruistic utility gains decrease in qi,c if xc is decreasing in qi,c, that is, from
Proposition 1, if λcαq > 0 and large enough.
To better understand the economic implication of this result, we can consider more in
detail the interesting case in which the parent expect his/her child to behave in a less
characteristically ethnic manner than himself/herself. In particular we can ask when would
this be the case, in terms of the ethnic environment the parent faces and expects the child
to face in the future, that is, in terms of zp, zc, qi,p, qi,c. It is easy to see that xc < xp would
obtain, for instance, if
uxz > 0 and zc < zp, and
22This result summarizes the most interesting implications of the model; in particular those that we canstudy empirically. However, we report in the Appendix, for completeness, the explicit comparative staticsof τ∗ with respect to zp, zc, qi,p, qi,c.
23As stated in the proposition, this is the case, for instance, if e.g., zp, zc, qi,p, qi,c are such that xc > xp
and xc is increasing in qi,c (that is, by Proposition 1, if λcαq > 0 and large enough).
14
qi,c ≥ qi,p (with λcαq > 0).
In other words, parents’ socialization effort is reduced the more segregated is the neigh-
borhood in which children are raised, e.g., if children leave in more segregated neighborhoods
than their parents were raised in (or in similar neighborhoods in terms of composition) and if
parents expect for their children a less hostile environment than they have themselves expe-
rienced. This is the case, in particular, if preferences (the same for parents and children) are
such that individuals react to an hostile environment accentuating his/her ethnic lifestyle
and if identity and ethnic segregation act as substitutes in their identity formation choice
problem.
We can also study the effects of a more hostile environment faced by parents when growing
up, zp, on their future socialization effort τ ∗. In fact τ ∗ increases with zp if and only if the
parents’ altruistic utility gain ∆V increases with zp.
Proposition 4 Under our assumption, τ ∗ is increasing in zp if and only if uxz > 0.
The intuition is straightforward. An increase in zp has two effects on ∆V . First, for any
given anticipated behavior of the child xc∗ > x0, the utility gain ui(xc∗, zp) − ui(x0, zp) of
having him being successfully socialized to the ethnic trait is affected by a change of the
environment zp. As a matter of fact given that the child’ behavior xc∗ is always larger than
the assimilated behavior x0, this utility gain is increased if and only if behavior x and hostile
environment z are complements in the utility function (ie. uxz > 0). On the other hand,
an increase in zp, if uxz > 0, has also the effect to increase the parent’s identity αp. As a
consequence the psychological costs associated by the parent to his/her child’s behavior xc∗
are smaller and his/her perceived altruistic utility gains, ∆V is again higher.
When we put the model to data, in the next section, we will document that socialization
effort is in fact less intense in more segregated neighborhood. We will assume that parents
and children have the same preferences and that (not without carrying over appropriate
robustness analysis) the neighborhood in which parents have been raised is not too dissimilar
in terms of ethnic composition than the neighborhood in which their children are raised.
Under these conditions, we will document that individuals react to an hostile environment
accentuating his/her ethnic lifestyle and that segregation induces less intense ethnic identity
and socialization choices, other things equal.
These results when interpreted through our theoretical model suggest that, in our data,
identity and ethnic segregation act as substitutes in the parents’ identity formation choice
problem and that ethnic preferences are reinforced in an hostile environment.
15

3 Empirical analysis of socialization and assimilation
In this section we put our model to the data. Our objective is to uncover the main deter-
minants of the process of ethnic assimilation and to assess their relative empirical relevance.
In particular, we aim at providing a quantitative assessment of the relationship between
neighborhood ethnic composition and socialization and identity formation.
Data. The scarcity of empirical work examining the importance of ethnic preferences
on individual behavior is partly due to the limited information and sample sizes on cultural
variables. Our analysis is made possible by the use of a unique UK data set, the Fourth
National Survey of Ethnic Minorities (FNSEM), which was collected in 1993/94 by the
Policy Studies Institute (PSI). FNSEM over-samples ethnic minority groups and explicitly
acknowledges the heterogeneity within the non-white population where the ethnic popula-
tion is composed of six groups (Caribbean, Indian, Pakistani, African-Asian, Bangladeshi,
and Chinese).24 It also contains detailed information about respondents’ identification with
their own ethnic group (e.g. attitudes towards inter-marriage, importance of religion and
other aspects of individual’s ethnic preferences) as well as variables aiming at capturing the
heterogeneity within the non-white population in terms of individual, demographic, family
and socio-economic characteristics (see Modood et al. 1997 for details). The data are merged
with the 1991 Census in order to get valuable information of each individual’s residential
ward.25
The respondents in the survey are the generations of the parents. We do not have
information about children after they have left the parents’ residence. Consequently, we
center the empirical analysis of our model on the identity choices and socialization decisions
of the parents. In terms of our theoretical model, this analysis requires proxies for different
key variables, notably for: (i) the ethnic composition of the neighborhood in which parents
and children live when socialization effort is made, qi,c, and the ethnic composition in the
neighborhoods in which the parents were raised and formed their identity, qi,p, (ii) the
intensity of the parents’ ethnic identity, αp, and their perceived altruistic utility gains ∆V ,
(iii) the exogenous determinants of the parents’ psychological costs of deviating from the
majority’s norms of behavior, zp, (iv), the parents’ socialization effort, τ . Let us now discuss
the different empirical proxies for these key variables.
(i) The ethnic composition of the neighborhood in which parents and children live, qi,c,
24For historical reasons Black Africans were not included. Furthermore, the survey only covers Englandand Wales.
25A UK Census ward contains on average 3,000-4,000 residents.
16

is observed at the level of the residential ward from the 1991 Census data. It has been
divided in seven classes, qi,c ≤ 2%, 2% < qi,c ≤ 5%, 5% < qi,c ≤ 10%, 10% < qi,c ≤ 15%,
15% < qi,c ≤ 25%, 25% < qi,c ≤ 33%, qi,c ≥ 33%. As usual, the mean value of each interval
is used in the regression analysis. Unfortunately, the data contain no information regarding
the neighborhood in which parents have been raised and have formed their identity, qi,p. We
therefore proxy qi,p with qi,c.
(ii) The intensity of the parents’ ethnic identity, αp and their perceived altruistic utility
gains, ∆V , are distinct in the theoretical analysis. Other things equal, however, they are
positively related (see equation (15)). Unfortunately, they cannot be separately proxied for
in the data. We therefore proceed using two alternative proxies for both αp and ∆V (and we
generally refer to them as measures of identity). The first proxy, denoted by ∆V1, is derived
from the responses to a direct question about the importance of ethnic identification. In fact,
in the FNSEM, the interviewees were asked if they agreed or disagreed and if so, whether
strongly or just a little, with the statement: “In many ways, I think of myself as [respondent’s
ethnic group]”. Over 80% of each group either agreed strongly or agreed that they thought
of themselves in terms of their own ethnic group, revealing that there is a strong sense of
ethnic identity amongst minority groups.
The second proxy, ∆V2, is instead a multidimensional measure constructed following
the standard approach in the sociological literature to derive quantitative information on
sensitive topics, such as delinquency or tobacco, alcohol and drug usage using qualitative
answers to a battery of related questions. The FNSEM contains a number of questions
providing information on different dimensions of identity, in particular importance of religion,
attitudes towards inter-marriage and the relevance of ethnicity in influencing the kind of
school that people want for their children. The precise questions are the following ones:
“Is religion to the way you live your life not at all important, not very important, fairly
important or very important?”; “If a close relative were to marry a white person would you
not mind, mind only a little, mind, mind very much?”; “Is ethnicity in choosing a school
for an eleven-years old child of yours not important, not very important, fairly important or
very important?” and “If the available schools were similar in other ways, what proportion
of one’s ethnic group would you like in your children’s school?”, with possible answers: no
preference, fewer than a half, about a half, more than a half. On the basis on this information,
a summated index is calculated for each respondent.26 The Crombach−α measure is then
26It ranges from 1 to 4 with mean and standard deviation equal to 3.52 and 0.69 respectively. We preservethe 1 to 4 scale of the original questions by coding the index in four categories (1 to 4). The results usingthe index as a continuous variable remain, however, qualitatively unchanged.
17

used to assess the quality of the derived variable. In our case, we obtain an α equal to 0.82
(0 ≤ α ≤ 1) indicating that the different items incorporated in the index have considerable
internal consistency.
(iii) Information on whether the parent has been harassed or discriminated for racial or
ethnic reasons is used to indicate personal experiences, that have an exogenous effect on the
identity formation, zp. More specifically, to construct zp, we use whether the individual has
been a victim of serious or light racial harassment (i.e., whether he/she has been attacked
or had their property damaged for reasons related to race or religion or simply insulted ),
whether he/she has experienced racial discrimination in getting a job and how many times,
whether he has ever had language-related problems at work (e.g. difficulty in getting a job
or over pay, health and safety or the union).
(iv) Parental socialization effort, τ , is measured using a dummy variable taking value one
if the respondent is married with a person of her/his own ethnic group and zero otherwise.27
It has been extensively documented in fact that interracial marriage is typically considered
as a sign of inclination toward cultural assimilation (see, in particular, Al-Johar, 2005; Qian,
1999; Meng and Gregory, 2005; Tucker and Mitchell-Kernan, 1990) and that marriage choices
are at least in part determined by parents’ preferences to socialize their children to their own
(the parents’) trait (see Bisin, Topa, and Verdier, 2004, and the evidence cited in Bisin and
Verdier, 2000).
Excluding the individuals with missing or inadequate information on our target variables,
we obtain a final sample of 3,420 individuals. Table 1 contains summary statistics on our
key variables.
[Insert Table 1 here]
Table 2 reports simple correlation coefficients between racial and ethnic personal expe-
riences, zp and the ethnic composition of the residential neighborhood, qi,c. Although the
correlations are low, it is interesting to note that most of the values are negative. This indi-
cates that episodes of harassment and discrimination tend to have relatively higher frequency
in mixed neighborhoods, i.e. when qi,c decreases.
[Insert Table 2 here]
27The empirical analysis has also been performed using information on the frequency of attendance toreligious services as an alternative proxy of socialization effort. The results remains qualitatively unchanged.
18

Empirical strategy The first prediction of the theoretical model we study empirically
is the parents’ socialization decison (equation (14)):
τ =(1− qi,c
)∆V.
While we can estimate this equation directly with our data, a correct identification of
the effects is more delicate. First of all, we need to account for the possibility that qi,c
is endogenous. For instance, whether a marriage is homogamous (which proxies for τ in
our analysis) can in principle affect where the family resides. Furthermore, the respondents
might have chosen a specific ward to reside in, before marriage, so as to facilitate the search
for a spouse of the same ethnic group. To address this issue we will restrict the sample to a
subset of respondents who are arguably ”constrained” on where they live.
A second econometric issue in the estimation of equation (14) is the possible endogeneity
of ∆V . Whether a marriage is homogamous can also affect the preferences of the parents, and
in particular the intensity of their ethnic identity. To this end we proceed by instrumenting
∆V . In this respect, the theoretical model directly suggests zp as an appropriate instrument.
In fact, zp affects τ only through its effect on αp and therefore on ∆V .28
Furthermore, estimating the relationship between ∆V (and αp, recall they cannot be
proxied separately) and zp and qi,p is of interest by itself as an analysis of the determinants
of identity.
We proceed as follows. In Section 3.1 we obtain a first quantitative evaluation of the
impact of (1− qi,c) ∆V on the socialization effort τ by performing a straight estimation
of equation (14). By doing so, we ignore the endogeneity problem associated to the iden-
tity choice ∆V . In Section 3.2, we then present an estimate of this effect obtained from
the two-stage instrumental variable approach, which is grounded on the theoretical model.
Specifically, we first estimate the likelihood to have a strong identity identity ∆V using zp as
an instrument. Then, using the estimated value of ∆V denoted by ∆V from the first stage,
we evaluate the impact of (1− qi,c) ∆V on τ . In this analysis we use the whole sample of
respondents. In Section 3.3, however, we deal with the endogeneity of qi,c by restricting the
sample, as already noted, to a subset of the agents whose residential location is arguably
exogenous.
28This is formally apparent from (14) and (15) as well as from the first order conditions of the parentsidentity choice problem, (8-9).
19

3.1 The direct estimation results
We first directly estimate equation (14) ignoring the endogeneity issue stemming from the
parents’ identity choice. Specifically, we consider the following regression model:29
τ = a(1− qi,c)∆V +M∑
m=1
βmym + ε, (16)
where ym (for m = 1, ...,M) is a set of M control variables accounting for individual, family
and residential neighborhood characteristics, and ε is a random error term. Our theoretical
analysis predicts the parameter a to be positive. Precise definitions of the control variables
used can be found in Appendix 3. Table A1 contains our sample descriptive statistics.
Table 3 reports the probit estimation results of model (16), where only a set of basic con-
trols is added (sex, age, education, household income and ward unemployment rate). The
first three columns (estimated coefficients, marginal effects and p−values respectively) refer
to the model specification where the first proxy for identity, ∆V1, is used, whereas the last
three columns contains the results based on the adoption of the alternative proxy ∆V2. It ap-
pears that the estimated coefficient a is as expected positive and highly significant regardless
of the proxy adopted, indicating that the effect of individual identity on the probability of
homogamy depends on the neighborhood ethnic composition. When the marginal effects of
identity for different levels of (1− qi,c) are calculated (bottom panel in Table 1), we find that
the (positive) impact gets larger in magnitude (with increasing levels of statistical signifi-
cance) the lower is qi,c, i.e. the more the individual ethnic group is in minority. For instance
using ∆V1, a marginal increase in identity, ∆V1, increases the probability of homogamy by
0.17% when qi,c is roughly greater than 25%, and the effect rises by roughly 50% (+0.25%)
when qi,c is lower than 5%. These results are robust with respect to alternative proxies of
identity, i.e. they are qualitatively the same and comparable in magnitude (only showing
slightly higher effects) when using ∆V2.
[Insert Table 3 here]
3.2 The two-stage estimation results
We now proceed with the two-stage instrumental variable estimation procedure. In the first
stage, we estimate the impact of qi,p and zp on ∆V . Recall however that we do not observe
29We do not add an index for individual observations to save on notational complexity.
20

qi,p and we proxy it by qi,c.30 In particular, in the first stage we estimate the following
regression model
∆V = δqi,p +L∑
l=1
γlzpl +
M∑m=1
βmym + u,
where yms are the controls for individual, family and residential neighborhood characteristics
(as in model (16), see Appendix 3 and Table A1), and u is a random error term. The vector
of instruments zpl (for l = 1, ..., L) collects personal negative race-related experiences of an
individual and it includes seven variables (L = 7), e.g., racial harassment episodes, personal
attacks due to race or religion, job discrimination. They are detailed in Appendix 3 (see Table
1 for our sample descriptive statistics). It is reasonable to postulate that these experiences do
not affect the probability of homogamy other than through their effects on the development
of the individual identity. Using a likelihood ratio test, we find in fact that we cannot reject
the hypothesis that the chosen exclusion restrictions are valid.
We perform the analysis for both proxies of identity ∆V1 and ∆V2. In other words, we
use as dependent variable an ordered response variable capturing the individual’s impor-
tance of ethnic identification obtained using the responses to a direct question about ethnic
identity (i.e. ∆V1) or using the indirect information about different dimensions of identity
(i.e. ∆V2). A standard ordered probit estimator is adopted to predict the probability to
have a strong preference for his/her ethnic group (i.e. to be in the last category in both
proxies). In addition to an extensive set of individuals’ observable characteristics (i.e., ed-
ucation, age, sex, fertility choices, health conditions, employment status, job qualification,
macro-region of residence and year of arrival in UK), we gradually introduce in the control
vector variables aiming at capturing the influence of the social environment (family, friends,
neighbors) and workplace using the language typically spoken in the family, with friends and
work. Differences in income and wealth across individuals are accounted by the inclusion of
household income, household bedrooms per component and household house ownership. We
also include the ward unemployment rate and the ward percentage of car owners. Observe
that these controls are also used at the second stage, allowing these variables to have a
different impact on different outcomes.
The first stage estimation results for the model specification including the more extensive
set of controls are contained in Table 4 (the first two columns concern the first measure of
30To assess the robustness of our results to this proxy, we have reproduced our empirical analysis on therestricted sample containing only families in which parents and grand-parents live together. We expect thissub-sample to contain a large fractions of parents who have not moved after marriage, for whom, therefore,qi,p = qi,c. Results in this sub-sample are not qualitatively different.
21
identity ∆V1, while the last two columns are for the second measure, namely ∆V2). It can be
seen that the directions of the effects of the instruments are the same for both proxies and
this is in line with the expectations.31 Observe that a higher density of own ethnic group
people in the ward, qi,p, is not associated with stronger ethnic identity. It shows a negative
effect regardless of the proxy of identity, although it is statistically significant only when
using the first proxy ∆V1.
[Insert Table 4 here]
In the second stage of our instrumental variable estimation procedure the predicted level
of ethnic identification is used in the estimation of the socialization equation (14) (model
(16).32 A standard probit estimator is employed. The estimation results for the model
specification including the more extensive sets of controls are contained in Table 5.33 This
table has the same structure as Table 3, i.e. the first and last three columns contain the
results using the (predicted) values of the first (∆V1) and second (∆V2) proxy for identity
respectively.
The estimated effects of the control variables are in line with the expectations. For
instance, being uneducated or having any kind of British qualification decreases the proba-
bility of homogamy whereas, on the contrary, having been educated in a foreign country has
a positive impact (although not statistically significant). A positive and significant effect is
also found if the respondent lives away from his/her parents or, on the other hand, if there is
a strong parental presence (i.e. high frequency of parental visits). Being female and having
children increase the probability of homogamy whereas household income seems to decrease
this likelihood. We also find that speaking English at home with older people, probably hap-
pening in less conservative families, as well as speaking English in the workplace, suggesting
a mixed working environment, decrease the probability of homogamy.
31Chi-squared tests confirm that the estimated coefficients of the instruments are jointly different fromzero in both model specifications.
32The first step residuals, i.e., the differences between actual ethnic identities and the first step predictionsare incorporated in the second-stage model.
33Because we use a generated variable, the variance-covariance matrix estimate of the second stage needsto be adjusted (see Wooldridge, 2002, p. 116). Using non-linear models (both in the first and second stage),the adjusted standard error estimates have no closed-form formula (Wooldridge, 2002, p.44). We reportthe unadjusted ones. However, the results based on bootstrapping 200 replications present slightly lowert−statistics, but they remain qualitatively unchanged. Also, the estimation results obtained using linearprobability models (that allows us to adjust the standard errors using a closed-form formula) are roughlythe same and qualitatively unchanged.
22

Let us now focus on our target variable, namely identity and let us investigate whether
the basic results of the impact of identity on the probability of homogamy contained in
Table 3 still hold once the effects of other confounding factors and endogeneity issues likely
to affect the identity variable are taken into account (Table 5). Similarly to Table 3, Table
5 reports in the bottom panel the marginal effects of identity for different levels of (1− qi,c).
The evidence collected in Table 3 is confirmed and the results are qualitatively the same.
The effects are only higher in magnitude, showing a more marked pattern across different
levels of (1− qi,c). Indeed, the increase in the probability of homogamy following a marginal
increase in identity, ∆V , at the observed increasing levels of qi,c raises from roughly 2% to
roughly 4% when using ∆V1 and from about 3.5% to about 6.5% when using ∆V2.
[Insert Table 5 here]
To summarize the results of the empirical analysis as a whole it is useful to refer to
Propositions 1-4. The theoretical results contained in the propositions identify the different
(often possibly countervailing) effects of ethnic composition and personal experiences, qi,c
and of zp, on identity and socialization, αp and τ . Recall that in the empirical analysis we
consider ∆V as a proxy for identity αp.
Consider first of all the effect of qi,c on ∆V (and αp) and τ. In this respect, in the
empirical analysis we find evidence that living in a ward with a higher percentage of own
ethnic minority group, qi,c, is associated with a lower identity, ∆V . This relationship is
represented in the upper portion of Figure 2. In the range of ethnic compositions we observe
in the data, the predicted probability of having a strong identity when using ∆V1 (measured
as the probability of reporting the highest allowed value of ethnic identity in the survey)
goes from roughly 0.60 to 0.42, respectively, in mixed and segregated neighborhood (we take
the average (predicted) probability for each observed level of qi,c). The use of our alternative
measure of identity, ∆V2, leads to a very similar range of (average) predicted values (from
about 0.58 in mixed neighborhood to about 0.39 in segregated neighborhoods).34
Furthermore, we document that, in terms of our model, socialization (as measured by the
homogamy rate τ) declines with segregation both due to the cultural substitution effect and
due to the effect of segregation on identity. The combined effect of qi,c on τ is represented
in the lower portion of Figure 2, which plots the total contribution of identity to homogamy
as a function of ethnic composition depurated of the effects of the controls, that is, τ =
a (1− qi,c) ∆V in the notation of equation (16).35 When identity is proxied by ∆V1, the
34These conclusion however depends on our proxying qi,p with qi,c.35As before, we consider the average estimated τ for each level of qi,c.
23
contribution of identity to homogamy reduces by more than a half going from mixed to
segregated neighborhood (i.e., from nearly 0.22 to 0.10 respectively). The range of the
effects is even wider and higher in magnitude with the alternative measure of identity, ∆V2,
going from about 0.48 to about 0.23, respectively, in mixed and segregated neighborhood.
[Insert F igure 2 here]
Our empirical analysis also documents a positive dependence of identity, αp, on the
negative racial and ethnic personal experiences, zp. This effect might exacerbate the effects
of mixed neighborhoods on identity formation and socialization. In mixed neighborhoods,
in fact, we find that episodes of light harassment and all types of episodes of discrimination
tend to have relatively higher frequency (see Table 2).
3.3 Endogeneity of location choices
Because of the possible endogeneity of location choice, in order to obtain unbiased results in
our context, we should be able to rule out the possibility that individuals decide to reside in
a ward for ethnicity-related issues.
Unfortunately our data source does not provide a direct question on the reasons un-
derlying the location of individuals in a given neighborhood. However, the questionnaire
asks the individuals their judgment on the quality of the residential area in terms of ethnic
composition and whether, given a location choice, they would prefer to move or to stay in
the area. We therefore select a sub-sample of respondent composed of individuals i) who
state that the neighborhood in which they reside is ”poor” for ”being with other people
of their own ethnic group” but nonetheless declare they they do not wish to move; and
individuals ii) who state that the neighborhood in which they reside is ”good” for ”being
with other people of their own ethnic group” but nonetheless declare they they do wish to
move. These two groups contain the individuals for whom, in our interpretation, the choice
of the residential neighborhood is likely to be exogenous with respect to their concerns about
the ethnic composition of the neighborhood. Consider indeed, for example, the individuals
belonging to the group in i). If their residential choice is driven by their concerns about
ethnicity-related issues, they should have declared to prefer to move out in order to search
for more satisfactory neighborhoods in terms of ethnic composition. The fact that they say
that they prefer to stay in that neighborhood signals that other reasons are driving their
location choice, such as budget constraint, distance to jobs, availability of local services or
other amenities, quality of accommodation, their concerns about their children’s education,
24
closeness to parents or other family reasons. A similar reasoning applies for the individual
belonging to the group in ii).
Thus, in order to check whether our evidence is driven by endogeneity issues stemming
from the individuals’ residential location choices, we run our analysis on these two sub-
samples. Unfortunately, because detailed questions about opinions and residential area are
not asked to the same people,36 the direct question about the importance of ethnic identi-
fication (from which ∆V1, is derived) is not in the questionnaire of the people in our two
sub-samples. Thus, we use in our analysis as a measure of ethnic identity only the indirect
information about different dimensions of identity (i.e. ∆V2). We display in Table 6 the
marginal effects of identity on the probability of homogamy for different levels of (1 − qi,p)
derived from the second stage results when the analysis is run on the two different sub-
samples.37 It appears that the results are not different across sub-samples and from the ones
referring to the whole sample (Table 5, bottom panel). Thus, the endogeneity of location
choices does not seem to be a major concern in our analysis.
[Insert Table 6 here]
As a consequence of the stringent requirements of our sub-samples selection, this exercise
is affected by small sample sizes (roughly 330 and 510 individuals in the two groups respec-
tively). Nevertheless, it contributes to gain confidence in the empirical test of our model by
providing a robustness check on difficult issues to tackle empirically.
4 Is Muslim identity different?
Many recent ethnic riots in Europe have concerned predominantly Muslim populations. This
is the case, for instance, of the riots in England in 2001 and in France in 2005, cited in
the Introduction. A large debate has consequently spurred in the press about the alleged
specificity of Muslim immigrants with regards to the strength of their identity and their (lack
36In the FSEM sample design, in each ethnic minority household, up to two adults were selected atrandom to answer questions about themselves. Because the number of questions to be asked would havemade the interview too long if everybody had been asked all of the possible questions, two versions ofthe questionnaire were used. They contain different level of detail on the different topics. In single adulthouseholds, the questionnaire was assigned at random.
37The complete list of both first and second stage results on all the control variables and for the twosub-samples is not reported here for brevity. The results remain qualitatively the same to the ones for thewhole sample and very similar across sub-samples. They are available upon request.
25
of) assimilation tendencies.38
Several of the ethnic groups for which we have data have in fact a significant Muslim
population; notably Pakistani and Bangladeshi are predominantly Muslim, while Indians
and African-Asian have substantial Muslim minorities. Furthermore, the FNSEM survey
contains a question asking the respondent to identify his religious faith. In this section we
exploit therefore our data to address directly the alleged Muslim specificity issue.
To this end we estimate our identity and socialization model on the restricted sample of
Muslim respondents (roughly the 43 percent of the whole sample). We maintain however
the distribution by ethnic group as the relevant neighborhood composition variable in the
identity formation and socialization processes.
Table 7 reports the marginal effects of identity on ethnic assimilation for different neigh-
borhood ethnic compositions (derived from the second step results).39 Comparing the results
obtained for the Muslim sub-sample (Table 7) with those obtained for the whole sample (Ta-
ble 5) it appears that i) Muslims tend to have in fact stronger identity effects in both mixed
and segregated neighborhood, but that ii) the qualitative results remain unchanged. Specif-
ically, the increase in the probability of homogamy following a marginal increase in Muslim
identity, ∆V , when qi,c increases, raises roughly from 3% to 7% when using ∆V1 and from
8% to 11% when using ∆V2 (while these effects range approximately from 2% to 4% and
from 3.5% to 6.5% respectively in the whole sample, see Table 5, bottom panel). How-
ever, the fact that we still obtain a decreasing impact of identity on ethnic assimilation at
increasing levels of qi,c signals that the relationship between ethnic assimilation effort and
ethnic neighborhood composition is not different for Muslims in respect of other minorities.
In other words, we still find evidence in line with the possibility that ethnic identity and
socialization effort are more intense in mixed rather than in segregated neighborhoods when
only the Muslim identity is considered.
[Insert Table 7 here]
38This position has been taken, in a rather extreme form, by several nationalist parties, e.g., the Lega inItaly, the Front Nationale in France. But similar though less extreme positions have been taken by center-right parties essentially all over Europe. A clear example of the inflamed rhetoric that often accompaniesthis debate is Fallaci (2006).
39First step results and the complete list of second step results (as reported, respectively, in Table 4 and5 for the whole sample) are available upon request.
26
5 Discussion of results and policy implications
In summary, our analysis of ethnic preferences and individual behavior of Caribbean, Indian,
Pakistani, African-Asian, Bangladeshi, and Chinese minorities in U.K. (1993/4), documents
the following empirical regularities. The main determinants of ethnic identity include per-
sonal negative racial or ethnic experiences as well as language spoken at home and with
friends, quality of housing, and structure of the family. Moreover, other things equal: i)
identity is less intense in more segregated neighborhoods; ii) socialization effort is less in-
tense in more segregated neighborhoods. Muslims do seem to display significantly specific
identification and socialization processes.
As already noted in the Introduction, all these results suggest that, while the different
integration policies implemented both in the U.S. and in Europe seem to have failed, this
might not be due uniquely to the persistence of segregated neighborhood, but possibly also
to the perverse effects of integrationist policies which might induce more intense ethnic
identities and stronger ethnic socialization efforts on the part of parents.
Furthermore, our results also might impact on the recent debate over the pros and cons of
the different assimilation policies adopted in the Anglo-Saxon world and in France. Immigra-
tion in France is based on the precept that everyone should assimilate to French values and
culture, while in the U.K. and in the U.S. a model of separate development is more openly
adopted. The documented reaction to mixed neighborhoods through identity choices and
socialization efforts seems to support, in this respect, the efficacy of separate development.
27

References
[1] Ainsworth-Darnell, J.W. and D.B. Downey (1998), “Assessing the Oppositional Culture
Explanation for Racial/Ethnic Differences in School Performance,” American Sociolog-
ical Review 63, 536-553.
[2] Alba, R.D. (1990), Ethnic Identity: The Transformation of White America, New Haven:
Yale University Press.
[3] Akerlof, G.A. (1980), “A Theory of Social Custom of which Unemployment May be One
Consequence,” Quarterly Journal of Economics 94, 749-775.
[4] Akerlof, G.A. (1997), “Social Distance and Social Decisions”, Econometrica 65, 1005-
1027.
[5] Akerlof, G.A. and R.E. Kranton (2000), “Economics and Identity,” Quarterly Journal
of Economics 115, 715-753.
[6] Al-Johar, D. (2005), “Muslim Marriages in America: Reflecting New Identities,” The
Muslim World 95, 557-574.
[7] Alesina, A.F. and E. La Ferrara, Eliana (2004), “Ethnic Diversity and Economic Per-
formance ” NBER Working Paper No. W10313, forthcoming in Journal of Economic
Literature.
[8] Austen-Smith, D. and R.D. Fryer, Jr (2005), “An Economic Analysis of ‘Acting White’,”
Quarterly Journal of Economics 120, 551-583.
[9] Ballester, C., Calvo-Armengol, A. and Y. Zenou (2005), “Who’s Who in Networks.
Wanted: The Key Player,” CEPR Discussion Paper No. 5329.
[10] Battu, H., M. Mwale and Y. Zenou (2005), “Oppositional Identities and the Labor
Market,” CEPR Discussion Paper No. No. 5351.
[11] Bernal, M.E. and G.P. Knight (1993), Ethnic Identity: Formation and Transmission
among Hispanics and Other Minorities, Albany: State University of New York Press.
[12] Bernheim, B.D. (1994), “A Theory of Conformity,” Journal of Political Economy 102,
841-877.
28

[13] Bisin, A. and T. Verdier (2000), “Beyond the Melting Pot: Cultural Transmission,
Marriage, and the Evolution of Ethnic and Religious Traits,” Quarterly Journal of
Economics 115, 955-988.
[14] Bisin, A. and T. Verdier (2001), “The Economics of Cultural Transmission and the
Dynamics of Preferences,” Journal of Economic Theory 97, 298-319.
[15] Bisin, A., Topa, G. and T. Verdier (2004), “Religious intermarriage and socialization in
the United States,” Journal of Political Economy 112, 615-664.
[16] Boyd, R. and P. J. Richerson (1985), Culture and the Evolutionary Process, Chicago:
University of Chicago Press.
[17] Cavalli-Sforza,L.L., and M. W. Feldman (1981), Cultural Transmission and Evolution.
Princeton: Princeton University Press.
[18] Cohen Zada, D. (2003), “Preserving Religious Values Through Education: Economic
Analyis and Evidence from the U.S.,” mimeo, Columbia University.
[19] Delpit, L. (1995), Other People’s Children: Cultural Conflict in the Classroom, New
York: The Free Press.
[20] Fall Fallaci, O. (2006), The Force of Reason, New York, Rizzoli.
[21] Fershtman, C. and Y. Weiss (1998), “Social Rewards, Externalities and Stable Prefer-
ences,” Journal of Public Economics 70, 53-73.
[22] Fordham, S. and J. Ogbu (1986), “Blacks Students’ School Successes: Coping with the
Burden of ‘Acting White’,” The Urban Review 18, 176-206.
[23] Fryer, R.G. Jr. and P. Torelli (2005), “An Empirical Analysis of ‘Acting White’,” NBER
Working Paper No. 11334.
[24] Gallis, P.(Coordinator) (2005): ‘Muslims in Europe: Integration Policies in Selected
Countries,’ CRS Report for Congress, Congressional Research Service, The Library of
Congress.
[25] Glaeser, E.L. and J. Scheinkman (2001), “Measuring social interactions,” in S.N. Durlauf
and H.P. Young (Eds.), Social Dynamics, Cambridge: MIT Press, pp. 83-132.
29

[26] Gussin Paley, V. (1995), Kwanzaa and Me: A Teacher’s Story, Cambdridge, Ma, Har-
vard University Press.
[27] Jacoby, T. (1998), Someone Else’s House: America’s Unfinished Struggle for Integration,
New York, Free Press.
[28] Jacoby, T. (1999), “Beyond Busing,” The Wall Street Journal, July 21st.
[29] Jellal, M. and F.C. Wolff (2002), “Cultural Evolutionary Altruism: Theory and Evi-
dence,” European Journal of Political Economy 18, 241-62.
[30] Kandel, E. and E.P. Lazear (1992), “Peer Pressure and Partnerships,” Journal of Po-
litical Economy 100, 801-817.
[31] Kling, J.R., Ludwig, J. and L.F. Katz (2005), “Neighborhood Effects on Crime for
Female and Male Youth: Evidence from a Randomized Housing Voucher Experiment,”
Quarterly Journal of Economics, 120, 87-130.
[32] Ludwig, J., Duncan, G.J. and Hirschfield, P. (2001), “Urban Poverty and Juvenile
Crime: Evidence from a Randomized Housing-Mobility Experiment,” Quarterly Journal
of Economics, 116, 655-679.
[33] Meng, X. and R.G. Gregory (2005), “Intermarriage and the Economic Assimilation of
Immigrants,” Journal of Labor Economics 23, 135-176.
[34] Modood, T., R. Berthoud, J. Lakey, J. Nazroo, P. Smith, S. Virdee, S. Beishon (1997),
Ethnic Minorities in Britain: Diversity and Disadvantage, London: Policy Studies In-
stitute.
[35] Ogbu, J.U. (1997), “Beyond Language: Ebonics, Proper English and Identity in a
Black American Speech Community,” Unpublished manuscript, University of California
at Berkeley, Department of Anthropology.
[36] Oreopoulos, P. (2003), “The Long-Run Consequences of Living in a Poor Neighbor-
hood,” Quarterly Journal of Economics 4, 1533-75.
[37] Patacchini, E. and Y. Zenou (2004), “Intergenerational Education Transmission: Neigh-
borhood Quality and/or Parents’ Involvement?”, CEPR Discussion Paper No. 4744.
[38] Patacchini, E. and Y. Zenou (2005), “Crime and Conformism,” CEPR Discussion Paper
No. 5331.
30
[39] Phinney, J.S. (1990), “Ethnic identity in adolescents and adults: Review of research,”
Psychological Bulletin 108, 499-514.
[40] Qian, Z. (1999), “Who Intermarries? Education, Nativity Region, and Interracial Mar-
riage 1980 and 1990,” Journal of Comparative Family Studies 30, 579-597.
[41] Saez-Marti’ M. and A. Sjogren (2006): ‘Peers and Culture,’ Mimeo, Research Institute
of Industrial Economics, Stockholm.
[42] Selod, H. and Y. Zenou (2006), “Does City Structure Affect the Labor Market Outcomes
of Black Workers?”, Economic Journal, forthcoming.
[43] Thernstrom A. and S. Thernstrom (2002), Beyond the Color Line: New Perspectives on
Race and Ethnicity in America, New York, Hoover Press and the Manhattan Institute.
[44] Tucker, M. B. and C. Mitchell-Kernan (1990), “New Trends in Black American Inter-
racial Marriage: The Social Structural Context,” Journal of Marriage and the Family,
52, 209-218.
[45] Wilson, W. J. (1987), The truly Disadvantaged: The Inner City, the Underclass, and
Public Policy, Chicago: University of Chicago Press.
[46] Wooldridge, J. (2002), The Econometric Analysis of Cross Section and Panel Data,
Cambridge: MIT Press.
[47] Whyte, W.F. (1943), Street Corner Society, Chicago, University of Chicago Press (New
Edition: 1993).
31
Appendix 1: Proofs of all propositions in the main text
Proof of Proposition 1: Let λpα = ∂λp
∂αp and similarly for λpq , λp
αα, λpαq, up
x, upxx. The
statement follows directly from an application of the Implicit Function Theorem to (8)−(9),
which gives:
∂xp∗
∂qi,p=−λp
q (xp∗ − x0)[λp
αα (xp∗ − x0)2/2 + 1
]+ λp
αλpαq (xp∗ − x0)
3/2
D
∂αp∗
∂qi,p=
(xp∗ − x0)2λp
αλpq + (up
xx − λ) λpαq (xp∗ − x0)
2/2
D
where D > 0 is the second order condition and defined by (7).
Proof of Proposition 2: Again the statement follows directly from an application of
the Implicit Function Theorem to (8)−(9), which gives:
dxp∗
dzp=
[λp
αα (xp∗ − x0)2/2 + 1
]up
xz
D
dαp∗
dzp=−λp
α (xp∗ − x0) upxz
Dwhere D > 0 is the second order condition and defined by (7).
Proof of Proposition 3: The statement follows directly from an application of the
Implicit Function Theorem to (14), which gives:
∂τ
∂qi,c= −∆V +
(1− qi,c
) ∂∆V
∂qi,c
where ui (xc∗, zp)− λ (αp, qi,p)(xc∗−x0)
2
2− ui
(x0, zP
)∂∆V
∂qi,c=[ui
x (xc∗, zp)− λ(αp, qi,p
) (xc∗ − x0
)] ∂xc∗
∂qi,c
By definition, xp∗ maximizes the function Θ(x) = ui (x, zp)− λ (αp, qi,p)(x−x0)
2
2
1) When xc∗ < xp∗, we have Θ′(xc∗) > 0 = Θ′(xp∗). Hence Θ′(xc∗) = [uix (xc∗, zp)− λ (αp, qi,p) (xc∗ − x0)] >
0 and the sign of ∂∆V∂qi,c is the same as the sign of ∂xc∗
∂qi,c . Thus when λcαq > 0 and large enough
(so that ∂xc∗
∂qi,c < 0), we immediately get∂∆V∂qi,c < 0. and ∂τ
∂qi,c < 0
2) When xc∗ ≥ xp∗, we have Θ′(xc∗) ≤ 0 = Θ′(xp∗). Hence Θ′(xc∗) = [uix (xc∗, zp)− λ (αp, qi,p) (xc∗ − x0)] ≤
0 and the sign of ∂∆V∂qi,c is the same as the sign of − ∂xc∗
∂qi,c . Thus when λcαq ≤ 0 (so that ∂xc∗
∂qi,c > 0),
we immediately get again ∂∆V∂qi,c ≤ 0. and therefore ∂τ
∂qi,c < 0.
32

• Note for completeness, we may also derive the impact of qi,p on the socialization τ ∗of
parents:
- When λpαq > 0 and large enough,
∂τ
∂qi,p< 0
∂τ
∂qi,p=(1− qi,c
) ∂∆V
∂qi,p=(1− qi,c
) (xc∗ − x0)2
2
[−λp
q − λpα
∂αp
∂qi,p
]Now using:
dαp
dqi,p=
(xp∗ − x0)2λp
αλpq + (up
xx − λp) λpαq (xp∗ − x0)
2/2
D
and
D = − (upxx − λp)
(λp
αα
(xp∗ − x0)2
2+ 1
)−[λp
α
(xp∗ − x0
)]2> 0
on obtains:
−λpq − λp
α
∂αp
∂qi,p=
1
D
λpq (up
xx − λ)
(λp
α:α(xp,∗−x0)
2
2+ 1
)+ λp
q (λpα (xp∗ − x0))
2
− (xp∗ − x0)2(λp
α)2λpq − λp
α (upxx − λ) λp
αq(xp,∗−x0)
2
2
Hence
−λpq − λp
α
∂αp
∂qi,p=
− (upxx − λp)
D
[−λp
q
(λp
αα
(xp∗ − x0)2
2+ 1
)+ λp
αλpαq
(xp∗ − x0)2
2
]
=− (up
xx − λ)
D (xp∗ − x0)
∂xp∗
∂qi,p
So according to Proposition 1, when λpαq > 0 and large enough, ∂xp∗
∂qi,p < 0 and therefore
−λpq − λp
α∂αp
∂qi,p < 0 as well as ∂∆V∂qi,p < 0. It follows directly that ∂τ
∂qi,p = (1− qi,c) ∂∆V∂qi,p < 0.
Proof of Proposition 4: Once again the statement follows directly from an application
of the Implicit Function Theorem to (14), which gives:
∂τ
∂zp=(1− qi,c
) ∂∆V
∂zp
where∂∆V
∂zp=[ui
z (xc∗, zp)− uiz
(x0, zp
)]− (xc∗ − x0)
2
2λp
α
∂αp
∂zp
33

As xc∗ > x0, the sign of the first term in bracket [uiz (xc∗, zp)− ui
z (x0, zp)] > 0 if and only if
uxz > 0. Similarly from Proposition (2), −λpα
∂αp
∂zp > 0 if and only if uxz > 0. Hence ∂∆V∂zp > 0
if and only if uxz > 0 and ∂τ∂zp > 0 if and only if uxz > 0.
• We derive, for completeness, the impact of expected environment zc of the kid on the
socialization effort τ ∗. Again, applying the Implicit Function Theorem to (14) gives:
∂τ
∂z,c=(1− qi,c
) ∂∆V
∂zc
but∂∆V
∂zc=[ui
x (xc∗, zp)− λ(αp, qi,p)
)(xc∗ − x0)
] dxc∗
dzc
Hence:
1) if uxz > 0, then ∂τ∂z,c ≥ 0 if and only if zp, zc, qi,p, qi,c are such that xc ≤ xp
2) if uxz < 0 then ∂τ∂z,c ≥ 0 if and only if zp, zc, qi,p, qi,c are such that xc ≥ xp
34

Appendix 2: Socialization and identity in thenon-myopic case
We assume in this appendix that the parent considers now jointly his/her behavior xp,
his/her identity choice αp as well as his/her socialization effort τ . The problem of the parent
is given by:
maxxp,αp,τ
ui(xp, zp)− λ(αp, qi,p
) (xp − x0)2
2− (αp)2
2− (τ)2
2(17)
+P ii
[ui (xc∗, zp)− λ
(αp, qi,p
) (xc∗ − x0)2
2
]+ P i0ui
(x0, zp
)s.t. P ii = τ + (1− τ)qi,c and P i0 = (1− τ)
(1− qi,c
)The first order conditions of problem (17) are:
∂u(xp, zp)
∂xp− λ
(αp, qi,p
) (xp − x0
)= 0 (18)
−∂λ (αp, qi,p)
∂αp
[(xp − x0)
2
2+ P ii (x
c∗ − x0)2
2
]− αp = 0 (19)
(1− qi,c
)∆V (αp, qi,c, qi,p)− τ = 0 (20)
with
∆V = ∆V (αp, qi,c, qi,p) = ui (xc∗, zp)− λ(αp, qi,p
) (xc∗ − x0)2
2− ui
(x0, zp
)We adopt, for convenience, the following notation:
A =(xp∗ − x0)
2
2+ P ii (x
c∗ − x0)2
2
Then, differentiation of (18), (19) and (20) gives:
upxx − λp −λp
α(xp∗ − x0) 0
−λpα(xp∗ − x0) −(1 + λp
αα A) −λpα(1− qi,c) (xc∗ − x0)
2/2
0 −λpα(1− qi,c) (xc∗ − x0)
2/2 −1
dxp
dαp
dτ
=
λp
q(xp − x0)dqi,p − uxzdzp
λpαqAdqi,p +
[λp
α(1− τ) (xc∗ − x0)2/2 + λp
αP ii (xc∗ − x0) dxc∗
dqi,c
]dqi,c[
(1− qi,c)λpq (xc∗ − x0)
2/2]dqi,p +
[∆V − (1− qi,c) [ui
xc − λp (xc∗ − x0)] dxc∗
dqi,c
]dqi,c − (1− qi,c) [uic
z − ui0z ] dzp
35

By the Second Order Condition (which are assumed to hold) the determinant Σ of the
left hand side matrix is negative and after inverting, we obtain: dxp
dαp
dτ
= [B]
λp
q(xp − x0)dqi,p − up
xzdzp
λpαqAdqi,p +
[λp
α(1− τ) (xc∗ − x0)2/2 + λp
αP ii (xc∗ − x0) dxc∗
dqi,c
]dqi,c[
(1− qi,c)λpq (xc∗ − x0)
2/2]dqi,p +
[∆V − (1− qi,c) [ui
xc − λp (xc∗ − x0)] dxc∗
dqi,c
]dqi,c
(21)
where
[B] =1
Σ
(1 + λpαα A)−
[λp
α(1− qi,c) (xc∗ − x0)2/2]2
−λpα(xp∗ − x0) Z1
−λpα(xp∗ − x0) −(up
xx − λp) Z2
Z1 Z2 Z3
where
Z1 = (λpα)2 (1− qi,c)(xp∗ − x0)
(xc∗ − x0)2
2> 0
Z2 = (upxx − λp)λp
α(1− qi,c)(xc∗ − x0)
2
2> 0
Z3 = −(upxx − λp)(1 + λp
αα A)− (λpα)2 (xp∗ − x0)2 > 0
In term of socialization, we have then a characterization similar to that of in the main
text
Proposition A1 The effect of qi,p on τ ∗ is generally ambiguous. However, for λαq > 0
and large enough, τ ∗ is decreasing in qi,c.
Proof. Using (21) and recalling that Σ < 0, the sign of dτ∗
dqi,c is given by the sign of:
−(upxx − λp)λp
α(1− qi,c)(xc∗ − x0)
2
2
[λp
α(1− τ)(xc∗ − x0
)2/2 + λp
αP ii(xc∗ − x0
) dxc∗
dqi,c
](22)
+[(up
xx − λp)(1 + λpαα A) + (λp
α)2 (xp − x0)2] [
∆V − (1− qi,c)[ui
xc − λp
(xc∗ − x0
)] dxc∗
dqi,c
]The first term
−(upxx − λp) (λp
α)2 (1− qi,c)(xc∗ − x0)
2
2
[(1− τ)
(xc∗ − x0
)2/2 + P ii
(xc∗ − x0
) dxc∗
dqi,c
]< 0
(23)
36

when λαq > 0 and large enough. Indeed in such a case dxc∗
dqi,c is negative and[(1− τ) (xc∗ − x0)
2/2 + P ii (xc∗ − x0) dxc∗
dqi,c
]can be as well negative ( if dxc∗
dqi,c is sufficiently negative)
The sign of the second term in bracket is:
[(up
xx − λp)(1 + λpαα A) + (λp
α)2 (xp − x0)2] [
∆V − (1− qi,c)[ui
xc − λp
(xc∗ − x0
)] dxc∗
dqi,c
]< 0
(24)
Indeed, this sign is negative when the partial maximization problem on xp and αp hold-
ing τ constant is convex and well defined as : D = − (upxx − λp)
[λp
αα (xp∗ − x0)2/2 + 1
]−
[λpα (xp∗ − x0)]
2> 0 (as would be implied by the Second Order Condition of that maxi-
mization problem) and when the cultural ”substitutability” effect of qi,c on τ ∗ (see Bisin
and Verdier 2001) is strong enough. Indeed when , zp, zc, qi,p, qi,c are such that xc ≤ xp
(ie.uixc−λp (xc∗ − x0) > 0) and λc
αq > 0 and large enough (ie. so that xc is decreasing in qi,c)
we have that[∆V − (1− qi,c) [ui
xc − λp (xc∗ − x0)] dxc∗
dqi,c
]> 0. and the second term in bracket
in (24) is negative
Hence, in general, the sign of dτ∗
dqi,p is ambiguous. However, when λpαq > 0 and large
enough, the two terms in (24) are negative and thus dτ∗
dqi,c < 0.
There are intuitively three effects of a change of qi,c on τ ∗. First, an increase in qi,c, by
the standard cultural substitutability effect, tends to reduce the socialization effort τ . (ie
the term [(up
xx − λp)(1 + λpαα A) + (λp
α)2 (xp − x0)2]∆V < 0
in (24)). At the same time, however, the optimal expected behavior of the child xc∗ is also
affected. When xc∗ ≤ xp∗ and that xc∗ is decreasing in qi,c this effect, as in the myopic case
of the main text, tends to reduce the gains from socialization ∆V . (ie the term
[(up
xx − λp)(1 + λpαα A) + (λp
α)2 (xp − x0)2] [−(1− qi,c)
[ui
xc − λp
(xc∗ − x0
)] dxc∗
dqi,c
]< 0
in (24)). This as well decreases τ .
The third effect is indirect and goes through how an increase in qi,c affects the identity
choice αp. This can be itself decomposed into two elements. First, an increase in qi,c increases
the probability P ii to transmit successfully trait i. This, in turn, enhances the incentives to
identify to the values of that group and therefore increases αp. This effect leads in turn to
an increase in ∆V , and τ is positively affected (this is related to the term
−(upxx − λp) (λp
α)2 (1− qi,c)(xc∗ − x0
)2/2[(1− τ)
(xc∗ − x0
)2/2]
> 0
37

in (23)). Second, an increase in qi,c again tends to affect the optimal expected behavior of
the child xc∗. As a matter of fact when xc∗ is decreasing in qi,c, this tends to decreases the
psychological cost of a parent to perceive his child deviating from the norm λP ii (xc∗−x0)2
2,
which in turn leads to a lower value of identification αp. The consequence of this is negative
impact on τ (the term
−(upxx − λp) (λp
α)2 (1− qi,c)(xc∗ − x0)
2
2P ii(xc∗ − x0
) dxc∗
dqi,c< 0
in (23)). When λpαq > 0 and large enough, this negative term dominates the other one and
the indirect effect of qi,c on τ through changes in identity choice αp is negative.
The comparative statics with regards to zp is straightforward.
Proposition A.2 The variable τ ∗ is increasing in zp iff upxz > 0. It is decreasing other-
wise.
Proof. Using (21) and recalling that Σ < 0, the sign of dτ∗
dzp is the same as the sign of
(λpα)2 (1−qi,c)(xp−x0)
(xc∗ − x0)2
2up
xz−[(up
xx − λp)(1 + λpαα A) + (λp
α)2 (xp − x0)2](1−qi,c)
[uic
z − ui0z
]> 0 iff up
xz > 0
When zp increases, the optimal behavior of the parent becomes higher if and only if the
parent ”overacts”. This first leads to a larger identification choice αp, which increases ∆V,
and socialization effort τ ∗. Second it also affects directly ∆V by changing the preceived
utility gain of socialization ui (xc∗, zp) − ui (x0, zp). As xc∗ > x0, the sign of the rate of
change of that term [uiz (xc∗, zp)− ui
z (x0, zp)] > 0 if and only if uxz > 0., which again in this
case will increase ∆V, and socialization effort τ ∗.
38

Appendix 3: Definition of variables
Serious racial harassment: dummy variable taking value one if the respondent has been attacked
in the last year for reasons to do with race or color.
Racial harassment: dummy variable taking value one if the respondent has been insulted in the
last year for reasons to do with race or color.
Serious job related language problems: dummy variable taking value one if the respondent had
any sort of difficulties getting work and at work because of language problems.
Job related language problems at work: dummy variable taking value one if the respondent had
any sort of difficulties either getting work or at work because of language problems.
Discrimination in getting a job: dummy variable taking value one if the respondent had been
refused a job for reasons which were to do with race or color, or religious or cultural background.
Serious discrimination in getting a job: dummy variable taking value one if the respondent
had been refused a job for reasons which were to do with race or color, or religious or cultural
background more than once.
Discrimination in the workplace: dummy variable taking value one if the respondent had been
treated unfairly at work with regard to promotion or a move to a better position for reasons which
were to do with race or color, or religious or cultural background more than once.
Age: respondent’s age in years.
Good health: dummy variable taking value one if the respondent had no long-standing illness,
disability or infirmity.
Children: dummy variable taking value one if the respondent has children.
Number of children: number of respondent’s children.
Female: dummy variable taking value one if the respondent is female.
Years since arrival: number of years since respondent’s arrival in UK.
No parents: dummy variable taking value one if both respondent’s parents are dead or if both
live away from respondent.
Parents’ physical contacts: number of times the respondent has seen the parents in the last four
weeks.
Parents’ telephone calls: number of times the respondent has spoken to the parents on the
telephone in the last four weeks.
Parents’ letters: number of letters received by the parents in the last four weeks.
No British qualification: dummy variable taking value one if the respondent has no UK quali-
fication
39

British basic qualification: dummy variable taking value one if the respondent has a UK basic
level of education.
British O-level qualification: dummy variable taking value one if the respondent has a UK
O-level qualification (or equivalent).
British A-level or higher qualification: dummy variable taking value one if the respondent has
a UK A-level (or equivalent) or above qualification.
Foreign qualification: dummy variable taking value one if the respondent has a qualification
achieved abroad.
Unemployed: dummy variable taking value one if the respondent is unemployed (occupational
groups dummies).
Self-employed: dummy variable taking value one if the respondent is self-employed (occupational
groups dummies).
Manager: dummy variable taking value one if the respondent is a manager (occupational groups
dummies).
Employees: dummy variable taking value one if the respondent is an employee (occupational
groups dummies).
English spoken at home (older): dummy variable taking value one if English is the language
normally spoken at home by the respondent to members of the family who are older.
English spoken at home (younger): dummy variable taking value one if English is the language
normally spoken at home by the respondent to members of the family who are younger.
English spoken at work: dummy variable taking value one if English is the language normally
spoken at work by the respondent.
English spoken with friends: dummy variable taking value one if English is the language nor-
mally spoken with friends (outside work) by the respondent.
Ward density of no car owners: percentage of no car owners in the ward (divided in four classes,
coded 1 to 4).
Ward unemployment rate: ward unemployment rate (divided in five classes: 2%-5%, 5%-10%,
10%-15%, 15%-20%, 20% and above; mean value taken for each class).
Bedrooms per person: number of bedrooms per household component.
Home owner: dummy variable taking value one if the respondent’s household owns the house.
Household income: respondent’s household total income from all sources, before tax (divided
in sixteen classes, mean value taken for each class).
40

Table A1: Descriptive Statistics for control variables
Variable Mean St.dev. Min Max
Age 41.12 13.09 18 97 Female 0.47 0.50 0 1 Children 0.82 0.39 0 1 Number of children 1.92 1.06 1 6 Years since arrival 26.88 10.38 1 55 Good health 0.78 0.41 0 1 British basic qualification 0.12 0.32 0 1 British O-level qualification 0.15 0.36 0 1 No British qualification 0.68 0.47 0 1 British A-level or higher qualification 0.23 0.42 0 1 Foreign qualification 0.28 0.45 0 1 Unemployed 0.13 0.33 0 1 Self-employed 0.12 0.33 0 1 Manager 0.03 0.17 0 1 Employee 0.51 0.50 0 1 No parents 0.33 0.47 0 1 Parents' physical contacts 3.52 7.05 0 28 Parents' telephone calls 4.16 7.33 0 60 Parents' letters 0.50 0.94 0 7 English spoken at home (older) 0.06 0.24 0 1 English spoken at home (younger) 0.23 0.42 0 1 English spoken with friends 0.25 0.44 0 1 English spoken at work 0.24 0.43 0 1 Household income 272.01 190.04 77 789 Bedrooms per person 0.77 0.35 0.16 2.5 Home owner 0.76 0.43 0 1 Ward unemployment rate 14.35 5.23 3.5 20 Ward density of no car owners 3.52 0.69 1 4
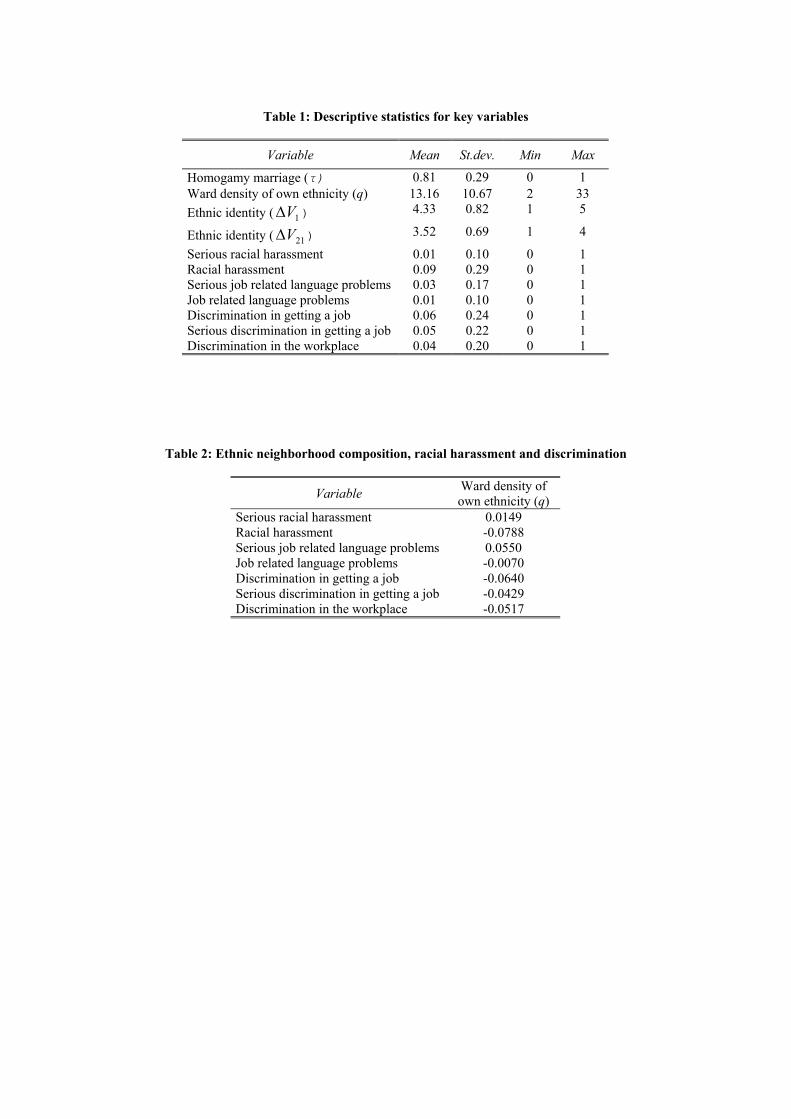
Table 1: Descriptive statistics for key variables
Variable Mean St.dev. Min Max
Homogamy marriage (τ) 0.81 0.29 0 1 Ward density of own ethnicity (q) 13.16 10.67 2 33 Ethnic identity ( 1V∆ ) 4.33 0.82 1 5
Ethnic identity ( 21V∆ ) 3.52 0.69 1 4
Serious racial harassment 0.01 0.10 0 1 Racial harassment 0.09 0.29 0 1 Serious job related language problems 0.03 0.17 0 1 Job related language problems 0.01 0.10 0 1 Discrimination in getting a job 0.06 0.24 0 1 Serious discrimination in getting a job 0.05 0.22 0 1 Discrimination in the workplace 0.04 0.20 0 1
Table 2: Ethnic neighborhood composition, racial harassment and discrimination
Variable Ward density of own ethnicity (q)
Serious racial harassment 0.0149 Racial harassment -0.0788 Serious job related language problems 0.0550 Job related language problems -0.0070 Discrimination in getting a job -0.0640 Serious discrimination in getting a job -0.0429 Discrimination in the workplace -0.0517
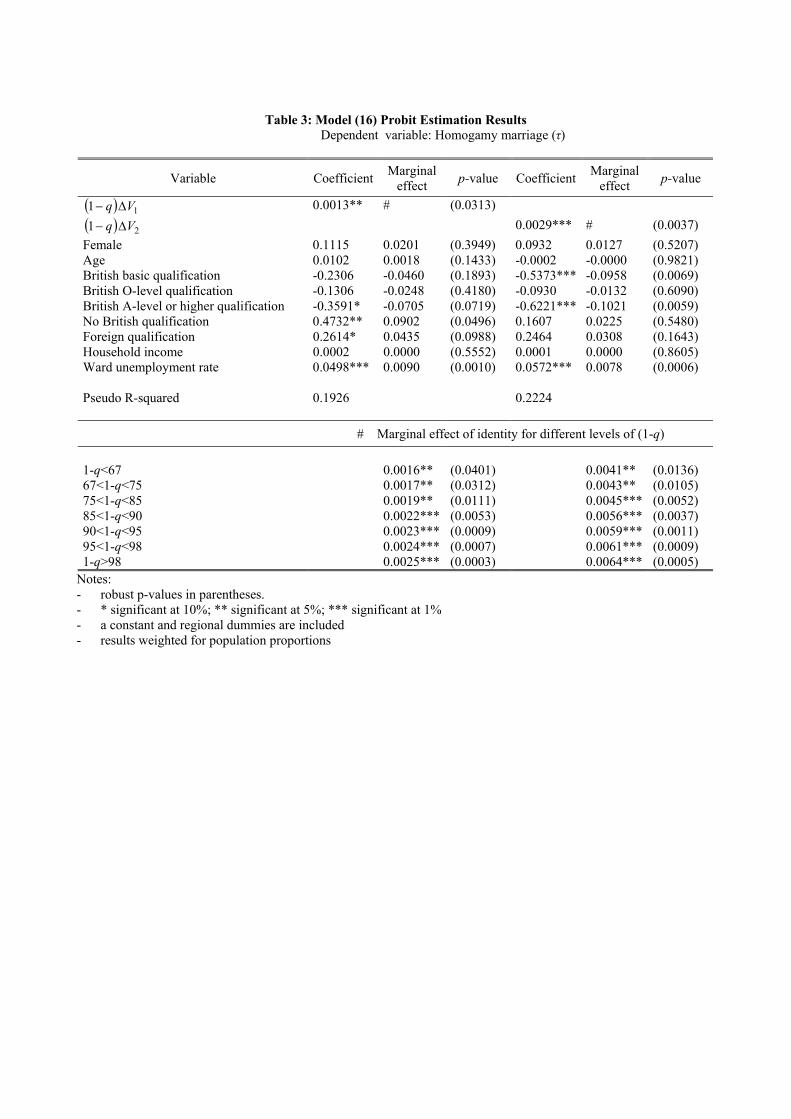
Table 3: Model (16) Probit Estimation Results
Dependent variable: Homogamy marriage (τ)
Variable Coefficient Marginal effect p-value Coefficient Marginal
effect p-value
( ) 11 Vq ∆− 0.0013** # (0.0313) ( ) 21 Vq ∆− 0.0029*** # (0.0037) Female 0.1115 0.0201 (0.3949) 0.0932 0.0127 (0.5207) Age 0.0102 0.0018 (0.1433) -0.0002 -0.0000 (0.9821) British basic qualification -0.2306 -0.0460 (0.1893) -0.5373*** -0.0958 (0.0069) British O-level qualification -0.1306 -0.0248 (0.4180) -0.0930 -0.0132 (0.6090) British A-level or higher qualification -0.3591* -0.0705 (0.0719) -0.6221*** -0.1021 (0.0059) No British qualification 0.4732** 0.0902 (0.0496) 0.1607 0.0225 (0.5480) Foreign qualification 0.2614* 0.0435 (0.0988) 0.2464 0.0308 (0.1643) Household income 0.0002 0.0000 (0.5552) 0.0001 0.0000 (0.8605) Ward unemployment rate 0.0498*** 0.0090 (0.0010) 0.0572*** 0.0078 (0.0006) Pseudo R-squared 0.1926 0.2224 # Marginal effect of identity for different levels of (1-q) 1-q<67 0.0016** (0.0401) 0.0041** (0.0136) 67<1-q<75 0.0017** (0.0312) 0.0043** (0.0105) 75<1-q<85 0.0019** (0.0111) 0.0045*** (0.0052) 85<1-q<90 0.0022*** (0.0053) 0.0056*** (0.0037) 90<1-q<95 0.0023*** (0.0009) 0.0059*** (0.0011) 95<1-q<98 0.0024*** (0.0007) 0.0061*** (0.0009) 1-q>98 0.0025*** (0.0003) 0.0064*** (0.0005)
Notes: - robust p-values in parentheses. - * significant at 10%; ** significant at 5%; *** significant at 1% - a constant and regional dummies are included - results weighted for population proportions

Table 4: First Stage Ordered Probit Estimation Results (1) Dependent variable: Ethnic group identification ( 1V∆ ) (2) Dependent variable: Ethnic group identification ( 2V∆ )
(1) (2)
Variable Coefficient p-value Coefficient p-value
Serious racial harassment 1.1826* (0.0778) 0.0249 (0.9687) Racial harassment 0.0265 (0.9241) 0.3132 (0.3669) Serious job related language problems 0.0081 (0.9879) 1.5024*** (0.0062) Job related language problems at work 8.7407*** (0.0000) 6.1505*** (0.0000) Discrimination in getting a job -0.9352* (0.0501) -0.6211 (0.3046) Serious discrimination in getting a job 1.1710** (0.0368) 1.6266** (0.0190) Discrimination in the workplace -0.2857 (0.4275) -0.1477 (0.6557) Ward density of own ethnic group (q) -0.0174* (0.0874) -0.0090 (0.4360) Years since arrival -0.0161 (0.2413) -0.0457** (0.0109) English spoken at home (older) -0.7359** (0.0425) -0.4007 (0.3582) English spoken at home (younger) 0.2266 (0.4229) -0.3771 (0.2473) English spoken at work 0.7853*** (0.0037) 0.3687 (0.2518) English spoken with friends -0.6561*** (0.0085) 0.0902 (0.7917) No parents -0.1446 (0.4718) -0.0532 (0.8176) Parents' physical contacts -0.0008 (0.9556) 0.0093 (0.6385) Parents' telephone calls 0.0272* (0.0560) 0.0254 (0.1258) Parents' letters 0.1545 (0.1118) 0.2312** (0.0500) Female -0.0076 (0.9740) 0.4245* (0.0786) Age -0.0018 (0.9043) 0.0771*** (0.0000) Children -0.1433 (0.7436) 0.2406 (0.5259) Good health 0.2323 (0.3426) 0.2967 (0.2698) British basic qualification 0.1908 (0.6015) 0.5947* (0.0759) British O-level qualification -0.2836 (0.3749) -0.5674* (0.0948) British A-level or higher qualification 0.4357 (0.2233) -0.1645 (0.6406) No British qualification 0.2218 (0.5732) -0.4957 (0.2673) Foreign qualification -0.7300*** (0.0066) -0.2519 (0.3517) Unemployed -0.2566 (0.4336) 0.6299* (0.0802) Self-employed 0.1441 (0.7238) -0.4560 (0.3048) Manager 0.7228 (0.1966) -0.0385 (0.9550) Employee 2.0171** (0.0157) 0.1594 (0.8220) Bedrooms per person -0.0506 (0.9034) -1.0398*** (0.0037) Household income -0.0003 (0.6141) -0.0004 (0.5249) Home owner -0.4073* (0.0930) -0.0267 (0.9262) Ward unemployment rate -0.0068 (0.7861) 0.0267 (0.3232) Number of children 0.2522** (0.0246) -0.1602 (0.1763) Ward density of no car owners 0.1727 (0.2924) 0.1382 (0.3117) Pseudo R-squared 0.1284 0.3005
Notes: - robust p-values in parentheses. - * significant at 10%; ** significant at 5%; *** significant at 1% - a constant and regional dummies are included - results weighted for population proportions - variables used as instruments (z) are in italics

Table 5: Second Stage Probit Estimation Results Dependent variable: Homogamy marriage (τ)
Variable Coefficient Marginal effect p-value Coefficient Marginal
effect p-value
( ) 11 Vq ∆− 0.0297* # (0.0999) ( ) 21 Vq ∆− 0.0842** # (0.0342) Years since arrival -0.1492*** -0.0332 (0.0018) -0.2896*** -0.0684 (0.0083) English spoken at home (older) -1.9610* -0.0156 (0.0754) -3.1962** -0.0334 (0.0243) English spoken at home (younger) 1.6163** 0.0099 (0.0293) 1.7121* 0.0000 (0.0718) English spoken at work -1.4263* -0.0456 (0.0985) -2.3838** -0.0567 (0.0222) English spoken with friends 4.1402*** 0.0777 (0.0092) 5.1449*** 0.0656 (0.0015) No parents 2.3300** 0.0598 (0.0175) 3.4804*** 0.0344 (0.0004) Parents' physical contacts 0.5240*** 0.0215 (0.0095) 0.9890*** 0.0108 (0.0040) Parents' telephone calls -0.0190 -0.0005 (0.7036) -0.1012 -0.0009 (0.1432) Parents' letters 0.0915 0.0088 (0.6712) 0.4929 0.0000 (0.1744) Female 2.1656*** 0.0511 (0.0038) 3.7997*** 0.0234 (0.0003) Age 0.0571* 0.0023 (0.0895) 0.0749 0.0000 (0.2551) Children 2.6066** 0.0000 (0.0403) 5.1203*** 0.0000 (0.0001) Good health -0.0394 -0.0000 (0.9339) -1.1129 0.0002 (0.1916) British basic qualification -2.3320** -0.0600 (0.0115) -3.9137*** -0.0785 (0.0024) British O-level qualification -1.9414*** -0.0588 (0.0044) -3.1368** -0.0354 (0.0116) British A-level or higher qualification -13.0458*** -0.0978 (0.0000) -15.8200*** -0.1687 (0.0001) No British qualification -13.1738*** -0.1089 (0.0000) -16.7169*** -0.0999 (0.0000) Foreign qualification 0.9580 0.0509 (0.2448) 0.7249 0.0906 (0.5291) Unemployed 0.2034 0.0002 (0.7480) -1.4035 -0.0000 (0.1265) Self-employed -0.3807 -0.0003 (0.7686) 2.8890 0.0000 (0.1860) Manager 2.9421*** 0.0710 (0.0092) 10.0067*** 0.0889 (0.0030) Employee -1.0315 -0.0404 (0.3931) 1.4450 0.0555 (0.3773) Bedrooms per person 2.7165 0.0643 (0.1132) 2.9900** 0.0932 (0.0318) Household income -0.0083** -0.0018 (0.0129) -0.0136*** -0.0000 (0.0001) Home owner 1.5223* 0.0043 (0.0916) -0.6763 0.0221 (0.4752) Ward unemployment rate 0.0231 0.0052 (0.6049) -0.0489 -0.0010 (0.5268) Number of children 1.9528*** 0.4344 (0.0029) 2.3196*** 0.2808 (0.0005) Ward density of no car owners -0.3746 -0.0833 (0.2530) 0.1434 0.0077 (0.7776) Pseudo R-squared 0.7076 0.7317 # Marginal effect of identity for different levels of (1-q) 1-q<67 0.0199* (0.0744) 0.0343** (0.0273) 67<1-q<75 0.0225** (0.0431) 0.0398** (0.0201) 75<1-q<85 0.0266** (0.0321) 0.0425** (0.0145) 85<1-q<90 0.0303** (0.0113) 0.0450*** (0.0063) 90<1-q<95 0.0323*** (0.0028) 0.0569*** (0.0022) 95<1-q<98 0.0365*** (0.0011) 0.0606*** (0.0006) 1-q>98 0.0394*** (0.0008) 0.0646*** (0.0000)
Notes: - robust p-values in parentheses. - * significant at 10%; ** significant at 5%; *** significant at 1%. - a constant and regional dummies are included. - results weighted for population proportions.

Table 6: Marginal effect of identity on ethnic assimilation for different levels of (1-q) in different sub-samples Sub-sample (1): individuals declaring that their residential area is poor for being with other people of their
own ethnic group but prefer to stay Sub-sample (2): individuals declaring that their residential area is good for being with other people of their
own ethnic group and are willing to move out from the area
Sub-sample (1) Sub-sample (2)
Marginal effect p-value Marginal effect p-value
1-q<67 0.0401** (0.0301) 0.0321** (0.0355) 67<1-q<75 0.0419** (0.0213) 0.0363** (0.0310) 75<1-q<85 0.0459** (0.0177) 0.0395** (0.0252) 85<1-q<90 0.0492*** (0.0099) 0.0452** (0.0203) 90<1-q<95 0.0562*** (0.0055) 0.0509*** (0.0100) 95<1-q<98 0.0625*** (0.0016) 0.0557*** (0.0038) 1-q>98 0.0699*** (0.0012) 0.0588*** (0.0025)
Table 7: Marginal effect of identity on ethnic assimilation for different levels of (1-q) in the Muslim sub-sample
(1): predicted 1V∆
(2): predicted 2V∆
(1) (2)
Marginal effect p-value Marginal effect p-value
1-q<67 0.0303** (0.0298) 0.0813** (0.0488) 67<1-q<75 0.0312** (0.0255) 0.0836** (0.0437) 75<1-q<85 0.0349** (0.0201) 0.0866** (0.0394) 85<1-q<90 0.0404** (0.0109) 0.0945** (0.0301) 90<1-q<95 0.0514*** (0.0076) 0.0985** (0.0221) 95<1-q<98 0.0655*** (0.0044) 0.0995** (0.0131) 1-q>98 0.0701*** (0.0031) 0.1077*** (0.0098)
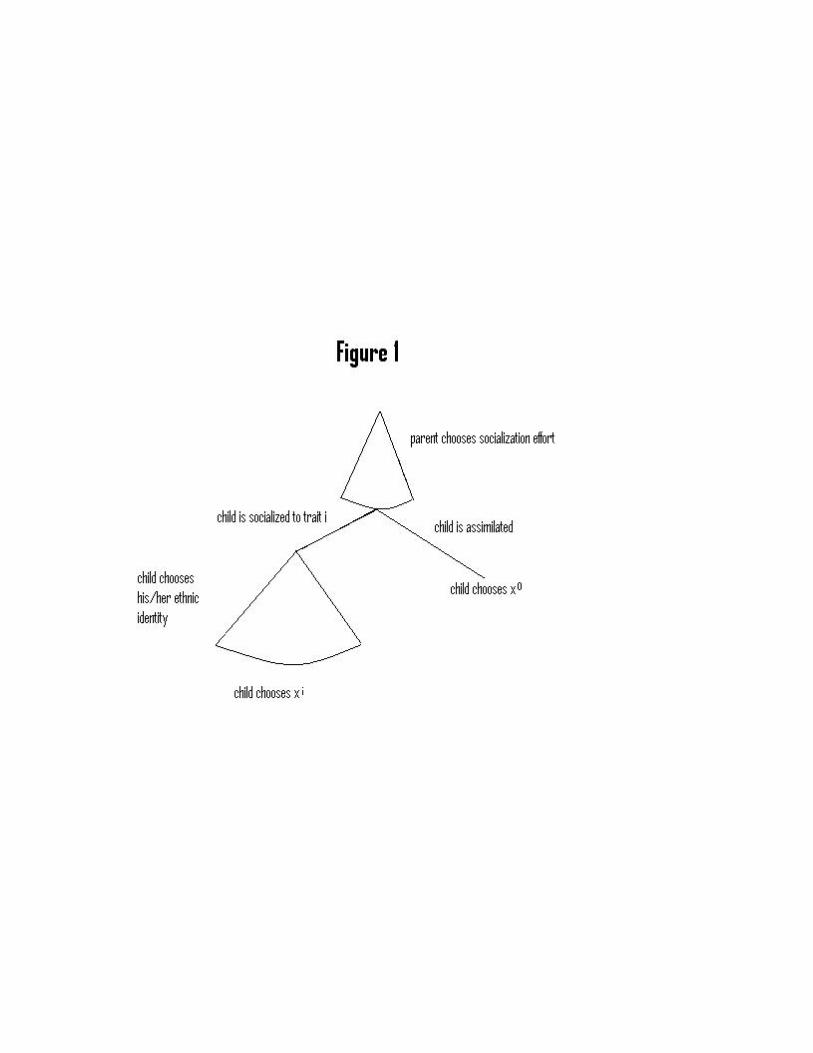
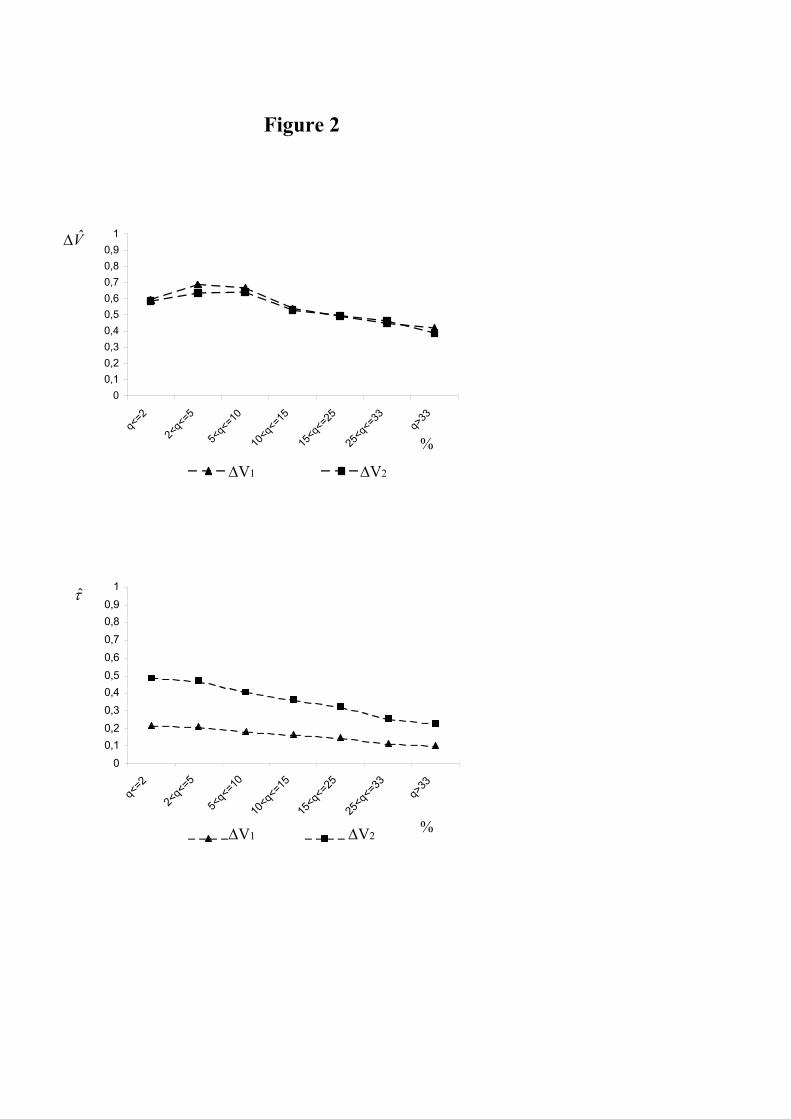
Figure 2
00,10,20,30,40,50,60,70,80,91
q<=2
2<q<=5
5<q<=10
10<q<=15
15<q<=25
25<q<=33
q>33
00,10,20,30,40,50,60,70,80,91
q<=2
2<q<=5
5<q<=10
10<q<=15
15<q<=25
25<q<=33
q>33
∆V1 ∆V2
V∆
%
∆V1 ∆V2 %
τ