benchmarks of manufacturing - national … · aggregation and comparison ... while clean energy...
TRANSCRIPT

BENCHMARKS OF GLOBAL CLEAN ENERGY MANUFACTURING:
Executive Summary
Operated by the Joint Institute for Strategic Energy Analysis

BENCHMARKS OF GLOBAL CLEAN ENERGY MANUFACTURING
Photo credits: front cover: iStock 170522599; back page: iStock 48971084

CEMAC | 1
Executive SummaryClean energy technologies are expanding rapidly and growing in significance with respect to contributing to the world’s energy systems. The manufacture of these technologies—including extracting and processing raw materials, producing required subcomponents, and assembling end product—has become a global enterprise.
The Clean Energy Manufacturing Analysis Center (CEMAC), sponsored by the U.S. Department of Energy (DOE) Office of Energy Efficiency and Renewable Energy (EERE) provides objective analysis and up-to-date data on global supply chains and manufacturing of clean energy technologies. CEMAC analysts prepared Benchmarks of Global Clean Energy Manufacturing to shed light on several fundamental questions about the global clean technology manufacturing enterprise:
• How does clean energy technology manufacturing impact national economies?
• What are the economic opportunities across the manufacturing supply chain?
• What are the global dynamics of clean energy technology manufacturing?
To address these questions, we establish a set of benchmarks to track global changes in clean energy manufacturing and provide a baseline, based on 2014 data. We selected four leading technologies from the multitude contributing to the growing clean energy space: wind turbine components (blade, tower, nacelle), crystalline silicon (c-Si) solar photovoltaic (PV) modules, light duty vehicle (LDV) lithium ion battery cells, and light emitting diode (LED) packages for lighting and other consumer products. These each represent the final product that is traded in their respective supply chains, among other criteria defined in the methodology (CEMAC 2017).
The impacts of the manufacturing supply chain for these four technologies are assessed in terms of common benchmarks for 12 economies, selected because they comprise the primary manufacturing hubs for the four technologies: Brazil, Canada, China, Germany, India, Japan, Malaysia, Mexico, South Korea, Republic of China (Taiwan), United Kingdom, and United States.
ApproachThis work establishes a common framework and new methodologies for assessing and comparing clean energy technology manufacturing supply chains, aligned with CEMAC’s standardized manufacturing cost analysis methodology (CEMAC 2017).
Figure ES-1. Value chain with manufacturing supply chain links for clean energy technologies
Raw Materials Processed Materials Sub-Components Clean Energy Technology End Product
Manufacturing Supply Chain Links
Value Chain for Clean Energy Technologies
Development Manufacturing Installation/Construction
System Integration
Operation & Maintenance

BENCHMARKS OF GLOBAL CLEAN ENERGY MANUFACTURING
FrameworkManufacturing is just one piece of the larger clean energy economy, yet it is the linchpin between technology development and its deployment into the marketplace (see Figure ES-1). Upstream, innovation in the development stage has economic value in the intellectual property, research, and corporate management. Downstream, the installation, systems integration, and operations, which are inherently highly localized, bring economic value through employment, services, property taxes, and reduction of pollution and environmental impact. While tremendous value can be found in the development and deployment of technologies, this report focuses on the value added and opportunities found in the manufacturing supply chain.
We examine each technology in terms of four common manufacturing supply chain links: raw materials, processed materials, sub-components, and end product. This framework provides a consistent basis for aggregation and comparison of a diverse set of clean energy technologies and manufacturing processes. To make this benchmarking exercise manageable, the specific materials, intermediates, and subcomponents included within each link were limited based on an assessment of: raw material constraints, uniqueness or role as an enabling process or product, global trade in that item, impact on overall cost, and contribution to quality.
Alignment of the technologies with the manufacturing supply chain framework is illustrated in Figure ES-2.
MethodologiesWe established four common points of reference—benchmarks—to provide a standardized basis for (1) comparing key economic aspects of clean energy technology manufacturing on a national and global basis, and (2) tracking changes as markets and manufacturing processes evolve. New methodologies were developed to establish each benchmark while accommodating the variations in clean energy technology manufacturing supply chains and availability of data. The methodologies are outlined here and detailed in the methodology report (CEMAC 2017).
Benchmark 1: Clean Energy Manufacturing Value AddedThis benchmark provides insight into the contribution and importance of clean energy manufacturing to national economies.
Value added is a key component of national gross domestic product (GDP). It has two components defined as:
• Direct value added is the amount that clean energy manufacturers themselves contribute to national GDP. This includes payments to manufacturing workers,
Figure ES-2. Clean energy manufacturing supply chain links
Items in bold are included in the benchmark analysis. This analysis covers the processed materials, subcomponents, and end product elements; we excluded raw materials due to the difficulty of reliably allocating the share of consumption of widely used raw materials to specific clean energy technologies.
Silica, Silver Polysilicon, Silver Paste, Glass
C-Si PV Wafer, C-Si PV Cell, Frame, Encapsulant C-Si Solar PV Module
Iron, Neodymium, or Dysprosium Ores
Steel, Fiberglass, Carbon Fiber, Neodymium and Dysprosium Alloys
Permanent Magnets, Generators, Gear Assemblies, Steel Components
Wind Turbine Components: Blades, Tower, Nacelle
Lithium, Cobalt, Nickel, Graphite Ores
Cathode Materials, Anode Materials, Electrolytes
Separators, Housings, Metal Foils, Tabs
Light Duty Vehicle (LDV) Li-ion Battery Cell
Gallium, Indium, Yttrium Ores
Sapphire Substrates, Trimethyl Gallium (TMG), Trimethylindium (TMI), YAG Phosphors
LED Chips LED Package
Raw Materials Processed Materials Sub-Components Clean Energy Technology End Product
CEMAC | 3
Raw Materials Processed Materials Sub-Components Clean Energy Technology End Product
property-type income such as profits earned by owners and investors, and taxes paid on production less government subsidies.
• Indirect value added is often referred to as the economic ripple effect. When clean energy manufacturers make products they purchase inputs such as accounting services or raw materials. A generator manufacturer, for example, may purchase copper wiring from a domestic wire manufacturer. This wire manufacturer and its contribution to GDP would be included in the indirect effect.
We estimate manufacturing value added using a combination of CEMAC cost analysis data, market data, and social accounting data from the Organization for Economic Cooperation and Development (OECD) Structural Analysis (STAN) Input-Output (I-O) database.1
Benchmark 2: Clean Energy TradeThis benchmark provides insight into global clean energy trade activity and interconnectedness across the manufacturing supply chain.
Trade connects the global community and can be a significant source of economic growth. Balance of trade (exports less imports) is another key component of national GDP. Trade flow data for the benchmark report are compiled from the United States International Trade Commission (USITC) and the International Trade Centre.2 Trade data are in U.S. dollars (USD) rather than local currencies. Fluctuation in trade that is measured in a standard currency such as USD can be caused by changes in the volume of trade or the value of the local currency relative to the USD. A relatively strong domestic currency makes exports more expensive in the international market while a weaker currency makes them less expensive. While official trade data for the final products is often available, the upstream data are often intertwined with much larger industry sectors and difficult to extract for the specific technology of interest. Where not available, the balance of trade for upstream components was estimated using market data from secondary sources.
1. Further information about the OECD STAN I-O database, including the data used in the benchmark study, can be found at http://www.oecd.org/sti/ind/stanstructuralanalysisdatabase.htm.
2. Further information about the USITC can be found at https://www.usitc.gov/ and further information about the International Trade Centre is at http://trademap.org.
Benchmark 3: Clean Energy Market Size This benchmark provides insight into the relative concentration of demand for clean energy technologies across the globe.
Market size (or market demand) data were collected from existing secondary sources to estimate the market size for each technology across the manufacturing supply chain and in each economy. When available, actual production data for each subsequent downstream intermediate formed the basis of demand estimates for key supply chain intermediates. When data were not available, typically for smaller industries (LED packages and LDV Li-ion battery cells), the demand for intermediates was approximated by assuming that the production volume of the end product is equivalent to the demand for each upstream intermediate product. The monetary value of demand was estimated by applying estimates of average global unit prices to allow comparison across technologies and economies.
Benchmark 4: Clean Energy Manufacturing Capacity and Production This benchmark provides insight into the clean energy manufacturing capacity and production around the world and highlights opportunities for expansion to meet demand.
Manufacturing capacity and production were estimated to highlight the economies that make the largest contributions in each category and to understand where excess capacity is located around the world for each technology. Like market size data, data were collected from existing secondary sources, and monetary values were estimated by applying estimates of average global unit prices to (1) allow comparison across technologies and economies and (2) provide input for the value added benchmark based on production value of each technology and intermediate.
BENCHMARKS OF GLOBAL CLEAN ENERGY MANUFACTURING
Benchmark Data The baseline year for this report is 2014, the most recent year for which reliable, comprehensive data are available. We draw from public, proprietary sources, primary, and secondary sources. For the technologies considered here, clean energy technology end product information is relatively complete; however, data needed to estimate the benchmarks at the desired level of supply chain disaggregation are not available for all the technologies. Consequently, data reported here vary in level of
confidence. The data sources, assumptions and data confidence are detailed in the technology discussion of the main report and in the methodology report (CEMAC 2017).
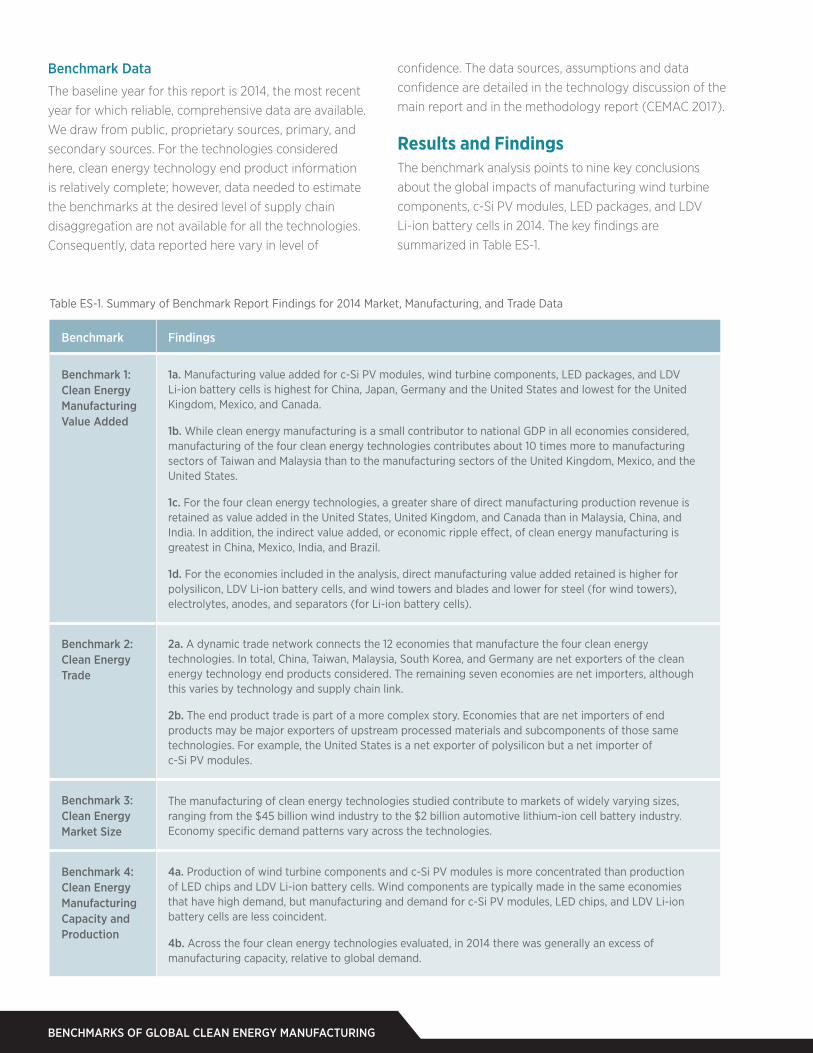
Results and FindingsThe benchmark analysis points to nine key conclusions about the global impacts of manufacturing wind turbine components, c-Si PV modules, LED packages, and LDV Li-ion battery cells in 2014. The key findings are summarized in Table ES-1.
Table ES-1. Summary of Benchmark Report Findings for 2014 Market, Manufacturing, and Trade Data
Benchmark Findings
Benchmark 1: Clean Energy Manufacturing Value Added
1a. Manufacturing value added for c-Si PV modules, wind turbine components, LED packages, and LDV Li-ion battery cells is highest for China, Japan, Germany and the United States and lowest for the United Kingdom, Mexico, and Canada.
1b. While clean energy manufacturing is a small contributor to national GDP in all economies considered, manufacturing of the four clean energy technologies contributes about 10 times more to manufacturing sectors of Taiwan and Malaysia than to the manufacturing sectors of the United Kingdom, Mexico, and the United States.
1c. For the four clean energy technologies, a greater share of direct manufacturing production revenue is retained as value added in the United States, United Kingdom, and Canada than in Malaysia, China, and India. In addition, the indirect value added, or economic ripple effect, of clean energy manufacturing is greatest in China, Mexico, India, and Brazil.
1d. For the economies included in the analysis, direct manufacturing value added retained is higher for polysilicon, LDV Li-ion battery cells, and wind towers and blades and lower for steel (for wind towers), electrolytes, anodes, and separators (for Li-ion battery cells).
Benchmark 2: Clean Energy Trade
2a. A dynamic trade network connects the 12 economies that manufacture the four clean energy technologies. In total, China, Taiwan, Malaysia, South Korea, and Germany are net exporters of the clean energy technology end products considered. The remaining seven economies are net importers, although this varies by technology and supply chain link.
2b. The end product trade is part of a more complex story. Economies that are net importers of end products may be major exporters of upstream processed materials and subcomponents of those same technologies. For example, the United States is a net exporter of polysilicon but a net importer of c-Si PV modules.
Benchmark 3: Clean Energy Market Size
The manufacturing of clean energy technologies studied contribute to markets of widely varying sizes, ranging from the $45 billion wind industry to the $2 billion automotive lithium-ion cell battery industry. Economy specific demand patterns vary across the technologies.
Benchmark 4: Clean Energy Manufacturing Capacity and Production
4a. Production of wind turbine components and c-Si PV modules is more concentrated than production of LED chips and LDV Li-ion battery cells. Wind components are typically made in the same economies that have high demand, but manufacturing and demand for c-Si PV modules, LED chips, and LDV Li-ion battery cells are less coincident.
4b. Across the four clean energy technologies evaluated, in 2014 there was generally an excess of manufacturing capacity, relative to global demand.

CEMAC | 5
Benchmark 1. Clean Energy Manufacturing Value Added: 1a. Manufacturing value added for c-Si PV modules, wind turbine components, LED packages, and LDV Li-ion battery cells is highest for China, Japan, Germany and the United States and lowest for the United Kingdom, Mexico, and Canada.
The total clean energy manufacturing value added is shown in Figure ES-3, for the four clean energy technologies. China accrued the largest value added overall (USD 38.8 billion) from clean energy manufacturing in 2014; Japan, Germany, and the United
States were second, third and fourth, with USD 7.1 billion, USD 6.3 billion, and USD 6.2 billion, respectively. The manufacturing value added indicates the contribution of the manufacturing toward the national GDP, thus larger numbers are one indicator of the strength of clean energy manufacturing in the economy.
1b. While clean energy manufacturing is a small contributor to national GDP in all economies considered, manufacturing of the four clean energy technologies contributes about 10 times more to manufacturing sectors of Taiwan, and Malaysia, than to the manufacturing sectors of the United Kingdom, Mexico, and the United States.
Figure ES-3. Manufacturing value added for four clean energy technologies, 2014
Total clean energy manufacturing value added is aggregated across the supply chain for the four clean energy technologies by economy in Figure ES-3. See methodology report for data quality discussion.
Tota
l CEM
Val
ue A
dded
($ M
illio
n U
SD 2
014
)
Wind Turbine
c-SI PV Module
LED Package
LDV Li-ion Battery Cell
Tota
l CEM
Val
ue A
dded
($ M
illio
n U
SD 2
014
)
0
500
1,000
1,500
2,000
2,500
3,000
3,500
4,000
4,500
5,000
5,500
6,000
6,500
7,000
7,500
Japan
7,100
Germany
6,300
UnitedStates
6,200
SouthKorea
3,700
Taiwan
2,700
Brazil
2,400
Malaysia
1,300
India
1,600
Canada
700
Mexico
400
UnitedKingdom
200
0
5,000
10,000
15,000
20,000
25,000
30,000
35,000
40,00038,800
China
7,100
Japan
6,300
UnitedStates
6,200
Germany
3,700
SouthKorea
2,700
Taiwan
2,400
Brazil
1,600
India
1,300
Malaysia
700
Canada
400
Mexico
200
UnitedKingdom
Clean Energy ManufacturingAnalysis Center

BENCHMARKS OF GLOBAL CLEAN ENERGY MANUFACTURING
Figure ES-4. National GDP and direct clean energy manufacturing value added (for four clean energy technology supply chains) as a share of total manufacturing value added, 2014
Total bar length shows national GDP in Million USD (annotated), gray shading indicates manufacturing value added contribution to GDP, and the squares indicate clean energy manufacturing direct value added as a fraction of manufacturing value added for each economy (bottom axis). See methodology report for data quality discussion.
Taiwan
Malaysia
SouthKorea
China
Japan
Germany
Brazil
Canada
India
UnitedStates
Mexico
UnitedKingdom
0 2M 4M 6M 8M 10M 12M 14M 16M 18M
Gross Domestic Product (Million USD, 2014)
0.02%0 0.04% 0.06% 0.08% 0.10% 0.12% 0.14% 0.16% 0.18% 0.20% 0.22% 0.24% 0.26% 0.28%
Clean energy manufacturing value added contribution to economy-wide manufacturing value added (%)
530,000
338,000
1,410,000
10,350,000
4,601,000
3,868,000
2,417,000
1,785,000
2,049,000 17,420,000
1,295,000
2,989,000
To put value added into more context given the wide variability of national populations, resources, and economies, Figure ES-4 summarizes the contribution of manufacturing of these four clean energy manufacturing technologies to the total manufacturing sector in terms of supporting GDP. The economic contribution from manufacturing of the four clean energy technologies considered ranged from a high of 0.28% for Taiwan to a low of 0.01% for the United Kingdom. This economic activity is not a large portion of the individual economies
because each produces a diverse mix of other goods and services. Comparing across the 12 economies, however, does show the importance of clean energy manufacturing in each. For example, the United States has the largest GDP and the second largest contribution by manufacturing, but the four clean energy technologies are a relatively small part. Taiwan and Malaysia are small economies but clean energy technology manufacturing plays a relatively large part of their GDP.

CEMAC | 7
1.c For the four clean energy technologies, a greater share of direct manufacturing production revenue is retained as value added in the United States, United Kingdom, and Canada than in Malaysia, China, and India. In addition, the indirect value added, or economic ripple effect, of clean energy manufacturing is greatest in China, Mexico, India, and Brazil.
Normalizing the direct clean energy manufacturing value added for the four technologies by production revenue (value added retained) provides insight on the extent that the manufacturing supply chain associated with
these clean technologies is domestically sourced and shows how much clean energy manufacturing workers, investors, and governments within each economy gain from each unit of production (Figure ES-5). The highest value added retained is shown in the United States (57%), United Kingdom (46%), Canada (41%), and Germany (40%). Malaysia (16%), China (18%), and India (20%) show the lowest.
Larger economies such as the United States tend to retain higher percentages of clean energy manufacturing value added as a portion of revenue than smaller economies
0
5K
10K
15K
20K
25K
30K
35K
40K 57%
46%
41%40%
36%35%
27%
25%24%
20%Tota
l Val
ue A
dded
(Mill
ion
USD
)
0%
5%
10%
15%
20%
25%
30%
35%
40%
45%
50%
55%
Clea
n En
ergy
Man
ufac
turin
g V
alue
Add
ed R
etai
ned
(%)
UnitedStates
UnitedKingdom
Canada Germany Japan Brazil SouthKorea
Mexico Taiwan India China Malaysia
6,200
200 700
6,3007,100
2,400
3,700
400
2,7001,600
38,800
1,300
18%
16%
Figure ES-5. Direct manufacturing value added retention (share of production revenue) for four clean energy technology supply chains, 2014
The color bars indicate the total clean energy manufacturing value added for each national economy (darker shading shows the direct value added and lighter shading shows the indirect value added); value added retained within each economy is indicated by the gray bars. See methodology report for data quality discussion.

BENCHMARKS OF GLOBAL CLEAN ENERGY MANUFACTURING
such as Malaysia and Taiwan. Higher retained value added is an important indicator of how connected industries are to the economy as a whole. The differences in the amount of value added retained are influenced by a number of domestic economic factors, such as prevailing wages, taxes, and subsidies. These also vary from industry to industry. High tech manufacturing, for example, might need more skilled and expensive workers relative to other types of manufacturing. Different products can also have lower labor intensity relative to capital intensity. If returns on capital are high, then this will push up the value added share of production revenue even if there are fewer jobs.
Figure ES-5 also highlights the relationship between direct and indirect value added from clean energy manufacturing. Of the 12 economies considered, the ripple effect is greatest in China, Mexico, India, and Brazil, where more indirect value added than direct value added is generated from manufacturing the four clean energy technologies. A well-developed domestic supply chain will result in greater levels of indirect value added than a supply chain that relies on imported goods and services.
1d. For the economies included in the analysis, direct manufacturing value added retained is higher for polysilicon, LDV Li-ion battery cells, and wind towers and
Figure ES-6. Direct manufacturing value added retained for four clean energy technology supply chain intermediates across 12 economies, 2014
The color bars show, by technology intermediate, the total clean energy manufacturing value added in each of the 12 economies, and the gray bars show direct manufacturing value added retained. See methodology report for data quality discussion.
0
2,000
4,000
6,000
8,000
10,000
12,000
14,000
16,000
18,000
CEM
Tot
al V
alue
Add
ed ($
Mill
ion
USD
20
14)
0%
5%
10%
15%
20%
25%
30%
35%
40%
45%
50%
55%
Clea
n En
ergy
Man
ufac
turin
g V
alue
Add
ed R
etai
ned
(%)
BrazilCanadaChinaGermanyIndiaJapanMalaysiaMexicoSouth KoreaTaiwanUnited KingdomUnited States
PV W
afer
PV C
ell
LED
Pack
age
PV M
odul
e
LIB
Ano
de
LED
Chi
p
Sapp
hire
Subs
trat
e
Nac
elle
LIB
Cath
ode
Sepa
rato
r
Gen
erat
or
Stee
l
Elec
trol
yte
LIB
Cel
l
Bla
des
Poly
silic
on
Tow
er
53%
38%
35% 35%
33%32%
30% 30% 30% 30%29%
26%25% 25%
22%
30% 30%
CEMAC | 9
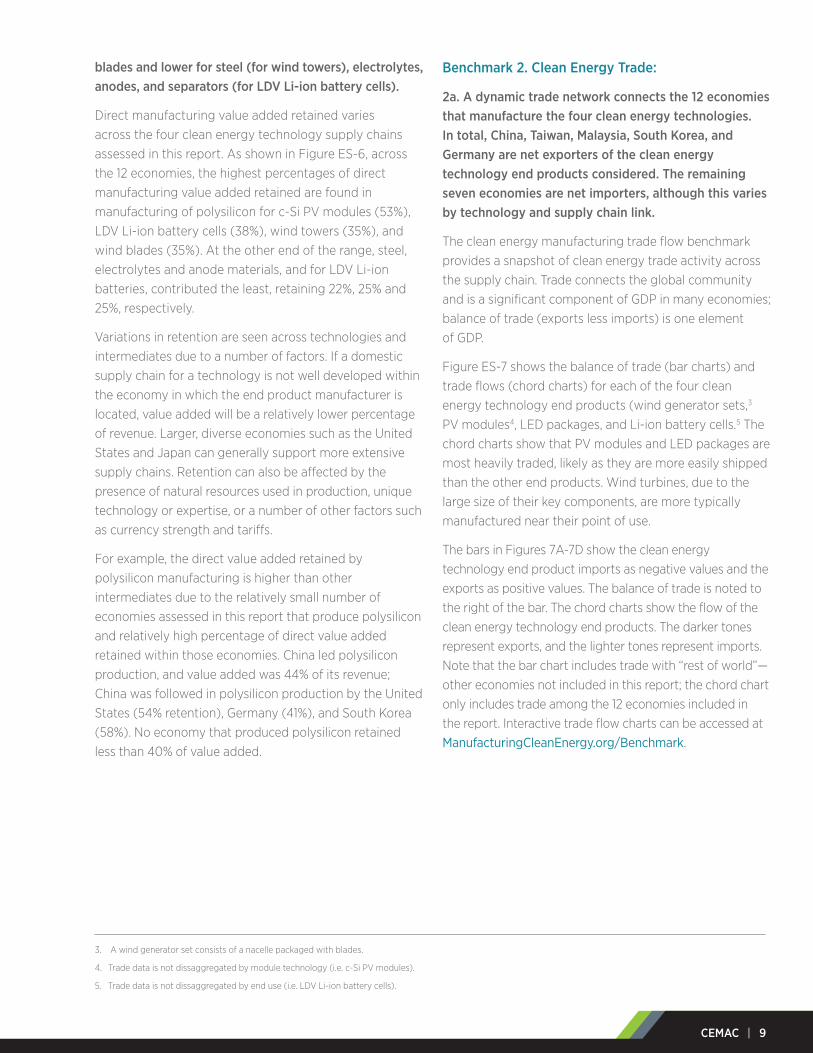
blades and lower for steel (for wind towers), electrolytes, anodes, and separators (for LDV Li-ion battery cells).
Direct manufacturing value added retained varies across the four clean energy technology supply chains assessed in this report. As shown in Figure ES-6, across the 12 economies, the highest percentages of direct manufacturing value added retained are found in manufacturing of polysilicon for c-Si PV modules (53%), LDV Li-ion battery cells (38%), wind towers (35%), and wind blades (35%). At the other end of the range, steel, electrolytes and anode materials, and for LDV Li-ion batteries, contributed the least, retaining 22%, 25% and 25%, respectively.
Variations in retention are seen across technologies and intermediates due to a number of factors. If a domestic supply chain for a technology is not well developed within the economy in which the end product manufacturer is located, value added will be a relatively lower percentage of revenue. Larger, diverse economies such as the United States and Japan can generally support more extensive supply chains. Retention can also be affected by the presence of natural resources used in production, unique technology or expertise, or a number of other factors such as currency strength and tariffs.
For example, the direct value added retained by polysilicon manufacturing is higher than other intermediates due to the relatively small number of economies assessed in this report that produce polysilicon and relatively high percentage of direct value added retained within those economies. China led polysilicon production, and value added was 44% of its revenue; China was followed in polysilicon production by the United States (54% retention), Germany (41%), and South Korea (58%). No economy that produced polysilicon retained less than 40% of value added.
3. A wind generator set consists of a nacelle packaged with blades.
4. Trade data is not dissaggregated by module technology (i.e. c-Si PV modules).
5. Trade data is not dissaggregated by end use (i.e. LDV Li-ion battery cells).
Benchmark 2. Clean Energy Trade:
2a. A dynamic trade network connects the 12 economies that manufacture the four clean energy technologies. In total, China, Taiwan, Malaysia, South Korea, and Germany are net exporters of the clean energy technology end products considered. The remaining seven economies are net importers, although this varies by technology and supply chain link.
The clean energy manufacturing trade flow benchmark provides a snapshot of clean energy trade activity across the supply chain. Trade connects the global community and is a significant component of GDP in many economies; balance of trade (exports less imports) is one element of GDP.
Figure ES-7 shows the balance of trade (bar charts) and trade flows (chord charts) for each of the four clean energy technology end products (wind generator sets,3 PV modules4, LED packages, and Li-ion battery cells.5 The chord charts show that PV modules and LED packages are most heavily traded, likely as they are more easily shipped than the other end products. Wind turbines, due to the large size of their key components, are more typically manufactured near their point of use.
The bars in Figures 7A-7D show the clean energy technology end product imports as negative values and the exports as positive values. The balance of trade is noted to the right of the bar. The chord charts show the flow of the clean energy technology end products. The darker tones represent exports, and the lighter tones represent imports. Note that the bar chart includes trade with “rest of world”—other economies not included in this report; the chord chart only includes trade among the 12 economies included in the report. Interactive trade flow charts can be accessed at ManufacturingCleanEnergy.org/Benchmark.

BENCHMARKS OF GLOBAL CLEAN ENERGY MANUFACTURING
-10K -5K 0 0 5K 10K
Brazil
Canada
China
Germany
India
Japan
Malaysia
Mexico
South Korea
Taiwan
UnitedKingdom
United States
Imports(Million USD, 2014)
Exports(Million USD, 2014)
-527
-590
-254
-614
407
294
-45
-84
83
0
1
1,660
Brazil
15 M 6 K
Indi
a12
1 M
99
M
Germ
any
188 M
1.6
B
Japan
600 M
6.9 B
SouthKorea
1.7 B 149 M
Malaysia
1.7 B 34 M
Mexico
534 M 132 M
USA
4.1 B
169 M
UK1.3
B
104
M
Taiw
an26
M
943
M
Canada326 M 21 M
China
433 M 7.9 MBrazil
269 M 15 M
Germ
any
2.2 B
547
M
Japan1.7 M 85 MSouth Korea
9 M 54 M
Malaysia
47 K 543 K
Mexico
43 M 570 M
USA
185 M
591 M
UK59
4 M
4 M
Taiw
an6
M
726
M
Canada628 M 14 M
China
8.6 M 302 M
India201 K 83 M
-10K -5K 0 0 5K 10K
-6,255
-3,939
-1,369
-1,184
1,626
1,600
-305
917
402
-15
22
7,477
Brazil
Canada
China
Germany
India
Japan
Malaysia
Mexico
South Korea
Taiwan
UnitedKingdom
United States
Imports(Million USD, 2014)
Exports(Million USD, 2014)
Brazil
127 M 3 M
Indi
a26
M
181 M
Germ
any
1 B
1.
2 B
Japan3.6 B
1 B
South Korea
1.5 B 2.1 B
Malaysia
2.2 B 805 M
Mexico
121 M 1.3 B
USA
2.2 B
673 M
UK44
6 M
83 M
Taiw
an1.2
B
2.
4 B
Canada113 M 129 M
China
5.8 B 4.5 B
Brazil
15 M 6 K
Indi
a12
1 M
99
M
Germ
any
188 M
1.6
B
Japan
600 M
6.9 B
SouthKorea
1.7 B 149 M
Malaysia
1.7 B 34 M
Mexico
534 M 132 M
USA
4.1 B
169 M
UK1.3
B
104
M
Taiw
an26
M
943
M
Canada326 M 21 M
China
433 M 7.9 M
Brazil
269 M 15 M
Germ
any
2.2 B
547
M
Japan1.7 M 85 MSouth Korea
9 M 54 M
Malaysia
47 K 543 K
Mexico
43 M 570 M
USA
185 M
591 M
UK59
4 M
4 M
Taiw
an6
M
726
M
Canada628 M 14 M
China
8.6 M 302 M
India201 K 83 M
Figure ES-7B. Balance of trade and trade flows for PV modules, 2014. Darker shades represent exports; lighter shades represent imports.
Figure ES-7A. Balance of trade and trade flows for wind generator sets (nacelle and blades), 2014. Darker shades represent exports; lighter shades represent imports.
Wind components
PV modules

CEMAC | 11
-10K 10K-5K 0 0 5K
-1,498
1,199
1,404
-649
-1,165
-1,329
-363
-156
-124
-154
16
Brazil
Canada
China
Germany
India
Japan
Malaysia
Mexico
South Korea
Taiwan
UnitedKingdom
United States
Imports(Million USD, 2014)
Exports(Million USD, 2014)
2,593
Brazil
127 M 3 M
Indi
a26
M
181 M
Germ
any
1 B
1.
2 B
Japan3.6 B
1 B
South Korea
1.5 B 2.1 B
Malaysia
2.2 B 805 M
Mexico
121 M 1.3 B
USA
2.2 B
673 M
UK44
6 M
83 M
Taiw
an1.2
B
2.
4 B
Canada113 M 129 M
China
5.8 B 4.5 B
Brazil
15 M 6 K
Indi
a12
1 M
99
M
Germ
any
188 M
1.6
B
Japan
600 M
6.9 B
SouthKorea
1.7 B 149 M
Malaysia
1.7 B 34 M
Mexico
534 M 132 M
USA
4.1 B
169 M
UK1.3
B
104
M
Taiw
an26
M
943
M
Canada326 M 21 M
China
433 M 7.9 M
LIB Cell
Brazil
Canada
China
Germany
India
Japan
Malaysia
Mexico
South Korea
Taiwan
UnitedKingdom
United States
1,496
1,806
-109
-488
-306
-940
-161
422
-53
-82
93
Imports(Million USD, 2014)
Exports(Million USD, 2014)
-10K 10K-5K 0 0 5K
834
Brazil
316 M 11 M
Indi
a
18 M
1
27 M
Germ
any
544 M
1 B
Japan2 B
537 MSouth Korea
2.3 B 462 M
Malaysia446 M 24 M
Mexico
144 M 305 M
USA
1.7 B
754 M
UK16
0 M
78 M
Taiw
an41
M
13
4 M
Canada95 M 43 M
China
2.6 B 3.5 M
Figure ES-7D. Balance of trade and trade flows for Li-ion battery cells, 2014. See methodology report for data quality discussion. Darker shades represent exports; lighter shades represent imports.
Figure ES-7C. Balance of trade and trade flows for LED packages, 2014. Darker shades represent exports; lighter shades represent imports.
LED packages
Li-ion battery cells
BENCHMARKS OF GLOBAL CLEAN ENERGY MANUFACTURING
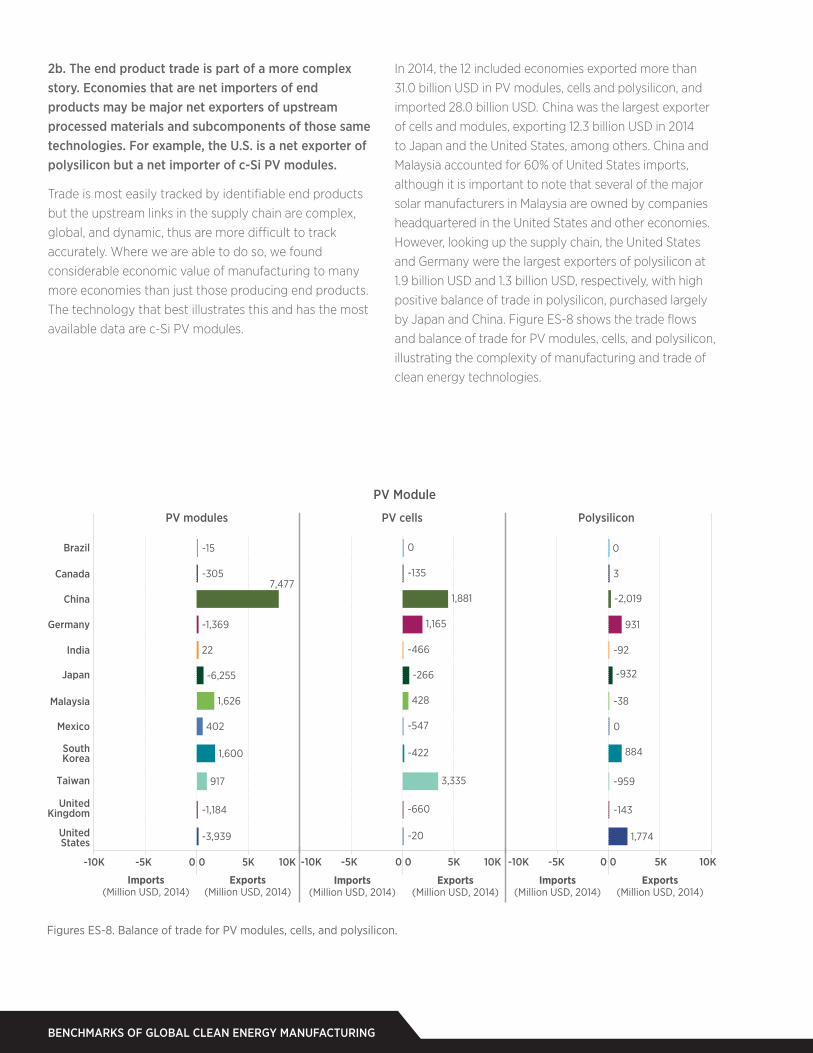
2b. The end product trade is part of a more complex story. Economies that are net importers of end products may be major net exporters of upstream processed materials and subcomponents of those same technologies. For example, the U.S. is a net exporter of polysilicon but a net importer of c-Si PV modules.
Trade is most easily tracked by identifiable end products but the upstream links in the supply chain are complex, global, and dynamic, thus are more difficult to track accurately. Where we are able to do so, we found considerable economic value of manufacturing to many more economies than just those producing end products. The technology that best illustrates this and has the most available data are c-Si PV modules.
In 2014, the 12 included economies exported more than 31.0 billion USD in PV modules, cells and polysilicon, and imported 28.0 billion USD. China was the largest exporter of cells and modules, exporting 12.3 billion USD in 2014 to Japan and the United States, among others. China and Malaysia accounted for 60% of United States imports, although it is important to note that several of the major solar manufacturers in Malaysia are owned by companies headquartered in the United States and other economies. However, looking up the supply chain, the United States and Germany were the largest exporters of polysilicon at 1.9 billion USD and 1.3 billion USD, respectively, with high positive balance of trade in polysilicon, purchased largely by Japan and China. Figure ES-8 shows the trade flows and balance of trade for PV modules, cells, and polysilicon, illustrating the complexity of manufacturing and trade of clean energy technologies.
Figures ES-8. Balance of trade for PV modules, cells, and polysilicon.
Imports(Million USD, 2014)
Exports(Million USD, 2014)
Imports(Million USD, 2014)
Exports(Million USD, 2014)
Imports(Million USD, 2014)
Exports(Million USD, 2014)
PV Module
PV modules PV cells Polysilicon
-10K 10K-5K 0 0 5K -10K 10K-5K 0 0 5K -10K 10K-5K 0 0 5K
UnitedStates -3,939 -20 1,774
Taiwan 917 3,335 -959
UnitedKingdom -1,184 -660 -143
Japan -6,255 -266 -932
SouthKorea 1,600 -422 884
Germany -1,369 1,165 931
Malaysia 1,626 428 -38
India 22 -466 -92
Canada -305 -135 3
Mexico 402 -547 0
Brazil -15 0 0
China 1,881 -2,0197,477
CEMAC | 13
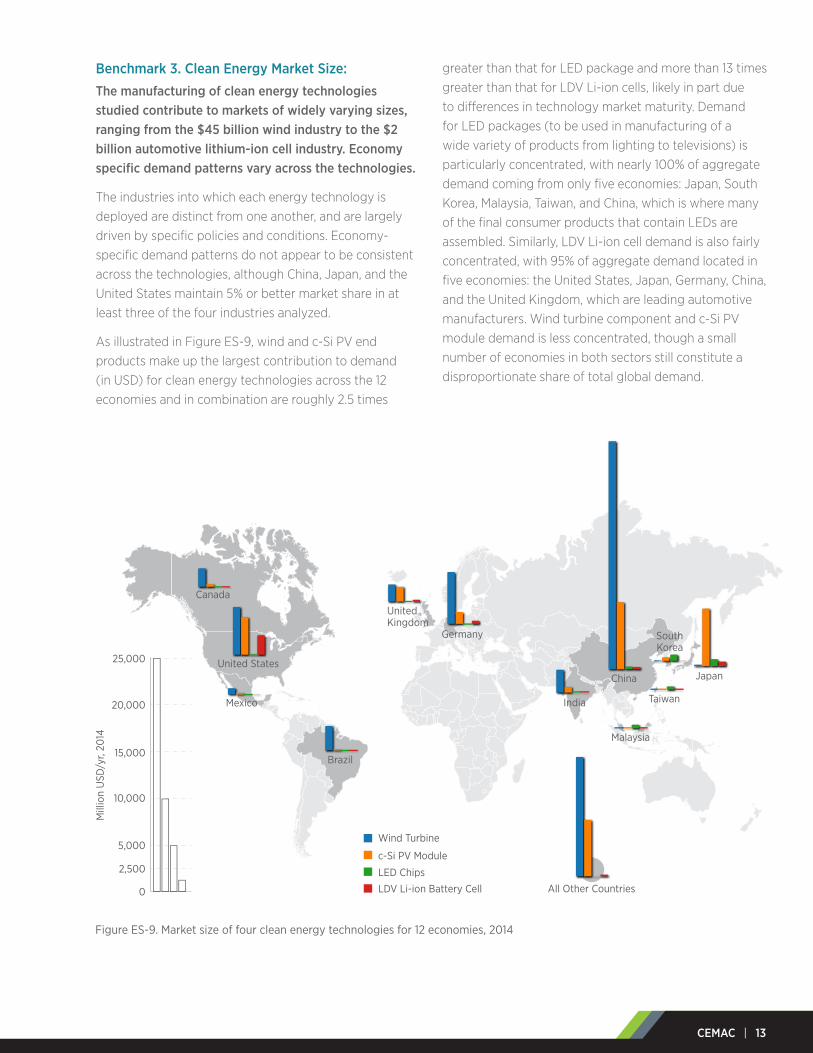
Benchmark 3. Clean Energy Market Size: The manufacturing of clean energy technologies studied contribute to markets of widely varying sizes, ranging from the $45 billion wind industry to the $2 billion automotive lithium-ion cell industry. Economy specific demand patterns vary across the technologies.
The industries into which each energy technology is deployed are distinct from one another, and are largely driven by specific policies and conditions. Economy-specific demand patterns do not appear to be consistent across the technologies, although China, Japan, and the United States maintain 5% or better market share in at least three of the four industries analyzed.
As illustrated in Figure ES-9, wind and c-Si PV end products make up the largest contribution to demand (in USD) for clean energy technologies across the 12 economies and in combination are roughly 2.5 times
greater than that for LED package and more than 13 times greater than that for LDV Li-ion cells, likely in part due to differences in technology market maturity. Demand for LED packages (to be used in manufacturing of a wide variety of products from lighting to televisions) is particularly concentrated, with nearly 100% of aggregate demand coming from only five economies: Japan, South Korea, Malaysia, Taiwan, and China, which is where many of the final consumer products that contain LEDs are assembled. Similarly, LDV Li-ion cell demand is also fairly concentrated, with 95% of aggregate demand located in five economies: the United States, Japan, Germany, China, and the United Kingdom, which are leading automotive manufacturers. Wind turbine component and c-Si PV module demand is less concentrated, though a small number of economies in both sectors still constitute a disproportionate share of total global demand.
Figure ES-9. Market size of four clean energy technologies for 12 economies, 2014
China
Malaysia
Taiwan
Japan
SouthKorea
India
All Other Countries
United States
Mexico
Canada
Brazil
UnitedKingdom
Germany
Mill
ion
USD
/yr,
2014
25,000
10,000
15,000
5,000
2,500
0
20,000
Wind Turbine
c-Si PV Module
LED Chips
LDV Li-ion Battery Cell
BENCHMARKS OF GLOBAL CLEAN ENERGY MANUFACTURING
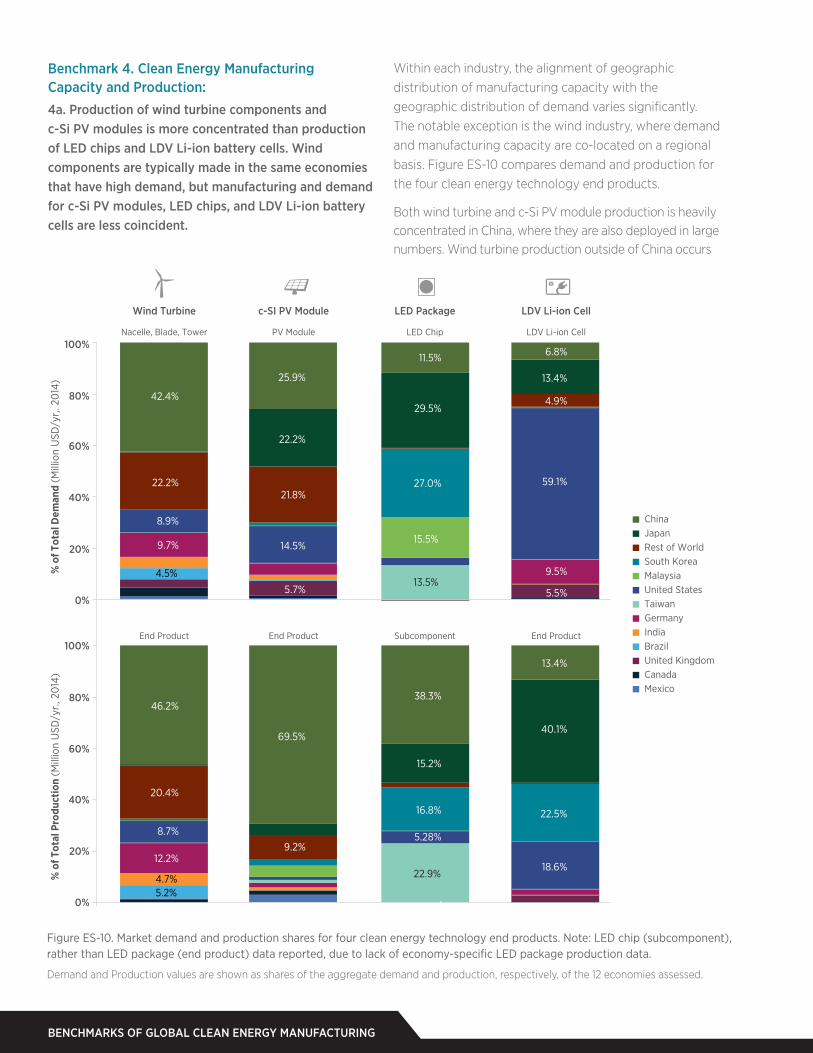
Benchmark 4. Clean Energy Manufacturing Capacity and Production: 4a. Production of wind turbine components and c-Si PV modules is more concentrated than production of LED chips and LDV Li-ion battery cells. Wind components are typically made in the same economies that have high demand, but manufacturing and demand for c-Si PV modules, LED chips, and LDV Li-ion battery cells are less coincident.
Within each industry, the alignment of geographic distribution of manufacturing capacity with the geographic distribution of demand varies significantly. The notable exception is the wind industry, where demand and manufacturing capacity are co-located on a regional basis. Figure ES-10 compares demand and production for the four clean energy technology end products.
Both wind turbine and c-Si PV module production is heavily concentrated in China, where they are also deployed in large numbers. Wind turbine production outside of China occurs
Figure ES-10. Market demand and production shares for four clean energy technology end products. Note: LED chip (subcomponent), rather than LED package (end product) data reported, due to lack of economy-specific LED package production data.
Demand and Production values are shown as shares of the aggregate demand and production, respectively, of the 12 economies assessed.
Wind Turbine c-SI PV Module LED Package LDV Li-ion Cell
0%
20%
40%
60%
80%
100%
% o
f Tot
al D
eman
d (M
illio
n U
SD/y
r,. 2
014
)
0%
20%
40%
60%
80%
100%
% o
f Tot
al P
rodu
ctio
n (M
illio
n U
SD/y
r., 2
014
)
Nacelle, Blade, Tower PV Module LED Chip LDV Li-ion Cell
End Product End Product Subcomponent End Product
42.4%
22.2%
8.9%
9.7%
4.5%
46.2%
20.4%
12.2%
8.7%
4.7%5.2%
25.9%
22.2%
21.8%
14.5%
5.7%
69.5%
9.2%
11.5%
29.5%
27.0%
15.5%
13.5%
38.3%
15.2%
16.8%
22.9%
5.28%
13.4%
59.1%
6.8%
4.9%
9.5%
5.5%
13.4%
40.1%
22.5%
18.6%
ChinaJapanRest of WorldSouth KoreaMalaysiaUnited StatesTaiwanGermanyIndiaBrazilUnited KingdomCanadaMexico

CEMAC | 15
mostly in the United States, Brazil, India, and Germany. Wind turbine manufacturing is typically located close to demand due to transportation logistical challenges associated with the size and weight of the components. C-Si PV module production outside of China is dispersed across all but two of the economies included here, with Japan and Malaysia hosting the next largest shares of module production. C-Si PV has the most mis-alignment of production to demand. Production of both LED Packages and LDV Li-ion battery cells is more globally distributed than production of c-Si PV modules, yet practically all global production for these end products occurs in only four or five economies. LED Packages are produced mostly in Japan, South Korea, Malaysia, Taiwan, and China, while LDV Li-ion cell production
is concentrated in Japan, South Korea, the United States, and China. In general, different supply chain links for each technology appear to be nationally co-located. Countries hosting significant shares of end product production often, although not always, produce a commensurate share of upstream subcomponent and processed materials.
4b. Across the four clean energy technologies evaluated, in 2014 there was generally an excess of manufacturing capacity, relative to global demand.
Manufacturing production and capacity data suggest excess capacity existed across the 12 economies assessed in 2014 (Figure ES-11). The average manufacturing capacity utilization was estimated at 62% for wind turbine
0% 50% 100% 0% 50% 100% 0% 50% 100% 0% 50% 100%
0K 2K 4K 6K 8K 0K 2K 4K 6K 8K 0K 2K 4K 6K 8K 0K 2K 4K 6K 8K
Brazil
Canada
Germany
India
Japan
Malaysia
Mexico
SouthKorea
Taiwan
UnitedKingdom
UnitedStates
58%
75%
86%
37%
58%
85%
24%
85%
59%
93%
49%
30%
95%
60%
81%
65%
33%
40%
46%
37%
43%
49%
76%
67%
49%
29%
39%
Capacity Utilization Capacity Utilization Capacity Utilization Capacity Utilization
Million USD, 2014
Million USD, 2014
Nacelle, Blade, Tower PV Module LED Chip Li-ion Cell
0% 50% 100% 0% 50% 100% 0% 50% 100% 0% 50% 100%
0K 10K 20K 30K 40K 0K 10K 20K 30K 40K 0K 10K 20K 30K 40K 0K 10K 20K 30K 40K
China59% 52% 31% 17%
Figure ES-11. Production and production capacity utilization for four clean energy technology end products. Note: LED chip (subcomponent), rather than LED package (end product) data reported, due to lack of production data.
Each bar shows the production revenue for the end product (darker shade) and the production value of unused manufacturing capacity (lighter shade) based on the lower horizontal scale. The line and numerical value show the capacity utilization rate based on the upper horizontal scale.

BENCHMARKS OF GLOBAL CLEAN ENERGY MANUFACTURING
components, 55% for c-Si PV modules, 37% for LED chips, and 41% for LDV Li-ion cells. Excess capacity can be used to meet potential demand growth from increased technology adoption. However, without increased demand, persistent excess capacity can place downward pressure on pricing.
The balance of trade (exports less imports) metric shown earlier is influenced by production capacity, capacity utilization, and domestic demand for manufactured products. If domestic demand exceeds domestic production, an economy’s balance of trade will be negative. Conversely, if domestic production exceeds domestic demand, the balance of trade will be positive.
ConclusionsThe current state of clean energy trade reflects the cumulative dynamics of a high-growth decade in which both markets and manufacturing have grown significantly within an increasingly complex set of policy environments. Strong domestic markets have not necessarily been supplied by domestic manufacturing, particularly markets for those technologies that benefit from economies of scale and where incentives for manufacturing investment or output have been adopted, and markets for technologies where transportation was not a determining factor for manufacturing location, such as PV modules, Li-ion battery cells and LED packages.
The U.S. situation is notable, as clean energy markets have been particularly strong and are served by both domestic and imported end products. The United States is one of the top five manufacturing economies globally and retains the highest amount of manufacturing value added of the technologies evaluated. Even though the United States is a net importer to meet its large demand for the technologies evaluated, some U.S. clean energy technology manufacturers are net exporters of components upstream in the supply chains. China stands out as an example where policies have been implemented to support both domestic markets and the expansion of domestic manufacturing to serve both domestic and export markets. In Japan, both these situations are apparent for specific technologies: the country’s strong domestic market for PV modules is served with significant imports, while its LED package manufacturing serves both its domestic and export markets.
For the clean energy technologies covered in this report and many others, technology innovation is anticipated to continue to drive relatively rapid turnover of technologies and associated manufacturing capacity. Such innovation creates significant opportunities to attract manufacturers
that can serve domestic markets, compete effectively in other markets, and displace incumbent technologies.
Manufacturing activity and investment in new manufacturing facilities respond to a number of key drivers, including but not limited to demand in domestic markets, demand in export markets, and investment incentives. Domestic markets can be an initial driver for domestic manufacturing, although as deployment increases and prices fall, there is no guarantee that manufacturing will be geographically aligned with demand, absent other policies or economic drivers. With the right combination of skilled labor and investment, manufacturing for export can become a second key driver, sometimes even without a local market. Irrespective of manufacturing, localized clean energy technology deployment as well as multinational corporate headquarters and research facilities both generate significant value in their own right. Increasing deployment of clean energy technologies provides manufacturers with a more stable demand and enables investment that drives down prices through economies of scale.
Our results also emphasize the importance of policymakers having a deep understanding the entire supply chain of clean energy technologies, because even in cases where the end product manufacturing is concentrated, the upstream components and materials may come from many economies. Due to the complex influences across many sectors of national and global economies, considering the entire development, manufacturing, and deployment supply chain in investment and incentive decisions could be important.
Manufacturing of clean energy technologies is a global enterprise that changes in response to market forces and technology advances in new end products and also in advanced manufacturing equipment, processes, and materials used to generate these end products. Deeper knowledge of the product supply chains and market volumes can inform industry decisions related to the location of manufacturing facilities for extracting and processing raw materials, making the required subcomponents, and assembling the final product. This knowledge can also inform decisions around R&D and international trade.
We look forward to continuing to benchmark the four technologies assessed in this report, increasing the detailed understanding of their value chains, as well as broadening the scope of our benchmark efforts to include other commercial and emerging clean energy technologies.


Operated by the Joint Institute for Strategic Energy Analysis
Established in 2015 by the U.S. Department of Energy’s Clean Energy Manufacturing Initiative, CEMAC engages the DOE national lab complex, DOE offices, U.S. federal agencies, universities, and industry to promote economic growth in the transition to a clean energy economy. CEMAC is operated by the Joint Institute for Strategic Energy Analysis at the DOE’s National Renewable Energy Laboratory.ManufacturingCleanEnergy.org
NREL/TP-6A50-65619
January 2017 Join the conversation with #CleanEnergyMFG
linkedin.com/company/clean-energy-manufacturing-analysis-center
Prepared by:
Debbie Sandor
Donald Chung
David Keyser
Margaret Mann
Jill Engel-Cox