benchmarking activities benchmarking the industry sector ... · workshop 8: benchmarking peter...
TRANSCRIPT
FIDIC Annual Conference – Copenhagen, DenmarkSeptember 12 – 16, 2004
Workshop 8: BenchmarkingPeter Boswell, FIDIC
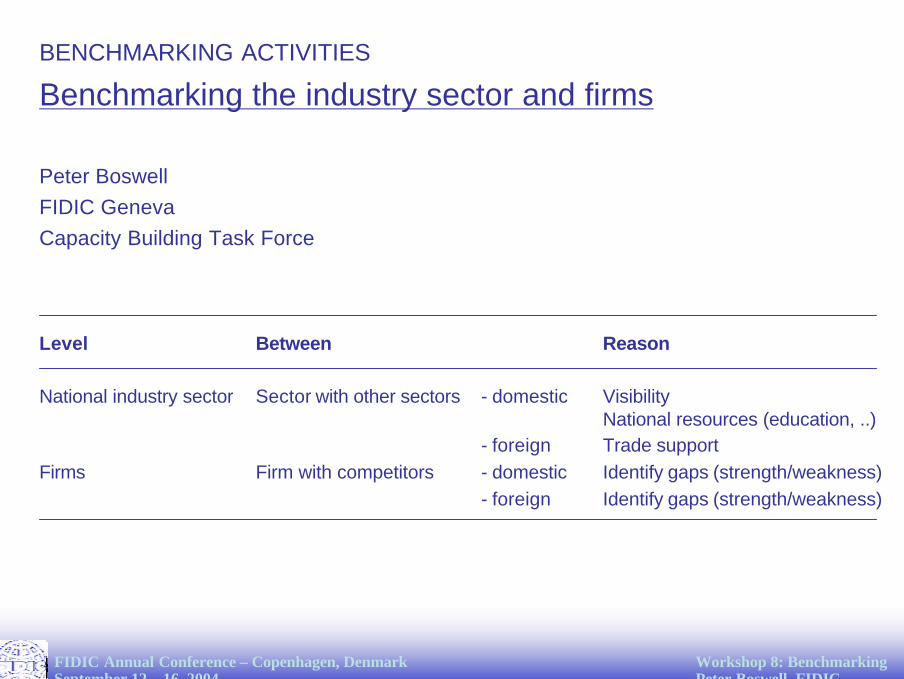
BENCHMARKING ACTIVITIES
Benchmarking the industry sector and firms
Peter BoswellFIDIC GenevaCapacity Building Task Force
Level Between Reason
National industry sector Sector with other sectors - domestic VisibilityNational resources (education, ..)
- foreign Trade supportFirms Firm with competitors - domestic Identify gaps (strength/weakness)
- foreign Identify gaps (strength/weakness)
FIDIC Annual Conference – Copenhagen, DenmarkSeptember 12 – 16, 2004
Workshop 8: BenchmarkingPeter Boswell, FIDIC
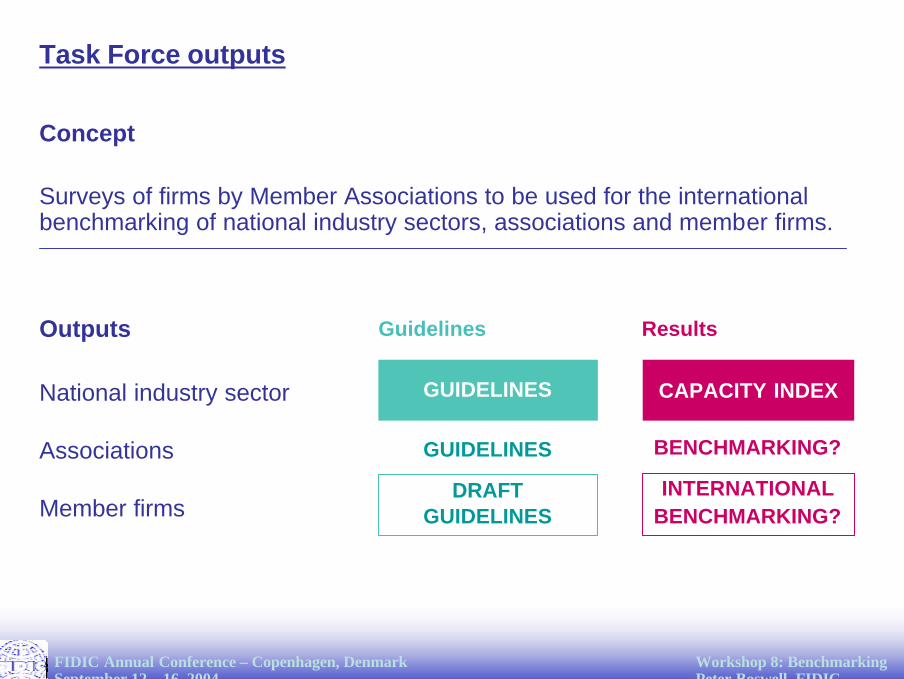
Concept
Surveys of firms by Member Associations to be used for the international benchmarking of national industry sectors, associations and member firms.
GUIDELINES CAPACITY INDEX
INTERNATIONALBENCHMARKING?
Task Force outputs
GUIDELINES
Outputs
National industry sector
Associations
Member firms
Guidelines Results
DRAFT GUIDELINES
BENCHMARKING?

FIDIC Annual Conference – Copenhagen, DenmarkSeptember 12 – 16, 2004
Workshop 8: BenchmarkingPeter Boswell, FIDIC
Country environment– Stable and equitable business environment– Clear rules and regulations– QBS wherever possible– Integrity environment
Industry structure and organization– Capacity of Member Association: staff, budget, governance– Representation of industry– Programmes: government liaison, group action, capacity building
Individual firm capacity– Firm management effectiveness– Human resources capacity: best and brightest– Effective project, integrity and quality management
National industry sector capacity
FIDIC Annual Conference – Copenhagen, DenmarkSeptember 12 – 16, 2004
Workshop 8: BenchmarkingPeter Boswell, FIDIC
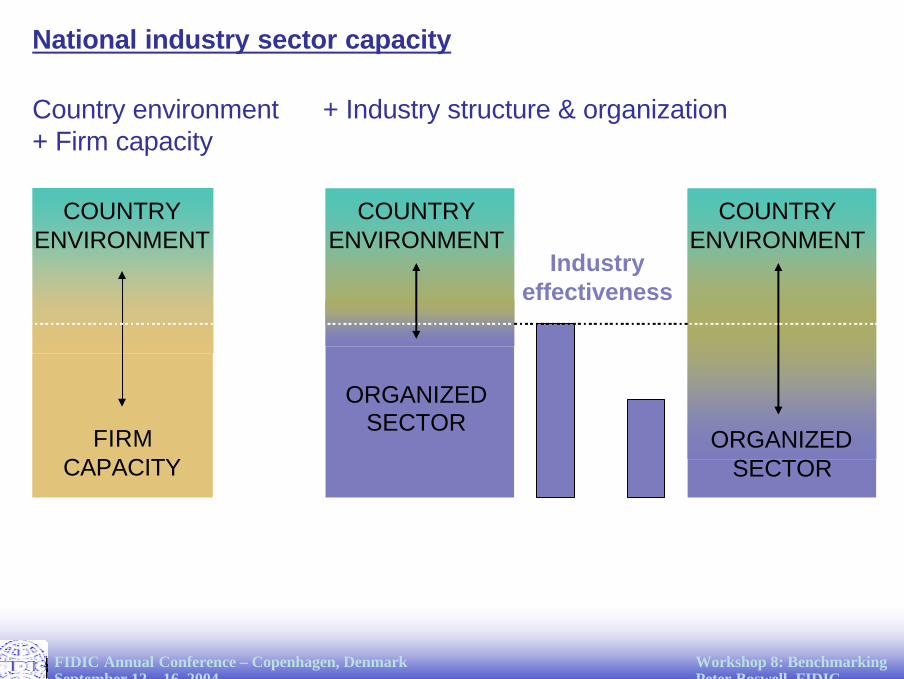
COUNTRY ENVIRONMENT
National industry sector capacity
Country environment + Industry structure & organization+ Firm capacity
FIRMCAPACITY
COUNTRY ENVIRONMENT
ORGANIZEDSECTOR
Industryeffectiveness
COUNTRY ENVIRONMENT
ORGANIZEDSECTOR
FIDIC Annual Conference – Copenhagen, DenmarkSeptember 12 – 16, 2004
Workshop 8: BenchmarkingPeter Boswell, FIDIC
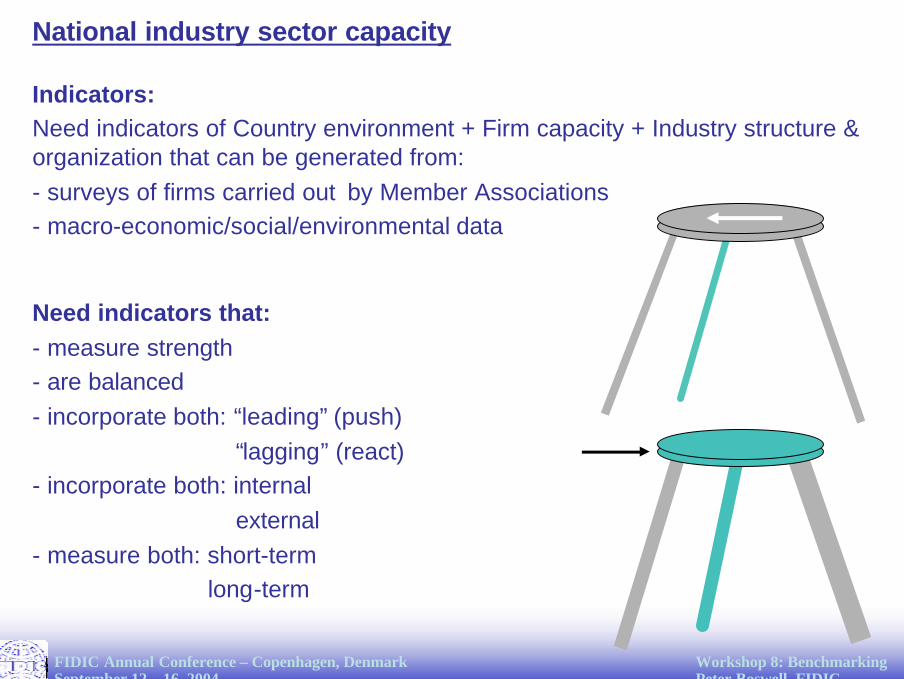
Need indicators that:- measure strength- are balanced- incorporate both: “leading” (push)
“lagging” (react)- incorporate both: internal
external- measure both: short-term
long-term
National industry sector capacity
Indicators:Need indicators of Country environment + Firm capacity + Industry structure & organization that can be generated from:- surveys of firms carried out by Member Associations- macro-economic/social/environmental data
FIDIC Annual Conference – Copenhagen, DenmarkSeptember 12 – 16, 2004
Workshop 8: BenchmarkingPeter Boswell, FIDIC
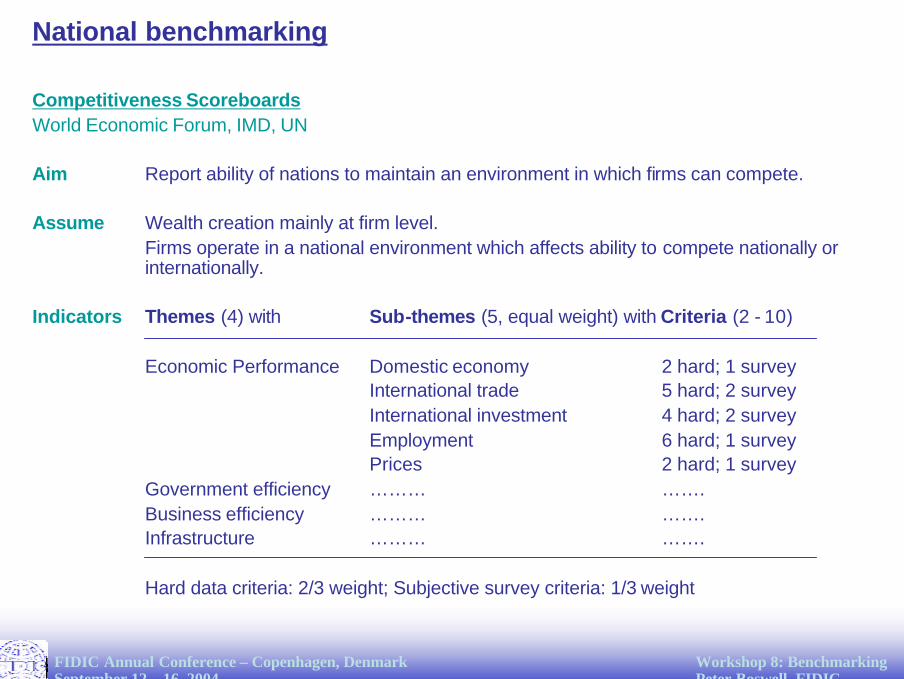
Competitiveness ScoreboardsWorld Economic Forum, IMD, UN
Aim Report ability of nations to maintain an environment in which firms can compete.
Assume Wealth creation mainly at firm level.Firms operate in a national environment which affects ability to compete nationally or internationally.
Indicators Themes (4) with Sub-themes (5, equal weight) with Criteria (2 - 10)
Economic Performance Domestic economy 2 hard; 1 surveyInternational trade 5 hard; 2 surveyInternational investment 4 hard; 2 surveyEmployment 6 hard; 1 surveyPrices 2 hard; 1 survey
Government efficiency ……… …….Business efficiency ……… …….Infrastructure ……… …….
Hard data criteria: 2/3 weight; Subjective survey criteria: 1/3 weight
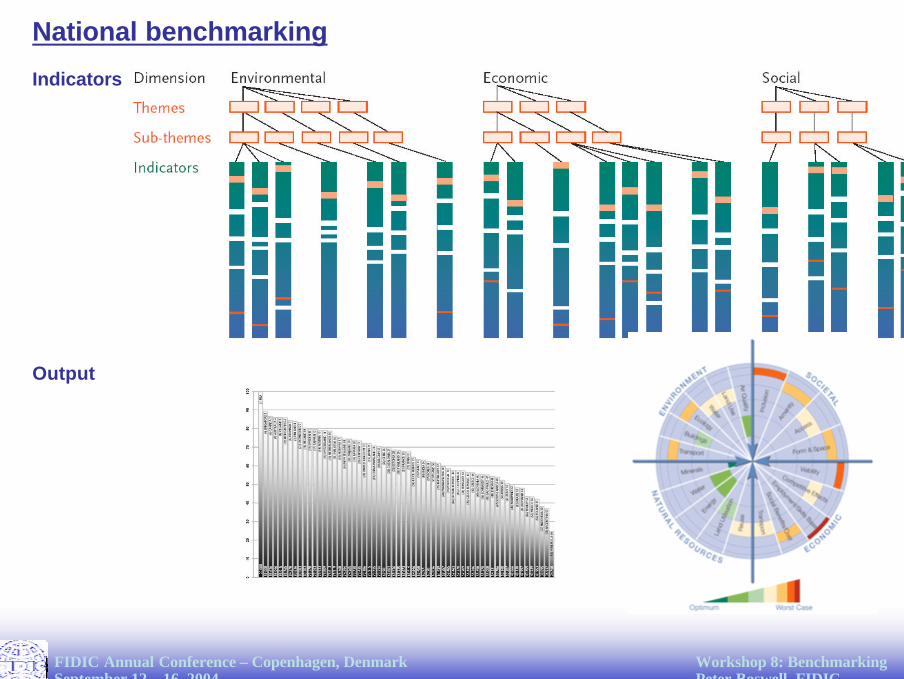
National benchmarking
FIDIC Annual Conference – Copenhagen, DenmarkSeptember 12 – 16, 2004
Workshop 8: BenchmarkingPeter Boswell, FIDIC
Indicators
Output
National benchmarking
FIDIC Annual Conference – Copenhagen, DenmarkSeptember 12 – 16, 2004
Workshop 8: BenchmarkingPeter Boswell, FIDIC
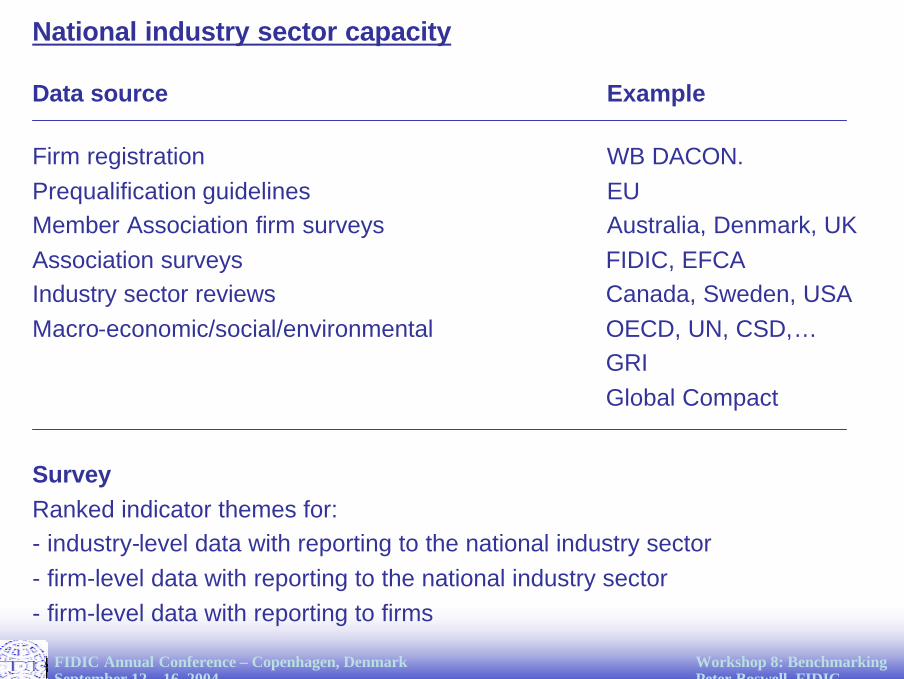
National industry sector capacity
Data source Example
Firm registration WB DACON.Prequalification guidelines EUMember Association firm surveys Australia, Denmark, UKAssociation surveys FIDIC, EFCAIndustry sector reviews Canada, Sweden, USAMacro-economic/social/environmental OECD, UN, CSD,…
GRIGlobal Compact
SurveyRanked indicator themes for: - industry-level data with reporting to the national industry sector- firm-level data with reporting to the national industry sector- firm-level data with reporting to firms
FIDIC Annual Conference – Copenhagen, DenmarkSeptember 12 – 16, 2004
Workshop 8: BenchmarkingPeter Boswell, FIDIC
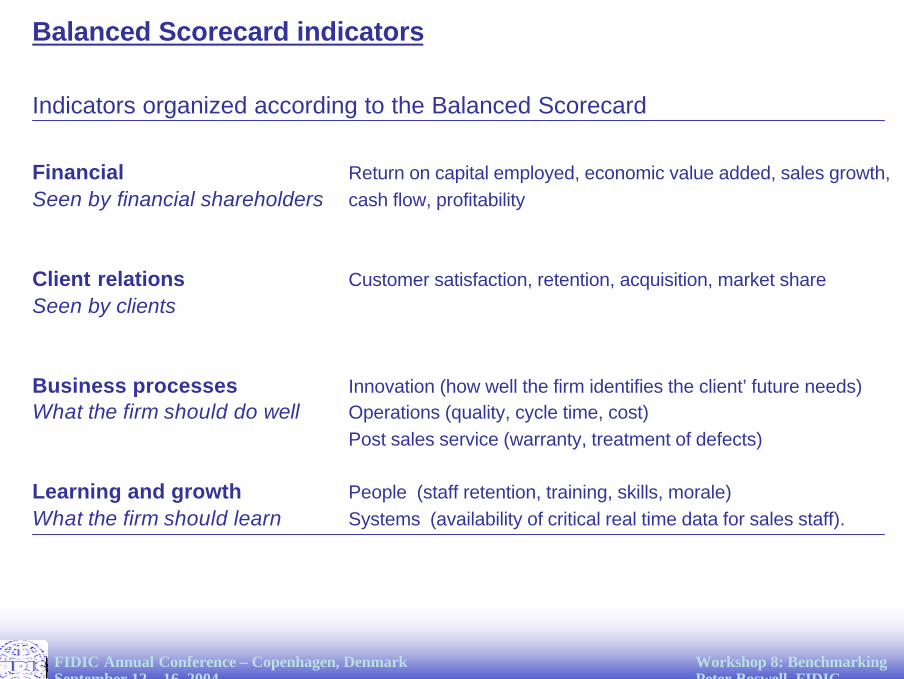
Balanced Scorecard indicators
Indicators organized according to the Balanced Scorecard
Return on capital employed, economic value added, sales growth, cash flow, profitability
Customer satisfaction, retention, acquisition, market share
Innovation (how well the firm identifies the client’ future needs)Operations (quality, cycle time, cost)Post sales service (warranty, treatment of defects)
People (staff retention, training, skills, morale)Systems (availability of critical real time data for sales staff).
FinancialSeen by financial shareholders
Client relationsSeen by clients
Business processesWhat the firm should do well
Learning and growthWhat the firm should learn

FIDIC Annual Conference – Copenhagen, DenmarkSeptember 12 – 16, 2004
Workshop 8: BenchmarkingPeter Boswell, FIDIC
National industry sector indicatorsSurvey results
123456
Technical performanceQualificationsTrainingStaff turnoverStaff satisfactionInnovation / R&D
Learning and growth
12345
Marketing Contract typeContract selection methodOrganizationProject performance
Business processes
12
Sources of workClient satisfaction
Client relations
123
Capital performanceOperating performanceOther aspects
Financial management
RankingSub-themeTheme
Ranking of indicator themes for firm-level data with firm-level reporting

FIDIC Annual Conference – Copenhagen, DenmarkSeptember 12 – 16, 2004
Workshop 8: BenchmarkingPeter Boswell, FIDIC
National industry sector indicatorsSurvey results
Solvency: assets per unit of liabilities
Ownership: shareholders’ loan + equity per unit of funds employed
Ownership: equity per unit of total assets
Ownership succession: percent of firms saying that succession planning of ownership is important
Investment: equity capital per employee
Return on capital: pretax profit per unit of equity capital
Capital performance
IndicatorsSub-theme
Ranking of indicator themes for firm-level data with firm-level reporting
FIDIC Annual Conference – Copenhagen, DenmarkSeptember 12 – 16, 2004
Workshop 8: BenchmarkingPeter Boswell, FIDIC
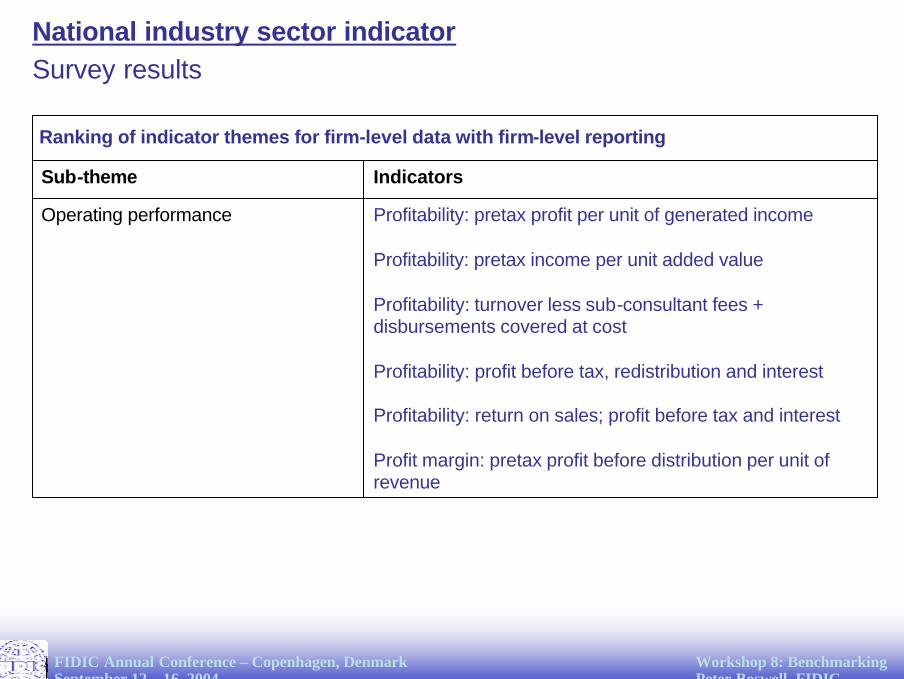
National industry sector indicator Survey results
Profitability: pretax profit per unit of generated income
Profitability: pretax income per unit added value
Profitability: turnover less sub-consultant fees + disbursements covered at cost
Profitability: profit before tax, redistribution and interest
Profitability: return on sales; profit before tax and interest
Profit margin: pretax profit before distribution per unit of revenue
Operating performance
IndicatorsSub-theme
Ranking of indicator themes for firm-level data with firm-level reporting
FIDIC Annual Conference – Copenhagen, DenmarkSeptember 12 – 16, 2004
Workshop 8: BenchmarkingPeter Boswell, FIDIC
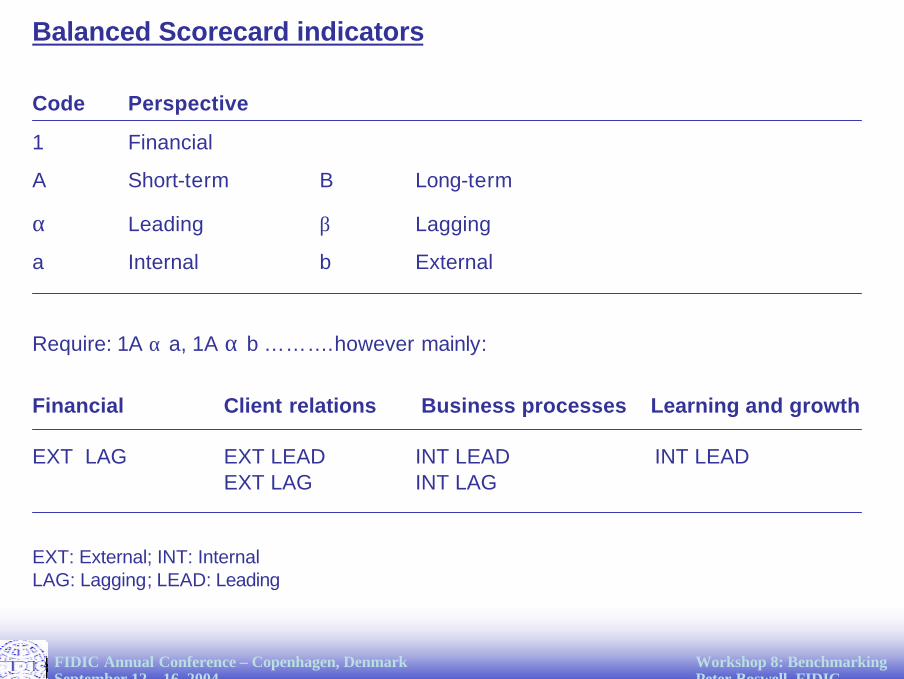
Balanced Scorecard indicators
Code Perspective
1 Financial
A Short-term B Long-term
α Leading β Lagging
a Internal b External
Require: 1A α a, 1A α b ……….however mainly:
Financial Client relations Business processes Learning and growth
EXT LAG EXT LEAD INT LEAD INT LEADEXT LAG INT LAG
EXT: External; INT: InternalLAG: Lagging; LEAD: Leading

FIDIC Annual Conference – Copenhagen, DenmarkSeptember 12 – 16, 2004
Workshop 8: BenchmarkingPeter Boswell, FIDIC
Staff per firm
H
Association fee as % of member firm revenue H
Distribution of association activities S
% foreign revenue
H
About firms
New industry graduates per total graduates H
Association uniquenessS
Integrity Index
S
GDP per capita
H
About country
Learning and growthINT LEAD
Business processes INT LEAD/LAG
Client relationsEXT LEAD/LAG
FinancialEXT LAG
Indicators mainly reported to the country levelData level
Staff distribution in small versus large firms H
% QBS versus QCBS
S
Private client revenue as a % total revenueH
Member firm % of industry revenue
H
About firms
Firm staff per capita
H
Association budget
H
Clarity ofprocurementS
Industry revenue as % of GDP H
About country
Indicators mainly reported to the firm level
National industry sector: scorecard indicators
H: Hard data; S: Subjective survey result
FIDIC Annual Conference – Copenhagen, DenmarkSeptember 12 – 16, 2004
Workshop 8: BenchmarkingPeter Boswell, FIDIC
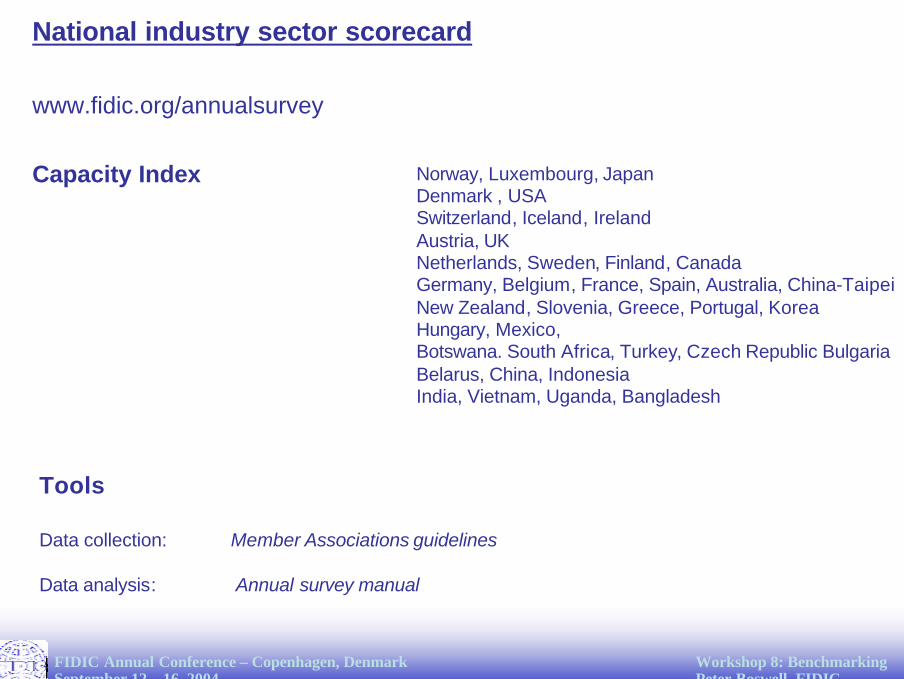
National industry sector scorecard
www.fidic.org/annualsurvey
Capacity Index Norway, Luxembourg, JapanDenmark , USA Switzerland, Iceland, Ireland Austria, UKNetherlands, Sweden, Finland, CanadaGermany, Belgium, France, Spain, Australia, China-TaipeiNew Zealand, Slovenia, Greece, Portugal, KoreaHungary, Mexico, Botswana. South Africa, Turkey, Czech Republic BulgariaBelarus, China, IndonesiaIndia, Vietnam, Uganda, Bangladesh
Tools
Data collection: Member Associations guidelines
Data analysis: Annual survey manual
FIDIC Annual Conference – Copenhagen, DenmarkSeptember 12 – 16, 2004
Workshop 8: BenchmarkingPeter Boswell, FIDIC
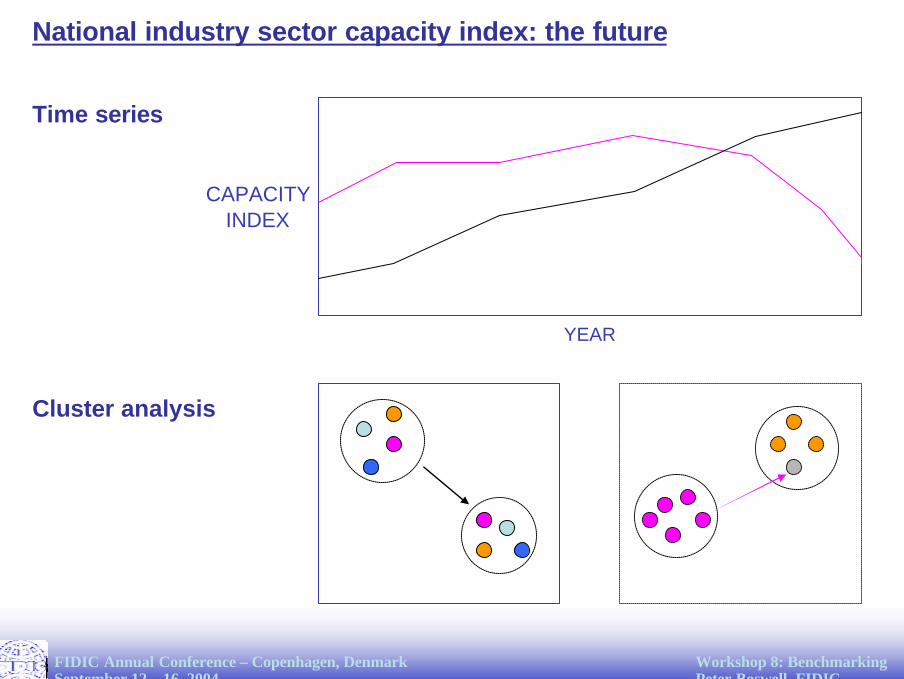
National industry sector capacity index: the future
Cluster analysis
Time series
YEAR
CAPACITY INDEX
FIDIC Annual Conference – Copenhagen, DenmarkSeptember 12 – 16, 2004
Workshop 8: BenchmarkingPeter Boswell, FIDIC
Firm benchmarking
1. Guidelines for Member Associations
- Draft based on survey of Member Associations
2. Indicators for international firm benchmarking
- Draft set under discussion
- Use international accounting definitions?
FIDIC Annual Conference – Copenhagen, DenmarkSeptember 12 – 16, 2004
Workshop 8: BenchmarkingPeter Boswell, FIDIC
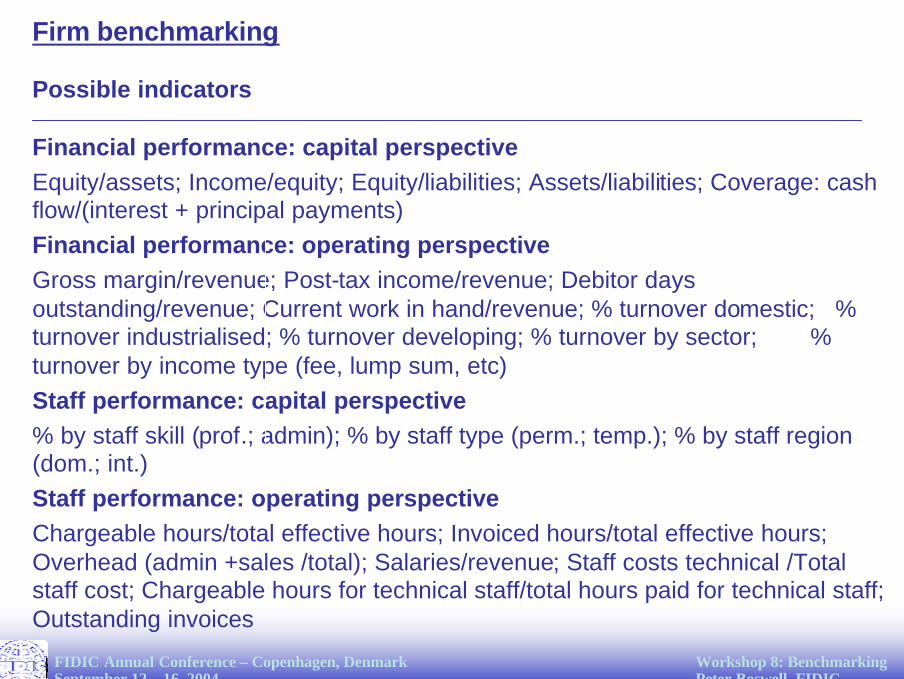
Firm benchmarking
Possible indicators
Financial performance: capital perspectiveEquity/assets; Income/equity; Equity/liabilities; Assets/liabilities; Coverage: cash flow/(interest + principal payments)Financial performance: operating perspectiveGross margin/revenue; Post-tax income/revenue; Debitor days outstanding/revenue; Current work in hand/revenue; % turnover domestic; % turnover industrialised; % turnover developing; % turnover by sector; % turnover by income type (fee, lump sum, etc)Staff performance: capital perspective% by staff skill (prof.; admin); % by staff type (perm.; temp.); % by staff region (dom.; int.)Staff performance: operating perspectiveChargeable hours/total effective hours; Invoiced hours/total effective hours; Overhead (admin +sales /total); Salaries/revenue; Staff costs technical /Total staff cost; Chargeable hours for technical staff/total hours paid for technical staff; Outstanding invoices