an environmental balanced scorecard for supply chain...
TRANSCRIPT
Seediscussions,stats,andauthorprofilesforthispublicationat:https://www.researchgate.net/publication/304382194
Anenvironmentalbalancedscorecardforsupplychainperformancemeasurement(Env_BSC_4_SCPM)
ArticleinBenchmarkingAnInternationalJournal·August2016
DOI:10.1108/BIJ-08-2013-0087
CITATIONS
0
READS
67
3authors:
SusanaAzevedo
UniversidadedaBeiraInterior
122PUBLICATIONS657CITATIONS
SEEPROFILE
LuísFerreira
UniversityofCoimbra
32PUBLICATIONS20CITATIONS
SEEPROFILE
CristovãoSilva
UniversityofCoimbra
54PUBLICATIONS302CITATIONS
SEEPROFILE
Allin-textreferencesunderlinedinbluearelinkedtopublicationsonResearchGate,
lettingyouaccessandreadthemimmediately.
Availablefrom:SusanaAzevedo
Retrievedon:14November2016

Benchmarking: An International JournalAn environmental balanced scorecard for supply chain performance measurement (Env_BSC_4_SCPM)Luís Miguel D. F. Ferreira Cristóvão Silva Susana Garrido Azevedo
Article information:To cite this document:Luís Miguel D. F. Ferreira Cristóvão Silva Susana Garrido Azevedo , (2016),"An environmental balanced scorecard forsupply chain performance measurement (Env_BSC_4_SCPM)", Benchmarking: An International Journal, Vol. 23 Iss 6 pp. -Permanent link to this document:http://dx.doi.org/10.1108/BIJ-08-2013-0087
Downloaded on: 24 June 2016, At: 09:42 (PT)References: this document contains references to 0 other documents.To copy this document: [email protected]
Access to this document was granted through an Emerald subscription provided by emerald-srm:135966 []
For AuthorsIf you would like to write for this, or any other Emerald publication, then please use our Emerald for Authors serviceinformation about how to choose which publication to write for and submission guidelines are available for all. Pleasevisit www.emeraldinsight.com/authors for more information.
About Emerald www.emeraldinsight.comEmerald is a global publisher linking research and practice to the benefit of society. The company manages a portfolio ofmore than 290 journals and over 2,350 books and book series volumes, as well as providing an extensive range of onlineproducts and additional customer resources and services.
Emerald is both COUNTER 4 and TRANSFER compliant. The organization is a partner of the Committee on PublicationEthics (COPE) and also works with Portico and the LOCKSS initiative for digital archive preservation.
*Related content and download information correct at time of download.
Dow
nloa
ded
by U
NIV
ER
SID
AD
E D
E A
VE
IRO
At 0
9:42
24
June
201
6 (P
T)

1
An Environmental Balanced Scorecard for Supply Chain Performance Measurement (Env_BSC_4_SCPM)
1. Introduction
Organizations are increasingly aware and concerned with the environmental and social impact of
their business activities (Winter and Knemeyer, 2013 Gold et al., 2010; Carter and Easton, 2011;
Yu and Tang, 2011).
The focus on supply chains is a step towards the broader adoption and development of
sustainability, since the supply chain considers the product from initial processing of raw
materials to delivery until the customer. However, this demands for the integration of issues and
flows that extend beyond the core of supply chain management: product design, manufacturing
by-products, product life extension, product end-of-life, and recovery processes at end-of-life
(Linton et al., 2007).
Supply chain managers must address a complex assortment of factors that include the product
and the process on both the upstream and downstream of the supply chain (Vachon and Klassen,
2006). Environmental impact of business activities has become an important issue in the last years
due to growing public awareness of environmental, and the introduction of environmental
legislations and regulations mainly in developed countries (Lau, 2011). Srivastava (2007) argues
that “much research is needed to support the evolution in business practice towards greening
along the entire supply chain”.
To address these stakeholders’ concerns, manufacturers have adopted different strategies that
focus on internal operations (Vachon and Klassen, 2006). However, in recent years, more and
more companies are introducing and integrating environmental issues into supply chain
management processes by auditing and assessing suppliers on environmental performance
metrics (Handfield et al., 2005). In this way they seek to ensure that they have effective tools not
only for measuring environmental performance of their suppliers but also to help choose them for
new projects/products or for carrying out action plans to improve their performance (Naini et al.,
2011; Olugu et al., 2011).
However, traditionally the performance measurement of supply chain has been oriented around
cost, time and accuracy criteria (Gopal and Thakkar, 2012; Thakkar et al., 2009; Bhagwat and
Sharma, 2007; Hervani et al., 2005; Gunasekaran et al., 2004; Gunasekaran et al., 2001).
Hervani et al., (2005) argue that there are difficulties in measuring performance within
organizations and even more difficulties come up in inter-organizational environmental
performance measurement. The authors point out the following reasons for the lack of systems to
measure performance across organizations: non-standardized data, poor technological
integration, geographical and cultural differences, differences in organizational policy, lack of
agreed upon metrics, or poor understanding of the need for inter-organizational performance
measurement.
Performance measurement in supply chains is difficult for additional reasons, especially when
looking at numerous tiers within a supply chain (Lehtinen and Ahola, 2010; Hervani et al., 2005;
Gunasekaran et al., 2004). Overcoming these barriers is not a small issue, but the long-term
sustainability (environmental and otherwise) and competitiveness of organizations relies on
successful implementation of performance measurement systems (Olugu et al., 2011; Hervani et
al., 2005).
Dow
nloa
ded
by U
NIV
ER
SID
AD
E D
E A
VE
IRO
At 0
9:42
24
June
201
6 (P
T)

2
Shaw et al., (2010) conducted an extensive literature review on this issue and concluded that
environmental supply chain performance measurement is “relatively under-researched in supply
chain and environmental management literature”. The authors proposed a framework, which
integrates the Balanced Scorecard (BSC), Global Reporting Initiative (GRI) and ISO 14031
frameworks, and will enable organizations to effectively manage and benchmark (internally and
externally) their environmental supply chain performance. However, that framework was not
tested and the authors argue that more research is required in the field to supply direction for
practitioners.
The literature shows that most models for evaluating environmental performance focus on the
evaluation of the organization itself (Tóth, 2003; Dias-Sardinha and Reijnders, 2001) and the data
used is reported by the companies in their environmental reporting (Colicchia et al., 2011).Thus,
the main objective of this paper is to propose a model for evaluate the environmental
performance of supply chains. The contribution of this study relies on the development and
application of a model for the evaluation of the environmental performance of the upstream
supply chain using data collected from the first tier suppliers and in this sense this work extends
the work of Shaw et al., (2010). As far as we know, this is the first time that a model which
incorporates environmental performance indicators, based on GRI and ISO 14031, within the BSC
framework is tested with data collected from a case study company.
The article is divided into five sections. This section seeks to provide an introduction to the topic
in question and define the objective of the study: to propose a model for evaluating the
environmental performance of the supply chain. The second section presents a literature review
on supply chain management and sustainability, evaluation models for environmental
performance measurement. Section 3 presents a model for evaluating the environmental
performance of a supply chain. In the fourth section the proposed model is applied in an
automotive industry company case study. Finally, the main conclusions of the study are drawn in
section 5.
Dow
nloa
ded
by U
NIV
ER
SID
AD
E D
E A
VE
IRO
At 0
9:42
24
June
201
6 (P
T)

3
2. Literature review
This review is structured as follows. A brief review on supply chain management and it
relationship to sustainability is presented in section 2.1 before literature on models for supply
chain environmental performance management is reviewed.
2.1 Supply chain management and sustainability
The concept of Supply Chain Management was born and brought a new facet to company
management in the 1980s (Luque and López, 2009). Supply chain management is the coordination
and management of a complex network of activities involved in delivering a finished product to
the end-user or customer. It is a vital business function and the process includes sourcing raw
materials and parts, manufacturing and assembling products, storage, order entry and tracking,
distribution through the various channels and finally delivery to the customer (Hervani et al.,
2005).
Handfield and Nichols (1999) argued that manufacturers must not only manage their own
organizations but also be involved in the management of the network of upstream and
downstream firms. Supply chain management has gained a strategic relevance as a source of
competitive advantage (Fine, 1998; Christopher, 1992) and managing value on supply chains has
become critical for company survival and growth. Practitioners and researchers should focus not
only on individual companies, but also on the value chains that supply chains and their various
links represent, including the range of suppliers, the firms that produce the final product and
distributors and customers. For an improvement in the supply chain management, it is crucial to
have a good planning, organization and control of the activities across the supply chain
(Christopher, 1998).
The focus on the supply chain enables the development of topics related to sustainability, as the
supply chain encompasses the different stages ranging from the initial processing of raw materials
to delivery to the end customer (Stonebraker et al., 2009; Vasileiou and Morris, 2006). It can be
argued that the sustainability opens a window of opportunity for improving the performance of
organizations even though it may require short-term investments (Corbett and Klassen, 2006).
A focus on supply chains is a step towards the broader adoption and development of
sustainability, since the supply chain considers the product from initial processing of raw
materials to delivery to the customer (Linton et al., 2007). Furthermore, sustainability introduces
the interaction between economic, social and environmental issues (Carter and Easton, 2011;
Gold et al., 2010; Seuring and Muller, 2008).
The integration of issues related to sustainability in the legislation encourages companies to
change the way they operate (Webster and Mitra, 2007). These changes require not only the
management of new concepts, such as the reverse supply chain, or green purchasing, but also a
clear change in existing practices and concepts creating new management and production
systems. It has become essential to include the management of by-products and to consider the
life cycle of the product in supply chain management. The total cost should include the effects of
resource depletion and the generation of by-products that are not captured or used (pollutants
and waste). It is therefore essential to investigate the operational implications and how
organizations can incorporate sustainability issues into their management practices (Fandel and
Stammen, 2004; Jiménez and Lorente, 2001) and create competitive advantage (Markley and
Davis, 2007).
Dow
nloa
ded
by U
NIV
ER
SID
AD
E D
E A
VE
IRO
At 0
9:42
24
June
201
6 (P
T)
4
2.2 Evaluation models for supply chain environmental performance measurement
For any activity that has strategic implications, such as the management of the supply chain, it is
essential to make performance reviews. According to Chan (2003), performance evaluation
describes the return of information from activities related to strategic objectives and reflects the
need for improvement in areas of poor performance. Although many papers have been published
on the assessment of environmental performance within organizations, the emphasis on the
evaluation of environmental performance of the supply chain (especially between organizations),
has been relatively limited (Azevedo et al., 2011; Gunasekaran et al. 2004).
In a supply chain, a significant number of actors influence not only the costs but also the
associated environmental impacts. Suppliers, producers, consumers, logistics providers, as well as
services suppliers are the main players. All these players perform most activities that impact
business and the environment. Thus, it is necessary to create models that make possible to assess
the environmental performance of the supply chain, promoting also the monitoring of indicators
that support decision-making and management (Dey and Cheffi, 2012; Naini, 2011; Shaw et al.,
2010; Olugu et al., 2001).
Shaw et al., (2010) performed an extensive literature review and concluded that there has “only
been limited research into incorporating environmental measure or metrics into the bank of supply
chain performance measures”. The authors proposed a framework, that integrates the ISO 14031,
GRI and BSC frameworks, which will enable organizations to effectively manage and benchmark
(internally and externally) their environmental supply chain performance.
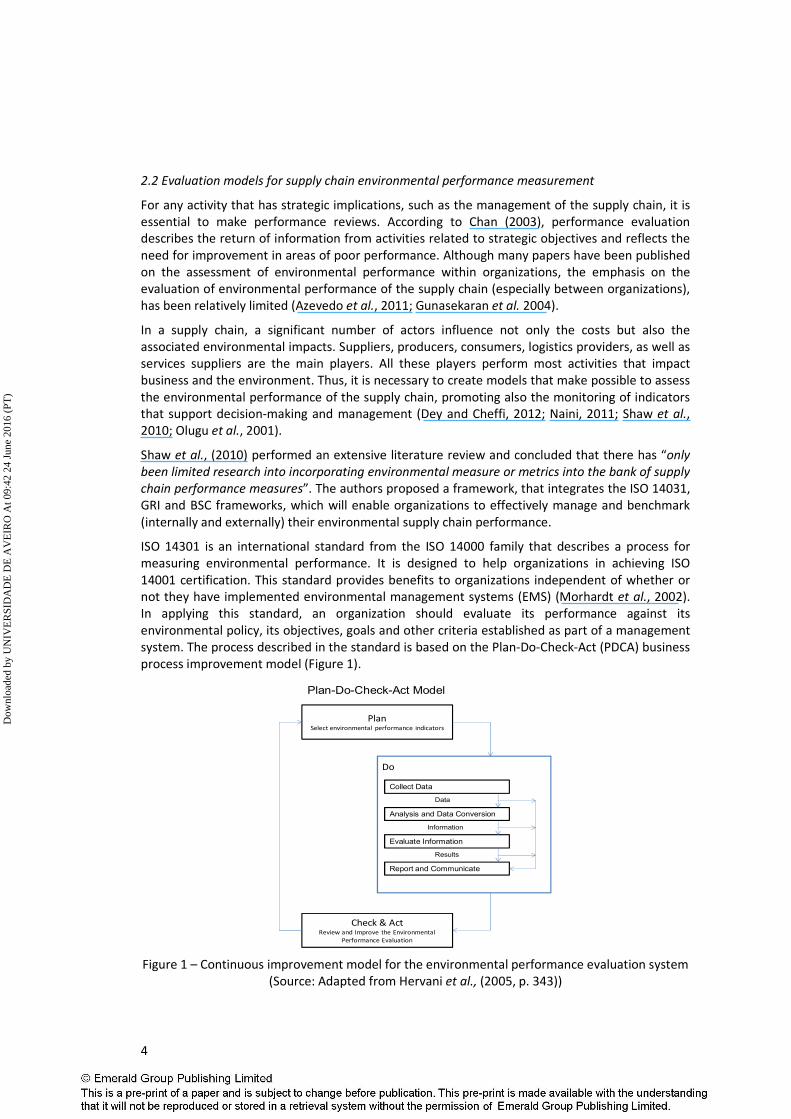
ISO 14301 is an international standard from the ISO 14000 family that describes a process for
measuring environmental performance. It is designed to help organizations in achieving ISO
14001 certification. This standard provides benefits to organizations independent of whether or
not they have implemented environmental management systems (EMS) (Morhardt et al., 2002).
In applying this standard, an organization should evaluate its performance against its
environmental policy, its objectives, goals and other criteria established as part of a management
system. The process described in the standard is based on the Plan-Do-Check-Act (PDCA) business
process improvement model (Figure 1).
Figure 1 – Continuous improvement model for the environmental performance evaluation system
(Source: Adapted from Hervani et al., (2005, p. 343))
PlanSelect environmental performance indicators
Plan-Do-Check-Act Model
Do
Check & ActReview and Improve the Environmental
Performance Evaluation
Collect Data
Analysis and Data Conversion
Evaluate Information
Report and Communicate
Data
Information
Results
Dow
nloa
ded
by U
NIV
ER
SID
AD
E D
E A
VE
IRO
At 0
9:42
24
June
201
6 (P
T)

5
The number of companies that adopt EMS to provide guidance on mitigating their impact on the
environment has been increasing (Griffith and Bhutto, 2009). In fact, the EMS provides an
organized, systematic, and coherent scheme to properly address the environmental questions in
organizations. Its main purpose is to improve environmental performance (Perotto et al., 2008).
The implementation of an EMS allows: the synthesis and communication of information, the
identification of priority areas for intervention and provides a measure of the distance to the
targets set. An organization that has implemented an EMS can thus assess environmental
performance against its environmental policy, objectives, targets and other environmental
performance criteria.
A decisive phase in environmental performance evaluation is the development and/or selection of
indicators. The indicators will support the organization in the quantification and communication
of its environmental assessment. Particularly, the indicators allow summarizing and classifying the
environmental information, providing an immediate picture of the environmental situation of the
organization. These should be defined for those environmental impacts that the organization has
direct influence over, as a result of its operations, management, activities, products or services.
These values are essential, since they will represent a benchmark and set reference for future
assessments of environmental performance. In turn, this information will also be useful for
decision making and to ensure a better alignment of the objectives and environmental targets to
the strategies and policies of the organization (Campos and Melo, 2008).
Studies conducted on the use of indicators to measure performance in EMS have highlighted the
relevance of using performance indicators related to strategic objectives. The indicators provide a
measurement of the degree of success in the implementation of a strategy comparing it to a
defined objective. A key issue in the development of environmental performance indicators is the
ability to make comparisons within and between organizations. There is the possibility that this
data can be used to make environmental decisions, involving various organizations. However, the
possibility of inter-organization comparisons assumes a set of shared standards, in terms of the
techniques employed, including the indicators and the time span used. Only in this way it will be
possible to carry out environmental benchmarking in a more credible and continuous way.
However, the implementation of an EMS does not guarantee by itself the improvement of the
performance of an organization (Chen, 2004). The results of evaluating environmental
performance should be periodically reviewed so as to identify opportunities for improving it. The
emphasis for improvement can be centered on improving data quality, increasing analytical and
evaluative capacity, or developing new indicators, as such encouraging a change in the remit of
the program or a rearrangement of resources.
Some frameworks exist to evaluate the environmental performance of individual companies and
supply chains. The GRI is an international agreement, created in 1997, with the mission of drawing
up and disseminating the directives for writing sustainability reports. These reports are produced
by organizations wishing to communicate their economic, environmental and social performance
to different stakeholders. The GRI directives recommend that the sustainability report should
contain, among others, a section covering environmental performance indicators related to
consumption (for example, raw materials, energy or water), and production (for example,
emissions, effluent, and waste) (GRI, 2002). Moreover, these indicators should take into account
the performance related to biodiversity, environmental compliance and other relevant
information, such as spending on the surrounding environment and the impacts of products and
services.
Dow
nloa
ded
by U
NIV
ER
SID
AD
E D
E A
VE
IRO
At 0
9:42
24
June
201
6 (P
T)

6
The Balanced Scorecard (BSC) is a framework that was developed by Kaplan and Norton (1992).
The BSC is a system for strategic management that uses, in a balanced way, financial and non-
financial indicators while establishing cause and effect relationships between those indicators.
The main objectives of the BSC are: to clarify and translate the vision and strategy; to
communicate and associate objectives and strategic measures; to plan, establish goals and align
strategic initiatives; to improve the feedback and the strategic learning.
The initial formulation of the BSC depicts the strategy of the company distributed over four
perspectives: financial, client, internal processes, and learning and innovation (Figure 2). These
perspectives are interlinked by cause-effect relationships. The general direction of causality
moves from the learning and innovation perspective towards the financial perspective. That is,
the organizational capabilities of the organization enable improvements in its processes which, in
turn, satisfies more clients and, as such, leads to better financial performance.
Figure 2 – Viewpoints of the BSC (adapted from Kaplan and Norton, 1992)
Several authors have pointed out limitations to the use of the BSC (Bhagwat and Sharma, 2007).
The following criticisms are noteworthy: the efficiency of the BSC can be limited by
“interpretation effects”, in implementing the strategy, priority may be given to the use of financial
indicators rather than non-financial indicators, some stakeholders are not accounted for and the
formulation of the BSC can depend on the relative power of the various groups involved.
Despite those limitations the BSC’s characteristics have lead a number of researchers to see
potential for applying this new methodology to environmental management (Hsu et al., 2011; Hsu
and Liu, 2010; Shaw et al., 2010; Länsiluoto and Järvenpää, 2008; Hervani et al., 2005; Figge et al.,
2002; Epstein and Wisner, 2001; Johnson, 1998). In this process, environmental management
benefits from the advantages of using the BSC. At the same time, the BSC as a system of strategic
management becomes more complete by incorporating the treatment of the relevant strategic
aspects of environmental management.
The literature regarding the inclusion of environmental management into the BSC points to four
options (Dias-Sardinha et al., 2002): 1) the distribution of environmental indicators over the four
traditional perspectives of the BSC; 2) the creation of a fifth perspective for environmental
management: 3) the inclusion of environmental indicators only for the perspective of internal
processes; 4) the treatment of the environmental management department as a specific unit,
with the construction of a specific BSC.
Vision and
Strategy
INTERNAL BUSINESS PROCESSES:
To satisfy our clients, which
processes should we excel at?
CLIENT:
To achieve our vision, how
should clients see us?
FINANCIAL:
To be financially successful, how
is it that we should present
ourselves to our investors?
LEARNING AND GROWING:
To achieve our vision, how can
we support our ability to change
and progress?
Dow
nloa
ded
by U
NIV
ER
SID
AD
E D
E A
VE
IRO
At 0
9:42
24
June
201
6 (P
T)

7
Comparing the ISO 14031, GRI and BSC frameworks it can be concluded that they are generally
compatible with each other, sharing a set of principles and common data. The three frameworks
suggest the use of indicators. The definitions of ISO 14031 and the GRI are more specific in
relation to the use of environmental performance indicators. The BSC is a methodology that can
be adapted to environmental management and there are already several authors which have
described how this adaptation can be possible. The BSC, echoing ISO 14031, defines a generic
methodology for implementing a strategy, leading the organization itself to subsequently define
the indicators that should be used.
By not specifying any indicator from the outset, ISO 14031 and the BSC become broader and more
robust methodologies. However, this fact may also increase the subjectivity of the results, making
it difficult to compare the indicators between companies, projects or supply chains. From the
analysis of the different frameworks it is clear that none is able to effectively define a way to
assess the environmental performance of a supply chain. Thus, it seems appropriate to opt for a
combination of methods, taking advantage of what each has to offer.
Several attempts have been done to develop environmental supply chain performance measures.
Based on a cross-case analysis Azevedo et al. (2011) suggest a model to identify the influence of
several green practices on supply chain performance. The authors conclude that there is a
positive relationship between green practices implementation and: 1) supply chain operational
performance, considering “customer satisfaction” and “quality”; 2) supply chain environmental
performance, considering “reduction in business waste”; 3) supply chain economic performance,
considering “efficiency”, “reduction in costs” and “reduction in environmental costs”. The authors
conclude that the proposed model can help managers in deciding which green supply chain
practices should be adopted to improve their environment, economic and operational
performance. Nevertheless, the proposed model does not allow to quantitatively assess the
environmental performance of a given supply chain.
Braithwaite and knivett (2008) propose a model to evaluate supply chains carbon footprint. The
model is composed by three steps: 1) developing a supply chain map, representing each of the
three types of event which can occur – inventory, material conversion and transport; 2) collect
and normalize data on energy consumption and emissions; and 3) representing in the map the
accumulation of carbon footprint along the supply chain. The model is tested in a wine supply
chain, considering activities from growing of grapes to wine distribution. The model resulting map
can be used by the supply chain parties to identify carbon emissions reduction potential and
discuss SC re-design to improve it environmental performance. The authors did not discuss which
green practices should be considered to reduce the supply chain carbon footprint and their model
only consider energy consumption and emissions, ignoring other important supply chains
performance metrics.
El Saadany et al. (2011), based on an extensive literature review, propose and categorize a set of
environmental quality measures. Then, these performance measures, both quantitative and
qualitative are aggregated in an environmental quality model which can be used to assess a
supply chain environmental performance. The proposed model is tested in a two level supply
chain in which demand depends on the environmental quality of the system and the associated
costs. The model can be used to evaluate the evolution of total profit, price and demand when
changing the environmental quality value.
Hervani et al. (2005) propose a balanced scorecard-type framework to implement and measure
environmental and social performance of a company. Their model consider approximately 60
environmental performance indicators which have been pointed out as a drawback to it
implementation (Shaw et al., 2010). In fact, there is no rule to the right number of measures to
Dow
nloa
ded
by U
NIV
ER
SID
AD
E D
E A
VE
IRO
At 0
9:42
24
June
201
6 (P
T)

8
include in the BSC but, as stated by Epstein and Weisner (2001), too many performance indicators
can distract from pursuing a focused strategy. Shaw et al. (2010) refer that a complete scorecard
should contain three to six measures in each perspective.
Shaw et al (2010) present a comprehensive literature review on environmental supply chain
performance measures and they propose a green supply chain performance measurement
framework. This framework consists in incorporating a fifth environmental perspective in the
company balanced scorecard. The authors refer that the GRI and ISO 14031 are good starting
points to decide which performance indicators should be incorporated into the BSC. The paper
ends with some research questions like: “is the BSC the most appropriate framework for supply
chain performance measures?” or “How can existing ISO 14031 and GRI environmental
performance indicators be used in the BSC framework?”. The authors also refer the need to test
the proposed framework.
In this sense, the model presented in this paper, described in the following sections, can be
considered an extension of the research presented in Shaw et al. (2010) however with a different
level of specificity since it focus on the upstream of the supply chain and being empirically tested
with data from a convenience case study.
The proposed model relies on the BSC approach and use the GRI and ISO 14031 to define the
performance indicators to be used. Unlike Shaw et al. (2010), in order to facilitate the
management of the indicators and avoid introducing additional complexity to both the company’s
general performance evaluation system and the system to be created, it was decided to opt for
the development of a specific and adapted BSC to monitor the evolution of the environmental
performance of the supply chain.
Dow
nloa
ded
by U
NIV
ER
SID
AD
E D
E A
VE
IRO
At 0
9:42
24
June
201
6 (P
T)
9
3. The proposed model to assess the environmental performance of the
supply chains
According to Cohen (2004), the definition of an appropriate set of metrics allows the performance
of the activities in the supply chain to be evaluated, contributing to the diagnosis of problems and
improvement in the decision making processes. The ultimate goal of the assessment of
environmental performance is to ensure that industrial activities move towards sustainability in
an acceptable manner to both society and the environment (Linton et al., 2007).
The benchmarking of sustainability practices requires intra and inter-organizational practices with
a set of environmental and business performance outcomes (Hong et al., 2012). In practice
indicators evaluating environmental performance may be used either by stakeholders outside the
company (as in the case of the supply chain), or internally by the company (at a departmental
level), in order to establish a process for reducing the environmental impacts of their products
and processes. However, such benchmarking has not been adequately explored (Yang et al., 2011;
Soni and Kodali, 2010).
In order to address the lack of structured systems for monitoring the environmental performance
of the supply chains, the model described below was developed. Although the proposed model is
supposed to be independent of the general company BSC, it forms a natural part of the
management system, linking up with the various systems and giving decision making signals to the
top management, as well as logistics, purchasing and environmental managers.
The proposed model, named the Environmental Balanced Scorecard for Supply Chain
Performance Measurement (Env_BSC_4_SCPM), is based on the logic of the BSC to evaluate the
environmental performance of the supply chain, while using ISO 14031 and the GRI to define the
indicators.
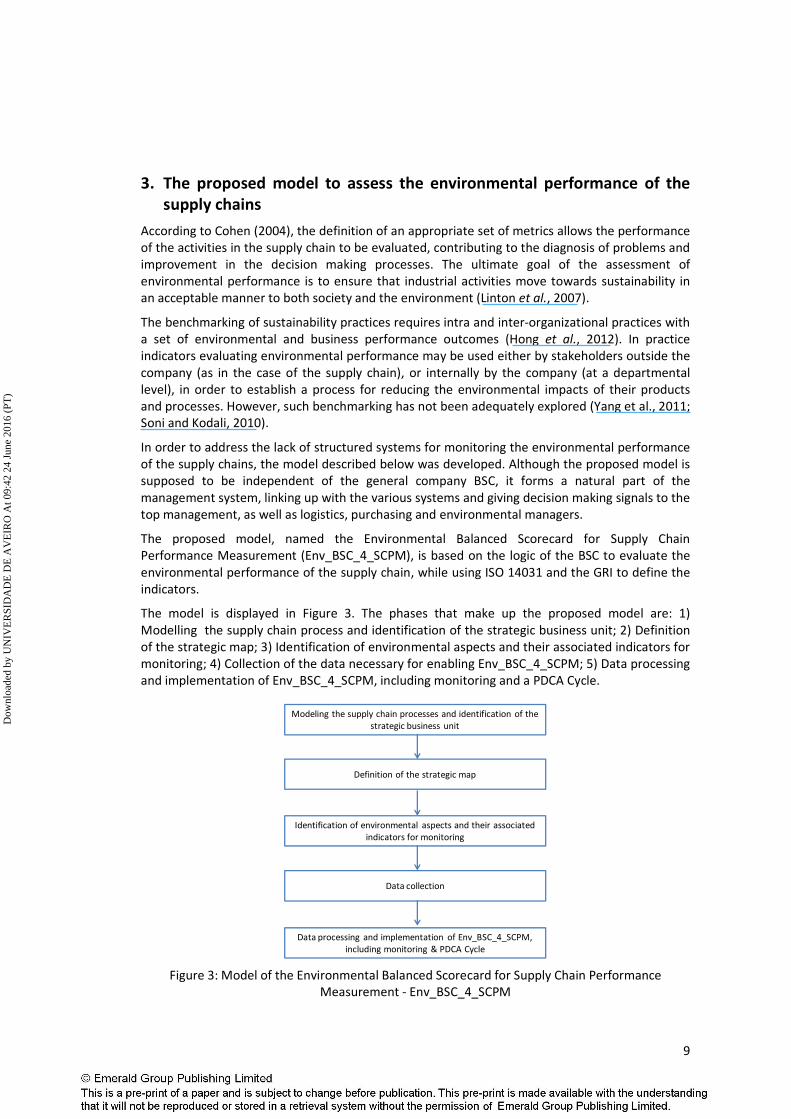
The model is displayed in Figure 3. The phases that make up the proposed model are: 1)
Modelling the supply chain process and identification of the strategic business unit; 2) Definition
of the strategic map; 3) Identification of environmental aspects and their associated indicators for
monitoring; 4) Collection of the data necessary for enabling Env_BSC_4_SCPM; 5) Data processing
and implementation of Env_BSC_4_SCPM, including monitoring and a PDCA Cycle.
Figure 3: Model of the Environmental Balanced Scorecard for Supply Chain Performance
Measurement - Env_BSC_4_SCPM
Modeling the supply chain processes and identification of the
strategic business unit
Definition of the strategic map
Identification of environmental aspects and their associated
indicators for monitoring
Data collection
Data processing and implementation of Env_BSC_4_SCPM,
including monitoring & PDCA Cycle
Dow
nloa
ded
by U
NIV
ER
SID
AD
E D
E A
VE
IRO
At 0
9:42
24
June
201
6 (P
T)
10
There now follows a description of the different phases suggested for the model.
Phase 1 - Modeling the supply chain process and identification of the strategic business unit
The project must start with the study of the supply chain in order to understand its flows,
stakeholders and particularities. After modeling the supply chain, the boundaries of the business
unit are defined for the application of Env_BSC_4_SCPM.
Phase 2 - Definition of the strategic map for the supply chain
The initial formulation of the BSC depicts the strategy of the company distributed over four
perspectives. These perspectives are interlinked by cause-effect relationships. The general
direction of causality moves from the learning and innovation perspective towards the financial
perspective. That is, the organizational capabilities of the organization enable improvements in its
processes which, in turn, contribute for suppliers’ satisfaction and consequently lead to better
financial performance. To develop a BSC it is suggested to draw-up a strategic map to clarify the
relationships between critical elements of the BSC and shows the adopted perspectives.
The definition of the strategic map for building Env_BSC_4_SCPM should take into account the
strategies of the business, supply chain management and environmental management. In order to
facilitate the management of the indicators and avoid introducing additional complexity to both
the company’s general performance evaluation system and the system to be created, it was
decided to develop a specific BSC to monitor the evolution of the environmental performance of
the supply chain.
Phase 3 - Identification of environmental aspects and their associated indicators for monitoring
In this study the option is to analyze the environmental performance of the supply chain for a
given project y. Each project y is associated to a particular Original Equipment Manufacturer
(OEM), whose lifespan is known and where there is no sharing of components between different
products that the company produces. However, in some rare cases the same supplier may provide
components for different projects.
The indicator i for project y is calculated in three steps, described below and illustrated with an
example.
Step 1: Indicator i for supplier j
The indicator i is calculated for supplier j of the project y using Equation 1.
Ind_Supplier_ij = (Raw_data_Ind_ij) x (Share_Supplier_i) (Eq. 1)
where,
Ind_Supplier_ij – Indicator i for supplier j.
Raw_data_Ind_ij – Data for the indicator i as reported by the supplier j.
Share_Supplier_i = Total sales of supplier j (in monetary units – m.u.) to the company /
total sales of supplier j (in m.u.)
Dow
nloa
ded
by U
NIV
ER
SID
AD
E D
E A
VE
IRO
At 0
9:42
24
June
201
6 (P
T)

11
Let us suppose that supplier j as an annual total sales volume of 100 m.u. Supplier j sales two
different components for the company: component a used in project y and component b used in
project z. Sales of component a represent 6 m.u. and sales of component b represent 4 m.u.
Suppose that indicator i, as reported by supplier j is 1000 units. Then Ind_Supplier_ij will be
( ) 100100
101000 =× .
The calculation of the indicators Ind_Supplier_ij is based on two important assumptions
pertaining to the variable Share_Supplier_i. Assumption 1 (Eq. 1): The sales volume of supplier i to
the organization under study as a proportion of the supplier’s total sales volume is a reasonable
proxy for the production volume proportion during the period in which the environmental
resource is consumed. Assumption 2 (Eq. 1): The component supplied by supplier j consumes the
environmental resource in equal proportion to the other products produced by that supplier
during this period based on units of production.
It is important to note that these assumptions would be violated in two cases: a) if the supplier’s
production volume mix of products is very different from their sales volume mix OR; b) if the
component provided to the organization under study consumed the environmental resource at a
greater or lesser rate than the other products produced by the supplier during this same period.
We obtain weighted indicators for different processes/business of the supplier. It is only of
interest to consider the portion related to the processes involved in the manufacture/acquisition
for the project under analysis. The adopted approach here is similar to the method proposed by
Hutchins and Sutherland (2008), that is based in the input-output modeling technique, to
characterize the social sustainability of a given supply chain.
Step 2: Indicator i for supplier j to project y
The indicator i for supplier j associated to project y is calculated using equation 2.
Ind_Supplier_Project_ijy = Ind_Supplier_ij x Share_Comp_Supplier_jy (Eq. 2)
Where
Ind_Supplier_Project_ijy – is the indicator i for supplier j associated to project y.
Share_Comp_Supplier_jy = sales of supplier j (in m.u.) corresponding to the supply of the
component to project y / Total sales of supplier j (in m.u.) to the company.
Thus, considering the example presented in step 1, for component a, the Ind_supplier_project_ijy
will be ( ) 60106100 =× .
In the case of the indicators that report to “Total number of environmental accidents” or
“Number of complaints, fines or sanctions levied for environmental reasons” we do not use
shares. In both cases the values of the indicator must be equal to the sum of value reported by
the supplier.
Dow
nloa
ded
by U
NIV
ER
SID
AD
E D
E A
VE
IRO
At 0
9:42
24
June
201
6 (P
T)

12
For indicators in percentages the shares are not considered, as is the case with the following
indicators: 1) percentage of total costs and investments relating to environmental protection; 2)
the degree of compliance with legislation or customer requirements in the specific environmental
area of the sector; 3) percentage of first tier suppliers with environmental certificates; 4)
percentage of first tier that use returnable packaging; 5) percentage of waste generated per
thousand product units; 6) dangerous waste generated as a percentage of total waste; 7)
percentage of other significant atmospheric emissions; 8) Percentage of waste water. For
indicators reported in percentages we calculate the average of the indicators reported by the
suppliers involved in the project.
Step 3: Indicator i for project y
In this last step the indicator i for project y is calculated considering all it suppliers using equation
3.
∑=
=n
s m
ijyojectSupplierIndiyojectInd
1
_Pr___Pr_ (Eq. 3)
where:
Ind_Project_iy – Indicator i for project y.
Ind_Supplier_Project_ijy – is the indicator i for supplier j associated to project y
(previously calculated).
n - Number of suppliers involved in the production of the project y.
m – Total products y manufactured by the company.
Let us continue with the example presented in the previous steps. Suppose that supplier k sales
component a used in project y. As we have seen previously the indicator i for supplier j
corresponding to project y is 60. Suppose that project y uses a second component, supplied by
supplier k, and the indicator i for supplier k corresponding to project y is 40. Finally suppose that
the company manufacture 100 products y. Then the indicator i for project y will simply be
(60+40)/100 = 1.
Dow
nloa
ded
by U
NIV
ER
SID
AD
E D
E A
VE
IRO
At 0
9:42
24
June
201
6 (P
T)

13
Phase 4 – Collection of data for the Env_BSC_4_SCPM
The instrument used for collecting the necessary data for enabling Env_BSC_4_SCPM is a mail
questionnaire to be sent annually to all first-tier suppliers, which will allow the analysis of the
evolution of the indicators to be monitored and their comparison with previous years. This option
represents a simple and effective way to collect the information necessary to evaluate the
environmental performance of the supply chain to the extent that it can be incorporated into the
standard procedures that are presently implemented for supplier evaluation in most of the
certified companies.
Phase 5 – Data processing and implementation of Env_BSC_4_SCPM, including monitoring -
PDCA Cycle
The question of which project has the best environmental performance cannot be directly
answered. This is because each indicator has different units, not comparable with each other and
also of different importance. At this stage, the focus of the study was not placed on the
development of a methodology for deciding which of the projects would be most advantageous in
terms of the environmental performance of their supply chain.
Analysis of the results for the various indicators is focused on the study of each result individually.
The objective is to separately improve each of the indicators rather than the result set for a given
project. This analysis, through the use of multicriteria models, could be considered as an evolution
of this model.
The follow-up phase for these indicators is carried out jointly by the Purchasing and
Environmental Management departments. In the event that there exist deviations from the
targets established, an action plan should be put into place in accordance with the principles of
the continuous improvement cycle, present in the PDCA cycle.
Dow
nloa
ded
by U
NIV
ER
SID
AD
E D
E A
VE
IRO
At 0
9:42
24
June
201
6 (P
T)

14
4. Application of the model in a case study company
Besides the research level of analysis proposed in the suggested model is the SC however, for
convenience reason and to capture the application of the proposed model, the unit of analysis
used in this study is the individual company and corresponding first-tier suppliers. The selection
criteria for choosing the company for the case study were: i) relevance to the Portuguese
automotive supply chain; ii) the company belongs to a large automotive group; iii) willingness to
collaborate with the study; and iv) geographical proximity to ensure the right conditions for the
research team.
4.1 Methodology
Since the main objective of this research is to propose a model for assessing the environmental
performance of a supply chain based on the principle of balanced scorecard, a convenient case
study from the Portuguese automotive supply chain (SC) was used to illustrate its application in a
real situation.
In the automotive industry there is an uneven power balance among supply chain members. The
automaker has huge power, controlling the entire production cycle from the product design to
product manufacturing and parts sourcing, and in some cases the suppliers’ processes. Typically,
in this supply chain there are a limited number of suppliers for components and parts, and the
control of the automaker can extend to second tier-suppliers (the first tier-suppliers can only
purchase components and materials from some approved suppliers). Therefore, the
environmental concern of the automaker is extended to his suppliers, stimulating the adoption of
EMS and the improvement of environmental performance by suppliers (Naini et al, 2011; Olugu et
al., 2011). In this context, it is important to analyze if there are differences in the environmental
indicators among different partners belonging to the same supply chain.
The automotive industry employs a management logic which is based on project management.
With this in mind, this work seeks to compare different projects in terms of the environmental
performance of their supply chains. The projects in question correspond to different products for
different car models. Thus the indicators relating to the different suppliers are taken into account,
whilst also considering the number of parts for the project in question.
The case study selection was also made on the basis of “planned opportunism”, which is to say
there was an anticipation of gaining access to secondary data (Pettigrew, 1990). Case selection is
often opportunistic, given that it is frequently difficult to find suitable case studies that allow
insight into the research topic, and those that can be pursued often emerge from existing
contacts a researcher has with an industry (Seuring, 2005).
To limit expert bias in the study results, data related to personal judgment of the automotive
company’s managers were obtained through semi-structured interviews (Yin, 2003; Saunders et
al., 2003). The visits made to the company made it possible to collect the necessary information
to illustrate the application of the proposed model. Other sources of evidence, such as industry
databases, newspaper clippings and company web sites, were used to corroborate and augment
evidence.
A case study approach is developed in the following section to illustrate the application of the
proposed Env_BSC_4_SCPM model as developed above.
Dow
nloa
ded
by U
NIV
ER
SID
AD
E D
E A
VE
IRO
At 0
9:42
24
June
201
6 (P
T)
15
4.2 Case study profile
In 2012 the Portuguese auto components industry sold 79.6% of its production to foreign
markets, with a strategic role in the economy representing 4.4% of the country’s Gross Domestic
Product (AFIA, 2012). The company selected as case study has around 400 employees. The main
activity is the manufacture of components for the automotive industry, including sets of
mechanical and electronic locks, steering wheel locks and external door handles.
The company has some of the major OEMs among its main clients. Its turnover in 2012 was
around 84.4 million euros with purchases representing about 60% of this value. The current
number of suppliers is 136 and they are located mainly in Spain and Germany. The company is
certified according to the following standards: ISO / TS 16949, ISO 14001 and OHSAS 18001.
The company has an evaluation system for its management indicators based on the BSC. Some of
the indicators already monitored are relevant for monitoring the environmental performance of
the supply chain. However, there is no logical or strategic bond between them so that they can be
used as a useful management tool for improving environmental performance in the company
supply chain. Here it is worth remembering that the choice was made to develop a specific BSC,
independent of the existing one, to facilitate its management and avoid excessive complexity in
its usage.
In order to develop and test the Env_BSC_4_SCPM model it was necessary to work together with
the company to collect the necessary data related to the company ongoing projects . To this end
a multidisciplinary team was assembled, coordinated by the head of the environmental group,
with elements of management as well as the engineering, logistics, quality, purchasing and
production departments. This team met several times to review the environmental aspects
associated with the supply chain, to develop the strategic map of the supply chain and to
delineate the Env_BSC_4_SCPM.
4.3 Application of the proposed model
Here the proposed model is applied to measure the environmental performance of two major
projects/products currently underway at the company.
Phase 1 – Modeling the supply chain process and identification of the strategic business unit
The case study only takes account of the first-tier suppliers, due to difficulties associated to data
collecting for the other elements in the supply chain (tiers 2, 3, n). The company has a total of 136
suppliers located mainly in Spain and Germany.
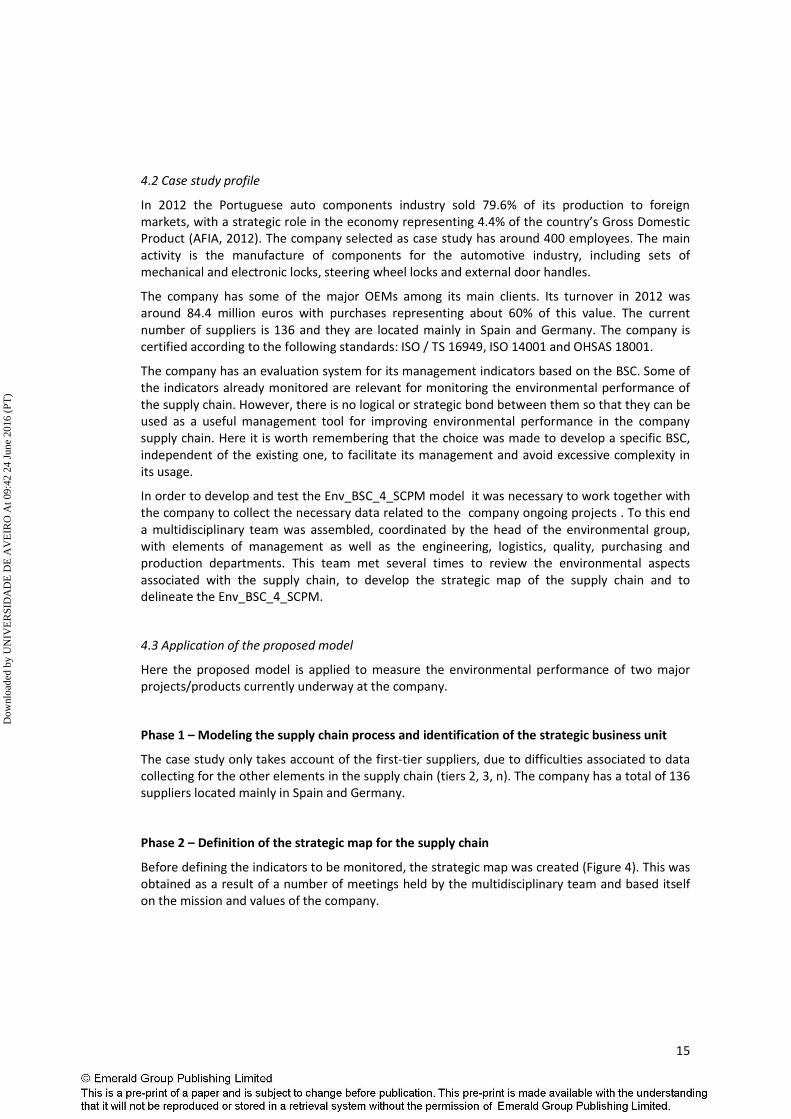
Phase 2 – Definition of the strategic map for the supply chain
Before defining the indicators to be monitored, the strategic map was created (Figure 4). This was
obtained as a result of a number of meetings held by the multidisciplinary team and based itself
on the mission and values of the company.
Dow
nloa
ded
by U
NIV
ER
SID
AD
E D
E A
VE
IRO
At 0
9:42
24
June
201
6 (P
T)
16
Figure 4 – Strategic map
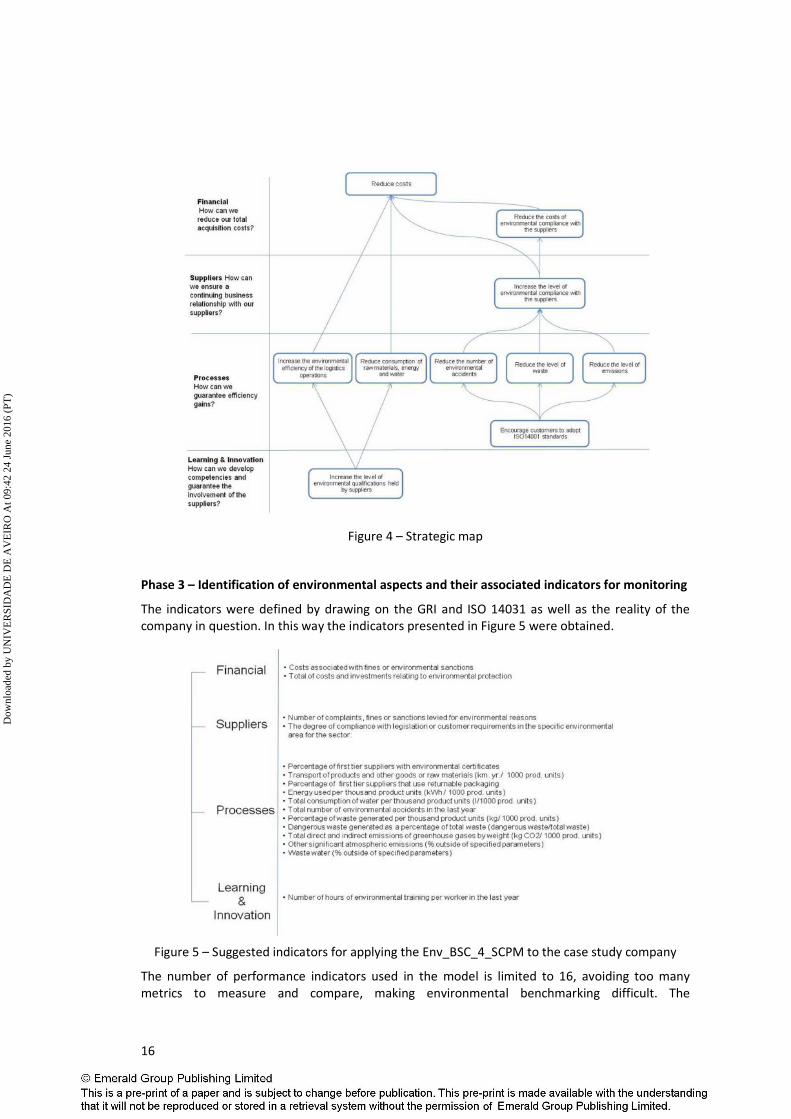
Phase 3 – Identification of environmental aspects and their associated indicators for monitoring
The indicators were defined by drawing on the GRI and ISO 14031 as well as the reality of the
company in question. In this way the indicators presented in Figure 5 were obtained.
Figure 5 – Suggested indicators for applying the Env_BSC_4_SCPM to the case study company
The number of performance indicators used in the model is limited to 16, avoiding too many
metrics to measure and compare, making environmental benchmarking difficult. The
Dow
nloa
ded
by U
NIV
ER
SID
AD
E D
E A
VE
IRO
At 0
9:42
24
June
201
6 (P
T)
17
performance indicators have been chosen accordingly to our case study company specificities but,
in our opinion, they are sufficiently generic to be adapted to other companies.
Phase 4 – Collection of data for the Env_BSC_4_SCPM
Out of a total of 136 companies that supply the case study company, 105 companies replied to
the questionnaire within the prescribed time limit, representing a response rate of 77%. ISO 9001
or ISO/TS 16949 are prerequisites for becoming a supplier of the case study company. All of the
suppliers have at least one environmental certification. The company already has 45% of its
suppliers ISO 14001 certified, while that number will show a tendency to rise given that the
evaluation procedure for suppliers penalizes those that are not ISO 14001 certified.
The largest numbers of observations for the indicator for Total waste / Raw materials occur in the
ranges 0%-1% and 10%-20%, with no observations for the range 70%-100%. Dangerous waste as a
proportion of total waste is most frequently reported to be in the range of 1%-5%, with 30% of
the responses. It is worth noting that a significant number (15% of suppliers) indicated the 50%-
70% range, which is indicative of the complex nature of the manufactured products and the
materials involved.
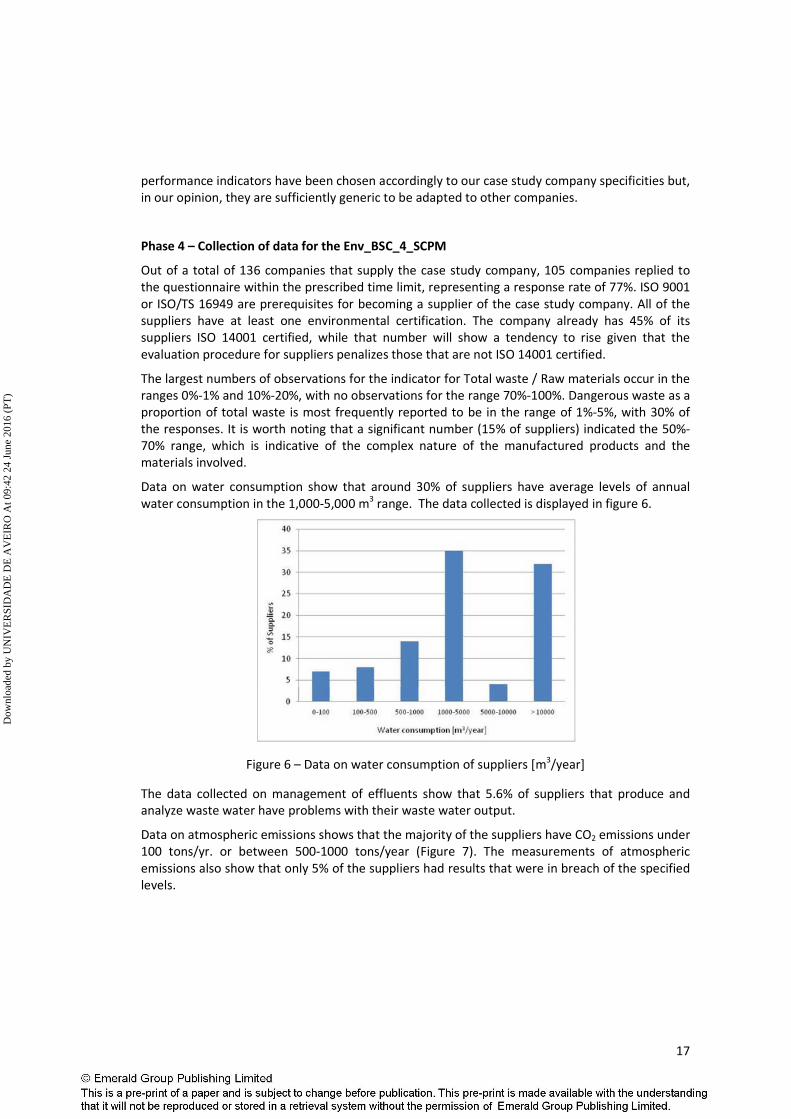
Data on water consumption show that around 30% of suppliers have average levels of annual
water consumption in the 1,000-5,000 m3 range. The data collected is displayed in figure 6.
Figure 6 – Data on water consumption of suppliers [m3/year]
The data collected on management of effluents show that 5.6% of suppliers that produce and
analyze waste water have problems with their waste water output.
Data on atmospheric emissions shows that the majority of the suppliers have CO2 emissions under
100 tons/yr. or between 500-1000 tons/year (Figure 7). The measurements of atmospheric
emissions also show that only 5% of the suppliers had results that were in breach of the specified
levels.
Dow
nloa
ded
by U
NIV
ER
SID
AD
E D
E A
VE
IRO
At 0
9:42
24
June
201
6 (P
T)

18
Figure 7 – Data on atmospheric emissions of CO2 [tons/year]
It can be noted that energy consumption among the suppliers is relatively homogeneously
distributed over the different defined ranges. Both the small suppliers (<100 MWh) and the
medium sized suppliers (1-10 GWh) each represent around 30% of the total. There is also an
appreciable number of suppliers that are large consumers, using between 10 and 100 GWh.
The environmental costs indicator requested that the suppliers would indicate the percentage of
spending and investments made on environmental aspects, with respect to the total costs of the
company. The data collected show that 35% of the suppliers allocate between 1 and 5% of their
total costs to environmental spending, while 30% do not reach the level of 0.5%. Only one
supplier admitted having had an environmental accident. The responses to the questionnaire did
not indicate any supplier as having been the subject of a complaint, fine or sanction.
Questioning the transport used revealed that the suppliers are mainly located in Spain (56%),
Germany (24%) and Portugal (14%). Shipments are made almost entirely by road and truck and
the most widely used type of packaging is cardboard (54%), however plastic (19%) and timber
(15%) are also present. Due to associated logistics costs, returnable packaging, at 8% of the total,
is still not significant. In this case deliveries are usually made weekly. The data collected is
displayed in figure 8.
Figure 8 – Type of packaging used by the suppliers
Dow
nloa
ded
by U
NIV
ER
SID
AD
E D
E A
VE
IRO
At 0
9:42
24
June
201
6 (P
T)

19
Data on environmental training shows that on average the suppliers spend annually 2.7 hours per
worker on environmental training (Figure 9). This is clearly an area in need of improvement if
results are to be improved in the future.
Figure 9 – Data related to hours on environmental training per worker.
Phase 5 – Data processing and implementation of Env_BSC_4_SCPM, including monitoring -
PDCA Cycle
Two projects were chosen to test the ability of the Env_BSC_4_SCPM model to assess the
environmental performance of the supply chains of equivalent projects currently underway at the
company. These projects were the retractable keys produced for two large OEM.
It was decided to test the model with these two projects because they are products which can be
easily compared. In addition, the responses to the questionnaires provided all the necessary
information for these two projects. The equation for deriving the indicators for each project was
applied to calculate the needed indicators for this study.
To give an example of how the results are produced in Env_BSC_4_SCPM, Table 1 provides the
calculation for the “Energy Consumption” indicator for one of the projects under study.
Dow
nloa
ded
by U
NIV
ER
SID
AD
E D
E A
VE
IRO
At 0
9:42
24
June
201
6 (P
T)

20
Table 1 – Calculation of the “Energy Consumption” indicator for one of the studied projects
The overall results for the indicators associated to each analyzed project are presented in Table 2.
Table 2 – Env_BSC_4_SCPM comparison of the two projects
Dow
nloa
ded
by U
NIV
ER
SID
AD
E D
E A
VE
IRO
At 0
9:42
24
June
201
6 (P
T)
21
4.4 Discussion and implications
As previously described, when it is necessary to compare the environmental performance of the
different projects, each indicator should be monitored and analyzed separately. While each
indicator has different weights, thus contributing differently to the impact that a given supply
chain has on the environment, important conclusions can be reached regarding the
environmental performance of the supply chains that support the production of each one of these
products.
Those areas and suppliers that most negatively impact the environmental performance of the
supply chain for the company can be identified clearly and unequivocally. For example, from the
analysis of Table 2 it can be concluded that project A has underperformed in more criteria than
project B, enabling the areas for improvement to be identified. It is necessary to reinforce the
idea that this is a simplistic approach, which should be taken together with a multicriteria model
for decision support to decide which is the most advantageous project from the environmental
point of view.
At the level of the processes, project A has more positive points than project B. However, project
A achieved worse results in the other emissions category (compliance level: 98.75% - A; 98.86% -
B) and the level of dangerous waste is higher where an environmental accident occurs. The
environmental financial component favors project B. Project B has better results for learning and
innovation.
Going further, we can see that project B has levels of energy consumption, water consumption
and CO2 emissions per unit that are respectively around 4, 3 and 6 times the levels given for
project A. In other words, the company can develop action plans, in accordance to the principles
of the continuous improvement cycle contained in the PDCA cycle. These should be focused on
the reduction of energy or water consumption or CO2 emissions, and developed together with the
suppliers involved in the supply of the necessary components for producing project B.
Substantial differences can also be seen in the production of the different types of waste, which
could also benefit from the development of action plans. It is as such fundamental that each
indicator is analyzed separately and its results are addressed to be able to improve, in an overall
way, the environmental performance of the supply chain.
Dow
nloa
ded
by U
NIV
ER
SID
AD
E D
E A
VE
IRO
At 0
9:42
24
June
201
6 (P
T)

22
5. Conclusions
The starting point of this study was the assessment of the environmental performance of a supply
chain. This objective was achieved with the proposal of the Env_BSC_4_SCPM model and an
illustration of its practical application using the example of a first-tier supplier to the automotive
industry.
The evaluation process consists of the development of a model for the assessment of the
environmental performance of a supply chain, based on four perspectives used in the balanced
scorecard, however integrating the environmental concerns into all four perspectives. A group of
relevant environmental indicators for each perspective is identified. The significant environmental
aspects of the supply chain in question were also taken into account when choosing the
indicators.
Using a case study from the automotive industry, the practical application of this model
demonstrates its usefulness, revealing both its potential benefits and shortcomings. From the
example application, it can be seen which of the two projects has the poorer environmental
performance for its supply chain, and in which areas is this performance most lacking. For
example, it can be seen that comparably the supply chain for the B key (Project B) is more energy
efficient, but worse with respect to dangerous waste production. In this way actions can be take
on a sectorial basis for each project, leading to an improvement in the global environmental
performance for the supply chain. In this way Env_BSC_4_SCPM can be seen as an effective tool
for decision support.
One of the difficulties is related to the correct application of this model, relying on a deep
understanding on the environmental impacts of the supply chain. It can also be noted that the
level of complexity of the supply chain can be a determining factor for the successful application
of the model, due to the practical difficulties involved in collecting the data. It may be necessary
for the organization under study to have significant influence over its suppliers in order to gain
the required data. For the case study, a representative response rate was achieved with 105
responses or 77% of the total suppliers for the company.
It should also be noticed that if the assumptions underlying the proxies for Share_Supplier_i and
Share_Comp_Supplier_jy are not valid, the reliability of the resulting metrics is compromised, and
could lead to misguided decisions.
As previously noted, there are several paths open to future development of the Env_BSC_4_SCPM
model. Widening the frontiers, the next phase may include the application of this model to all the
upstream and downstream tiers of the supply chain. It is worth remembering that concepts of
sustainability and environmental management are integrating concepts of interactions over the
different levels of the chain. As such, it should be made clear that the most precise and correct
way to evaluate the environmental performance of the supply chain should measure the impacts
from the procurement of the raw materials, through manufacturing, then consumption and final
disposal or recycling.
Improvements in the model could include the construction of an aggregate measure, for example
an index, to identify which project or supplier has the best environmental performance for their
supply chain. This represents a consideration for future work, which would also necessitate the
use of multicriteria evaluation models. Another perspective for future work relates to the
application of the developed model to other industry sectors, with other impacts, processes,
specificities and realities. This would help vindicate the usefulness of the model in a wider, more
encompassing way.
Dow
nloa
ded
by U
NIV
ER
SID
AD
E D
E A
VE
IRO
At 0
9:42
24
June
201
6 (P
T)
23
6. References
Alfalla-Luque, R. and Medina-López, C. (2009), “Supply Chain Management: Unheard of in the
1970s, core to today's company”, Business History, Vol. 51 No 2, pp. 202-221.
Azevedo, S., Carvalho, H. and Cruz-Machado, V. (2011) “The influence of green practices on supply
chain performance: A case study approach,” Transportation Research Part E: Logistics and
Transportation Review, Vol. 47, No. 6, pp. 850-871.
Bhagwat, R. and Sharma, M. (2007), “Performance measurement of supply chain management: A
balanced scorecard approach”, Computers & Industrial Engineering, Vol. 53, pp. 43-62.
Braithwaite , A. and knivett, D. (2008), “Evaluating a supply chain carbon footprint – A
methodology and case example of carbon-to-serve”, in Proceedings of the 13rd Logistics Research
Network Conference, Liverpool, 10th-12th September, pp- 323-328.
Brewer, P. C. and Speh, T. (2001), “Adapting the balanced scorecard to Supply Chain
Management”, Supply Chain Management Review, Vol. 5 No. 2, pp. 48-56.
Campos, L. M. S. and Melo, D. A., (2008), “Indicadores de desempenho dos Sistemas de Gestão
Ambiental (SGA): uma pesquisa teórica”, Produção, Vol. 18 No.3, pp. 540-555.
Carter, C. R. and Easton, P. L. (2011), “Sustainable supply chain management: evolution and future
directions”, International Journal of Physical Distribution & Logistics Management, Vol. 41 No 1,
pp. 46-62.
Chan, F. T. (2003), “Performance measurement in a supply chain”, International Journal of
Advanced Manufacturing Technology, Vol. 21, pp.534-548.
Chen, C. (2005), “Incorporating green purchasing into the frame of ISO 14000”, Journal of Cleaner
Production, Vol. 13 No. 9, pp. 927-933.
Christopher, M. (1998), Logistics and Supply Chain Management – Strategies for reducing cost and
improving service, Prentice Hall/Financial Times.
Clift, R. (2003), “Metrics for supply chain sustainability”, Clean Technologies and Environmental
Policy, Vol. 5, pp. 240-247.
Colicchia, C., Melacini, M. and Perotti, S. (2011), “Benchmarking supply chain sustainability:
insights from a field study”, Benchmarking: An International Journal, Vol. 18 No.5, pp. 705-732.
Corbett, C. J. and Klassen, R. D. (2006), “Extending the horizons: environmental excellence as key
to improving operations”, Manufacturing and Service Operations Management, Vol. 8 No. 1, pp.
5-22.
Dey, P. K. and Cheffi, W. (2012),”Green supply chain performance measurement using the analytic
hierarchy process: a comparative analysis of manufacturing organisations”, Production Planning &
Control: The Management of Operations, Vol. 24 No. 8-9, pp. 702-720.
Dias-Sardinha, I. and Reijnders, L. (2001), “Environmental performance evaluation and
sustainability performance evaluation of organizations: an evolutionary framework”, Eco -
Management and Auditing, Vol. 8 No. 2, pp. 71-79.
El Saadany, A.M.A., Jaber, M.Y., and Bonney, M. (2011), “Environmental performance measures
for supply chains”, Management Research Review, Vol. 34 No. 11, pp. 1202-1221.
Epstein, M. J. and Wisner, P. S. (2001), “Measuring and managing social and environmental
impacts”, in J. Shank (Ed.), Handbook of cost management. New York: Warren, Gorham & Lamont.
Dow
nloa
ded
by U
NIV
ER
SID
AD
E D
E A
VE
IRO
At 0
9:42
24
June
201
6 (P
T)

24
Fandel, G. and Stammen, M. (2004), “A general model for extended strategic supply chain
management with emphasis on product life cycles including development and recycling”,
International Journal of Production Economics, Vol. 89 No.3: pp. 293-308.
Figge, F., Hahn, T., Schaltegger, S. and Wagner, M. (2002), “The Sustainability Balanced Scorecard
- linking sustainability management to business strategy”, Business Strategy and the Environment ,
Vol. 11 No.5, pp. 269-283.
Fine, C. (1998), Clockspeed: Winning Industry Control in the Age of Temporary Advantage, Basic
Books, New York.
Gold, S., Seuring, S. and Beske, P. (2010), “sustainable Supply Chain Management and Inter-
Organizational Resources: A Literature Review”, Corporate Social Responsibility and
Environmental Management, Vol. 17, pp. 230-245.
Griffith, A. and Bhutto, K. (2009), “Better environmental performance: A framework for integrated
management systems (IMS)”, Management of Environmental Quality, Vol. 20 No. 5, pp. 566-580.
Gunasekaran, A., Patel, C. and Tirtiroglu, E. (2001), “Performance measures and metrics in a
supply chain environment”, International Journal of Production and Operations Management, Vol.
21, pp. 71-87.
Gunasekaran, A., Patel, C., Ronald, E. and McGaughey, R. (2004), “A framework for supply chain
performance measurement”, International Journal of Production Economics, Vol. 87 No. 3, pp.
333-348.
Handfield, R. B. and Nichols, E. L. (1999), Introduction to Supply Chain Management. Prentice Hall,
Upper Saddle River, NJ.
Hervani, A., Helms, M. and Sarkis, J. (2005), “Performance measurement for green supply chain
management”, Benchmarking: An International Journal, Vol. 12 No. 4, pp. 330-353.
Hong, P., Roh, J. J. and Rawski, G. (2012), “Benchmarking sustainability practices: evidence from
manufacturing firms”, Benchmarking: An International Journal, Vol. 19 No. 4/5, pp. 634-648.
Hsu, C. W., Hu, A. H., Chiou, C. Y. and Chen, T. C. (2011), “Using the FDM and ANP to construct a
sustainability balanced scorecard for the semiconductor industry”, Expert Systems with
Applications, Vol. 38, pp. 12891-12899.
Hsu, Y. L. and Liu, C. C. (2010), “Environmental performance evaluation and strategy management
using balanced Scorecard”, Environmental Monitoring and Assessment, Volume 170 No. 1-4, pp.
599-607.
Hutchins, M. J. and Sutherland, J. W. (2008), “An exploration of measures of social sustainability
and their application to supply chain decisions”, Journal of Cleaner Production, Vol. 16, pp. 1688-
1698.
Jiménez, J. B. and Lorente, J. L. (2001), “Environmental performance as an operations objective”,
International Journal of Operations & Production Management, Vol. 21 No. 12, pp. 1553-1572.
Johnson, S. D. (1998), “Identification and Selection of Environmental Performance Indicators:
application of the Balanced Scorecard approach”, Corporate Environmental Strategy, Vol. 5 No.4,
pp. 34-41.
Kaplan, R.S. and Norton, D. P. (1992), “The balanced scorecard: measures that drive
performance”, Harvard Business Review, Vol.70 No. 1, pp. 71-79.
Dow
nloa
ded
by U
NIV
ER
SID
AD
E D
E A
VE
IRO
At 0
9:42
24
June
201
6 (P
T)
25
Kaplan, R.S. and Norton, D. P. (1996), The Balanced Scorecard: Translating Strategy Into Action,
Harvard Business School Press: Boston, MA.
Länsiluoto, A. And Järvenpää, M. (2008), “Environmental and performance management forces:
Integrating "greenness" into balanced scorecard”, Qualitative Research in Accounting and
Management, Vol. 5 No. 3 , pp. 184-206.
Lau, K. H. (2011), “Benchmarking green logistics performance with a composite index”,
Benchmarking: An International Journal, Vol. 18 No. 6, pp. 873-896
Lehtinen, J. and Ahola, T. (2010), “Is Performance measurement suitable for an extended
enterprise?”, International Journal of Operations & Production Management, Vol. 30 No. 2, pp.
181-204.
Linton, J. D., Klassen, R. and Jayaraman, V. (2007), “Sustainable supply chains: An introduction”,
Journal of Operations Management, Vol. 25 No. 6, pp. 1075-1082.
Linton, J.D. and Jayaraman, V. (2005), “A conceptual framework for product life extension”,
International Journal of Production Research, Vol. 43 No.9, pp. 1807-1829.
Markley, M. J. and Davis, L. (2007), “Exploring future competitive advantage trough sustainable
supply chains””, ”, International Journal of Physical Distribution & Logistics Management, vol. 37
No. 9, pp. 763-774.
Morhardt, J., Baird, S. and Freeman, K. (2002), “Scoring corporate environmental and
sustainability reports using GRI 2000, ISO 14031 and other criteria”, Corporate Social -
Responsibility and Environmental Management , Vol. 9 No. 4, pp. 215-233.
Naini, S. G., Aliahmadi, A. R. and Jafari-Eskandari, M. (2011), “Designing a mixed performance
measurement system for environmental SCM using evolutionary game theory and balanced
scorecard - A case study of an auto industry supply chain”, Resources, Conservation and Recycling,
Vol. 55, pp. 593-603.
Olugu, E. U., Wong, K. Y. and Shaharoun, A. M. (2011), “Development of key performance
measures for the automobile green supply chain”, Resources, Conservation and Recycling, Vol. 55,
pp. 567-579.
Perotto, E., Canziani, R., Marchesi, R. and Butelli, P. (2008), “Environmental performance,
indicators and measurement uncertainty in EMS context: a case study”, Journal of Cleaner
Production, Vol. 16 No. 4, pp. 517-530.
Pettigrew, A. M. (1990), “Longitudinal field research on change: Theory and practice”,
Organisation Science, Vol. 1 No. 3, pp. 267-292.
Porter, M. and van der Linde, C. (1995), “Green and Competitive: Ending the Stalemate”, Harvard
Business Review, Vol. 73, pp. 120-133.
Saunders, M., Lewis, P. and Thornhill, A. (2003), Research Methods for Business Students, Prentice
Hall, Harlow.
Seuring, S. (2005), “Case Study research in supply chains: An outline and three examples”, In
Research methodologies in supply chain management, Ed H. Kotzab, S. Seuring M. Muller and G.
Reiner, pp. 235-250. Heidelberg: Physica.
Seuring, S. and Müller, M. (2008), “From a literature review to a conceptual framework for
sustainable supply chain management”, Journal of Cleaner Production, Vol. 16 No. 15, pp. 1699-
1710.
Dow
nloa
ded
by U
NIV
ER
SID
AD
E D
E A
VE
IRO
At 0
9:42
24
June
201
6 (P
T)
26
Shaw, S., Grant, D. B. and Mangan, J. (2010), “Developing environmental supply chain
performance measures”, Benchmarking: An International Journal, Vol. 17 No. 3, pp. 320-339.
Soni, G and Kodali, R. (2010), “Internal Benchmarking for assessment of supply chain
performance”, Benchmarking: An International Journal, Vol. 17 No. 1, pp. 44-76.
Srivasta, S. K. (2007), “Green supply-chain management: a state of the art literature review”,
International Journal of Management Reviews, Vol. 9 No. 1, pp.53-80.
Sroufe, R. (2004), “Effects of environmental management systems on environmental management
practices and operations”, Production and Operations Management, Vol. 12 No. 3, pp. 416-431.
Stonebraker, P. W., Goldhar, J. and Nassos, G. (2009), “Weak links in the supply chain: measuring
fragility and sustainability”, Journal of Manufacturing Technology Management, Vol. 20 No.2, pp.
161-177.
Tóth, G. (2003), “Evaluation of Environmental Performance of Companies”, Society and Economy ,
Vol. 25 No. 3, pp. 383-402.
Tsoulfas, G. T. and Pappis, C. P. (2008),”A model for supply chains environmental performance
analysis and decision making”, Journal of Cleaner Production, Vol. 16 No 15, pp. 1647-1657.
Vachon, S. and Klassen, R. D. (2006), “extending green practices across the supply chain. The
impact of upstream and downstream integration”, International Journal of Operations &
Production Management, vol. 26 No. 7, pp.795-821.
Vasileiou, K. and Morris, J. (2006), “The sustainability of the supply chain for fresh potatoes in
Britain”, Supply Chain Management: An International Journal, Vol. 11 No. 4 , pp. 317-327.
Webster, S. and Mitra, S. (2007), “Competitive strategy in remanufacturing and the impact of
take-back laws”, Journal of Operations Management, Vol 25 No. 6, pp. 1123-1140.
Wilson, G.W. and Sasseville, D.R. (1999), Sustaining Environmental Management Success - Best
Business Practices from Industry Leaders, John Wiley & Sons.
Winter, M. and Knemeyer, A. M. (2013), “Exploring the integration of sustainability and supply
chain management: Current state and opportunities for future inquiry”, International Journal of
Physical Distribution & Logistics Management, Vol. 43 No. 1, pp. 18-38.
Yang, M., Hong, P. and Modi, S. (2011), “Impact of lean manufacturing and environmental
management on business performance: an international study of manufacturing firms”,
International Journal of Production Economics, Vol. 129 No. 2, pp. 251-61.
Yin, R. K. (2003), Case Study Research – Design and Methods, 3rd edition, Sage, Thousand Oaks.
Yu, X. and Li-Ping Tang, T. (2011), “Sustainability in supply chain management: suggestions for the
auto industry”, Management Decision, Vol. 49 No. 4 , pp. 495-512.
Dow
nloa
ded
by U
NIV
ER
SID
AD
E D
E A
VE
IRO
At 0
9:42
24
June
201
6 (P
T)

27
About the Authors
Luís Miguel D. F. Ferreira is an Assistant Professor of Supply Chain Management with the
Industrial Engineering and Management Department of the University of Aveiro and a researcher
with the Centre for Governance, Competitiveness and Public Policy. He received his PhD from the
Universidade Técnica de Lisboa. His research interests include: Supply Chain Management and
Sustainable Supply Chain Management. He has significant consultancy experience, both in the
private and public sectors.
Cristóvao Silva studied Mechanical Engineering at the University of Coimbra, where he graduated
in 1992. He received is M.Sc. and Ph.D. from University of Coimbra, in 1995 and 2000 respectively,
both in the area of Industrial Management. He is presently an auxiliary professor at the
Mechanical Engineering Department of the University of Coimbra. His research focuses in the fiel
of Production Planning and Control.
Susana Garrido Azevedo holds a Ph.D. in Management. She is Assistant Professor and coordinator
of the 1st cycle in management in the Department of Business and Economics at University of
Beira Interior (UBI) – Portugal. Is researcher in the UNIDEMI (R&D Unit in Mechanical & Industrial
Engineering) at Universidade Nova de Lisboa. In the Research Unit she makes part of several
projects including: “European Manufacturing Survey” Portuguese consortium and Lean, Agile,
Resilient and Green (LARG) Supply Chain Management. She has research interests in:
sustainability, green indices, supply chain management, lean, green and resilience supply chain
management paradigms, and logistics. The results of her research have been disseminated
through a range of outlets, totaling over 30 journal papers, 15 book chapters, 67 conference
proceedings and co-authored books in operations management and competitiveness. Also, she
has collaborated as reviewer in many journals and also international conferences. She is editorial
board member and also associate editor of several international journals.
Dow
nloa
ded
by U
NIV
ER
SID
AD
E D
E A
VE
IRO
At 0
9:42
24
June
201
6 (P
T)