benchmark database inhomogeneous data, surrogate data and synthetic data victor venema
Post on 21-Dec-2015
219 views
TRANSCRIPT

Benchmark database
inhomogeneous data, surrogate data and
synthetic data
Victor Venema
M e te o ro lo g ic a l
I n stitu te
B o n n

Victor Venema, [email protected], COST HOME, Mai 2008, Budapest, Hungary
Goals of COST-HOME working group 1
Literature survey
Benchmark dataset– Known inhomogeneities– Test the homogenisation algorithms (HA)

Victor Venema, [email protected], COST HOME, Mai 2008, Budapest, Hungary
Benchmark dataset1) Real (inhomogeneous) climate records
Most realistic case Investigate if various HA find the same breaks Good meta-data
2) Synthetic data For example, Gaussian white noise Insert know inhomogeneities Test performance
3) Surrogate data Empirical distribution and correlations Insert know inhomogeneities Compare to synthetic data: test of assumptions

Victor Venema, [email protected], COST HOME, Mai 2008, Budapest, Hungary
Creation benchmark – Outline talk
1) Start with (in)homogeneous data
2) Multiple surrogate and synthetic realisations
3) Mask surrogate records
4) Add global trend
5) Insert inhomogeneities in station time series
6) Published on the web
7) Homogenize by COST participants and third parties
8) Analyse the results and publish
Victor Venema, [email protected], COST HOME, Mai 2008, Budapest, Hungary
1) Start with homogeneous data
Monthly mean temperature and precipitation Later also daily data (WG4), maybe other
variables
Homogeneous No missing data Longer surrogates are based on multiple copies Generated networks are 100 a

Victor Venema, [email protected], COST HOME, Mai 2008, Budapest, Hungary
1) Start with inhomogeneous data
Distribution– Years with breaks are removed– Mean of section between breaks is adjusted to global
mean
Spectrum– Longest period without any breaks in the stations– Surrogate is divided in overlapping sections– Fourier coefficients and phases are adjusted for every
small section– No adjustments on large scales!
Victor Venema, [email protected], COST HOME, Mai 2008, Budapest, Hungary
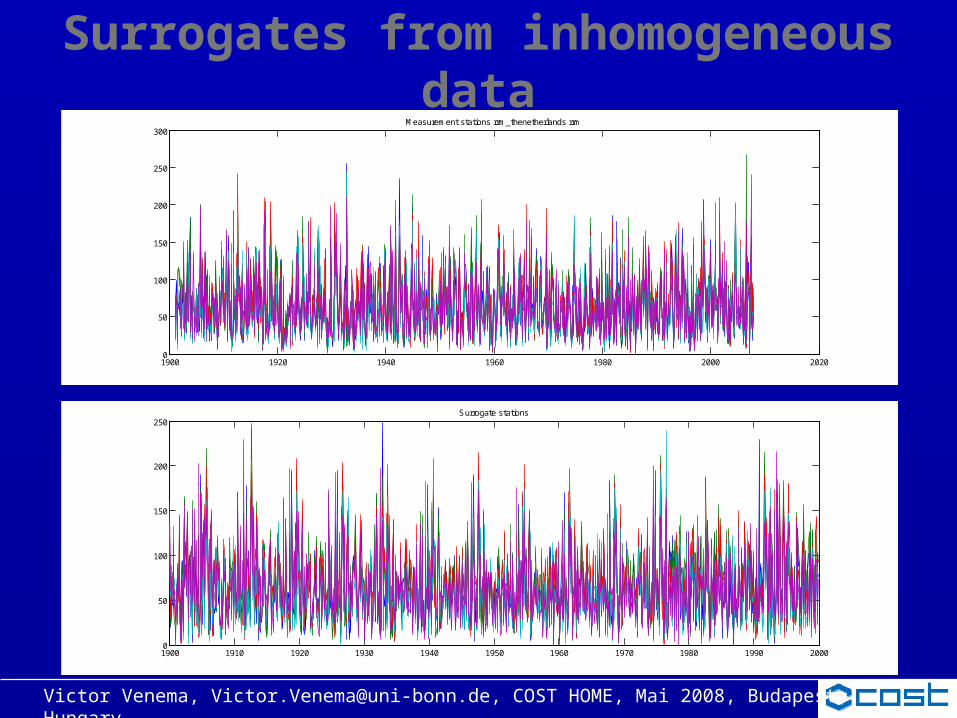
Surrogates from inhomogeneous data
1900 1920 1940 1960 1980 2000 20200
50
100
150
200
250
300Measurement stations rrm_thenetherlands rrm
1900 1910 1920 1930 1940 1950 1960 1970 1980 1990 20000
50
100
150
200
250Surrogate stations

Victor Venema, [email protected], COST HOME, Mai 2008, Budapest, Hungary
2) Multiple surrogate realisations
Multiple surrogate realisations– Temporal correlations– Station cross-correlations– Empirical distribution function
Annual cycle removed before, added at the end Number of stations between 5 and 20 Cross correlation varies as much as possible
Victor Venema, [email protected], COST HOME, Mai 2008, Budapest, Hungary
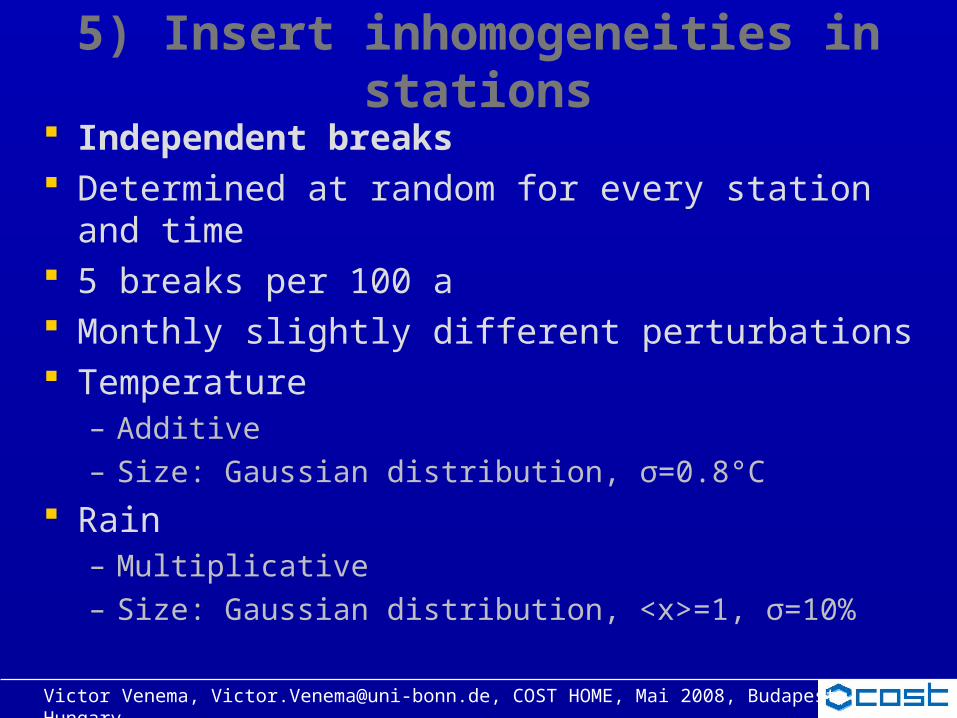
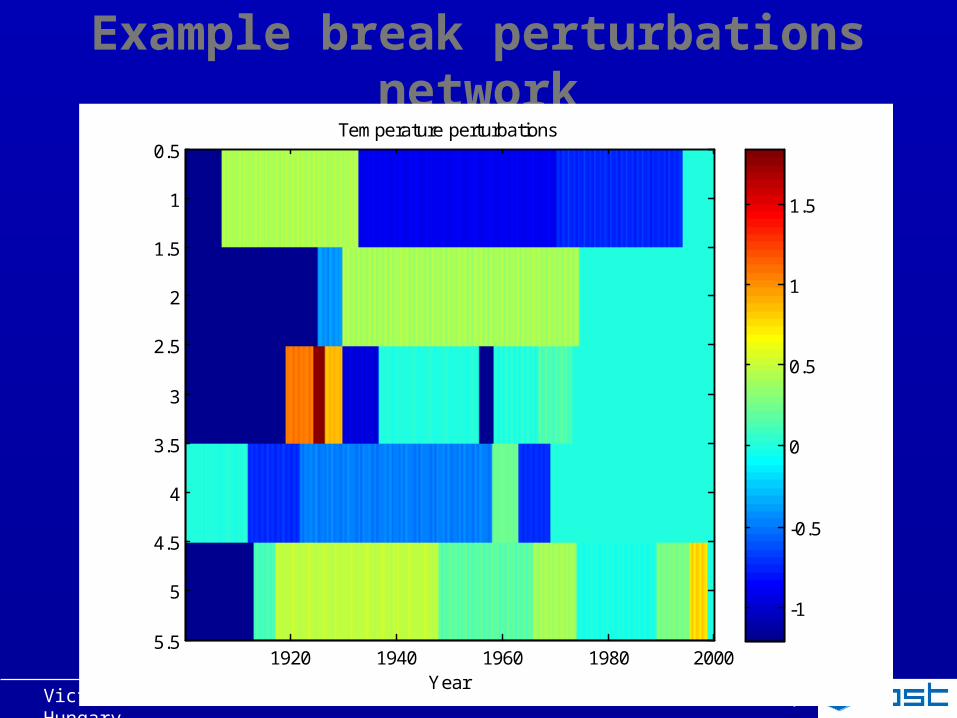
5) Insert inhomogeneities in stations
Independent breaks Determined at random for every station and time 5 breaks per 100 a Monthly slightly different perturbations Temperature
– Additive– Size: Gaussian distribution, σ=0.8°C
Rain– Multiplicative– Size: Gaussian distribution, <x>=1, σ=10%
Victor Venema, [email protected], COST HOME, Mai 2008, Budapest, Hungary
Example break perturbations station
1900 1910 1920 1930 1940 1950 1960 1970 1980 1990 2000-0.1
0
0.1
0.2
0.3
0.4
0.5
0.6
0.7
0.8
0.9
Victor Venema, [email protected], COST HOME, Mai 2008, Budapest, Hungary
Example break perturbations network
Year
Temperature perturbations
1920 1940 1960 1980 2000
0.5
1
1.5
2
2.5
3
3.5
4
4.5
5
5.5
-1
-0.5
0
0.5
1
1.5
Victor Venema, [email protected], COST HOME, Mai 2008, Budapest, Hungary
5) Insert inhomogeneities in stations
Correlated break in network One break in 50 % of networks In 30 % of the station simultaneously Position random
– At least 10 % of data points on either side
Victor Venema, [email protected], COST HOME, Mai 2008, Budapest, Hungary
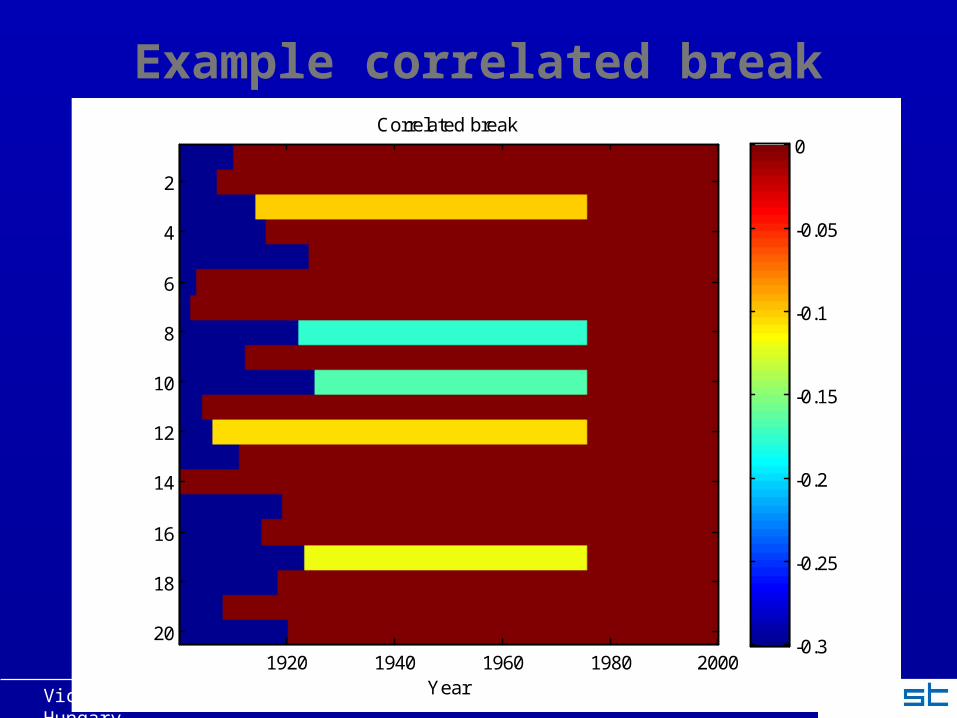
Example correlated break
Year
Correlated break
1920 1940 1960 1980 2000
2
4
6
8
10
12
14
16
18
20-0.3
-0.25
-0.2
-0.15
-0.1
-0.05
0
Victor Venema, [email protected], COST HOME, Mai 2008, Budapest, Hungary
5) Insert inhomogeneities in stations
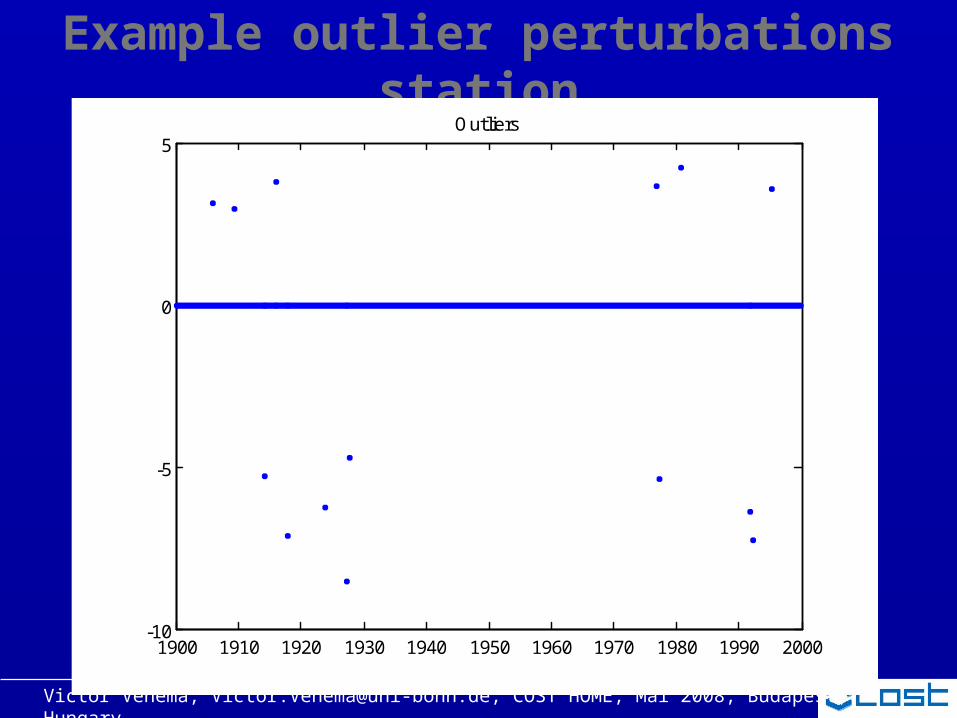
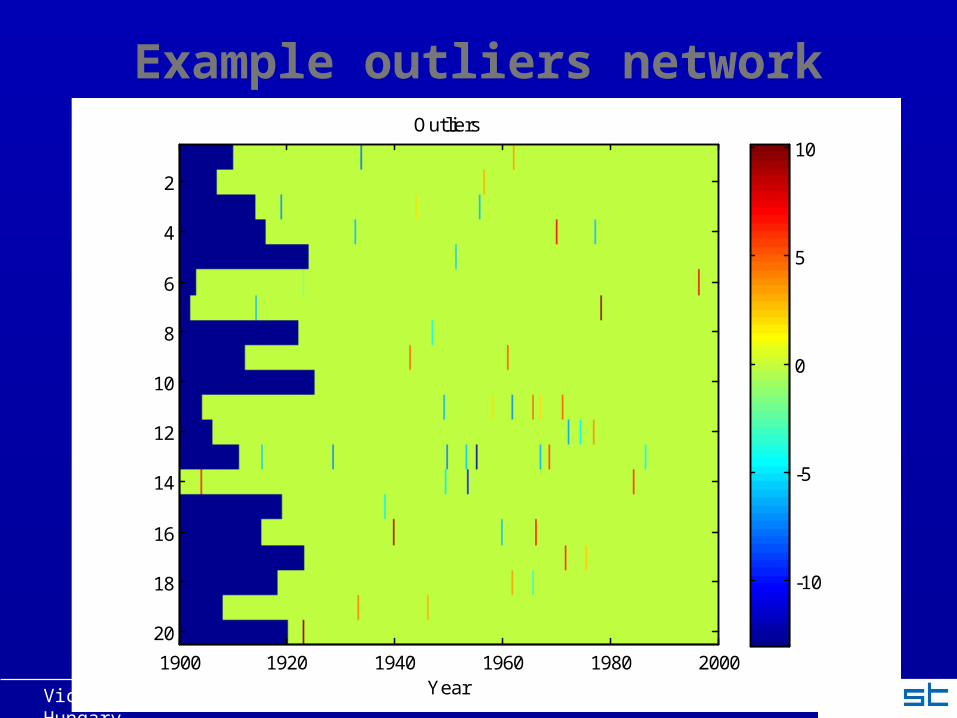
Outliers Size
– Temperature: < 1 or > 99 percentile– Rain: < 0.1 or > 99.9 percentile
Frequency– 50 % of networks: 1 %– 50 % of networks: 3 %
Victor Venema, [email protected], COST HOME, Mai 2008, Budapest, Hungary
Example outlier perturbations station
1900 1910 1920 1930 1940 1950 1960 1970 1980 1990 2000-10
-5
0
5Outliers
Victor Venema, [email protected], COST HOME, Mai 2008, Budapest, Hungary
Example outliers network
Year
Outliers
1900 1920 1940 1960 1980 2000
2
4
6
8
10
12
14
16
18
20
-10
-5
0
5
10
Victor Venema, [email protected], COST HOME, Mai 2008, Budapest, Hungary
5) Insert inhomogeneities in stations
Local trends (only temperature) Linear increase or decrease in one station Duration: 30, 60a Maximum size: 0.2 to 1.5 °C Frequency: once in 10 % of the stations Also for rain?

Victor Venema, [email protected], COST HOME, Mai 2008, Budapest, Hungary
Example local trends
Year
Local trends
1900 1920 1940 1960 1980
2
4
6
8
10
12
14
16
18
20-1
-0.8
-0.6
-0.4
-0.2
0
0.2
0.4
0.6
0.8
1
Victor Venema, [email protected], COST HOME, Mai 2008, Budapest, Hungary
6) Published on the web
Inhomogeneous data will be published on the COST-HOME homepage
Everyone is welcome to download and homogenize the data
http://www.meteo.uni-bonn.de/ mitarbeiter/venema/themes/homogenisation
Victor Venema, [email protected], COST HOME, Mai 2008, Budapest, Hungary
7) Homogenize by participants
Return homogenised data Should be in COST-HOME file format (next slide)
Return break detections– BREAK– OUTLI– BEGTR– ENDTR
Multiple breaks at one data possible

Victor Venema, [email protected], COST HOME, Mai 2008, Budapest, Hungary
7) Homogenize by participants
COST-HOME file format: http://www.meteo.uni-bonn.de/
venema/themes/homogenisation/costhome_fileformat.pdf For benchmark & COST homogenisation software
New since Vienna:– Stations files include height– Many clarifications

Victor Venema, [email protected], COST HOME, Mai 2008, Budapest, Hungary
Work in progress
Preliminary benchmark: http://www.meteo.uni-bonn.de/ venema/themes/homogenisation/
Write report on the benchmark dataset More input data
Set deadline for the availability benchmark Deadline for the return of the homogeneous data Agree on the details of the benchmark Daily data: other, realistic, fair inhomogeneities