being the change we hope for: stopping the keystone xl pipeline
DESCRIPTION
The story of the powerful movement to stop the Keystone XL tar sands pipeline. Explains the relationship of tar sands & KXL to climate change, as well as public health and human rights.TRANSCRIPT

Being the Change We Hope For: Stopping the Keystone XL Pipeline

Canadian Boreal forest
Critical in the fight against climate change
Sources: Na,onal Geographic, “The Canadian Oil Boom,” March 2009, Andrew Nikiforuk, Tar Sands: Dirty Oil and the Future of A Con,nent, Canadian Boreal Ini,a,ve.
Photo Credit: Ashley Hockenberry
One of the world’s largest remaining intact ecosystems

Home to Many
600+ First Nations communities maintain traditional roots in the Boreal
Source: Canadian Boreal Ini,a,ve. Photo Credit: Oil on Lubicon Land: A Photo Essay by Greenpeace Canada: hQp://youtu.be/qz3nSscXamI
At least 3.5 million people live in the Canadian Boreal(over 10% of Canadians)

Once of the largest carbon sinks
Source: The Carbon the World Forgot, Canadian Boreal Ini,a,ve and Boreal Songbird Ini,a,ve
soils & permafrost store
2x the carbon of tropical rain forests

Essential to global water supply
Sources: The Pew Environment Group; World Health Organiza,on, 10 facts about water scarcity; Natural Resources Defense Council, Climate Change, Water, and Risk. Photo Credit: Michael Stravato
The Boreal has 80% of world’s liquid freshwater: more than any other continental-scale ecosystem
Water scarcity affects 1 in every 3 people in the world.
And not just people in the developing world: 14 States in the U.S. are at extreme risk for water shortages
Texas Ranchers struggling with record droughts

The AnthropoceneWithin the last year, scientists have renamed our current era the
Anthropocene to describe an age that through climate change and habitat destruction--has been remade by man.

Hostile Environment
We are in the middle of the sixth and only man-made extinction of species.

Canada has the second highest rate of deforestation on Earth.
Because of the Tar Sands.
Photo Credit: Peter Essick, Na@onal Geographic.
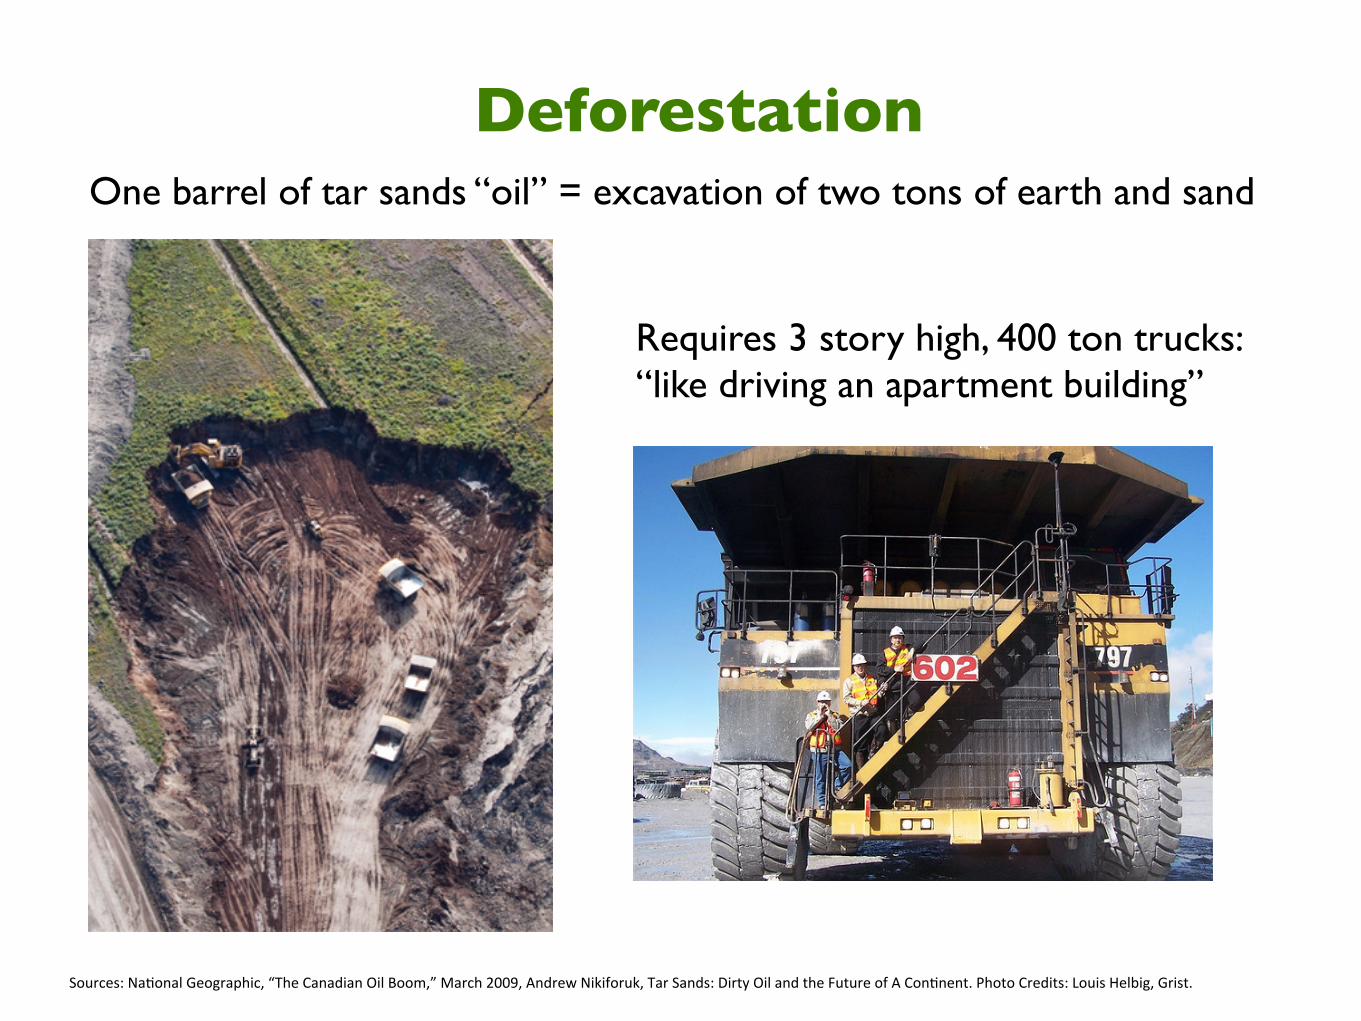
DeforestationOne barrel of tar sands “oil” = excavation of two tons of earth and sand
Sources: Na,onal Geographic, “The Canadian Oil Boom,” March 2009, Andrew Nikiforuk, Tar Sands: Dirty Oil and the Future of A Con,nent. Photo Credits: Louis Helbig, Grist.
Requires 3 story high, 400 ton trucks:“like driving an apartment building”

"The Boreal forest as we know it could be gone in a generation without major policy changes”
- Steve Kallick, Director of the Pew Boreal Campaign

Vast open-pit strip-mining
One of the most environmentally destructive projects on Earth that creates a toxic waste zone the size of England.

This is not conventional oil
Source: NIEHS; Credit: Lara Solt, Dallas Morning News-‐Corbis.
Expensive, energy-intensive, and destructive to extract
One of the planet’s most expensive fossil fuels,since it must be highly processed.

Highly energy-intensive
Source: Andrew Nikiforuk, Tar Sands: Dirty Oil and the Future of A Con,nent.
Industry burns enough natural gas every day to heat six million homes
Much of this natural gas is “fracked”
From Josh Fox’s Gasland

Contaminates vast amounts of water
The tar sands consumes as much water annually as a city of 2 million people. Ninety percent of this water becomes toxic waste which leaks
into groundwater.Source: Andrew Nikiforuk, Tar Sands: Dirty Oil and the Future of A Con,nent, 2009
Aerial view of a tailings pond north of Fort McMurray, Alberta, Canada. (Source: NIEHS; Credit: Jiri Rezac)
Every day, Canada exports one million barrels of tar sands “oil” (and three million barrels of virtual water)

Scien5sts & local fishers found cancerous tumors on whitefish near Athabasca tar sands
Sources: NIEHS, Ian Sample, The Guardian “Human ac,vity is driving Earth's 'sixth great ex,nc,on event'”, 7/28/2009, Elizabeth Kolbert, The New Yorker, “The Sixth Ex@nc@on?”, 5/25/2009.
Wildlife impacts: cartoonishly real
Whitefish from Lake Athabasca, collected by Ray Ladouceur, Dec. 2009. Photo credit: Kelly/Radmanovich.
The Simpsons, “Two Cars in Every Garage and Three Eyes on Every Fish,” 11/1/1990.

Tailings ponds contain known carcinogens arsenic and benzene, and possible human carcinogens like lead and mercury.
Communi5es near tar sands are seeing abnormally high rates of cancer.
Sources: Friends of the Earth; The Pembina Ins,tute; EPA Technology Transfer Network Air Toxics Web Site Arsenic Compounds; American Cancer Society. Photo Credit: Photo Credit: Oil on Lubicon Land: A Photo Essay by Greenpeace Canada: hQp://youtu.be/qz3nSscXamI
Human health impacts
Rates of renal failure, lupus, and hyperthyroidism are also spiking.

Only when the last tree has died, the last river been poisoned, and the last fish been caught will we realize we cannot eat money.
-Cree Proverb

“Game Over”
Dr. James Hansen of NASA’s Goddard Institute has said that exploitation of the Tar Sands will be “Game Over for The Climate”
What does that actually mean?

How do we measure CO2 in the atmosphere?
The atmosphere is mostly nitrogen, oxygen, and some other stuff, including CO2. The amount of CO2 is measured in the
number of CO2 molecules for every million molecules of other stuff in the atmosphere. This is called PPM for Parts Per Million.
Other Stuff
Other Stuff
Other Stuff
Other Stuff
Other Stuff
Other Stuff
Other Stuff Other
Stuff
Other Stuff
Other Stuff
Other Stuff
Other Stuff
Other Stuff
Other Stuff
Other Stuff
CO2
Other Stuff
Other Stuff Other
Stuff Other Stuff

How do we measure CO2 in the atmosphere?
Other Stuff
Other Stuff
Other Stuff
Other Stuff
Other Stuff
Other Stuff
Other Stuff
Other Stuff
Other Stuff
Other Stuff
Other Stuff
Other Stuff
Other Stuff
Other Stuff
Other Stuff
CO2
CO2
CO2
CO2
CO2
CO2
CO2
CO2
Using fossil fuels releases CO2 to the atmosphere and increases the PPM of CO2 in the atmosphere. Deforestation
does the same thing.
CO2

350 PPM or Bust Scientific Consensus is that to avoid climate change that will cause significant sea level rise and rapid loss of species, atmospheric content of CO2 should stabilize around 350 PPM. If
levels reach 450 PPM we are at great risk of creating out control climate change.
0
90
180
270
360
450
CO2 Levels
450 ppm: Out of Control
390 ppm: Present Levels
280 ppm: Pre-industrial LevelsYear: 1850
Year: 2011
Year: 20??
350 ppm
Oops!
ppm

Climate Change Now
• 40% decline in Arctic Sea Ice since 1970; Greenland and West Antarctic ice sheets loosing 100 cubic kilometers of ice per year. Even at current levels of climate change, arctic sea ice could be gone by 2040.
• Worldwide disappearance of mountain glaciers
• Northward expansion of sub-tropical regions, Expansion of dry regions, 300% increase in fires in the Western United States
• Warming surface water and ocean acidification leading to the die off of coral reefs
• Unprecedented severe storms and flooding
• Sea level rise of 3 mm per year
At 390 ppm we are already experiencing climate change that causes....
Sources: Dr. James Hansen, Storms of my Grandchildren, Target Atmospheric CO2, NASA: hQp://sealevel.jpl.nasa.gov/science/elninopdo/. Photo by: Jeff Hannigan (source: U.S. NOAA)

Carbon in/Carbon OutCarbon is stored in sinks on land and released into the atmosphere through natural cycles.
Note: 1ppm=2.12 Gigatons Carbon
Soil: 1500 Gigatons
Plants: 600 Gigatons
Atmosphere: 800 Gigatons Carbon
Oceans:40,000 Gigatons
Conventional Fossil Fuels : 1,460 Gigatons
Methane hydrates:10,000 Gigatons
Source: USDOE, image credit; World Ocean Review

Tipping point
Atmosphere= Way too many gigatons carbon
Once arctic ice melts, the dark surface of the planet attracts more heat which, in a harmful cycle, causes further releases of carbon. At this point, planetary warming cannot be controlled
simply by burning less fossil fuels. The danger is that sinks, such as the ocean, will turn into sources. Massive amounts of carbon in the form of frozen methane hydrates will be in danger
of destabilizing. Ocean acidification, which is already in process, will not be reversible.
Source: Dr. James Hansen, “Storms of my Grandchildren.”

Methane Hydrates Methane hydrates are vast frozen CO2 sinks along the ocean floor and arctic shelf. In the past,
rising ocean temperatures triggered an abrupt release of more than 2000 gigatons tons of carbon in the form of melting methane hydrates into the atmosphere.
We cannot stop the release of methane hydrates once we have warmed the ocean too much. Methane hydrate is an example ‘runaway climate change‘ that is often discussed.

What is Ocean Acidification?Ocean acidification is caused by increased absorption of atmospheric
carbon dioxide which raises the pH of the oceans. Ocean pH has increased by 30% since preindustrial times. The photo progression below shows the effects on the carbonate shell of an organism after 45 days in an
environment with the predicted ocean pH for 2100.
Ocean acidification caused a mass extinction of ocean species during the Cenozoic Era. The ocean is currently acidifying at a rate 10 times faster than
it did during the Cenozoic area.
Image Credit: Na,onal Geographic images
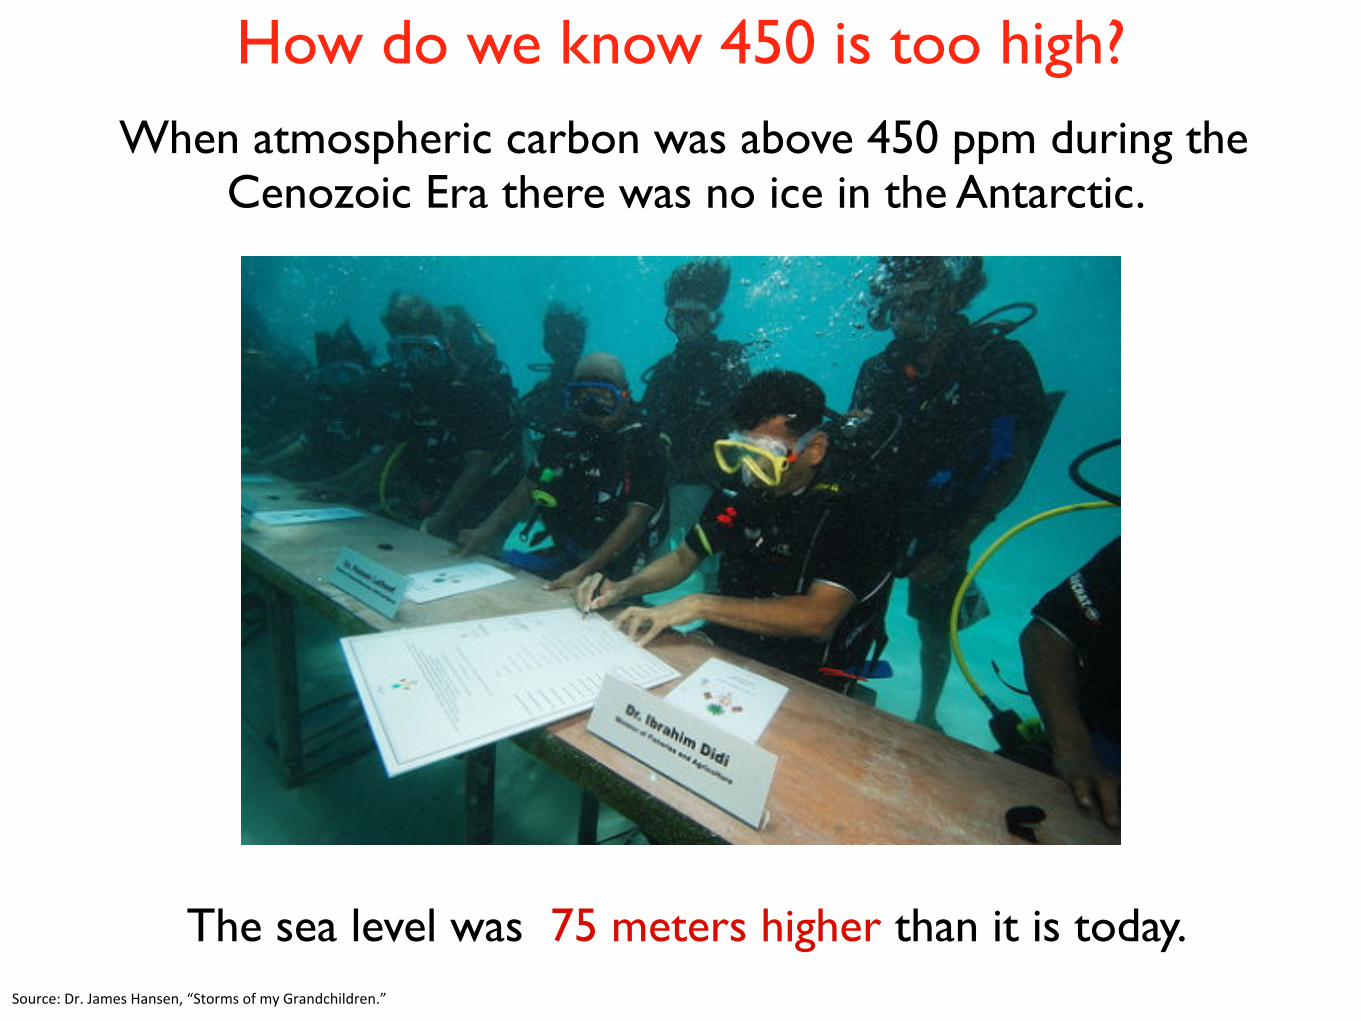
How do we know 450 is too high?When atmospheric carbon was above 450 ppm during the
Cenozoic Era there was no ice in the Antarctic.
The sea level was 75 meters higher than it is today. Source: Dr. James Hansen, “Storms of my Grandchildren.”

Are we sure?
Pretty sure. We know that there was no sea ice at 450 plus or minus 100 ppm.
Which means that atmospheric concentration that eliminated antarctic ice actually occurred somewhere
between 350 and 550 ppm.
So that’s why keeping carbon dioxide levels in the atmosphere around 350 ppm is really the safe number.

Remember that as of today we’re at 390.

Up, up, and away.(Not in a good way)
If only 50% of the tar sands were exploited, atmospheric CO2 would increase by about 62 ppm.
0
78
156
234
312
390
ppm
390 ppm
62 ppm
452 ppm

Yeah, but not in my life time...?
Critics of the “Game Over” say that at a rate of 1.5 million barrels of oil a day, it will take a long time for the Canadian Tar Sands to have impact. But the rate of extraction in the tar sands is
increasing. The planned Keystone XL pipeline is part of a project to increase the production on of the oil sands to 3.1 million barrels per day in the next ten years. The Canadian Association of
Oil Producers assumes that production from the tar sands will be 4 million barrels per day by the year 2025.
0
1
2
3
4
2011 2013 2015 2017 2019 2021 2023 2025
millions of barrels per day
Year
Sources: NRDC, Reuters.

Even if production never exceeds 4 million barrels per day, exploitation of the tar sands alone will be enough
to bring atmospheric CO2 to 450 ppm in the year 2080.

Why the Fuss?
Fracked Gas180
Heavy Oil120
Oil Shale420
Tar Sands390
Coal1050
Gas100
Oil190
Okay, but it’s not like the tar sands are the only fossil fuels on Earth.
That’s right. Bad as the tar sands are, they are only a part of the picture.
Known fossil fuel reserves,
equivalent to 1150
ppm
Sources: Jim Hansen “The Tar Sands and Climate” , hQp://www.climatestorytellers.org/stories/james-‐hansen-‐white-‐house-‐and-‐tar-‐sands/ and Hansen, 2008 paper, “Target Atmospheric CO2; Where Should Humanity Aim?”

Trend towards “extreme energy”
Deep sea oil drilling
Natural gas “fracking”
Photo Credit: Vivian Stockman
From Josh Fox’s Gasland
Photo Credit: U.S. Coast Guard
Mountaintop removal
Oil shale development
Photo Credit: Nathan Bilow for The New York Times

Game Over. Tar Sands exploitation represents a policy and investment commitment to
creating climate change we can’t adapt to.
That’s a big part of why we don’t like them...

Enough. ....and why it felt like it was time to do this.
photo credit: Josh Lopez
Nice photo. And that stinks about the carbon impacts. But aren’t we stuck with fossil fuels
for now because there are no viable alternatives?

Renewable Right Now.Engineering professors from Stanford and the University of California have show that
using existing technology and resources in proportions shown below the world could be powered 100% on renewable energy...
!"#$%%&'(%
!)*+%,(%
-+./0+12)3%4(%
56$1.%4(%
7"$)3%%,(%
8.3)1%%4'(%
... and that the infrastructure to change to renewable power could be
built by 2030.
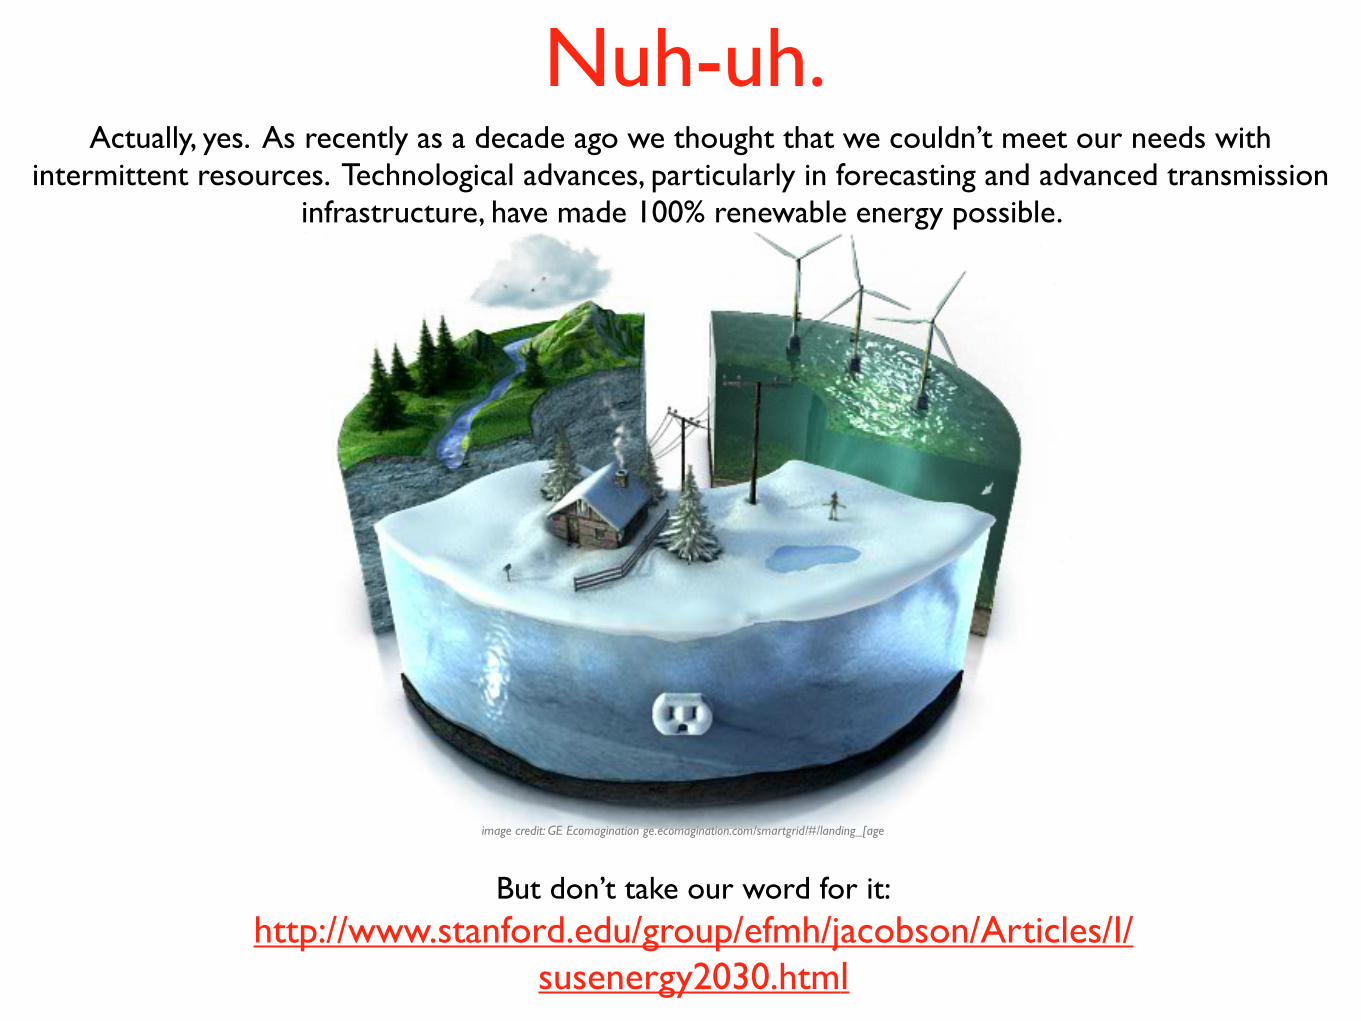
Nuh-uh. Actually, yes. As recently as a decade ago we thought that we couldn’t meet our needs with
intermittent resources. Technological advances, particularly in forecasting and advanced transmission infrastructure, have made 100% renewable energy possible.
But don’t take our word for it:
http://www.stanford.edu/group/efmh/jacobson/Articles/I/susenergy2030.html
image credit: GE Ecomagination ge.ecomagination.com/smartgrid/#/landing_[age

Won’t that be expensive?
Cents per kWh ($US)
0
0.05
0.1
0.15
0.2
2010 2020
Wind (Onshore)Wind (offshore)WaveGeothermalHydroSolar (Concetrated)Solar (PV)TidalConventionalConvential+Externalized Costs
Source: Jacobson & Delucchi, “Providing all global energy with wind, water, and solar power, Part II: Reliability, system and transmission costs, and policies”, Elsiver November 22nd, 2010
The costs of Renewable Energy decrease with time. Conventional Energy is a finite, polluting resource, subject to increasing costs because of scarcity
and social consequences.

Fossil Fuel isn’t Free
The U.S government annually provides $10 billion in subsidies for the fossil fuel industry1,*

Unpriced Externalities
The U.S. National Academy estimates that unpriced externalities could add $0.03 to $0.15 per kilowatt hour to the cost of fossil
fuels.
Image credit: Political Economy Research Institute

That’s three to fifteen cents a kWh, you said?
Sound like small change?

Given U.S. energy consumption, these pennies add up to a range of between $114 billion and $570 billion dollars per year.
0
150
300
450
600
Billions of $US
It isn’t.
$114 Billion
$570 Billion $337 Billion
Price of the most valuablecompany on
Based on 2010 U.S. energy consump,on of 3.8 trillion KWh

Emissions from coal fired power plants cause 13,000 premature deaths in the United States a year.
Source: The Clean Air Task Force

Vehicle emissions cause increased risk of asthma, chronic obstructive pulmonary disease, cardiovascular disease,
cancer.2
Source: “The Harmful Effects of Diesel Exhaust”: A Case for Policy Change Environment and Human Health, inc.

Women living in areas of high vehicle pollution have double the risk of breast cancer as women living in the
least polluted areas.
Source: http://www.catf.us/resources/publications/files/The_Toll_from_Coal.pdf

photo credit: Gareth Lenz
So when someone says that THIS is good for the economy...
...what does that mean?

Is this even the right way to look at it?

So...why would anyone do this?

So-called job creation strategy
TransCanada, the pipeline company, claims it would create 20,000 direct jobs and 108,000
indirect jobs.
The State Department only accounts for 5,000 - 6,000 direct jobs over 3 years, most of
them non-local and temporary.
Source: Cornell University Global Labor Ins,tute, Employment Facts: The Keystone XL Pipeline: hQp://priceofoil.org/wp-‐content/uploads/2011/09/CU_KeystoneXL_090711_FIN2.pdf

Luckily there’s another vision.
According to a study on Virginia offshore wind done by Virginia Coastal Energy Research Consortium,
consisting of researchers from Old Dominion University, James Madison University, and Virginia Tech:
3200 MW would create 9,700 to 11,600 career-length jobs
in Virginia alone
Source: Virginia Coastal Energy Research Consor,um “Virginia Offshore Wind Studies, July 2007 to March 2010,” published 20 April 2010

Locked in.
Building the Keystone XL Pipeline locks us in to fossil fuels by allocating scarce resources away from
renewable energy.

Sources: Sta,s,cs Canada, Private and Public Investment in Canada "Oil and Gas Investment in Alberta (Billion Dollars), Washington Post. “Obama allies’ interests collide over Keystone pipeline,” By Juliet Eilperin and Steven Mufson, Published: October 16, 2011; Rainforest Ac,on Network: Banks Ranked and Spanked on Tar Sands; Canadian Associa,on of Petroleum Producers.
Vested interests: Over $130 Billion CAD in Tar Sands development (1999-2011)

Bought and paid forSecretary of State Hilary Clinton’s former Deputy
Campaign Manager is now TransCanada’s lead lobbyist
Cardno Entrix, a TransCanada contractor, carried out the State Department Environmental Impact Assessment and
public hearings process for the pipeline

Conflicts of interests abound

The Keystone XL Pipeline
1,700 mile pipeline that would run from Alberta, Canada to the Texas Gulf
Endangers Ogallala Aquifer, the drinking water for millions of Americans
Key to unlocking the Alberta Tar Sands. According to top Canadian oil
ministers, without the KXL, Alberta would be “landlocked in
oil”

TransCanada has a terrible safety record
Source: The Na,on, “State Department Issues Flawed Blessing of Keystone XL.” Published August 26, 2011.
Keystone I spilled 14x since it went into operation in June 2010.

Pipelines are imperfect
Sources: The Daily Beast “Obama’s Pipeline Mess.”; NY Times San Bruno Gas Explosion (2010). Photo Credit: Paul Sakuma, AP
In 2010, a San Bruno, California natural gas pipeline explosion burned three homes and killed eight people.

Tar sands oil is inherently less safe
Sources: The Daily Beast “Obama’s Pipeline Mess.”; NYTimes “Michigan Governor Warns of Oil Spill Threat”, Published: July 28, 2010. Photo Credit: Andre J. Jackson/Detroit Free Press, via Associated Press.
Tar sands “oil” is highly corrosive and must be pushed through pipelines at higher-than-normal pressure, creating high risks of major spills
Kalamazoo River tar sands oil spill closed 35 miles of the river and cost taxpayers $500 million to clean up (as of July 2010)

All in all, the Keystone XL Pipeline is a colossally bad idea.
And why it is time to take a stand.

Tar Sands Action
Building Keystone XL requires a Presidential permit that certifies whether it is in the ‘National Interest,’ which means President Obama alone decides whether the project gets built.
The Tar Sands Action is a campaign to insist that the President reject the pipeline.

Photo Credit: Shadia Fayne Wood

Photo Credit: Shadia Fayne Wood

Photo Credit: Ben Powless

Response to the State Department’s Environmental Impact Statement
Photo Credit: Ben Powless


Photo Credit: Josh Lopez
Fr. Jacek of Franciscan Action Network

Photo Credit: Ben Powless

Actress Daryl Hannah takes a stand
Photo Credit: Ben Powless

Photo Credit: Shadia Fayne Wood
“We are the keepers of the Mountains”

Photo Credit: Shadia Fayne Wood
Indigenous Environmental Network leaders

Photo Credit: Shadia Fayne Wood
Kandi “Eagle Woman” Mossett

Photo Credit: Ben Powless Photo Credit: Shadia Fayne Wood
Nebraskans Against the Pipeline
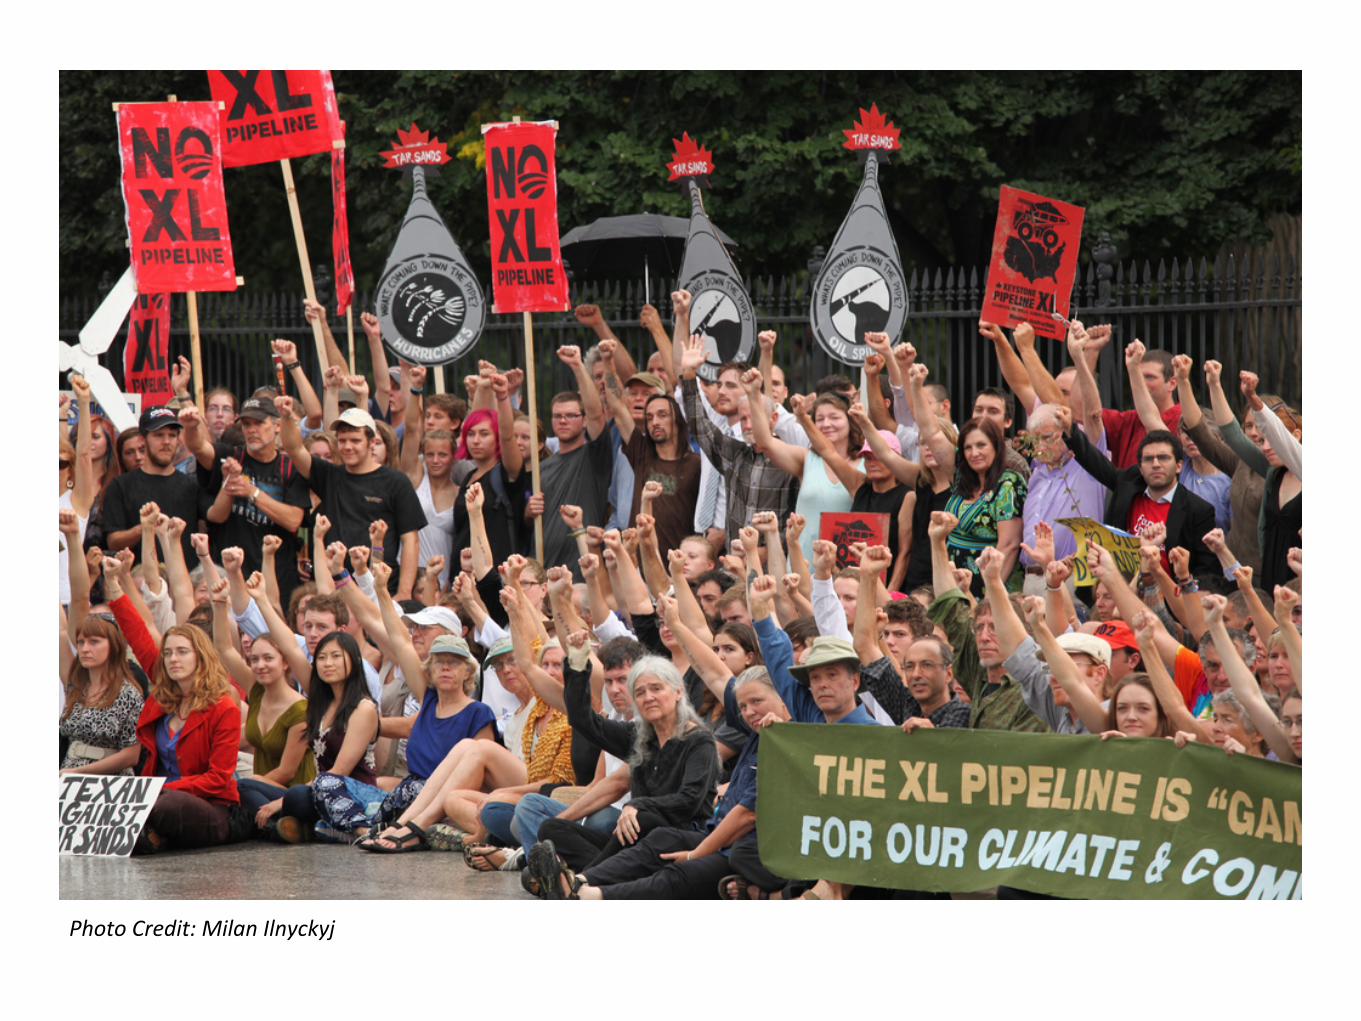
Photo Credit: Milan Ilnyckyj

A Movement Born1,253 arrests at the sit-in, with international solidarity actions from Canada to Egypt to New Zealand
200+ Arrested at Action on Canada’s Parliament Hill on Sept. 26th
25 US Mayors and former mayors & Governors Dave Heineman (R-NE) and Peter Shumlin (D-VT) oppose the pipeline
North American labor unions join in Opposition: Amalgamated Transit Union, Transport Workers Union, and 2 Canadian Unions

Congresspeople raise concerns about permitting process
Senate Majority Leader Harry Reid sent a letter to Secretary of State Clinton with his opposition to the proposed Keystone XL pipeline.
Sens. Bernie Sanders (I-Vt.), Patrick Leahy (D-Vt.) and Ron Wyden (D-Ore.)’s letter to Clinton raised “serious concerns” about State Dept’s Environmental Impact Statement.
More than 20 lawmakers, including Rep. Earl Blumenauer (D-Or.) sent a letter to Clinton criticizing tainted review process.

3,500+ press mentions...and counting front page coverage & an unprecedented four editorials opposing the KXL Pipeline

Real Progress

12,000 strong at Nov. 6th Action

Victory!

Or so we thought...

Congress attached the KXL pipeline as a rider to the payroll tax extension, forcing President Obama to decide on
the pipeline by Feb. 21, 2012.

Then, President Obama rejected the pipeline on Jan. 18, 2012!

House Republicans responded with additional legislation to force approval
of the Keystone XL.
And so, the fight against tar sands and extreme energy continues.

And Keystone XL is just one of many proposed new tar sands pipelines & pipeline expansion projects in North
America.

And Canada remains the largest U.S. supplier of oil.
Much of that is tar sands oil.

Tar sands development and its impacts remain a day-to-day reality
for frontline communities.

First Nations communities continue to organize against proposed tar sands pipelines, including
Enbridge’s Northern Gateway pipeline.
Learn more about the Indigenous Environmental Network:
ienearth.org

The fight against tar sands and fracking are linked, since tar sands uses huge quantities of fracked gas.
Pennsylvania and New York are the battleground against fracking in the U.S.
Learn more:gaslandthemovie.com
protectingourwaters.com

Extreme energy will not stop.

Unless we stop it.

We’ve already seen the power of our movement.

Imagine what else we can do together.

Where we lead, politicians will follow.

Together, we can create the political will for a sustainable climate
and an equitable world.

Thank you for all you do.

For more information, contact:yimingr at gmail dot com
To keep updated with the Tar Sands Action, visit tarsandsaction.org