behavioural responses of western gray whales ... - int-res… · patterns in 10 movement and 7...
TRANSCRIPT

ENDANGERED SPECIES RESEARCHEndang Species Res
Vol. 30: 53–71, 2016doi: 10.3354/esr00713
Published March 22
INTRODUCTION
Since international protection of gray whalesEschrichtius robustus from commercial whaling wasput in place in 1946, the eastern North Pacific popu-lation has made a strong recovery to around 20000
individuals (Rugh et al. 2005, Jones & Swartz 2009,Laake et al. 2012) with an estimated annual growthrate of ~3.2% (Punt & Wade 2012). This post-com-mercial whaling recovery is regarded as a conserva-tion success. However, unlike the eastern population,the population in the western North Pacific has not
© The authors 2016. Open Access under Creative Commons byAttribution Licence. Use, distribution and reproduction are un -restricted. Authors and original publication must be credited. Publisher: Inter-Research · www.int-res.com
*Corresponding author: [email protected]
ABSTRACT: A seismic survey was conducted off the northeastern coast of Sakhalin Island, Russiain 2010. The survey area was adjacent to the only known near-shore feeding ground of the Critically Endangered population of western gray whales Eschrichtius robustus in the westernPacific south of the Aleutian Islands. This study examined the effectiveness of efforts to minimizethe behavioural responses of the whales to vessel proximity and sound during the survey. Twoshore-based behavioural observation teams monitored whale movements and respirations pre-,during and post-seismic survey. Theodolite tracking and focal-animal follow methods were usedto collect behavioural data. Mixed linear models were used to examine deviations from ‘normal’patterns in 10 movement and 7 respiration response variables in relation to vessel proximity, vessel/whale relative orientations and 8 received sound metrics to examine if seismic survey soundand/or vessel activity influenced the whales’ behaviour. Behavioural state and water depth werethe best ‘natural’ predictors of whale movements and respiration. After considering natural varia-tion, none of the response variables were significantly associated with seismic survey or vesselsounds. A whale’s distance from shore and its orientation relative to the closest vessel were foundto be significantly influenced by vessel proximity, which suggested some non-sound related dis-turbance. The lack of evidence that the whales responded to seismic survey sound and vessel traf-fic by changing either their movement or respiration patterns could indicate that the current mit-igation strategy is effective. However, power analyses suggest that our sample sizes were toosmall to detect subtle to moderate changes in gray whale behaviour.
KEY WORDS: Western gray whale · Behaviour · Seismic survey · Anthropogenic disturbance ·Movement · Respiration
OPENPEN ACCESSCCESS
Contribution to the Theme Section ‘Seismic survey and western gray whales’
Behavioural responses of western gray whales to a 4-D seismic survey off northeastern Sakhalin
Island, Russia
Glenn Gailey1,*, Olga Sychenko1, Trent McDonald2, Roberto Racca3, Alexander Rutenko4, Koen Bröker5,6
1Texas A&M University, 200 Seawolf Pkwy, Galveston, TX 77553, USA2West, Inc. Western EcoSystems Technology, 200 S. Second St., Laramie, WY 82070, USA
3JASCO Applied Sciences (Canada) Ltd., 2305–4464 Markham Street, Victoria, BC V8Z 7X8, Canada4V.I. Il’ichev Pacific Oceanological Institute FEB RAS, ul. Baltiiskaya 43, Vladivostok 690041, Russia
5Shell Global Solutions, Lange Kleiweg 40, 2288GK Rijswijk, The Netherlands6Marine Evolution and Conservation, Groningen Institute for Evolutionary Life Sciences, University of Groningen,
Nijenborgh 7, 9747AG Groningen, The Netherlands

Endang Species Res 30: 53–71, 2016
recovered and remains a small remnant of what itwas in the 19th century. Around 140 (CI: 134−146)non-calf individuals regularly occur off SakhalinIsland, Russia, with 36 reproductive females and anannual population rate of increase of 3.3% (Cooke etal. 2013), although issues regarding population struc-ture remain (see IWC 2015). The western gray whalepopulation is considered to be one of the most endan-gered baleen whale populations (Clapham & Baker2002, Weller et al. 2002) and is currently listed asCritically Endangered by IUCN and Category I in theRed Book of Russia (Red Book of the Russian Federa-tion 2000, Baillie et al. 2004).
Human activities, particularly those related to oiland gas exploration and development, have been in -creasing in the past 15 yr off northeastern SakhalinIsland, on and near the only known major feedingarea of this population of gray whales. To minimizethe impacts of such activity on the whales, severalmitigation and monitoring plans (MMP) have beenimplemented targeting specific activities, such asseismic surveys, platform installation, dredging andpipeline placement (Johnson et al. 2007, SEIC 2005,2006, 2007). Despite efforts to reduce overall soundexposure levels, responses by the whales were ob -served, including changes in distribution and behav-iour (Weller et al. 2002, 2005, Gailey et al. 2007a,b,2010, Yazvenko 2007a,b). However, it is uncertainwhether such localized displacements or changes inbehaviour have had population-level consequences.
In 2010, Sakhalin Energy Investment Company(Sakhalin Energy) conducted a geophysical seismicsurvey of the Astokh oil and gas field. Constrained byweather, safety concerns and ice coverage, the tim-ing of the seismic survey— between mid-June andearly July— overlapped with the gray whales’ sum-mer feeding period (June to November). Prior to thestart of the seismic survey, Sakhalin Energy andthe IUCN Western Gray Whale Advisory Panel(WGWAP), primarily through its Seismic Survey TaskForce (SSTF), collaborated to develop an MMP tomini mize the impacts of the survey on the whales(SSTF 2007−2011, Nowacek et al. 2013, Bröker et al.2015). The primary mitigation measure was to con-duct the seismic survey as early in the season as fea-sible to avoid temporal overlap with the presence ofwhales during their foraging season. This strategywas dependent on sea ice coverage in the region,which is typically ice-free from late May to mid-June.In addition to minimizing possible disruptions to graywhale feeding activities, the early scheduling of seis-mic survey activity was intended to reduce the expo-sure to its sound of recent gray whale mothers arriv-
ing with their dependent calves. Mother−calf pairsare the last whales to arrive on the feeding groundsand are presumably among the more sensitive indi-viduals to anthropogenic activity (Jones & Swartz2009).
Other mitigation measures were adopted to mini-mize exposure to sound levels above 163 dB re 1 μPaRMS. This exposure threshold was based on play-back experiments conducted with gray whales onfeeding grounds in the Bering Sea, in which ~10% ofthe whales stopped feeding and moved away fromtransient sounds (seismic survey pulses) when re -ceived levels exceeded 163 dB re 1 μPa RMS (Malmeet al. 1986, 1988). In a 2001 seismic survey off Sakha -lin that was conducted later in the feeding seasonwhen more animals were present (August and Sep-tember), mitigation measures had been implementedusing similar criteria to limit exposure of feeding graywhales, and yet significant behavioural, abundanceand distribution responses were still observed (Wel -ler et al. 2002, 2005, Gailey et al. 2007a, Yazvenko etal. 2007a,b). It remains unclear whether the whaleswere responding to the sound levels to which theywere exposed or to some combination of this andother factors related to the seismic survey activity.Studies of migrating gray whales have demonstratedthat they react to the direction of the sound source asopposed to overall sound levels. For example, Tyack& Clark (1998) found that migrating gray whalesavoided a low-frequency acoustic sound sourcewhen it was located directly in their alongshore path,but exhibited little or no reaction to an offshoresound source at similar received levels.
The objective of this study was to evaluate theeffectiveness of the mitigation measures implemen -ted in the 2010 seismic survey by testing for changesin whale movements and respirations in response tothe proximities, orientations and sounds of vessels aswell as to the seismic survey pulses. The null hypoth-esis was that whale behaviour was not affected bycontinuous and/or pulse sounds and/or proximity ofvessels during the seismic survey. A number of be -havioural studies of baleen whale responses topotential anthropogenic disturbance have found thatresponse is highly dependent on the context of theexposure, e.g. factors such as season or an animal’sbehavioural state and reproductive status (Beale &Monaghan 2004, Beale 2007, Nowacek et al. 2007,Southall et al. 2007, Ellison et al. 2012, Dunlop et al.2013, Robertson et al. 2013). Therefore, both ‘natural’(e.g. spatial, temporal, environmental, behavioural)and anthropogenic (sound and non-sound related)factors were considered in this study.
54

Gailey et al.: Western gray whale responses to a seismic survey
MATERIALS AND METHODS
Study area
The seismic survey was conducted close to a near-shore summer feeding ground of a gray whale population off northeastern Sakhalin Island, Russia(Fig. 1). This area is characterized by a sandy sub-strate with a gradually sloping continental slope(Fadeev 2010). During the seismic survey, whaledistri bution, numbers, behaviour, respirations andmovements were monitored by 2 shore-based behav-ioural teams. For behavioural monitoring, on everygood-weather day (good visibility with Beaufort < 4)the 2 teams collected data at 2 of 3 shore stations on
the southern spit in the mouth(entrance) of Piltun Bay (Fig. 1). The‘Seismic North’ station was consis-tently used as an observation platformthroughout the study period. The‘Seismic South’ station was used in theearlier part of the field season; anadditional station, ‘Blueberry Hill’,was introduced later in the field sea-son because more whales were ob -served in this area compared to the‘Seismic South’ station. The shore-based behavioural platforms of feredrelatively low (7.8 to 9.7 m) elevationsfor ob servations but were sufficientlyhigh to monitor the near-shore feedingground, which extended less than15 km from shore.
Movement patterns of gray whales
Gray whale movements were re cor -ded using theo dolite tracking metho -dology (Würsig et al. 1991, 2002, Gai-ley & Ortega-Ortiz 2002). We usedSokkia DT5A digital theodolites thathad a 30-power monocular magnifica-tion and a 5 s level of precision. Graywhales were tracked to a maximum of5 km from the shore station, with adja-cent stations coordinating to track thesame individual moving between sta-tions. Given the relatively low stationelevations, observations greater than5 km introduced more distance esti-mation errors that added more variabil-ity in movement parameters. Whales
were tracked continuously until the animal waseither no longer visible or environmental conditionsprevented further tracking. Single or recognizableindividuals (such as high ly distinctive animals ormothers with calves) were tracked preferentially toavoid measurement errors from tracking differentindividuals within a group. If a single or recognizableanimal was unavailable, groups as a whole weretracked to record general move ment patterns. How-ever, data from group tra cking were not included inthis paper. Including mother−calf pairs, the majorityof groups (~75%) typi cally seen on the Sakhalinnear-shore feeding area are single individuals (Gai-ley et al. 2010). The geographic locations of the ani-mals were estimated in real time and displayed in a
55
✖
✖
✖
k
k
k
k
k
kk
k
k
")
")
")
#
Sea of Okhotsk
Pil'tun Bay
PA-B
Piltun Lighthouse
Seismic South
Seismic North
Blueberry Hill
143°40'143°35'143°30'143°25'143°20'143°15'143°10'E
53°5'N
53°0'
52°55'
52°50'
52°45'
52°40'
52°35'
52°30'
52°25'
J Behaviour Stationsk Acoustic Buoys (AUAR-R)
PML✖ Acoustic Buoys (AUAR)
Astokh 4D Survey Area
0 5 10 km
StudyArea
WG
W Feeding G
rounds
PA-A
Fig. 1. Study area, acoustic buoys with (AUAR-R) and without (AUAR) a radio -telemetric channel h/6, respectively), perimeter monitoring line (PML: indica-ting the offshore boundary of the near-shore feeding area; black line) and the3 shore-based observation platforms (black squares) used to monitor westerngray whale (WGW) Eschrichtius robustus behaviour during the seismic surveyin 2010. PA-A and PA-B: the 2 existing oil platforms in the study area; dark grayshading: area of the seismic survey. See Bröker et al. (2015) for further details

Endang Species Res 30: 53–71, 2016
GIS system that illustrated their positions relative tocurrent seismic survey activity, the perimeter moni-toring line (see Fig. 1) and the 163 dB re 1 μPa RMSmitigation A-zone boundary for the given seismicacquisition line (Bröker et al. 2015). A theo do lite soft-ware system, ‘Pythagoras’, was used to calculategeographic positions and plot GIS displays in realtime (Gailey & Ortega-Ortiz 2002).
Focal-animal behavioural observations
Behavioural and respiration patterns were recor d -ed using focal-animal observational techniques (Alt -mann 1974, Martin & Bateson 1993). A focal-animalbehaviour session was initiated when observersidentified a single whale or recognizable animal(i.e. the focal-animal) that could be monitored reli-ably enough so that respiration and critical behav-ioural events would not be missed. A focal-animalsession was terminated once the whale moved outof the study area or environmental conditions fellbelow acceptable limits (visibility < 5 km, wind > 4Beaufort or gust speeds > 20 km h−1). At least 1 ob -server visually followed individuals with the aid of7 × 50 hand-held Fujinon FMTRC-SX binoculars.The behavioural observer verbally stated each be -havioural event, which was recorded by a computeroperator using a programmable keyboard connectedto the Pythagoras software (Gailey & Ortega-Ortiz2002). Focal-animal sessions occurred in conjunctionwith theodolite tracking of the same focal-animal,which provided the ability to link spatial details (i.e.geographic location, depth, etc.) to focal followobservations.
Data processing and response variables
Prior to computing response variables, all move-ment data were re-sampled on a 90 s period to avoidissues of under- or over-sampling and to standardizestep lengths of movement (Turchin 1998, Gailey et al.2007b, 2010). The 90 s re-sampling interval was chosenbased on an autocorrelation analysis of the move-ment data, which indicated that correlation initiallydied out at around 90 s on average (Würsig et al.2002). After re-sampling, behavioural response vari-ables were calculated for every 10.5 min interval(hereafter referred to as a ‘bin’) of continuous obser-vation. This time interval was chosen to end with are-sampled point. In other words, a total of 7 re-sam-pled spatial points were represented in each bin. We
chose bins of 10.5 min in length as a compromisebetween allowing adequate time to acquire dataupon which responses could be measured and theneed to assess short-term behavioural responses.Similar bin lengths have been used in previous stud-ies examining anthropogenic impacts on gray whalesand have proved adequate to obtain meaningfulresults (Gailey et al. 2007a,b, 2010). Bins that did notyield adequate data for the entire 10.5 min duration(i.e. the last bin in a sequence for a given trackline)were removed from the dataset. For each of thesebins, 10 movement and 7 respiration variables werederived from theodolite tracking and focal-animalfollow observations (Table 1). Collectively, we termedthese 17 variables the ‘response variables’.
The behavioural state of the whales in each binwas classified as feeding, feeding/travelling, travel-ling or mixed, based on field observations regardinga whale’s (or whales’) predominant state at the time.Feeding behaviour was characterized by non-direc-tional movement where whale(s) generally remainedin the same area with frequent periods of diving.Travelling behaviour was characterized as swimmingin one general direction, often with consistent surface-respiration-dive patterns. Feeding/travelling be -haviour consisted of whale(s) swimming at relativelylow speeds with frequent periods of diving and withdirectional persistence in movement. Mixed be -haviour denoted any combination of unknown, tran-sitional, or unrecognized behaviour comprising asubstantial portion of the bin.
Acoustic monitoring and sound-level estimation
Vessel and seismic survey sounds were recordedwith 12 Autonomous Underwater Acoustic Recorders(AUARs) with a range of 2 to 15 000 Hz (Borisov etal. 2008). Nine of these AUARs (denoted as AUAR-Rs) were equipped with a digital radiotelemetricchannel that provided real time acoustic data withinthe range of 2 to 2000 Hz with a potential dynamicrange of 96 dB (Kovzel & Rutenko 2009). TheAUAR-Rs were equally spaced along a 20 km seg-ment of the offshore boundary of the gray whalefeeding area (Fig. 1) and provided real time data toa shore-based acoustic team. Three non-telemetricAUARs were located closer to shore in water depthsof 10 m to provide detailed information on soundpropagation for post hoc analyses (Rutenko et al.2012). Racca et al. (2015, this Theme Section) pro-vide further details of acous tic data acquisition dur-ing the seismic survey.
56

Gailey et al.: Western gray whale responses to a seismic survey
To examine the behavioural responses of thewhales, sound level variables were estimated at thetracked animal’s location for each observation bin inthe behavioural dataset (see Racca et al. 2015 for fur-ther details). Gray whales were exposed to an aver-age per-pulse sound exposure level (SEL) from theseismic survey of 132 dB re 1 μPa2-s (range: 99 to156 dB re 1 μPa2-s, n = 161; Fig. 2). For continuoussounds related to vessel activity, whales received amean 1 s SEL of 106 dB re 1 μPa2-s (75 to 137 dB re1 μPa2-s, n = 365; Fig. 3).
For analysis, the sound levels from the seismicsource required distinct treatment for periods of seis-mic survey activity (‘on’) and periods devoid of it(‘off’). To avoid a fictitious estimate of sound levelsduring the latter, which would have skewed the dis-
tribution of received pulse levels by introducingblocks of zero values, we introduced into the model abinary (on/off) seismic survey activity indicator vari-able that conditioned the analysis of all acousticpulse metrics.
Independent variables
Independent variables, used to explain variation inmovement and respiration activities, were categorizedinto 2 classes: natural and impact variables. Naturalvariables included spatial, temporal, behavioural andenvironmental parameters (Table 2). Impact variablesconsisted of sound and non-sound parameters relatedto seismic survey and vessel activity (Table 3).
57
Variable Definition
MovementSpeed (Spd) Distance travelled between 2 sequential fixed points within a trackline divided by the
time interval between the 2 points. A mean speed value was taken for each binAcceleration (Acc) Changes within leg speed to determine if an animal is generally increasing or
decreasing speeds within a trackline. A mean acceleration was taken for each binLinearity (Lin) An index of deviation from a straight line, calculated by dividing the net geographic
distance between the first and last fix of a bin divided by the cumulative distances within a bin
Mean vector length (Trk_R) A directionality index r (Cain 1989) dependent on angular changes: range from 0 (great scatter) to 1 (all movements in the same direction)
Reorientation rate (RR) Magnitude of bearing changes, calculated by the summation of absolute values of all bearing changes within a bin divided by the entire duration of the bin
Direction of movement (mDir) A mean geographic bearing of the general movement for the bin. Sine(direction) was an indicator of whale movement inshore−offshore and cosine(direction) indicated whale movement alongshore
Distance-from-shore (distshore) Mean distance of animal from the closest perpendicular location from the nearby coastline
Relative orientation of whale Orientation (0−180°) of a whale relative to the directional persistence in movement of to closest vessel (ROW_CV) the closest vessel of approach
Relative orientation of whale Orientation (0−180°) of a whale in relation to the directional persistence in movement to seismic vessel (ROW_SV) of the seismic vessel
Ranging index (range) Measure of the minimal diagonal area of the whale’s track incorporating its course and track duration (Jahoda et al. 2003)
RespirationRespiration interval (RI) Duration less than 60 s between subsequent exhalations per surfacing. Mean
respiration intervals were calculated for each binDive time Any interval where exhalation period is greater than 60 s. Mean dive times were used
for each binSurface time Mean duration the animal remains at or near the surface within a binNumber blows/surfacing Mean number of exhalations per surfacing for each bin(NumSurfs)
Time at surface Mean percent of time animal was observed at the surface without divingSurface blow rate (SRate) Mean number of exhalations min−1 during a surfacingDive-surface blow rate (SDRate) Mean number of exhalations min−1 averaged over the duration of a surfacing-dive
cycle, using the dive previous to the surfacing
Table 1. Response variables derived from behavioural observations of the movements and respiration of western gray whales Eschrichtius robustus

Endang Species Res 30: 53–71, 2016
Vessel positional data as well as variables derivedfrom those data, such as distance of closest vesselapproach to a whale, were treated as continuousvariables. All seismic survey-related vessels as wellas other Sakhalin Energy vessels individually re -
corded their positions by GPS. An Automatic Identifi-cation System (AIS) was also used during the seismicsurvey to record the locations of all transponder-equipped vessels at distances up to 100 km awayfrom the study area. Due to missing periods of AIS
58
Per-pulse sound exposure level (dB re 1 µPa2-s)110 120 130 140 150
No.
of b
ins
0
5
10
15
20
25
14013012011010090800
10
20
30
40
50
60
1 s sound exposure level (dB re 1 µPa2-s)
No.
of b
ins
Fig. 2. Distribution of per-pulse sound exposure levels (dB re1 μPa2-s) at bin locations in the observed tracks of westerngray whales Eschrichtius robustus in the vicinity of the
seismic survey
Fig. 3. Distribution of 1 s sound exposure levels from vesselactivity (dB re 1 μPa2-s) at bin locations in the observedtracks of western gray whales Eschrichtius robustus in the
vicinity of the seismic survey
Variable Description Coding
Station Name of observation station where whale Factor with 3 levels: Blueberry Hill, North Seismic, was observed South Seismic. South Seismic is the reference level
Day Number of days from the start of the survey
Time of day Time of the observation Time of the observation, coded as hours after 00:00:00 of the same day; e.g. an observation at 3:41:15 pm on any day is coded as 15.6875
Behaviour Animal’s behavioural state during Factor with 4 levels: feeding, feeding/travelling, observation bin travelling, mixed (other). Feeding is the reference level
Beaufort Sea state measured on Beaufort scale Factor with 6 levels: [0], [1], [2], [3], [4], [5]. [0] is the reference level
Visibility Visibility conditions estimated at the time Factor with 5 levels: [1], [2], [3], [4], [5]. [1] is the reference level
Distance Distance from whale location to the onshore to station observation station (km)
Depth Water depth at whale location (m)
Tide Predicted tide height at time of observation (m)
Wind Direction of the wind Factor with 4 levels: South (‘S’, ‘SE’, ‘SES’, ‘SSE’, direction ‘SSW’, ‘SW’, ‘SWS’), West (‘W’, ‘WNW’, ‘WSW’,
‘NWW’), East (‘E’, ‘ENE’, ‘ESE’, ‘NEE’), North (‘N’,‘NE’, ‘NNE’, ‘NNW’, ‘NW’). South is the reference level
Humidity Relative humidity at time of observation
Wind speed Speed of the wind (km h−1) during observation
Swell height Field estimated swell height (m) duringobservation
Table 2. Natural variables used to explain variation in movement and respiration activity of western gray whales Eschrichtius robustus during the seismic survey

Gailey et al.: Western gray whale responses to a seismic survey
and GPS data (primarily during pre- and post seismicsurvey activity), the vessel position information wasnot complete for the duration of this study. The major-ity of the dataset (89%), however, had sufficient ves-sel position information to estimate vessel positionscontinuously. In addition, there was considerably lessnoise-generating human activity before the seismicsurvey began and after it was completed.
Variable treatment
The modelling approach in this study assumed theresponse variables to have an approximately normaldistribution. To meet this assumption, 2 variables(linearity and mean vector length) were transformed
using a logistic transformation. A small constant,0.5 × [1− (largest value < 1)], was added to all valuesof these variables to compute the logistic transforma-tion when some values equalled 1.0.
The direction of movement ranged from 0 to360°. Although sine/cosine representatives or circu-lar trans formation methods could have been applied,we determined that the predominant movement wasin a north−south direction with little east−west move-ment, which is common for coastal gray whales thatmove parallel to shore, and therefore we categorizedthe direction of movement into North, East, South orWest.
Collinearity among covariates was assessed byexamining pair-wise Pearson correlation coefficientsamong all continuous natural and continuous impact
59
Variable Description Coding
SoundCumulative SEL Cumulative sound exposure level for the entire track of observation
Per-pulse SEL Average sound exposure level for each pulse of seismic survey activityover a 10.5 min observation interval
Peak SPL Average peak sound pressure level for each pulse of seismic survey activity over a 10.5 min observation interval
Kurtosis Average sharpness of the pulse distribution with respect to normal (Gaussian) distribution for each pulse of seismic survey activity over a 10.5 min observation interval
SNR Average ratio (in dB) between the acoustic signal and the background noise for each pulse of seismic survey activity over a 10.5 min observation interval
SEL−SV 1 s sound exposure level received at whale’s location from the seismic vessel
SEL−PG 1 s sound exposure level received from the nearshore behavioural observation vessel (Pavel Gordienko)
SEL−all vessels Aggregate 1 s sound exposure level received from vessels in the vicinity of the observed gray whale
Non-sound
Closest vessel Distance from whale to closest vessel (km)
Number of vessels Total number of vessels within 5 km of the whale
Vessel type Type of vessel closest to animal’s location Factor with 4 levels: seismic, behavioural, support, other. Seismic is the reference level
Time since Number of weeks since the onset of seismic survey activity
Relative orientation of Orientation of whale being observed to the closest vessel approach whale to closest vessel with the distance between whale and vessel as an interaction term
Relative orientation of Orientation of the vessel to the whale being observed with the closest vessel to whale distance between whale and vessel as an interaction term
Relative orientation of Orientation of the seismic vessel to the whale with the distance seismic vessel to whale between the whale and sound source as an interaction term
Distance to closest/ Linear distance of whale being observed to the closest vessel seismic vessel7 of approach and seismic vessel
Table 3. Sound and non-sound impact variables used to explain variation in movement and respiration activity of western gray whales Eschrichtius robustus during the seismic survey

Endang Species Res 30: 53–71, 2016
covariates. Box-plots were used to evaluate non- continuous natural covariates against continuous im -pact covariates, and vice versa. Contingency tableswere computed between pairs of non-continuousvariables. For all continuous variables, correlationcoefficients larger than 0.60 warranted concern thatnatural variables were masking impact effects, orvice versa, in the models. Among pairs of variableswith high collinearity, the most readily interpretablevariable was retained, while the other member of thepair was dropped.
Gray whale behavioural response models
Among the fundamental analytical difficulties as -sociated with the behavioural datasets are potentialbiases due to detectability, pseudo-replication andautocorrelation (Gailey et al. 2010). For example, se -quential bins could be highly correlated and individ-uals with more bins could be over-represented in theanalysis (i.e. pseudo-replication). To adjust for thesesampling biases, we weighted each observation inthe analysis by a value inversely proportional to theprobability of obtaining that obser vation. Weightingis justified by the Horvitz- Thomp son theorem (Hor -vitz & Thompson 1952, Overton & Stehman 1995),where weighted averages provide unbiased esti-mates of population means when weights are in -versely proportional to the probability of includingthe observation. Based on this theorem, all observa-tions in the analyses were weighted by 1/ni, where ni
is the number of bins in the track from animal i. As aresult, each animal in the analyses had a total weightof 1.0. Although we attempted to account for pseudo-replication within a track, some pseudo-replicationcould still occur due to the same individual beingtracked multiple times. Since it is impos sible to iden-tify each individual from shore, it is currentlyunknown how much, if any, pseudo-replication existsamong different tracklines.
The response variables were modelled usingmixed linear models (Pinheiro & Bates 2000). Thismodelling technique was chosen due to the natureof the objectives and because autocorrelation waspotentially present in the response variables. Auto-correlation within tracks was accounted for by esti-mating mixed linear models that assumed unstruc-tured, constant or autoregressive dependencies inmodel residuals (see below). In this analysis, trackswere assumed to be the independent units of replica-tion, not the individual observations within tracks.The models estimated changes in the responses to
environmental (e.g. depth, wind speed) and impactcovariates (e.g. received sound levels, vessel dis-tances). The mixed linear models for a particularresponse took the following form:
yi = Xiβ + bi + εi (1)
where yi is the vector of responses for track i, β is avector of fixed effects coefficients, bi is a randomeffect associated with the i th track that is assumed tobe normally distributed, Xi contains the (fixed) co -variates associated with track i and ε i is the vector ofrandom within-track errors that is assumed to followa normal distribution with mean 0 and covariance Σ.The error matrix Σ was assumed to have either anunrestricted, constant or auto-regressive structure(Pinheiro & Bates 2000). The unstructured correlationmodel assumed no structure in Σ (except symmetry)and estimated separate covariance for each pair oferrors within a track. The constant correlation modelassumed that correlation among all pairs of errorswas equal regardless of the time differences betweenthem. The auto-regressive correlation structure as -sumed that correlation between errors associatedwith observations at time a and b was ρ|a − b|, where ρis the parameter to be estimated. All effects wereestimated with generalized estimating equationsusing the R function ‘lme()’ available in the ‘nlme’package (R Development Core Team 2010, http://cran.r-project.org/web/packages/nlme/index.html).
Model selection was based on a stepwise selectionprocedure that relied on the Bayesian InformationCriterion (BIC). BIC, rather than Akaike’s Informa-tion Criterion (AIC), was chosen as the measure ofvariable utility because it generally yields a moreparsimonious model. Both forward and backwardstep selection was used to include natural and/orimpact effects. The initial model contained an inter-cept only. BIC was computed after addition of eachvariable, and the variable that reduced BIC the mostwas added to the current model (forward step). Anyvariable already in the model that did not cause BICto increase when removed was eliminated from themodel (backward step). The final model was deter-mined after the cycle of forward and backward stepswas repeated and BIC could not be further reduced.Standardized residual plots were inspected to assessmodel fit.
Statistical power
Power analyses were conducted to examine the sta-tistical power of the models that were applied here to
60
Gailey et al.: Western gray whale responses to a seismic survey
detect population-level changes in gray whale move-ment and respiration activity due to increased expo-sure to seismic survey sounds. These power analysesestimated the number of independent samples need edto detect small and large changes in the response vari-ables associated with seismic survey sounds. We useddata collected during periods with no noise-generat-ing human activity as a guide for natural variation andsimulated observations containing known-size anthro -po genic effects. These simulated observations werethen analysed by the mixed linear model pro ceduresdescribed above and detection of the effects was re -corded. Through repetitive simulation and analysis,we were able to assess the statistical power of a rangeof sample sizes and significance levels. We simulated10 and 50% increases in the mean of each responsevariable when seismic survey sound increased fromlow to mean levels. We estimated power under signif-icance levels of α = 0.05. As a benchmark, we reportthe sample size that achieves a power of 80% for aparticular effect.
For every sample size, n, we simulated data by firstre-sampling, with replacement, n tracks from the 59
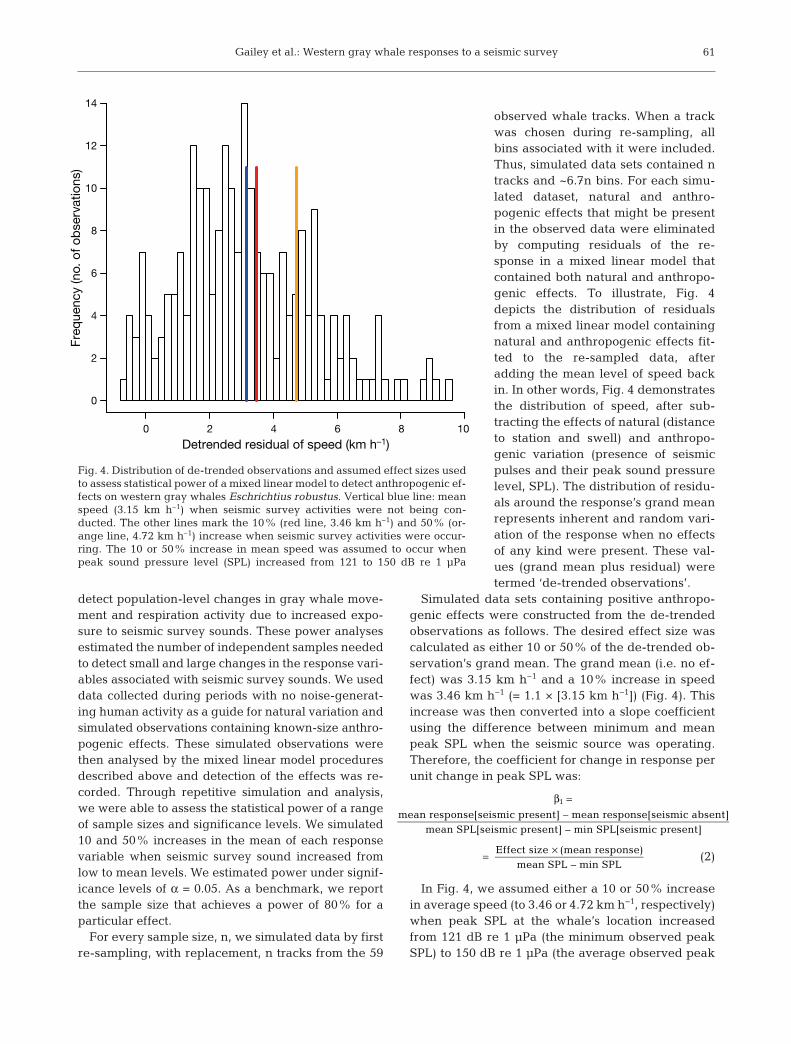
observed whale tracks. When a trackwas chosen during re-sampling, allbins associated with it were included.Thus, simulated data sets contained ntracks and ~6.7n bins. For each simu-lated dataset, natural and anthro-pogenic effects that might be presentin the observed data were eliminatedby computing residuals of the re -sponse in a mixed linear model thatcontained both natural and anthropo -genic ef fects. To illustrate, Fig. 4depicts the distribution of residualsfrom a mixed linear model containingnatural and anthropogenic effects fit-ted to the re-sampled data, afteradding the mean level of speed backin. In other words, Fig. 4 demonstratesthe distribution of speed, after sub-tracting the effects of natural (distanceto station and swell) and anthropo -genic variation (presence of seismicpulses and their peak sound pressurelevel, SPL). The dis tribution of residu-als around the re sponse’s grand meanrepresents in herent and random vari-ation of the response when no effectsof any kind were present. These val-ues (grand mean plus residual) weretermed ‘de-trended observations’.
Simulated data sets containing positive anthropo -genic effects were constructed from the de-trendedobservations as follows. The desired effect size wascalculated as either 10 or 50% of the de-trended ob -servation’s grand mean. The grand mean (i.e. no ef -fect) was 3.15 km h−1 and a 10% increase in speedwas 3.46 km h−1 (= 1.1 × [3.15 km h−1]) (Fig. 4). Thisincrease was then converted into a slope coefficientusing the difference between minimum and meanpeak SPL when the seismic source was operating.Therefore, the coefficient for change in response perunit change in peak SPL was:
(2)
In Fig. 4, we assumed either a 10 or 50% increasein average speed (to 3.46 or 4.72 km h−1, respectively)when peak SPL at the whale’s location increasedfrom 121 dB re 1 μPa (the minimum observed peakSPL) to 150 dB re 1 μPa (the average observed peak
β =
= ×
mean response[seismic present] – mean response[seismic absent]mean SPL[seismic present] – min SPL[seismic present]
Effect size (mean response)mean SPL – min SPL
1
61
Detrended residual of speed (km h–1)
Freq
uenc
y (n
o. o
f ob
serv
atio
ns)
0 2 4 6 8 10
0
2
4
6
8
10
12
14
Fig. 4. Distribution of de-trended observations and assumed effect sizes usedto assess statistical power of a mixed linear model to detect anthropogenic ef-fects on western gray whales Eschrichtius robustus. Vertical blue line: meanspeed (3.15 km h–1) when seismic survey activities were not being con-ducted. The other lines mark the 10% (red line, 3.46 km h–1) and 50% (or-ange line, 4.72 km h–1) increase when seismic survey activities were occur-ring. The 10 or 50% increase in mean speed was assumed to occur whenpeak sound pressure level (SPL) increased from 121 to 150 dB re 1 μPa
Endang Species Res 30: 53–71, 2016
SPL). Under the 10% change assumption, whalespeeds increased 0.011 km h−1 per dB increase inpeak SPL. Similar assumptions and computationswere made for the other response variables to estab-lish the ‘true’ relationship between the response andseismic survey sound levels.
Finally, residuals from the model containing natu-ral and anthropogenic effects were added to the‘true’ relationship to establish a simulated ‘fitting’data set. A model containing anthropogenic effectswas then re-fit to the ‘fitting’ dataset, and the coeffi-cient of peak SPL was tested for significance usingthe t statistic (t = coefficient / SE). If the coefficientwas significantly different from zero according to theα-level under consideration, then an effect of peakSPL on the parameter was considered to have beendetected.
By repeatedly sampling the residuals and addingthem to the ‘true’ relationship to re-construct ‘fitting’data sets, fitting a model containing simulated peakSPL values and observing whether a positive slopewas detected, it was possible to compute power for aparticular sample size as a proportion of rejectionsamong such iterations. The number of iterations usedfor each simulation was 100. Due to variation inher-ent in re-sampling tracks, the entire process of re-sampling tracks, re-constructing ‘true’ values andrunning 100 iterations of detection simulations wasrepeated 10 times for each sample size. Reportedpower was the average of these 10 values.
RESULTS
Effort
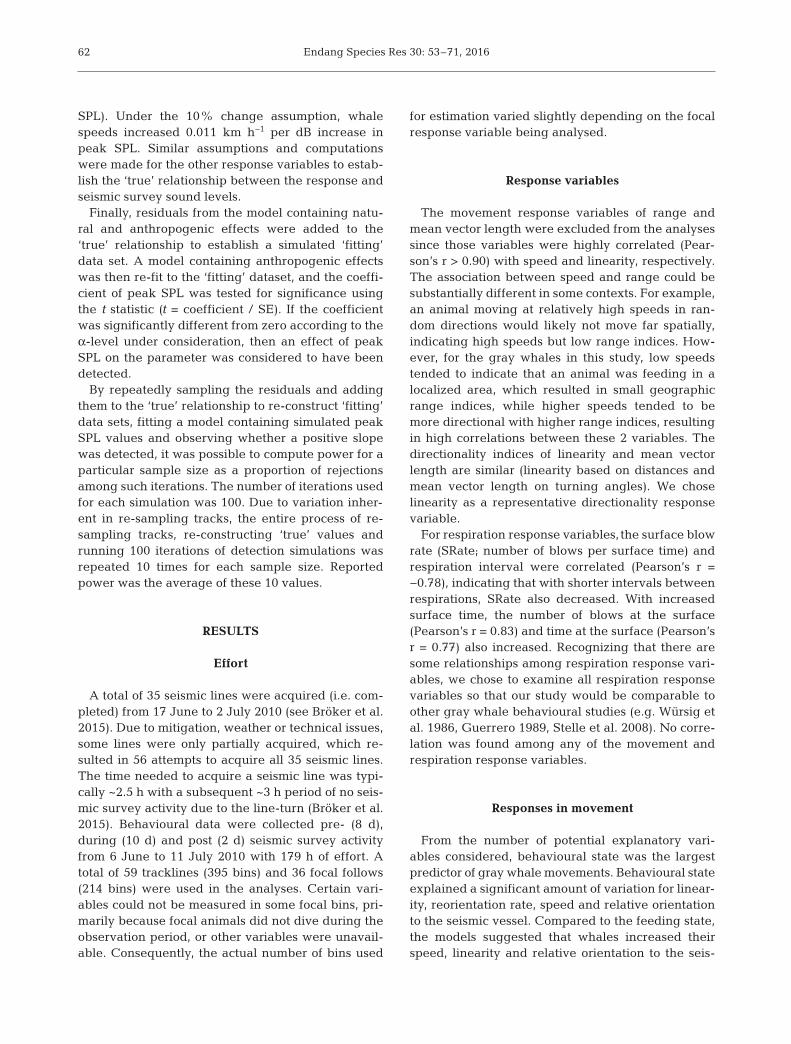
A total of 35 seismic lines were acquired (i.e. com-pleted) from 17 June to 2 July 2010 (see Bröker et al.2015). Due to mitigation, weather or technical issues,some lines were only partially acquired, which re -sulted in 56 attempts to acquire all 35 seismic lines.The time needed to acquire a seismic line was typi-cally ~2.5 h with a subsequent ~3 h period of no seis-mic survey activity due to the line-turn (Bröker et al.2015). Behavioural data were collected pre- (8 d),during (10 d) and post (2 d) seismic survey activityfrom 6 June to 11 July 2010 with 179 h of effort. Atotal of 59 tracklines (395 bins) and 36 focal follows(214 bins) were used in the analyses. Certain vari-ables could not be measured in some focal bins, pri-marily because focal animals did not dive during theobservation period, or other variables were unavail-able. Consequently, the actual number of bins used
for estimation varied slightly depending on the focalresponse variable being analysed.
Response variables
The movement response variables of range andmean vector length were excluded from the analysessince those variables were highly correlated (Pear-son’s r > 0.90) with speed and linearity, respectively.The association between speed and range could besubstantially different in some contexts. For example,an animal moving at relatively high speeds in ran-dom directions would likely not move far spatially,indicating high speeds but low range indices. How-ever, for the gray whales in this study, low speedstended to indicate that an animal was feeding in alocalized area, which resulted in small geographicrange indices, while higher speeds tended to bemore directional with higher range indices, resultingin high correlations between these 2 variables. Thedirectionality indices of linearity and mean vectorlength are similar (linearity based on distances andmean vector length on turning angles). We choseline arity as a representative directionality responsevariable.
For respiration response variables, the surface blowrate (SRate; number of blows per surface time) andrespiration interval were correlated (Pearson’s r =−0.78), indicating that with shorter intervals betweenrespirations, SRate also decreased. With increasedsurface time, the number of blows at the surface(Pearson’s r = 0.83) and time at the surface (Pearson’sr = 0.77) also increased. Recognizing that there aresome relationships among respiration response vari-ables, we chose to examine all respiration responsevariables so that our study would be comparable toother gray whale behavioural studies (e.g. Würsig etal. 1986, Guerrero 1989, Stelle et al. 2008). No corre-lation was found among any of the movement andrespiration response variables.
Responses in movement
From the number of potential explanatory vari-ables considered, behavioural state was the largestpredictor of gray whale movements. Behavioural stateexplained a significant amount of variation for linear-ity, reorientation rate, speed and relative orientationto the seismic vessel. Compared to the feeding state,the models suggested that whales increased theirspeed, linearity and relative orientation to the seis-
62

Gailey et al.: Western gray whale responses to a seismic survey
mic vessel (moving away) and decreased their re -orientation rate when travelling. Feeding/travellingco efficients were typically between those of the ref-erenced feeding state and travelling behaviour(Table 4). Humidity entered into 2 models (accelera-tion and direction of movement). However, the coef-ficients were small (<0.007). As a function of distancefrom the observation platform, the distance fromshore as well as the animal’s speed and orientationgenerally increased. The direction of movement alsobecame slightly more linear as a function of waterdepth (Table 4).
Gray whale movement patterns were not signifi-cantly associated with any of the sound exposurecovariates. Two non-sound related impact variables,however, were significantly associated with whaledistance from shore and relative orientation. The dis-tance of the closest vessel approach to whales wasassociated with the whales’ distance from shore. Thiswould be expected given that whales observed far-ther from shore were closer to the vessel activity,which was generally offshore of the whales’ feedingarea.
The closest vessel’s orientation with respect to thewhale was found to alter the whale’s orientation tothe vessel, suggesting some level of vessel−whaleinteraction effect. When the closest vessel was within~12 km, the whale oriented primarily perpendicularto the vessel regardless of the vessel’s orientation(Fig. 5). When the closest vessel was within ~5 kmand oriented perpendicular to or away from thewhale (lower right corner of Fig. 5), the whale wasgenerally oriented away from the vessel. As the ves-sel moved away from the whale and became moreoriented away from the whale, the whale changed
orientation from perpendicular to towards the vessel(upper right corner of Fig. 5).
Responses in respiration
Despite behavioural state being the best predictorin the movement models, only one respiration res -ponse variable was found to be associated with be -havioural state. While feeding, gray whales exhibitedan increased SRate compared to that performedwhile feeding/travelling and travelling. Wind speedand swell height were found to explain a portion ofthe variation in the amount of time whales spent atthe surface as well as the number of blows seen at thesurface. These results suggest that as wind speed in -creased, the surface time and number of blows ob -served decreased. As swell increased, the surfacetime and number of blows observed also increased.The portion of the time whales were detected duringan observation bin was also found to be associatedwith increased swell height. Water depth has beenconsistently observed to be an important explanatoryvariable for dive time. The observed dive durationincreases with water depth (Table 5).
As with the movement response variables, nosound- related impact variables were found to be as -sociated with any of the respiration response vari-ables. The number of vessels within 5 km was theonly non-sound related impact variable that enteredinto any of the respiration models. This variable wasassociated with the dive-surface blow rate (DSRate),which suggests that whales were cycling throughtheir dive-respiration-surfacing cycles more rapidlyas the number of vessels within 5 km increased.
63
Response β0 Humi- Dist_ Depth Closest vessel Behavioural state Relative orientation (CV vessel)variable dity Station BoatPres CV_Dist FT T M Sin Cos Sin Cos
(Orient) (Orient) (Orient:Dist) (Orient:Dist)
Acc −0.02 0distshore 0.87 0.21 0.72 −0.05Lin (logit) 0.81 1.87 3.17 1.75RR 27.20 1.17 −14.80 −22.00 −15.90Spd −0.40 0.56 1.46 3.81 2.29mDir 1.15 −0.006 0.01ROW_CV 98.50 −2.57 3.43 −15.4 0.16 1.32ROW_SV 67.90 30.34 8.92 10.08
Table 4. Model results for western gray whale Eschrichtius robustus movement response variables. Each row represents a model with theresponse variable (see Table 1 for abbreviations), followed by the intercept (β0) in the next column and explanatory variables that enteredinto the model in subsequent columns (Behavioural state abbreviations, FT: feeding/travelling; T: travelling; M: mixed). See Table 2 for further explanation of variables. Numbers in each explanatory column represent the coefficients in the model, with bold representing sig-nificant coefficients (p < 0.05) and other coefficients in regular print indicating variables that entered into the final model but were non-
significant (p > 0.05)

Endang Species Res 30: 53–71, 2016
Statistical power
Power curves, representing the power to detect a10% change in speed for a given sample size, areillustrated in Fig. 6. The estimated number of whaletracks necessary to detect a 10 and 50% change ineach response variable with 80% power when α =0.05 is shown in Table 6.
Power to detect a 10% change in the mean of a re-sponse variable at the α = 0.05 level ranged from 398to >7000 tracks (Table 6). Ex-cluding the more extreme esti-mates (398 for distance fromshore and 7000 for accelera-tion), the average number oftracks needed to detect a 10%change in the variable was ap -proximately 1200. The samplesize to detect a 50% change intrack parameters was roughlyan order of magnitude smallerthan the sample size necessaryto detect a 10% change. Ex clu -ding distance from shore andacceleration, the average num-ber of tracks needed to detect a50% change in the remaining 6track parameters was approxi-mately 50 (Table 6).
For respiration response variables, the number ofsamples required to detect a 10% change in a focalparameter at the α = 0.05 level ranged from 319 to1415 (Table 7). Excluding the 2 extremes (1415 forsurface time and 319 for DSRate), the average sam-ple size needed to detect a 10% change with 80%power for the respiration variables was approxi-mately 550. For a larger effect size (50% change), thenumber of focal follows needed ranged from 15 to 57(Table 7) with a mean of approximately 27.
64
Response variable β0 Wind Swell Depth Behavioural state NVesSpd FT T M
Respiration interval 0.44Surface time 0.97 −0.02 0.29Dive time 1.38 0.10Number blows/surfacing 2.09 −0.06 0.51 0.15Surface blow rate 5.03 −0.11 −1.15 −0.55Dive surface blow rate 0.93 0.08Time at surface 15.77 13.83
Table 5. Summary of model results for respiration response variables of western graywhales Eschrichtius robustus. Each row represents a model with the response vari-able in the first column, intercept (β0) in the next column and explanatory variablesthat entered into the model in subsequent columns (Behavioural state abbreviationsFT: feeding/travelling; T: travelling; M: mixed). See Table 3 for further explanation ofvariables; NVes: no. of vessels. Numbers in each explanatory column represent thecoefficients in the model with bold representing significant coefficients (p < 0.05) andcoefficients in regular print indicating variables that entered into the model but were
non-significant (p > 0.05)
0
5
10
15
20
25
30
Orientation of closest vessel to whale
Dis
tanc
e to
clo
sest
ves
sel (
km)
Toward
Quarter Toward
Perpendicular
Towards Perpendicular Away
0.0
22.5
45.0
67.5
90.0
112.5
Orientation ofwhale to closest
vessel (°)
Fig. 5. Relative orientation of western gray whales Eschrichtius robustus to the closest vessel of approach and the vessel’s ori-entation to the whale as predicted by the final model for relative orientation (left). Three relative orientations from the leftmain panel are illustrated on the smaller panels to the right, with blue arrows representing the vessel, red arrows the whale,
and bars the distance (not to scale) between the 2

Gailey et al.: Western gray whale responses to a seismic survey
Individual responses to seismic survey activity
Although our analyses found little association be -tween gray whale behaviour and seismic surveyactivity, the analyses assumed all animals wouldreact in a similar manner when exposed to the activ-ity. In addition, the analyses suffered from limitedsample sizes to detect moderate to subtle changes inbehaviour. Observations of gray whales during seis-mic survey exposure did document several individ-ual responses to the activity. As these individualresponses are critical towards understanding graywhale behaviour when confronted with human activ-ities, we provide 2 case examples to document thesebehavioural changes.
On 1 July 2010, an individual was observed trav-elling from the south at relatively high speeds(mean = 8.1 km h−1, range: 6.1 to 9.9 km h−1). Theanimal was initially observed after seismic acquisi-tion activity had commen ced. The individual wastravelling parallel to shore towards the behaviouralmitigation A-zone. During this parallel-to-shore travel,the sound exposure (range: 143 to 151 dB SEL)experienced by the animal gradually increased, asthe seismic vessel was moving more rapidly thanthe animal. Slightly before a shut-down would havebeen ordered due to a gray whale’s presence in theA-zone, the individual deviated from its path paral-
lel to the shoreline and began moving toward shore,where sound exposure presumably decreased. Theanimal continued its high-speed travel northwardinto water depths of 6 m and eventually moved far-ther offshore at the end of the seismic acquisitionactivity, likely due to the presence of a sand barassociated with the mouth of the lagoon that com-monly prevents individuals, including mothers withcalves, from continuing a parallel coastal movementin this area (Fig. 7). Unfortunately, the behaviour ofthe animal was not observed prior to the onset ofseismic acquisition activity.
On 29 June 2010, an individual was observed feeding/ travelling in a northeast direction prior to theonset of seismic acquisition activity. The whale’smean speed of travel during this period was 2.1 kmh−1. At the ini tiation of seismic source ramp-up proce-dures (a progressive increase in power before thestart of an acquisition line), the individual transitionedfrom feeding/travelling in a northeast direction totravelling in a northwest direction at speeds ranging
65
Parameter Sample size (n)10% 50%
change change
Acceleration >7000 >300Distance from shore 398 23Linearity 1717 62Reorientation rate 1300 52Speed 1376 54Relative orientation to closest vessel 908 49Relative orientation to seismic vessel 848 23Direction of movement 1144 43
Table 6. Estimated sample size (n = number of western graywhale tracks) necessary to detect a 10 or 50% change in
each response variable with 80% power when α = 0.05
Parameter Sample size (n)10% 50%
change change
Respiration interval 552 27Surface time 1415 57Dive time 338 16Number of blows/surfacing 415 18Surface blow rate 364 18Dive surface blow rate 319 15Time at surface 1111 39
Table 7. Estimated sample size (n = number of western graywhale focal-animal follow sessions) necessary to detect a 10or 50% change in focal follow parameters with 80% power
when α = 0.05
0 1000 2000 3000 4000 5000 6000 7000
0.0
0.2
0.4
0.6
0.8
1.0
Sample size (n)
Pow
er t
o d
etec
t 10
% s
hift
in m
ean
resp
onse
●
●
●
●
●
●●
●● ●
● ● ● ● ● ● ● ● ● ●
Fig. 6. Power to detect a 10% change in gray whale Esch -rich tius robustus speed. Dashed lines highlight sample sizerequired to detect a 10% change with 80% power when
α = 0.05

Endang Species Res 30: 53–71, 2016
from 5.2 to 9.8 km h−1. The estimated sound exposureat the animal’s location ranged from 127 to 139 dBSEL. Unlike the previous example where the animalwas observed to avoid increased sound exposure,this individual moved in a direction that would haveincreased its level of exposure. At the end of theobservation period, the animal entered into thebehavioural mitigation A-zone and a precautionaryshut-down of the seismic source was ordered (Fig. 8).The animal continued to move farther offshore andout of visual range of the shore-based teams.
DISCUSSION
Natural influences on gray whale behaviour
The behavioural activity of the animal was thelargest ‘natural’ predictor of gray whale movementsand respirations in the feeding area. In similar ana -lyses of independent datasets, Gailey et al. (2007b,2010) also found that different behavioural activitiesof gray whales entailed changes in movement pat-terns of speed, reorientation rate and linearity. In this
66
J
J
J
Q
n/an/a
147147146147
148149
149150150148144143143143143
151
20 m
10 m
0 4 82 km
Max Exposure Footprint (156 dB SEL)
Point of Max Exposure
WGW Track
Pacific Explorer
Igor Maksimov
Pavel Gordienko
156 dB Exposure - Line 7
PML
Blueberry Hill
Seismic South
Seismic North
PiltunLighthouse
PA-B
PA-A
Start
Start
Start
Start
143°15’E
52°55’N
52°50’
52°45’
52°40’
52°35’
143°20’ 143°25’ 143°30’ 143°35’ 143°40’
Fig. 7. Case example of a western gray whale (WGW; Eschrichtius robustus) responding to seismic survey activity on 1 July2010. Colour scheme in the track illustrates low (green) to high (red) per-pulse sound exposure level (SEL, dB re 1 μPa2-s) andperiods when no seismic acquisition was being conducted (gray, n/a). Dark blue, purple and light blue lines illustrate vesselactivity during seismic acquisition. Gray polygon: acoustic footprint at the time of maximum per-pulse SEL at the animal’s
location (~151 dB re 1 μPa2-s, black dot). See Fig. 1 for further explanations

Gailey et al.: Western gray whale responses to a seismic survey
study, however, only SRate was significantly asso -ciated with the behavioural activity of the animal.Gailey et al. (2007b, 2010) found SRate to be in -fluenced by behavioural activity as well, but thosestudies also identified respiration interval and sur-face time response variables as exhibiting change(shorter respiration intervals and surface times whilefeeding compared to travelling), depending on theactivity of the animal.
Interestingly, dive duration was not found, eitherin this study or in previous analyses of gray whale
behaviour, to change significantly with behaviouralstate (Gailey et al. 2007b, 2010). Dive duration has,however, been consistently observed to be longer inwater of greater depths. Shore-based observationoffers only limited opportunities to record behaviourof whales in deeper waters. It has been hypothesizedthat the shorter dive durations observed off Sakhalincompared to other gray whale studies is due to thevery shallow depth of the whales’ nearshore feedingarea there (Weller et al. 1999). Würsig et al. (1986)ob served a general increase in gray whale dive time
67
"
"
"
Q
139135
n/an/a
137 r/u137 r/u
140 r/u136 r/u
134 r/u
139
20 m
10 m
0 4 82 km
Max Exposure Footprint (156 dB SEL)
Point of Max Exposure
WGW Track
Pacific Explorer
Igor Maksimov
Pavel Gordienko
156 dB Exposure - Line 4
PML
Blueberry Hill
Seismic South
Seismic North
PiltunLighthouse
PA-B
PA-A
Start
Start
Start
Start
143°15’E
52°55’N
52°50’
52°45’
52°40’
52°35’
143°20’ 143°25’ 143°30’ 143°35’ 143°40’
Fig. 8. Case example of a western gray whale (WGW; Eschrichtius robustus) responding to seismic survey activity on 29 June2010. Colour scheme in the track illustrates low (green) to high (red) per-pulse sound exposure level (SEL, dB re 1 μPa2-s) andperiods when no seismic acquisition was being conducted (gray, n/a). The postfix r/u identifies sound levels for the period inwhich the seismic source was being ramped up to full power. Dark blue, purple, and light blue lines illustrate vessel activityduring seismic acquisition. Gray polygon: acoustic footprint at the time of maximum per-pulse SEL at the animal’s location
(~139 dB re 1 μPa2-s, black dot). See Fig. 1 for further explanations

Endang Species Res 30: 53–71, 2016
in deeper (>20 m) water. Dolphin (1987) also found correlations between humpback whale Megapteranovaeangliae dive duration and depth of prey patches,and the benthic method of feeding of gray whales hasbeen noted to influence dive duration, surface timeand SRate in a number of studies (Würsig et al. 1986,Guerrero 1989, Mallonee 1991, Hawkinson 1992,Stelle et al. 2008). This relationship, therefore, maybe related to the extended time required to reach aprey source in deeper waters.
Anthropogenic influence on gray whale behaviour
Behavioural changes in response to seismic surveyand other anthropogenic sounds have been noted fora number of cetacean species (Richardson & Würsig1995, Southall et al. 2007). Behavioural responses toan thropo genic sound can be variable in duration(short-term vs. long-term) and spatial scale (localizedvs. large scale). For example, bowhead whales Bala -ena mysticetus respond to industrial sounds at bothlocal (<10 km) and broad scales (>70 km) (Richard-son et al. 1985, 1986, Ljungblad et al. 1988, Richard-son & Malme 1993). On their breeding grounds inMexico, gray whales are believed to have abandonedentire lagoon systems in response to increased vesseltraffic (Bryant et al. 1984). On feeding grounds, graywhales respond behaviourally and spatially to bothpulse (seismic survey) and continuous sounds (vesseltraffic, platform installation, dredging, etc.) (Weller etal. 2002, Gailey et al. 2007a,b, 2010, Yazvenko et al.2007a,b).
The present study examined whether individualsexposed to seismic survey sound and/or sounds ofvessel activity ex hibited consistent movement or res-piration respon ses. There is considerable variabilityin ceta cean behaviour in response to sound-generat-ing human activities which could be dependent onthe context of the exposure compared to the overallsound level (Beale & Monaghan 2004, Beale 2007,Ellison et al. 2012). In our study we attempted to con-sider a number of acoustic metrics as well as the dis-tance of an activity from the animal, orientation of theactivity relative to the animal and the animal’s orien-tation relative to the activity as contextual aspects.We were unable to de tect significant population-levelbehavioural respon ses to seismic survey activity, al -though individual res ponses were ob served. There-fore, this study failed to reject the null hypothesisthat there were no population-level behavioural im -pacts on the gray whales from exposure to sounds fromthe seismic survey or the nearshore vessel activity.
We found that vessel activity explained variation inthe relative orientation of the whales and theirDSRate. Swartz & Jones (1979) found that vesselsmoving erratically or at high speeds in the Baja Cali-fornia wintering la goons occasionally caused graywhales to swim away rapidly, but there was little or nowhale response to slow-moving or anchored vessels.Similarly, Bogos lovskaya et al. (1981) found that onsummer feeding grounds, gray whales fled when So-viet catcher boats approached to within 350 to 550 m,but generally paid no attention to vessels at distances>550 m. It is possible that the whales observed in thatstudy had been sensitized to catcher boats due to neg-ative experiences. Earlier studies of gray whales atSakhalin documented behavioural responses (in-creased accelerations, high speeds and distances fromshore) to vessel activity (Gailey et al. 2007b, 2010).However, the present study is the first to examine theinteractions between relative orientations of the animaland the closest vessel of approach. Chronic exposureto these disrupting activities can result in displace-ment from prime habitat or to tolerance of the activityin order to remain in the habitat (Bejder et al. 2009).
The absence of a detectable behavioural responseto the seismic survey could have been the result of aneffective mitigation and monitoring plan (Bröker etal. 2015) that limited the whales’ exposure to disturb-ing sound levels. It must also be acknowledged, how-ever, that the power analyses above revealed that thesample sizes in our study were inadequate for detect-ing small or moderate behavioural changes in whalemovement and respiration patterns in response toanthropogenic sounds. Low sample sizes were aresult of a key element of the mitigation strategy, i.e.conducting the seismic survey as early in the seasonas possible to limit the acoustic exposure to a smallernumber of whales and avoid disturbing mother−calfpairs, which tend to be the last group to arrive on thefeeding grounds. Only one mother−calf pair wasobserved during the seismic survey, which suggeststhe early start of the operations was effective in re -ducing exposure of these sensitive individuals at acritical time in their life cycle.
Limitations
In this study we were not concerned with effects onindividuals, but rather population-level impacts. Inother words, one individual’s obvious reaction tosound or vessel proximity would not be of the samerelevance and concern as the more subtle and consis-tent reactions of many individuals. The analytical
68

Gailey et al.: Western gray whale responses to a seismic survey
concern is whether sufficient data were available inrelation to a specific dose of exposure to determinewhether there was or was not a behavioural reaction.
An examination of statistical power is essential toplace results into context. Our power analysis esti-mated that approximately 1200 tracks would be need -ed to identify a 10% change in response variableswith 80% probability using a significance level of5%. With larger effect sizes, such as whales movingat much higher speeds when exposed to increasingsound levels, the sample sizes required to detect theassociations of swim speed with sound are lower.
With a modest sample size of 59 tracks, this studyhad sufficient power to detect large effects, such as achanges in gray whale speed greater than 50% oftheir ‘normal’ speed, but the study was more limitedin its power to detect moderate to subtle shifts inmovement and respiration. During a seismic surveyconducted in the same region in 2001, several move-ment and respiration responses were found to be significantly associated with higher received soundlevels (Gailey et al. 2007a). Due to the longer dura-tion and timing of that seismic survey, combined witha different analytical approach (see below), the sample sizes yielded approximately 500 bins for vari-ables of movement and 240 bins for respiration.Consequent ly, Gailey et al. (2007a) had more statisti-cal power and thus higher probability of detectingmoderate changes in gray whale behaviour due tosound exposure from the 2001 seismic survey. Gaileyet al. (2007a), however, used each bin as the sam-pling unit rather than weighting the bins to the indi-vidual as done here. Arguably this could have biasedthe results of the earlier study towards individualresponses or, alternatively, provided greater statisti-cal power to detect population-level responses.
The mitigation measures adopted during the 2010seismic survey were designed to minimize the dura-tion of the survey, to complete it as early in the feed-ing season as feasible and minimize sound levels towhich the whales would be exposed. The strategyarguably resulted in fewer whales being exposed.However, by limiting the sample size of observations,it also limited the power of this study to assess theanimals’ behavioural responsiveness to pulse sounds.With such limited sample sizes, it is difficult to test anull hypothesis of no impact.
Given the low sample size, a more successful ap -proach might be to develop alternative hypotheseswhich do not assume no impact but rather assume animpact of a specified effect size for a particular para -meter. Under certain assumptions, one could testwhether seismic survey activity had an effect on
speed, for example, to obtain a more sensitive indica-tor of impact given the limitations of sample size. It isdifficult, however, to make inferences on the effect ofa single parameter such as speed (or orientation ordive time), which would allow a suitable hypothesisto be developed to implement such an alternative ap -proach. Therefore, in the absence of a clear alterna-tive approach, we chose to test only the null hypo -thesis of no impact whilst recognizing its limitationsin this case with respect to detecting small or moder-ate effects if they were present.
We also highlight that individual responses wereobserved in conjunction with other factors such asdirection of the sound source relative to the whale’sposition combined with increasing sound exposurelevels. Such observations could contribute to under-standing behavioural reactions to sound and/or ves-sel activity, but they were not considered explicitly inthe analyses of this study. In addition, ‘natural’ fac-tors that have been observed to influence gray whalebehaviour in previous studies (Gailey et al. 2007b,2010) were not found in this study to be significantlyassociated with behaviour variables; this could be aresult of the limited sample sizes. Larger samplesmight have yielded a greater understanding of boththe ‘natural’ (undisturbed) behaviour of the whalesand the anthropogenic factors that may affect them.
Acknowledgements. We acknowledge Doug Bell, Judy Muirand Bernd Würsig for assisting in various phases of thisstudy. We are grateful for the long hours and dedicated ef -fort of the behavioural assistants Andrei Ermoshin, AlexeiFilipiechev, Alexander Kalachev, Denis Kovshov, Ivan Kru -pin and Sarah Piwetz. Peter vanderWolf, Roman Larin andIgor Zhmaev provided excellent logistical assistance in thefield. We also appreciate the valuable contributions of theSeismic Survey Task Force and the Western Gray WhaleAdvisory Panel (WGWAP) towards the development of themitigation and monitoring measures employed during theseismic survey. IUCN has also been instrumental in provid-ing a platform for scientists and industry to collaborate onissues surrounding the conservation of the western graywhale population. We thank the staff at LGL (Sidney, BC),JASCO Applied Sciences (Canada) and WEST for all theirsupport throughout this project. We also thank the 4 anony-mous reviewers for their suggestions and improvements ofthe manuscript. Finally, we thank Sakhalin Energy Invest-ment Company for financial support.
LITERATURE CITED
Altmann J (1974) Observational study of behaviour: sam-pling methods. Behaviour 49: 227−267
Baillie JEM, Hilton-Taylor C, Stuart SN (2004) 2004 IUCNRed List of Threatened Species: a global species assess-ment. IUCN, Gland
Beale CM (2007) The behavioral ecology of disturbanceresponses. J Comp Psychol 20: 111−120
69
Endang Species Res 30: 53–71, 2016
Beale CM, Monaghan P (2004) Behavioural responses tohuman disturbance: a matter of choice? Anim Behav 68: 1065−1069
Bejder L, Samuels A, Whitehead H, Finn H, Allen S (2009)Impact assessment research: use and misuse of habitua-tion, sensitisation and tolerance in describing wildliferesponses to anthropogenic stimuli. Mar Ecol Prog Ser395: 177−185
Bogoslovskaya LS, Votrogov LM, Semenova TN (1981)Feeding habits of the gray whale off Chukotka. Rep IntWhal Comm 31:507–510
Borisov SV, Kovzel DG, Rutenk AN, Ushchipovskii VG(2008) A self-contained hydroacoustic station with radiochannel for acoustic measurements on the shelf. InstrumExp Tech 51: 762−767
Bröker K, Gailey G, Muir J, Racca R (2015) Monitoring andimpact mitigation during a 4D seismic survey near a pop-ulation of gray whales off Sakhalin Island, Russia.Endang Species Res 28: 187−208
Bryant PJ, Lafferty CM, Lafferty SK (1984) Reoccupation ofGuerrero Negro, Baja California, Mexico, by graywhales. In: Jones ML, Swartz SL, Leatherwood, S (eds)The gray whale, Eschrichtius robustus. Academic Press,Orlando, FL, p 375−387
Cain ML (1989) The analysis of angular data in ecologicalfield studies. Ecology(70):1540–1543
Clapham PJ, Baker CS (2002) Modern whaling. In: PerrinWF, Würsig B, Thewissen JGM (eds) Encyclopedia ofmarine mammals, 2nd edn. Academic Press, San Diego,CA, p 1328−1332
Cooke JG, Weller DW, Bradford AL, Sychenko O, Burdin AM,Brownell RL Jr (2013) Population assessment of Sakhalingray whale aggregation. Paper SC/65a/BRG27 presentedto the IWC Scientific Committee, Jeju, Korea. https://swfsc.noaa.gov/publications/CR/2013/2013Cooke.pdf
Dolphin WF (1987) Ventilation and dive patterns of hump-back whales, Megaptera novaeangliae, on their Alaskanfeeding grounds. Can J Zool 65:83–90
Dunlop RA, Noad MJ, Cato DH, Kniest E, Miller PJ, SmithJN, Stokes MD (2013) Multivariate analysis of behav-ioural response experiments in humpback whales(Megaptera novaeangliae). J Exp Biol 216: 759−770
Ellison WT, Southall BL, Clark CW, Frankel AS (2012) Anew context-based approach to assess marine mammalbehavioral responses to anthropogenic sounds. ConservBiol 26: 21−28
Fadeev VI (2010) Benthos studies in feeding grounds of theOkhotsk-Korean gray whale population in 2009. Reportto the Western Gray Whale Advisory Panel, RussianAcademy of Sciences, Vladivostok
Gailey G, Ortega-Ortiz J (2002) A note on a computer-basedsystem for theodolite tracking of cetaceans. J CetaceanRes Manag 4: 213−218
Gailey G, Würsig B, McDonald T (2007a) Abundance, be -havior, and movement patterns of western gray whalesin relation to a 3-D seismic survey, northeast SakhalinIsland, Russia. Environ Monit Assess 134: 75−91
Gailey G, McDonald T, Racca R, Sychenko O, Rutenko A,Würsig B (2007b) Influences of underwater sound andnearshore vessel activity on western gray whale behav-ior during the installation of a concrete gravity basedstructure off Sakhalin Island, summer 2005. Prepared forExxon-Neftegas Ltd. and Sakhalin Energy Investment Company, Yuzhno-Sakhalinsk. http://cmsdata.iucn.org/downloads/wgwap_2_inf_7___mva.pdf
Gailey G, McDonald T, Racca R, Sychenko O and others (2010)Western gray whale movement, respiration, and abun-dance during pipeline construction off Sakhalin Island,Russia. Prepared for Exxon-Neftegas Ltd. and SakhalinEnergy Investment Company, Yuzhno-Sakhalinsk
Guerrero JA (1989) Feeding behavior of gray whales in rela-tion to patch dynamics of their benthic prey. MSc thesis,San Jose State University, San Jose, CA
Hawkinson CA (1992) Feeding ecology of gray whales inAgate Bay, California, summers 1990 and 1991. MSc thesis, San Jose State University, San Jose, CA
Horvitz DG, Thompson DJ (1952) A generalization of sam-pling without replacement from a finite universe. J AmStat Assoc 47: 663−685
IWC (International Whaling Commission) (2015) Report ofthe workshop on the rangewide review of the populationstructure and status of North Pacific gray whales. J Ceta -cean Res Manag 16(suppl): 489−528
Jahoda MC, Lafortuna C, Biasson N, Almirante C and oth-ers (2003) Mediterranean fin whale’s (Balaenopteraphysalus) response to small vessels and biopsy samplingassessed through passive tracking and timing of respira-tion. Mar Mamm Sci 19:96–110
Johnson SR, Richardson WJ, Yazvenko SB, Blokhin SA andothers (2007) A western gray whale mitigation and mon-itoring program for a 3-D seismic survey, Sakhalin Is -land, Russia. Environ Monit Assess 134: 1−19
Jones ML, Swartz SL (2009) Gray whale Eschrichtius robus-tus. In: Perrin WF, Würsig B, Thewissen JGM (eds) Ency-clopedia of marine mammals, 2nd edn. Academic Press,San Diego, CA, p 503−511
Kovzel DG, Rutenko AN (2009) A self-contained acousticstation with a digital radiotelemetry channel for monitor-ing seismic acoustic signals on the shelf. Instrum ExpTech 52: 857−861
Laake JL, Punt AE, Hobbs R, Ferguson M, Rugh D, BreiwickJ (2012) Gray whale southbound migration surveys 1967-2006: an integrated re-analysis. J Cetacean Res Manag12: 287−306
Ljungblad DK, Würsig B, Swartz SL, Keene JM (1988)Observations of the behavioral responses of bowheadwhales (Balaena mysticetus) to active geophysical ves-sels in the Alaskan Beaufort Sea. Arctic 41:183–194
Mallonee JS (1991) Behaviour of gray whales (Eschrichtiusrobustus) summering off the northern California coast,from Patrick’s Point to Crescent City. Can J Zool 69: 681−690
Malme CI, Würsig B, Bird JE, Tyack P (1986) Behavioralresponses of gray whales to industrial noise: feedingobservations and predictive modeling. Outer Continen-tal Shelf Environmental Assessment Program, final re -port of principal investigators. NOAA No. PB-88-249057/XAB. BBN Labs, Cambridge, MA
Malme CI, Würsig B, Bird JE, Tyack P (1988) Observationsof feeding gray whale responses to controlled industrialnoise exposure. In: Sackinger WM, Jefferies MO, ImmJL, Treacy SD (eds) Port and ocean engineering underArctic conditions, Vol 2. University of Alaska, Fairbanks,AK, p 55−73
Martin B, Bateson P (1993) Measuring behaviour: an intro-ductory guide, 2nd edn. Cambridge University Press,Cambridge
Nowacek DP, Thorne LH, Johnston DW, Tyack PL (2007)Responses of cetaceans to anthropogenic noise. MammalRev 37: 81−115
70

Gailey et al.: Western gray whale responses to a seismic survey
Nowacek DP, Bröker K, Donovan G, Gailey G and others(2013) Responsible practices for minimizing and monitor-ing environmental impacts of marine seismic surveyswith an emphasis on marine mammals. Aquat Mamm 39: 356−377
Overton WS, Stehman SV (1995) The Horvitz-Thompsontheorem as a unifying perspective for probability sam-pling: with examples from natural resource sampling.Am Stat 49: 261−268
Pinheiro JC, Bates DM (2000) Mixed-e ects models in S andS-PLUS. Springer-Verlag, New York, NY
Punt AE, Wade PR (2012) Population status of the easternNorth Pacific stock of gray whales in 2009. J CetaceanRes Manag 12: 15−28
R Development Core Team (2010) R: a language and envi-ronment for statistical computing. R Foundation for Sta-tistical Computing, Vienna
Racca R, Austin M, Rutenko A, Bröker K (2015) Monitoringthe western gray whale sound exposure zone and estimating acoustic transmission during a 4-D seismicsurvey, Sakhalin Island, Russia. Endang Species Res 29:131–146
Red Book of the Russian Federation (2000) Red data book ofthe Russian Federation: animals. AST & Astrel Publish-ers, Moscow
Richardson WJ, Malme CI (1993) Man-made noise and be -havioral responses. In: Burns JJ, Montague JJ, CowlesCJ (eds) The bowhead whale. Society for Marine Mam-malogy Spec Publ 2:631–700
Richardson WJ, Würsig B (1995) Significance of responsesand noise impacts. In: Richardson WJ, Greene CR,Thomson DH (eds) Marine mammals and noise. Aca-demic Press, San Diego, CA, p 387–424
Richardson WJ, Fraker MA, Würsig B, Wells RS (1985) Be -haviour of bowhead whales Balaena mysticetus summer-ing in the Beaufort Sea: reactions to industrial activities.Biol Conserv 32:195–230
Richardson WJ, Würsig B, Greene CR Jr (1986) Reactions ofbowhead whales, Balaena mysticetus, to seismic explo-ration in the Canadian Beaufort Sea. J Acoust Soc Am 79:1117–1128
Robertson FC, Koski WR, Thomas TA, Richardson WJ, Wür-sig B, Trites AW (2013) Seismic operations have variableeffects on dive-cycle behavior of bowhead whales in theBeaufort Sea. Endang Species Res 21: 143−160
Rugh DJ, Hobbs RC, Lerczak JA, Breiwick JM (2005) Esti-mates of abundance of the eastern North Pacific stock ofgray whales (Eschrichtius robustus) 1997–2002. J Ceta -cean Res Manag 7: 1−12
Rutenko AN, Borovoi DI, Gritsenko VA, Petrov PS, Ushchi -povskii VG, Boekholt M (2012) Monitoring the acousticfield of seismic survey pulses in the near-coastal zone.Acoust Phys 58: 326−338
SEIC (Sakhalin Energy Investment Company) (2005) Marinemammal protection plan: a framework for mitigation andmonitoring related to Sakhalin Energy oil and gas opera-tions, Sakhalin Island, Russia. Sakhalin Energy Invest-ment Company, Yuzhno-Sakhalinsk http: //cmsdata. iucn.org/downloads/wgwap_7_doc_24_marine_mammal_protection_plan.pdf
SEIC (Sakhalin Energy Investment Company) (2006) Marinemammal protection plan: a framework for mitigation andmonitoring related to Sakhalin Energy oil and gas opera-tions, Sakhalin Island, Russia. Sakhalin Energy Invest-ment Company, Yuzhno-Sakhalinsk
SEIC (2007) (Sakhalin Energy Investment Company) Marine
mammal protection plan: a framework for mitigation andmonitoring related to Sakhalin Energy oil and gas operations, Sakhalin Island, Russia. Sakhalin Energy In -vestment Company, Yuzhno-Sakhalinsk. www.sakhalinenergy.com/en/documents/Marine_Mammal_Protection_Plan_eng.pdf
Southall BL, Bowles AE, Ellison WT, Finneran JJ and others(2007) Marine mammal noise exposure criteria: initialscientific recommendations. Aquat Mamm 33: 411−522
SSTF (Seismic Survey Task Force) (2007−2011) Seismic Survey Task Force reports 1−7 to the Western GrayWhale Advisory Panel. http: //iucn.org/wgwap/wgwap/task_ forces/ seismic_survey_task_force/
Stelle LL, Megill WM, Kinzel MR (2008) Activity budget anddiving behavior of gray whales (Eschrichtius robustus)in feeding grounds off coastal British Columbia. MarMamm Sci 24: 462−478
Swartz SL, Jones ML (1979) The evaluation of human activ-ities on gray whales, Eschrichtius robustus, in LagunaSan Ignacio, Baja California, Mexico. Final report to USMarine Mammal Commission, Bethesda, MD
Turchin P (1998) Quantitative analysis of movement. Sin-auer Associates, Sunderland, MA
Tyack PL, Clark CW (1998) Playback of low-frequency soundto gray whales migrating past the central California coast- January, 1998. Quick look report phase II: playbacks tomigrating gray whales. Woods Hole OceanographicInstitution, Woods Hole, MA
Weller DW, Würsig B, Bradford AL, Burdin AM and others(1999) Gray whales (Eschrichtius robustus) off SakhalinIsland, Russia: seasonal and annual occurrence patterns.Mar Mamm Sci 15:1208–1227
Weller DW, Ivashchenko YV, Tsidulko GA, Burdin AM,Brownell RL Jr (2002) Influence of seismic surveys onwestern gray whales off Sakhalin Island, Russia in 2001.Paper SC/54/BRG14 presented to the IWC ScientificCommittee, Shimonoseki. http:// digitalcommons. unl.edu/cgi/viewcontent.cgi?article=1064&context=usdeptcommercepub
Weller DW, Rickards SH, Bradford AM, Burdin AM, Brow -nell RL Jr (2005) The influence of 1997 seismic surveyson the behaviour of western gray whales off SakhalinIsland, Russia. Paper SC/58/E4 presented to the IWC Scientific Committee, Cambridge
Würsig B, Wells RS, Croll DA (1986) Behavior of gray whalessummering near St. Lawrence Island, Bering Sea. Can JZool 64: 611−621
Würsig B, Cipriano F, Würsig M (1991) Dolphin movementpatterns: information from radio and theodolite trackingstudies. In: Pryor K, Norris KS (eds) Dolphin societies: discoveries and puzzles. University of California Press,Los Angeles, CA p 79−112
Würsig B, Gailey G, McDonald T, Nielson R and others(2002) Western gray whale occurrence patterns andbehavior: shore-based observations off Sakhalin Island,August-September 2001. Prepared for Exxon-NeftegasLtd. and Sakhalin Energy Investment Company, Yuzhno-Sakhalinsk
Yazvenko SB, McDonald TL, Blokhin SA, Johnson SR andothers (2007a) Distribution of western gray whales dur-ing a seismic survey near Sakhalin Island, Russia. Envi-ron Monit Assess 134: 45−73
Yazvenko SB, McDonald TL, Blokhin SA, Johnson SR andothers (2007b) Feeding of western gray whales during aseismic survey near Sakhalin Island, Russia. EnvironMonit Assess 134:93−106
71
Editorial responsibility: Randall Reeves, Hudson, Quebec,Canada; Greg Donovan, Cambridge, UK
Submitted: January 3, 2014; Accepted: November 18, 2015Proofs received from author(s): February 15, 2016
➤
➤
➤
➤
➤
➤➤
➤