behavioral management patterns: small firms’ recipe for growth · and regression tree (cart)...
TRANSCRIPT

KEY INSIGHTS
1. Risk taking, delegating, and goal setting are influential behavioral management patterns in predicting rates of business growth and productivity for MSEs in Latin America. 2. Relationships between behavioral management patterns and business outcomes are non-linear. These features exhibit dependency on each other.
3. The findings suggest that there are optimal levels for each of the behavioral patterns and that the behavioral patterns interact in different ways that can lead to different formulas for business growth.
By: Fadi Abou Chacra and Joshua Rocha Advisors: Dr. Josué C. Velázquez-Martínez and Dr. Cansu Tayaksi Summary: This research explores the potential associations between behavioral management patterns and business growth and productivity in micro and small enterprises (MSEs) in Latin America. We observe that risk taking, delegating, and goal setting are all influential predictive features for business growth and productivity. We also observe evidence that suggests that the willingness to adopt new technologies and processes as a behavioral management pattern has little predictive contribution to business growth and productivity.
Prior to MIT, Fadi worked as a Regional Senior Inventory Control Specialist at Azadea Group Holding for 7 years. He received his Master of Business Administration from the Lebanese American University.
Prior to MIT, Joshua worked as a Supply Chain Manager at Walker Edison Furniture for 2 years. He received his Bachelor of Science in Finance and Project Management from University of Phoenix.
Introduction More than 99% of the companies in the world are micro, small, or medium size enterprises and account for ~70% of the jobs on average in OECD countries. However, due to a lack of productivity (Figure 1), among other factors, only a fraction of them survives and develops into high-growth firms. The purpose of this study is to explore and identify which behavioral management patterns may contribute to the growth and productivity of micro and small enterprises in Latin America. Abiding by the OECD definition, we define MSEs as firms with no more than 50 employees.
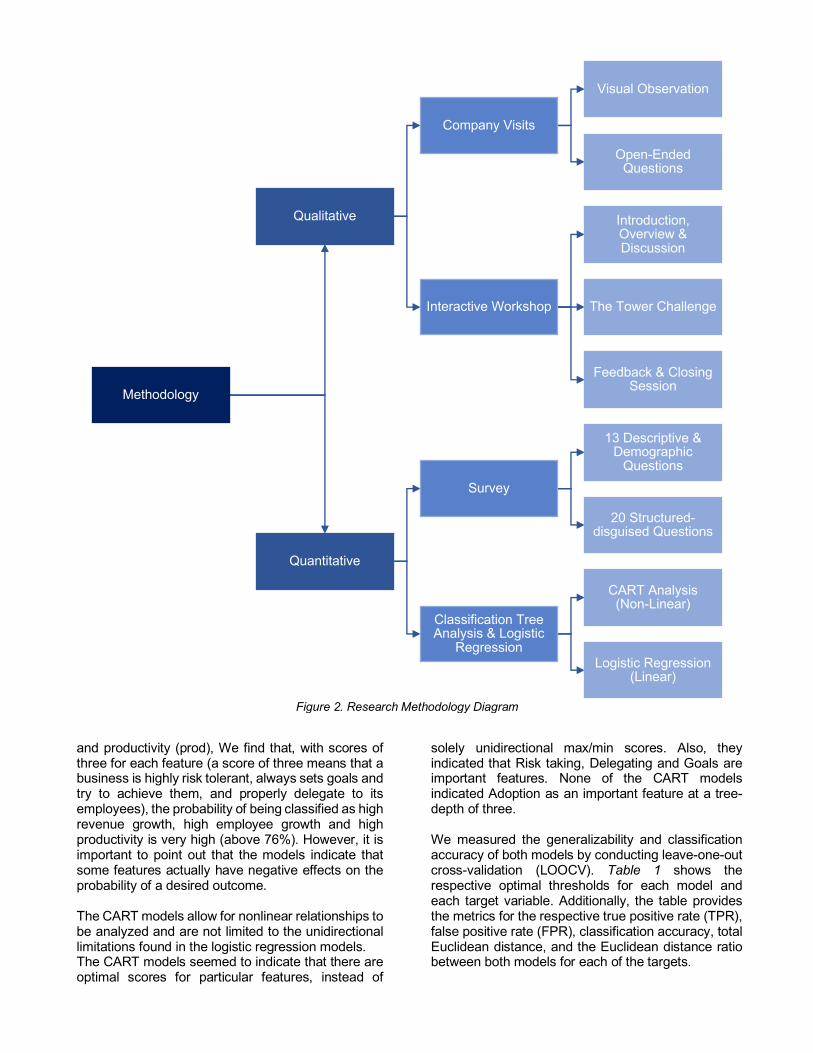
In an ever-changing marketplace, organizational growth and productivity improvements are key for a firm’s survival. To this end, we focus our research on four key behavioral management patterns; 1. Risk taking, 2. Goal setting, and one’s belief in their innate ability to achieve goals, 3. Delegation of tasks to employees, and 4. The willingness to adopt new processes and technologies. We measure growth by analyzing sales revenues and employee counts in 2018 compared to 2016. As for productivity, we measure it by taking a ratio of annual sales revenues divided by employee count for each of the three years (i.e., 2018, 2017, and 2016). Our research is performed in conjunction with the MIT GeneSys project – a research initiative started in 2016 that focuses on contributing to small business growth in the developing countries by improving supply chain management and business expertise. Data and Methodology To properly evaluate behavioral management patterns and business performance, our research methodology combines both qualitative and quantitative methodologies. There are two qualitative methodologies: 1. Company visits and 2. Interactive workshops. There are two quantitative methodologies: 1. Structured-disguised survey and 2. Classification and Regression Tree (CART) Analysis as well as Logistic Regression Analysis. Figure 2 provides a visual depiction of the research methodology.
Behavioral Management Patterns: Small Firms’ Recipe for Growth
Topic Areas: Strategy, Metrics, Resilience

To obtain a better understanding of the day-to-day operations and challenges that MSEs face, we visited three companies in Guadalajara, Mexico. In addition, we also conducted a workshop in Guadalajara, Mexico, with the participation of 25 MSE owners. The workshop was organized with the following three segments: 1. an introduction and overview about the MIT GeneSys project, and a discussion about the current status of MSEs in Latin America; 2. an interactive activity that we have named “The Tower Challenge” (adapted from the Marshmallow Challenge created by Skillman and widely used by Wujec); and 3. an interactive, reflective group discussion where participants are encouraged to share their personal insights and observations. The Tower Challenge acts as a medium for us to observe how the participants actually behave when faced with business decisions similar to those in real life. We also apply quantitative methodologies through the administration of a survey in Mexico and Colombia. This survey allows us to explore the behavioral management patterns from the internal perspective of the participant, rather than relying solely on our external observations in the research. The survey consists of 33 questions, of which the first 13 questions are descriptive and demographic in nature. The last 20 questions are structured-disguised questions and consist of five questions for each of the four behavioral management patterns. The structured-disguised questions are written such that the available choices are phrased in a positive reference, in an effort to avoid loaded, leading, or biased statements In total, we received 31 completed surveys. To analyze these survey results, we utilized logistic regression analysis (log) as well as classification and
regression tree (CART) analysis to identify the possible relationships in the data. We first used logistic regression to identify if the relationships are linear in nature. We then challenged the assumption of linearity through CART analysis which allowed us to observe potential non-linear relationships in the data. We then compared both of these methods in terms of model prediction accuracy, model strength, and model generalizability. Results and Findings Of the 31 survey participants, 13 participants were female, and 18 participants were male. The most common industries were retail, manufacturing, and wholesale trade. The great majority of participants was located in Mexico (29), with two participants located in Colombia. All of the qualitative observations were conducted in the Guadalajara, Mexico, region in February 2019. The Tower Challenge was conducted at the workshop with 25 MSE owners from the Guadalajara region. We find that having the tallest tower overall does not guarantee a winning position. Also, we find that there is somewhat of an inverse relationship between the amount of supplies purchased and the final cash on-hand amount. Risk taking played a large role in many decisions for the participants in the challenge is also a major factor for their business. We visited three companies in the Guadalajara region, all of whom had attended the workshop the previous day. The observations from these visits reinforced the participant’s output scores from survey responses. After applying logistic regression linear models for each of revenue growth (rev), employee growth (emp)
Figure 1. The productivity of micro and small vs medium firms (Source: OECD-ECLAC)
and productivity (prod), We find that, with scores of three for each feature (a score of three means that a business is highly risk tolerant, always sets goals and try to achieve them, and properly delegate to its employees), the probability of being classified as high revenue growth, high employee growth and high productivity is very high (above 76%). However, it is important to point out that the models indicate that some features actually have negative effects on the probability of a desired outcome. The CART models allow for nonlinear relationships to be analyzed and are not limited to the unidirectional limitations found in the logistic regression models. The CART models seemed to indicate that there are optimal scores for particular features, instead of
solely unidirectional max/min scores. Also, they indicated that Risk taking, Delegating and Goals are important features. None of the CART models indicated Adoption as an important feature at a tree-depth of three. We measured the generalizability and classification accuracy of both models by conducting leave-one-out cross-validation (LOOCV). Table 1 shows the respective optimal thresholds for each model and each target variable. Additionally, the table provides the metrics for the respective true positive rate (TPR), false positive rate (FPR), classification accuracy, total Euclidean distance, and the Euclidean distance ratio between both models for each of the targets.
Methodology
Qualitative
Company Visits
Visual Observation
Open-Ended Questions
Interactive Workshop
Introduction,Overview &Discussion
The Tower Challenge
Feedback & Closing Session
Quantitative
Survey
13 Descriptive & Demographic
Questions
20 Structured-disguised Questions
Classification Tree Analysis & Logistic
Regression
CART Analysis(Non-Linear)
Logistic Regression (Linear)
Figure 2. Research Methodology Diagram

Each model has pros and cons, but overall, the CART model seems to perform slightly better in terms of out-of-sample accuracy. Discussion Risk taking seems to be the strongest predictive feature for these business outcomes overall as it is listed in the first and second levels of both of the decision trees for growth and also has strong coefficients in the same logistic regression models. Delegation and Goals are also moderately strong predictive features found in the first, second, and third levels of the decision trees. The adoption of new technologies/processes is the only feature that does not seem to have a meaningful impact in the predictive models. These quantitative results also reinforce our qualitative observations that we found in the field.
Conclusion The key implications of our findings are that risk taking, delegating, and goals are influential behavioral management patterns in predicting rates of business growth and productivity for MSEs in Latin America. Further, these factors are best represented in the context of non-linear models that can account for dynamic feature interactions and moderation. Additionally, the non-linear model shows that managers with moderate levels of risk tolerance have an increased probability of business growth compared to those who exhibit risk levels outside of the optimal bounds. We also find that one’s willingness to adopt new technologies/processes as a behavioral management pattern has insignificant predictive contribution for business growth and productivity.
Table 1. Euclidean distance optimization output metrics
Optimal Threshold FPR (x) TPR (y) Classification
Accuracy Euclidean Distance LOG/CART %
Rev Log 0.5839 0.3750 0.3333 0.4839 0.7649 Rev CART 0.6000 0.5000 0.6667 0.5806 0.6009 27.29% Emp Log 0.4633 0.3125 0.8000 0.7419 0.3710 Emp CART 0.3039 0.3750 0.7333 0.6774 0.4601 -19.37% Prod Log 0.5175 0.3125 0.4667 0.5806 0.7003 Prod CART 0.0328 0.6875 0.8667 0.5806 0.6181 13.29%