regression analysis
TRANSCRIPT

Regression and correlation analysisProf. Amany R.Abo-El-Seoud
Community Medicine ,Zagazig University,EGYPT

The term regression analysis refers to the methods used to estimate the values of a variable from a knowledge of the values of another variable
Regression
Regression and correlation analysis
correlation analysis refers to the methods used to measure the strength of the association (correlation) among these variables. Our study here will concentrate on the relationship between two variables only.
Correlation analysis

Regression analysis is classified into many types according to the type of relationship between the two variables such as:
linear,
exponential,
logarithmic and
power regression analysis.
In the next paragraphs will concentrate on the linear regression analysis, which is our objective.
The term linear means that an equation of a straight line is used to describe the relationship between the two variables i. e. the relationship between the two variables is represented by a straight line, which is usually called the regression line.
Linear regression analysis:
Regression and correlation analysis

In studying the relationship between two variables it is advisable to plot the data on a graph as a first step. This allows visual examination of the extent of association between the variables.
The chart used for this purpose is known as a scatter diagram which is a graph on which each plotted points represents an observed pair of values of the dependent (Y) and independent (X) variables.
Scatter diagram:
Regression and correlation analysis
0 1 2 3 4 5 6 70
1
2
3
4
5
6
7
Dose (mg/kg)
Nu
mb
er o
f d
ead
an
imal
s

The relationship between the two variables X and Y should be represented by a straight line that is the regression line. The regression line is the best or the ideal line or its equation which represents a scatter diagram which may describe a possible correlation between two variable.
The equation of the linear regression line is calculated by the following equation: Y = aX + b
Where Y is the dependent variable, X is the independent variable, a is the slope of the linear regression line and b is the intercept of the regression line with the Y-axis.
the values of a and b of the equation of straight line can be calculated:
Regression Equation:
Regression and correlation analysis
X Y - N XY a =
(X)2 - N X2
X XY - X2 Y b =
(X)2 - N X2

Example:
The relationship between the toxic dose of a drug in mg/kg and number of dead animals induced by its toxic effects was plotted diagramatically using the X-axis for the dose of the drug and the Y-axis for the number of dead animals. The following relationship was obtained:
Dose (mg/kg) Number of dead animals
(X) (out of six: Y)
3 0
4 1
5 2
6 4
7 5
8 6
Calculate the equation of the linear regression line?

Example:Solution: X Y X2 XY
345678
012456
91625364964
04
10243548
X = 33 Y = 18 X2 = 199 XY = 121
X Y - N XY (33 X 18) - 6 X 121 a = = = 1.886
(X)2 - N X2 (33)2 - (6 X 199)
X XY - X Y (33 X 121) - (199 X 18) b = = = - 3.89
(X)2 - N X2 (33 )2 - (6 X 199)The equation is Y = 1.886X - 3.89
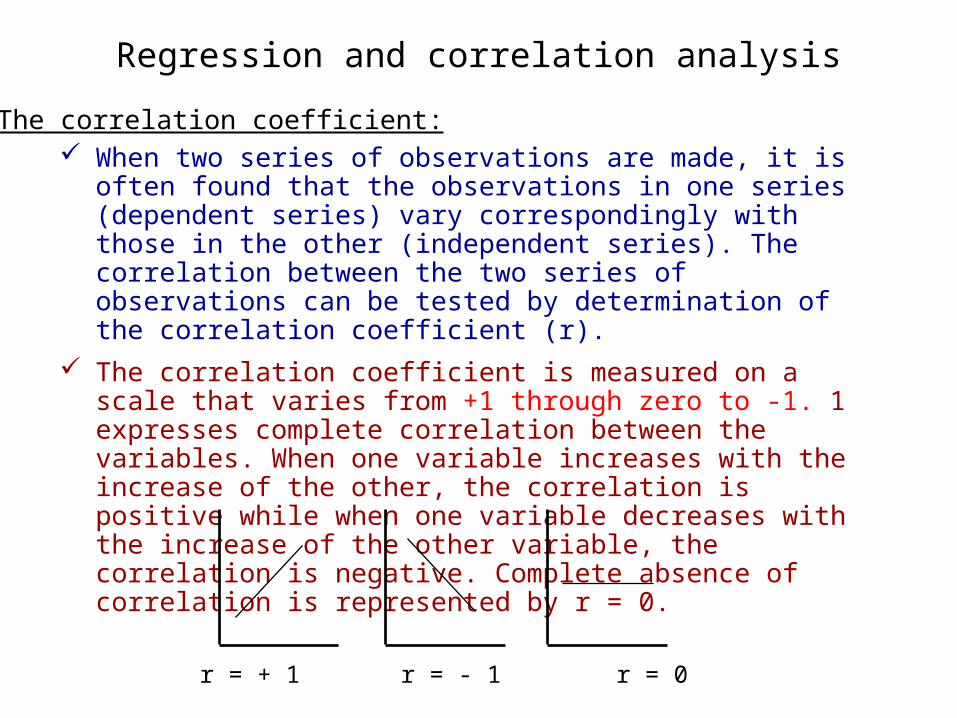
When two series of observations are made, it is often found that the observations in one series (dependent series) vary correspondingly with those in the other (independent series). The correlation between the two series of observations can be tested by determination of the correlation coefficient (r).
The correlation coefficient is measured on a scale that varies from +1 through zero to -1. 1 expresses complete correlation between the variables. When one variable increases with the increase of the other, the correlation is positive while when one variable decreases with the increase of the other variable, the correlation is negative. Complete absence of correlation is represented by r = 0.
The correlation coefficient:
Regression and correlation analysis
r = + 1 r = - 1 r = 0

The significance of the correlation between two variables can be tested by comparing the value of t calculated according to the following formula:
The correlation coefficient equation:
Regression and correlation analysis
_ _ ( X - X ) ( Y - Y ) (dx . dy)r = =
_ _ (X - X)2. (Y - Y)2 dx
2 . dy2
n-2t = r
1-r2

Example:
From the previous example mentioned in regression line , calculate the correlation coefficient and test the significance of the correlation ? ( t = 2.57 at P<0.05 & D. F. = 5 ) .
Regression and correlation analysis

Solution:
The value of the calculated t is higher than that of the tabulated t , therefore there is a positive significant correlation between the dose of the drug and its toxic effect
X dx dx2 Y dy dy
2 dx . dy
345678
-2.5-1.5-0.5+0.5+1.5+2.5
6.252.250.250.252.256.25
012456
-3-2-1+1+2+3
941149
+7.5+3.0+0.5+0.5+3.0+7.5
(dx . dy) 22 r = = = 0.994
dx2 . dy
2 17.5 X 25
n-2 6 - 2 t = r = 0.994 = 18.15
1-r2 1 - (0.994)2
Regression and correlation analysis

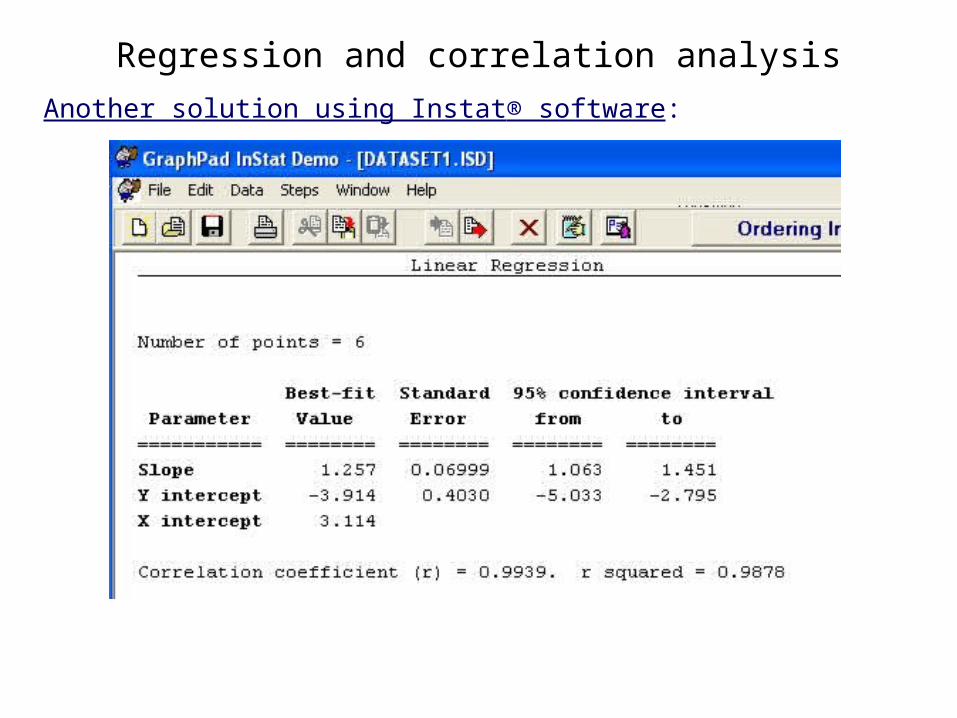
Another solution using Instat® software:
Regression and correlation analysis

Another solution using Instat® software:
Regression and correlation analysis

Another solution using Instat® software:
Regression and correlation analysis
Another solution using Instat® software:
Regression and correlation analysis

Another solution using Instat® software:
Regression and correlation analysis

Another solution using Instat® software:
Regression and correlation analysis

Example:
The dose response curve of a new antihypertensive agent was performed using five rats, the following results were obtained:
Dose ( mg/kg ): 2 4 6 8 10
Decrease in B. P.(mmHg): 15 20 25 30 35
A) Find the equation of the linear regression line?
B) Calculate the correlation coefficient?

Example:Solution: X Y X2 XY
2468
10
1520253035
4166484
100
3080
150240350
X = 30 Y = 125 X2 = 268 XY = 850
X Y - N XY (30 X 125) - 5 X 850 a = = = 1.134
(X)2 - N X2 (30)2 - (5 X 268)
X XY - X Y (30X 850) - (30 X 125) b = = = - 49.4
(X)2 - N X2 (30 )2 - (5 X 268)
The equation is Y = 1.134X – 49.4