behavior of multistage mixer-settler extraction...
TRANSCRIPT

1Behavior of Multistage Mixer-settler Extraction ColumnMemoirs of the School of Engineering, Nagoya UniversityVol.51, No.1 (1999)
BEHAVIOR OF MULTISTAGE MIXER-SETTLEREXTRACTION COLUMN
Katsuroku TAKAHASHI and Susumu NII
Department of Chemical Engineering
(Received May 31, 1999)
Abstract
A counter-current multistage extraction column having high performance (i.e.,high extraction efficiency and large maximum throughput) has been developed. Thehydrodynamic behavior and the mass transfer characteristics of the column were ana-lyzed experimentally. Each stage of the column consists of lower mixer part, uppersettler part and a drop coalescer between them. Both of the continuous and the dis-persed phases rise from the mixer into the settler and are seperated into two phaseswithin the settler. The continuous phase goes down to the lower stage mixer throughthe downspout pipes and the dispersed phase rises to the upper stage mixer throughthe riser pipes. The maximum throughput in the column is independent of the dropsize because the counter-current flow in the dispersion situation is avoided. Thenthe column can be operated at a strong agitation where the extraction efficiency ishigh due to large interfacial area with small drops. As the hydrodynamic behavior,the maximum throughput, the holdup of dispersed phase and the drop size were ex-amined. The maximum throughput can be determined from the balance betweenthe pressure drop within the downspout and the sum of the suction pressure inducedby the impeller and the buoyant force of dispersed phase. The holdup of the dis-persed phase in the mixer is given by a model of dispersed phase leaving the mixer,including the diffusional flow of dispersed phase. The drop size in the mixer de-pends on the residence time of the dispersed phase as well as the Weber number.The mass transfer characteristics can be expressed by a rigid sphere model of dropbecause the drop diameter is small at a strong agitation in the mixer. A theoreticalmodel of diffusion within a rigid sphere gives the mass transfer coefficient in thedispersed phase, and the correlation by Ranz-Marshall for the mass transfer arounda rigid sphere gives the mass transfer coefficient in the continuous phase. The ex-traction of copper with the five-stage mixer settler extraction column was representedby the calculation with the above hydrodynamic and mass transfer characteristics aswell as the extraction reaction rate at the interface.
1

2 K. Takahashi and S. NII
Keywords: extraction, extraction column, maximum throughput, holdup, dropsize, mass transfer coefficients
Contents
1. Introduction .......................................................................................................................................... 3
2. Mixer-Settler Extraction Column ....................................................................................................... 4
3. Maximum Throughput in MS Column .............................................................................................. 53.1 Experimental .................................................................................................................................... 53.2 Results and Discussion ..................................................................................................................... 6
3.2.1 Throughput ........................................................................................................................... 63.2.2 Pressure differences .............................................................................................................. 83.2.3 Estimation of throughput ...................................................................................................... 9
4. Dispersed Phase Holdup within Mixer of MS Column..................................................................... 104.1 Experimental .................................................................................................................................... 114.2 Results and Discussion ..................................................................................................................... 11
4.2.1 Dispersed phase holdup in the mixer .................................................................................... 114.2.2 Effects of interfacial tension and density difference ............................................................ 114.2.3 Model for dispersed phase holdup ........................................................................................ 14
5. Drop Size in MS Column..................................................................................................................... 165.1 Experimental .................................................................................................................................... 165.2 Results and Discussion ..................................................................................................................... 17
5.2.1 Sauter mean diameter ........................................................................................................... 175.2.2 Effect of residence time of dispersed phase on drop size ..................................................... 185.2.3 Drop size distribution ........................................................................................................... 19
6. Mass Transfer Coefficients in MS Column........................................................................................ 206.1 Experimental .................................................................................................................................... 206.2 Results and Discussion ..................................................................................................................... 21
6.2.1 Volumetric over-all mass transfer coefficient ....................................................................... 216.2.2 Interfacial area ...................................................................................................................... 236.2.3 Over-all mass transfer coefficient ......................................................................................... 236.2.4 Dispersed phase mass transfer coefficient ............................................................................ 246.2.5 Dispersed phase mass transfer coefficient based on rigid sphere model .............................. 256.2.6 Continuous phase mass transfer coefficient ......................................................................... 28
7. Stage Efficiency in MS Column.......................................................................................................... 307.1 Experimental .................................................................................................................................... 307.2 Results and Discussion ..................................................................................................................... 31
7.2.1 Stage efficiency .................................................................................................................... 317.2.2 Effect of agitation speed, flow rates and distribution ratio on stage efficiency ................... 337.2.3 Estimation of stage efficiency .............................................................................................. 35
8. Extraction of Copper by MS Extraction Column ............................................................................. 388.1 Experimental .................................................................................................................................... 398.2 Results and Discussion ..................................................................................................................... 39
8.2.1 Copper extraction with MS column...................................................................................... 398.2.2 Mass transfer coefficients in FISV ....................................................................................... 408.2.3 Copper extraction rate in FISV ............................................................................................. 418.2.4 Calculation of copper extraction within MS column ............................................................ 42

3Behavior of Multistage Mixer-settler Extraction Column
8.2.5 Specific interfacial area ........................................................................................................ 448.2.6 Mass transfer coefficients within MS column ...................................................................... 468.2.7 Extraction rate with purified extraction ................................................................................ 468.2.8 Simulation for various conditions of extraction column ...................................................... 47
1. Introduction
The counter-current multistage extraction is useful to separate the mixed solution. Amongmany types of the extractor1), the multistage mixer-settler is widely used in industry because itgives a stable operation and high stage efficiency. However, it needs a large space because of thehorizontal arrangement of stages. So, the column type extractor of high performance is desirable.Factors affecting the performance of extraction column are given in Fig.1. A large maximumthroughput and high separation efficiency (stage efficiency) must be achieved to get a compactextraction column, i.e., the column with a small diameter and a small height. The stage efficiencydepends on the interfacial area of dispersed phase and the mass transfer coefficients in the continu-ous and the dispersed phases. The interfacial area increases with the decrease in drop size andwith the increase in holdup of the dispersed phase. The decrease in drop size also makes the dis-persed phase holdup large due to the decrease in relative velocity between the dispersed drop andthe continuous phase. However, for the column where phases flow counter-currently in the dis-persed situation, the flooding follows this decrease in relative velocity, which makes the maximumthroughput small. The column without mechanical agitation, such as the spray column or thepacked column, has large throughput but small interfacial area because of large drop size. Me-chanical agitation, such as in the MIXCO column, RDC column2) or Kuhni column3), makes thestage efficiency high due to the large interfacial area, but the throughput small. Besides, the axial
Fig.1 Factors affecting performance of extraction column

4 K. Takahashi and S. NII
mixing between stages becomes appreciable at a large agitation speed and it makes the stage effi-ciency low. The behavior of the dispersed phase holdup is complex because it depends on the dropsize, the flow rates of both phases and the mixing degree in the mixer4). When drop coalescenceoccurs in the mixer, the drop size is affected by the holdup, which makes the holdup behaviormore complex5). This complex behavior makes the analysis of extraction column difficult becausethe holdup influences the interfacial area as well as the maximum throughput. The stereopartitionbetween stages used in the Sheibel column6,7), EC column8) or SHE column9) suppresses the axialmixing and makes the throughput large by drop coalescence within the partition. The electrostaticdrop coalescence between stages is effective to obtain stable operation under vigorous agitation10).Within the mixer-settler column, the partition is stronger and drops coalesce more completely withinthe settler. The maximum throughput of the mixer-settler column does not depend on the dropsize, i.e., the throughput does not decrease with the agitation speed.
2. Mixer-Settler Extraction Column
Treybal proposed a rectangular mixer-settler tower with the horizontal arrangement of themixer and the settler in each stage, i.e., each stage in the mixer-settler extractor is piled up in verti-cal direction11). The Wirz column has a mixer at the center of the column and a settler around themixer12,13). The MIXET column has vertical arrangement of the mixer and the settler14). Thiscolumn gives high stage efficiency but a small throughput because flow channels of the continu-ous and the dispersed phases are not separated. The asymmetric rotating disc column is a kind ofmixer-settler column15,16).
We proposed a mixer-settler extraction column (MS column)17) shown in Fig. 2. One stage ofthe column consists of a lower mixer part and an upper settler part, and a drop coalescer is setbetween them. The coalescer is a three-dimensional lattice made of glass fiber mesh coated withPTFE, and is 12 mm in height and 2.5 × 2.3 mm rectangular pitch. A lifter-turbine impeller havingpaddles below a disc is used for agitation in the mixer. Continuous phase (aqueous phase) fed tothe mixer of top stage rises through the drop coalescer into the settler with the dispersed phase,goes down through the downspouts into the lower stage mixer after settling into two phases andfinally is led to the leveler from the bottom of the column. While dispersed phase (organic phase)fed at the bottom of the column rises into the mixer of bottom stage through the risers, from themixer into the settler through the drop coalescer with the continuous phase, from the settler intothe upper stage mixer and finally overflows from the top of the column. The downspouts of con-tinuous phase act as the baffles in the mixer.
The characteristics of the MS column are as follows.1. The maximum throughput increases with the agitation speed, and a large throughput and high
stage efficiency is realized simultaneously.2. The effect of liquid mixing between stages is small.3. The mass transfer resistance becomes small by repeating the dispersion and the coalescence
of drops.4. Suction pressure induced by a lifter-turbine impeller promotes the dispersed phase flow re-
sulting a large throughput.5. Analysis of the column is easy because the stages are independent each other.

5Behavior of Multistage Mixer-settler Extraction Column
3. Maximum Throughput in MS Column
For the extraction column in which two phases flow counter currently in the dispersion situa-tion, the maximum throughput depends on the drop motion relative to the continuous phase. It isdifficult to estimate the maximum throughput because the drop motion, which depends on the dropdiameter, the mixing degree and the flow rates, is very complex. On the other hand, the maximumthroughput in the MS column is determined by the different mechanisms because two phases flowconcurrently in dispersed situation from the mixer to the settler.
The throughput has been measured for the MS columns of 6017) and 10018) mm column diam-eter and the effects of the internals on the throughput was investigated. To elucidate the behaviorof the throughput, the pressure differences between several points in the column were also mea-sured. The factors affecting the throughput will be discussed, and it will be shown that the maxi-mum throughput can be estimated rationally.
3.1 Experimental
The columns are made of acrylic resin pipe of 60 and 100 mm inner diameter. The column of100 mm diameter has five stages and a drop coalescer at the bottom of the column as shown inFig.2. Each stage consists of a mixer part of 60 mm height and a settler part of 40 mm height. Alifter-turbine impeller having 6-paddle under a disk of 50 mm diameter agitates in the mixer. Adrop coalescer is set on a stator ring of 50 mm opening diameter between the mixer and the settler.
Fig.2 Diagram of mixer-settler extraction column

6 K. Takahashi and S. NII
Downspouts from the settler to the lower stage mixer are made of glass tubes of 9.6 mm innerdiameter and glass tubes of 7.6 or 5.6 mm inner diameter are also used in some experiments. Ris-ers from the settler to the upper stage mixer are made of PTFE pipes of 6 mm inner diameter.
The measurement of the throughput was carried out as follows. As the continuous phase (wa-ter) flow rate was gradually increased under a constant flow rate of organic phase (heptane), anaccumulated layer of heptane appeared at the top of the settler and the amount of the layer in-creased rapidly with a small increase in water flow rate. When the layer height reached 10 mm,the water flow rate was measured by receiving water from the leveler with a measuring cylinderfor a given time and the flow rate was regarded as a flooding flow rate. The effects of internals onthe throughput were measured for third stage by changing diameter of the downspout, distancebetween the impeller and the riser, b, and position of the impeller from the bottom of the mixer, a,shown in Fig.3. In the present MS column, hydrodynamic characteristics in one stage was notaffected by other stage internals.
Pressure differences at various points were also measured, i.e., ∆P1 was pressure differencebetween ends of riser, ∆P2 between ends of the downspout and ∆P3 across the drop coalescer asshown in Fig.3. In these measurements the dispersed phase was not fed and the risers were pluggedup. The plugging would make the situation that was corresponding to the stop of dispersed phaseflow by the flooding.
3.2 Results and Discussion
3.2.1 Throughput
Effect of the drop coalescer on the maximum throughput is shown in Fig.4, where the maxi-mum flow rates, UW,F, of water are plotted against the flow rate,UO, of heptane. Without coalescer,UW,F is large at small UO and it decreases rapidly with the increase in UO, especially at large agita-tion speed, n. When the coalescer is set, the operation is stable at large UO. In this case a planeinterface was observed within the settler, while drops were accumulated in the settler for the ab-sence of the coalescer. Mesh sheet and urethane foams are tested as a drop coalescer. Heptanestayed at the horizontal mesh sheet and plugged the mesh openings. The value of UW,F for the
Fig.3 Measured point of pressure difference Fig.4 Effect of coalescer on maximum throughput

7Behavior of Multistage Mixer-settler Extraction Column
mesh coalescer was smaller than that for the lattice coalescer. When urethane foam was used as acoalescer, UW,F decreased with the decrease in the opening diameter of the foam. The latticecoalescer was superior to the foam coalescer of 4.5 mm opening diameter. The vertical yarn in thelattice coalescer seems to act effectively for the dispersed phase flow within the coalescer.
The maximum flow rates of water, UW,F, for various columns are shown in Fig.5 for UO = 5 ~6 × 10⁻⁴ m3/(m2s). The throughput for the MIXCO column is given as the general behavior of theextraction column, which decreases with the increase in agitation speed, n. On the other hand,UW,F for MS column increased linearly with n. Since the specific interfacial area increases with n
Fig.5 Maximum flow rate of continuous phase for various columns
Fig.6 Effect of downspout diameter on maximum flow rate

8 K. Takahashi and S. NII
because of the decrease in dispersed drop diameter, the mass transfer efficiency is improved withthe increase of n19). Therefore, the increase of the throughput with n can offer the extraction col-umn a favorite characteristic, i.e., both high mass transfer efficiency and large throughput can berealized. The increase of UW,F with n may be caused by the suction pressure induced by the lifter-turbine impeller as will be described later. Value of UW,F for 100 mm column was 2.3 times aslarge as those for 60 mm column, i.e., scale-up effect was very large.
The distance, b, between the impeller and the riser is important for UW,F. For any value of b,UW,F increased linearly with n, and it decreased with the increase in b. The value of UW,F decreasedlargely with the change in b from 1 to 5 mm, and the difference in UW,F between b = 10 and 20 mmwas very small. When b increased beyond a/2, UW,F decreased largely again and the value at b =30 mm was about half of that at b = 1mm. The effect of impeller position, a, on UW,F was not somuch. The increase rate of UW,F with n became large with the decrease in a. The fact that largeUW,F can be realized with small a is favorable to decrease the column height.
Figure 6 shows the effect of inside diameter, dDS, of the downspout on UW,F. The value ofUW,F decreases largely with the decrease in dDS. This is because of pressure drop of water flowthrough the downspout which increases with the decrease in dDS as will be described later.
3.2.2 Pressure differences
The dispersed phase flows by the pressure difference between ends of riser. The effects ofagitation speed, n, and water flow rate, UW, on the pressure difference, ∆P1, between ends of theriser is shown in Fig.7. Negative value of ∆P1 indicates that the pressure beneath the impeller islower than that in the settler of lower stage. ∆P1 for UW = 0 is negative because of the suction bythe lifter-turbine impeller and the pressure difference is regarded as PS (= – ∆P1,Uw=0). As UW
increases, ∆P1 increases because of the increase in the pressure drop, ∆Pf, since ∆P1 is given by∆Pf – PS. When dispersed phase is fed and UW approaches UW,F, the riser may be filled with dis-persed phase and the buoyant force, Ph (= ∆ρgh), plays positively for the dispersed phase flowthrough the riser as well as PS. As the result, the dispersed phase stops flowing when ∆Pf reaches
Fig.7 Pressure difference between ends of riser

9Behavior of Multistage Mixer-settler Extraction Column
This correlation can not be used for n Di < 0.15 where PS is negligibly small. The value of PS
varied a little with the radial distance, and it became maximum for r = 13 ~ 19 mm in case of Di =50 mm, i.e., the position between inner end and center of the paddle. Risers were set at this radialposition. The pressure drop ∆Pf can be given by ∆P1 for n = 0, which increases linearly with UW
2.For the section corresponding ∆P1, water flows from the mixer to the settler across the coalescer,from the settler to the lower stage mixer through the downspout and from the mixer to the settleracross the coalescer in the lower stage, i.e., through one downspout and two coalescers. The pres-sure drops for the downspout, ∆P2, was about 95 % of ∆P1 and 2∆P3 only 5 % of ∆P1.
Pressure drops, ∆P2, for downspout is given by the pressure drop within a pipe as follows 20).
Where ζ is inlet coefficient of pressure drop, f friction factor and l/d ratio of pipe length to insidediameter. The flow velocity within downspout, uDS, is given by UW(DT/dDS)
2/2, and the velocity,uout, at the outlet of downspout can be assumed to be zero. The value calculated by Eq.(2) with ζ =0.5 coincides with the experimental values.
3.2.3 Estimation of throughput
For small flow rate of dispersed phase, UW,F can be determined to satisfy the following rela-tion as mentioned above.
By using Eq.(1) for PS, Eq.(2) for ∆P2, Ph = ∆ρgh where h is a height of dispersed phase accumu-lated within the riser and at the top of the settler, and 2∆P3 = 1.22 ×10⁵UW
2 obtained from experi-mental measurement, UW,F was determined to satisfy Eq.(3) and shown in Fig.5 with solid lines.For small column (DT = 60 mm), since the downspout pipe protruded about 5 mm from the bottomof the settler, ζ = 2.0 was used as a medium value between 1.3 ~ 3.020). The calculated results wellreflected the change in UW,F with n.
The values of UW,F in Fig.6 measured for b = 5 mm might be smaller than those for b = 1 mmbecause of the decrease in suction pressure PS with b. Then PS for b = 5 mm was assumed to be 3/4 of that for b = 1 mm, and UW,F for various inside diameters of downspout were calculated andshown with solid lines in Fig.6. These calculated results agreed well with the experimental re-sults. The comparison of the calculated UW,F with the experimental ones in Figs.5 and 6 indicatesthat UW,F can be estimated rationally by Eq.(3).
For the columns of similar structural figures, the calculated throughput at a same agitationspeed increased in proportion to the column diameter, DT. The dispersed drops, however, may besmaller with a larger impeller for same agitation speed, and small drops can not be coalesced com-pletely within the coalescer, which is followed by unstable operation because dispersed phase is
PS + Ph, that is, UW in this situation is UW,F.The suction pressure induced by the lifter-turbine impeller increased with the impeller diam-
eter, Di, as well as the agitation speed, and correlated with n Di for b = 1mm as follows.
PS + Ph = ∆Pf =∆P2 + 2∆P3 (3)
PS = 2200(n D i – 0.15)1.5 (1)
∆P2 = ∆Pinlet + ∆Ppipe + ∆Poutlet
= ζ(ρuDS2 / 2) + 4 f (l / d)(ρuDS
2 / 2) + ρ(uDS – uout)2 / 2 (2)

10 K. Takahashi and S. NII
accompanied with the continuous phase and adheres to the wall of the downspout. By using thecorrelation for the sauter mean drop diameter in the MS column21), the agitation speeds correspond-ing to a given drop diameter were calculated for various column diameters. Though the through-put for a given drop diameter increases with the column diameter, the increase rate is not so large.The throughput varied largely with the diameter of downspout as shown in Fig.6. Enlarging thedownspout diameter may be effective to get a large throughput. The value of UW,F for enlargeddownspout diameter and a fixed impeller diameter, where the column diameter is also enlarged toinsert large downspouts, was calculated. The calculated throughput for dDS = 20 mm is 2.5 timesas large as that for dDS = 10 mm. Since the drop diameter is expected to be large for large DT/Di
from the measurement with the agitation vessel, large agitation speed can be adopted for the col-umn of large DT/Di. The throughput of 150 m3/(m2hr) (= 0.0417 m3/(m2s)), which is larger thanthe reported value for any extraction column, is expected to be realize with the column of dDS = 20mm.
In the present experimental system, interfacial tension was large and large agitation speedcould be used. For the system of small interfacial tension, agitation speed must be small to coa-lesce the dispersed drops completely, because the drop diameter decreases with the decrease ininterfacial tension. Under agitation speed where the sauter mean drop diameter is 0.2 mm, thethroughputs were calculated for various interfacial tensions. The calculated value of UW,F decreasedwith the decrease in interfacial tension. On the other hand, the density difference, ∆ρ, between thedispersed and the continuous phases is considered to affect the throughput. The effect of densitydifference for the present MS column is expressed by the term Ph = ∆ρgh. The calculated varia-tion of UW,F with ∆ρ was comparatively small. This is because of the fact that UW,F depends on notonly Ph but also PS as expected from Eq.(3) and the effect of PS on UW,F is dominant at a large n.
Maximum throughput of the mixer-settler extraction column increased linearly with the agi-tation speed and the value for the 100 mm column was 2.3 times as large as that for the 60 mmcolumn. The throughput was largely affected by the diameter of downspout as well as the distancebetween the impeller and the top of riser. From the measurement of pressure difference betweenends of riser, it was indicated that the throughput is determined from the balance among the pres-sure drop, ∆Pf, of fluid flow, suction pressure, PS, induced by the lifter-turbine impeller and thebuoyant force, Ph. The suction pressure PS for the distance between the impeller and the riser b =1 mm was correlated by Eq.(1) with the tip velocity of the impeller. The greater part of ∆Pf wasthe pressure drop through the downspout which could be calculated by Eq.(2). By using theseequations, the maximum throughput could be determined to satisfy Eq.(3). The calculation indi-cated that the throughput increased largely with the downspout diameter and with the column di-ameter for the column of similar figures. The decrease in interfacial tension results in the decreaseof throughput, while the density difference between the dispersed and the continuous phases af-fected a little the throughput.
4. Dispersed Phase Holdup within Mixer of MS Column
The holdup of the dispersed phase as well as the drop size is used to determine the interfacialarea. Therefore, it is never dispensable in the analysis or estimation of mass transfer within theextraction column. The estimation of the holdup in the extraction column having mechanical agi-tation and counter-current flow in the situation of drop dispersion is difficult because it depends onthe drop motion, agitation strength and the flow rates.
The holdup of the dispersed phase was measured in a single-stage MS column, and a simplemodel to predict the dispersed phase holdup has been developed based on the holdup profile in the

11Behavior of Multistage Mixer-settler Extraction Column
Where ρO and ρW are densities of the organic phase and the aqueous phase, respectively.The organic phase used in the experiments was heptane, tributyl phosphate (TBP) - heptane
solution or cyclohexane; aqueous phase was deionized water. TBP is an extractant used for theextraction of various metal ions. All the experiments were carried out at the room temperature of25 ± 1˚C.
4.2 Results and Discussion
4.2.1 Dispersed phase holdup in the mixer
Local holdup, φ, of the dispersed phase in the mixer is shown in Fig.8 against the verticaldistance, H, from the bottom of the mixer for the dispersed phase of heptane. The value of φbelow the lifter turbine (LT) impeller does not vary with H, but φ decreases suddenly near thelower end of the impeller. Although the same change in φ near the impeller is observed for thedisc turbine (FBT) impeller, it is smaller than that for the LT impeller. The holdup for the LTimpeller is much larger than that for the FBT impeller at the same agitation speed of n = 8 s–1, as isseen in Fig.8. Hence the LT impeller is superior in achieving a large interfacial area because thearea increases both with the increase in the holdup and with the decrease in the drop size whichdecreases with the residence time of the dispersed phase21). The remaining experimental runs weremade by use of the LT impeller, and holdups were measured at two positions below (H = 3 cm)and above (H = 5.2 cm) the impeller where φ varied little with H.
The holdup, φL, in the lower part of the mixer is shown against n for various flow rates, qO, oforganic phase and qW, of aqueous phase in Fig.9. The value of φL increases with n and qO, but qW
has a reverse effect on φL; the effect of qO is larger than that of qW. On the other hand, the holdup,φU, in the upper part of mixer also increases with n and qO.
4.2.2 Effects of interfacial tension and density difference
The motion of dispersed drop depends on the drop diameter and the density difference, ∆ρ,between the continuous and the dispersed phases, while the drop diameter in the agitated vesselchanges with the interfacial tension. Therefore, the holdup of the dispersed phase is expected tovary with interfacial tension and density of the dispersed phase when the continuous phase is an
vertical direction in the mixer. The model parameters are correlated with the agitation speed, in-terfacial tension and the density difference between the dispersed and the continuous phases22).
4.1 Experimental
The experimental apparatus used in this work is a single-stage MS column having a lowermixer and an upper settler. The column diameter is 100 mm, the mixer height 60 mm, the settlerheight 40 mm and the impeller diameter 50 mm. The holdup in the mixer was measured by draw-ing out a liquid sample with a syringe having pipe parts of 1.7 mm inner diameter and 200 mmlength and of 13 mm inner diameter and 70 mm length. The syringe was inserted into the mixerthrough a sampling tube located 40 mm from the column axis. The total amount of liquid samplewas taken into the large diameter section of the syringe and settled to separate the organic phasefrom the aqueous phase. After measuring the sample weight, WT, the organic phase was movedslowly to the small diameter section of the syringe by discharging the aqueous phase. The volumeof the organic phase, VO was determined from the tube length occupied by the organic phase, andthe dispersed phase holdup, φ, was calculated by the following equation.
φ = VO / [{(WT – VOρO) /ρW} + VO] (4)

12 K. Takahashi and S. NII
Fig.8 Holdup profile of dispersed phase in vertical direction of mixer
Fig.9 Holdup of dispersed phase in lower part of mixer
13Behavior of Multistage Mixer-settler Extraction Column
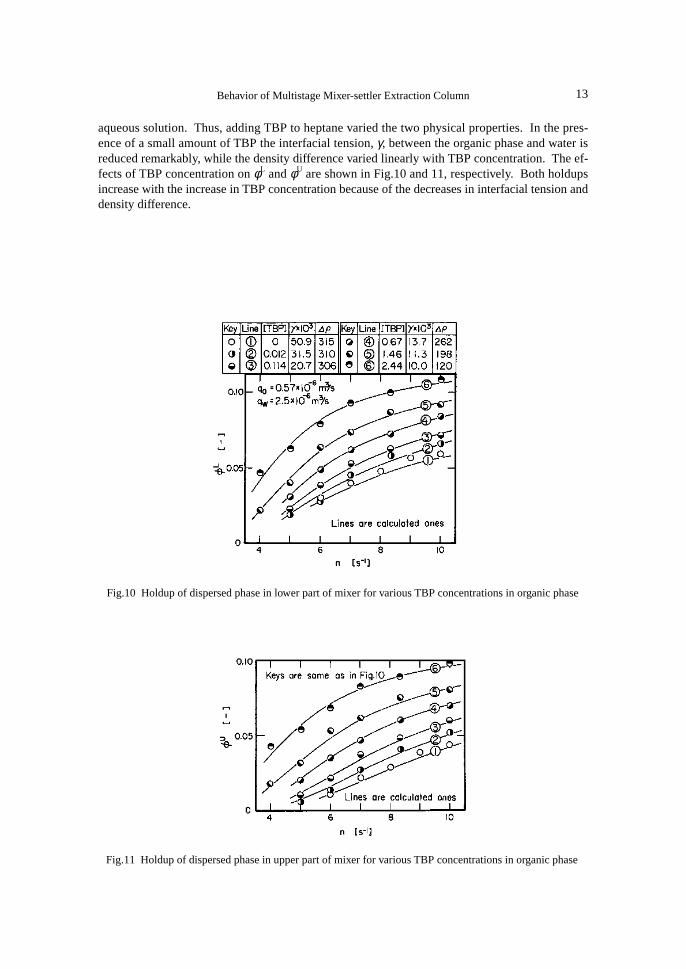
aqueous solution. Thus, adding TBP to heptane varied the two physical properties. In the pres-ence of a small amount of TBP the interfacial tension, γ, between the organic phase and water isreduced remarkably, while the density difference varied linearly with TBP concentration. The ef-fects of TBP concentration on φL and φU are shown in Fig.10 and 11, respectively. Both holdupsincrease with the increase in TBP concentration because of the decreases in interfacial tension anddensity difference.
Fig.10 Holdup of dispersed phase in lower part of mixer for various TBP concentrations in organic phase
Fig.11 Holdup of dispersed phase in upper part of mixer for various TBP concentrations in organic phase

14 K. Takahashi and S. NII
Where K is the transfer coefficient and A is cross-sectional area of flow pass around the impeller,i.e., the area obtained by subtracting the cross-sectional area of four pipes and the area occupiedby the impeller from the cross-sectional area of the column (A = 0.00558 m2 in this work). Thevalue of K was evaluated from Eq.(5) with φL and φU values shown in Fig.10 and 11, and shown inFig.12. The value of K is independent of TBP concentration, i.e., the interfacial tension or thedensity difference, and it is also independent of flow rate given in Fig.9. The following correlationis derived from Fig.12.
4.2.3 Model for dispersed phase holdup
In the lower part of the mixer, both the dispersed and the continuos phases are circulatingbetween the core region and the circumference of the mixer, flowing out through the space aroundthe impeller at the flow rate qO + qW. The holdup φL may be dependent on the discharge mode ofthe dispersed phase from the lower part to the upper part of the mixer. Besides the discharge of thedispersed phase by axial flow through the space around the impeller, a diffusional transfer, de-pending on a difference in the local holdup gradient near the lower end of the impeller as can beseen in Fig.8, may exist. Then it was assumed that the discharge rate of the dispersed phase couldbe expressed as follows.
The second term of right side in Eq.(6) may express the effect of large rising velocity for largedrop at small n.
In the upper part of the mixer, the motion of dispersed drops would follow a free rising pat-tern because of the absence of circulating flow above the LT impeller. Therefore, the holdup of thedispersed phase may be expressed in a similar way as that in a spray column. Since the dispersedand the continuous phases flow concurrently through the mixer, the relative velocity, vS, betweenthe phases is given as follows23).
Fig.12 Transfer coefficient of dispersed phase for various TBP concentration in organic phase
K = 0.0043 + 260n– 7 (6)
v S = [(q O / φ U) – {q W / (1 – φ U)}] / A (7)
q O = (q O + q W) φ L + KA (φ L – φ U) (5)

15Behavior of Multistage Mixer-settler Extraction Column
Values of φU calculated from Eq.(7) with vS by Eq.(8) are shown in Fig.11 by solid lines,while φL, calculated from Eq.(5) with φU and K of Eq.(6), is shown in Figs.9 and 10 by solid andbroken lines. From the comparison of the experimental results with the calculated ones in Fig.9, itwas found that the present model well describes the change in φL with the flow rate of the continu-ous phase as well as that with the flow rate of dispersed phase. For the other system of cyclohex-ane-water, a comparison of calculated φL values with the experimental results is given in Fig.14.In this case the effect of qO or qW on φL can also be explained by the present model.
Holdup distribution of the dispersed phase in the mixer part of the MS column was measuredin a single-stage column having a LT or FBT impeller. For the LT impeller, a large difference inthe holdups between below and above the impeller was observed. Then a diffusional transfer modelof dispersed phase was proposed to express the holdup in the lower part of the mixer, and theholdup in the upper part was related to the relative velocity between the dispersed and the continu-ous phases. The transfer coefficient and the relative velocity as the model parameters were corre-lated with agitation speed, interfacial tension, and density difference between phases. Good agree-ment between calculated and experimental holdup was obtained for various flow rates of the dis-
In Fig.11, the increase in φU with the concentration of TBP may be due to the change in γ for[TBP] < 0.114 kmol/m3, and that in ∆ρ for [TBP] > 0.67 kmol/m3. Since the γ-dependence of vS
obtained from φU in Fig.11 was nearly equal to the ∆ρ-dependence for constant n, values of vS areplotted against the product of ∆ρ and γ in Fig.13. A linear relation has been obtained for eachagitation speed. The product, ∆ργ, mainly depends on ∆ρ at smaller ∆ργ and on γ at larger ∆ργ.Kumar et al.3) reported that vS in the Kuhni-type extraction column was proportional to γ. In Fig.13,vS is proportional to ∆ργ (i.e., γ at large ∆ργ), when n is around 5 s–1. The dependency of vS on ∆ργvaries with n; hence vS is correlated as follows.
Fig.13 Relative velocity between dispersed and continuous phases
v S = 0.00029 (3.3∆ργ)b, where b = 0.2 + 13n – 1.65 (8)

16 K. Takahashi and S. NII
persed phase and the continuous phase.
5. Drop Size in MS Column
The drop size is used to determine the interfacial area as well as the dispersed phase holdup.In the general extraction column24), e.g., the MIXCO column2,4), the Kuhni column4,25) or the RDCcolumn25), the drop size varies with the column height (stage number). It makes the column be-havior complex and the analysis of extraction column difficult, because the dispersed phase holdupvaries with the change in drop size. On the other hand, the drop sizes in the MS column does notvary with the column height because the stages in the MS column are independent each other.
The drop size in the MS column was measured with a single stage column21). Effects of theagitation speed, the interfacial tension and the residence time of the dispersed phase in the mixerare examined, and the drop size distribution is also discussed.
5.1 Experimental
The experimental apparatus is same as used in the measurement of dispersed phase holdup,i.e., the column of 100 mm inner diameter. The drop size was measured by photography throughthe column wall. A small mirror reflecting the light from a stroboscope was located at the level ofimpeller and 40 mm distance from column axis by the same way as Imai et al.26). The magnifica-tion of photograph was between 22 and 60. The diameters of about 1000 drops were measured foreach run. The organic phase used in the experiments was TBP-heptane solution and the aqueousphase was deionized water. The interfacial tension was varied by the TBP concentration, and theresidence time of the dispersed phase was varied by the continuous phase flow rate. All the ex-periments were carried out at room temperature of 25 ± 1˚C.
Fig.14 Comparison of calculated holdup of dispersed phase in lower part of mixer with experimental valuesmeasured for cyclohexane-water system
17Behavior of Multistage Mixer-settler Extraction Column
5.2 Results and Discussion
5.2.1 Sauter mean diameter
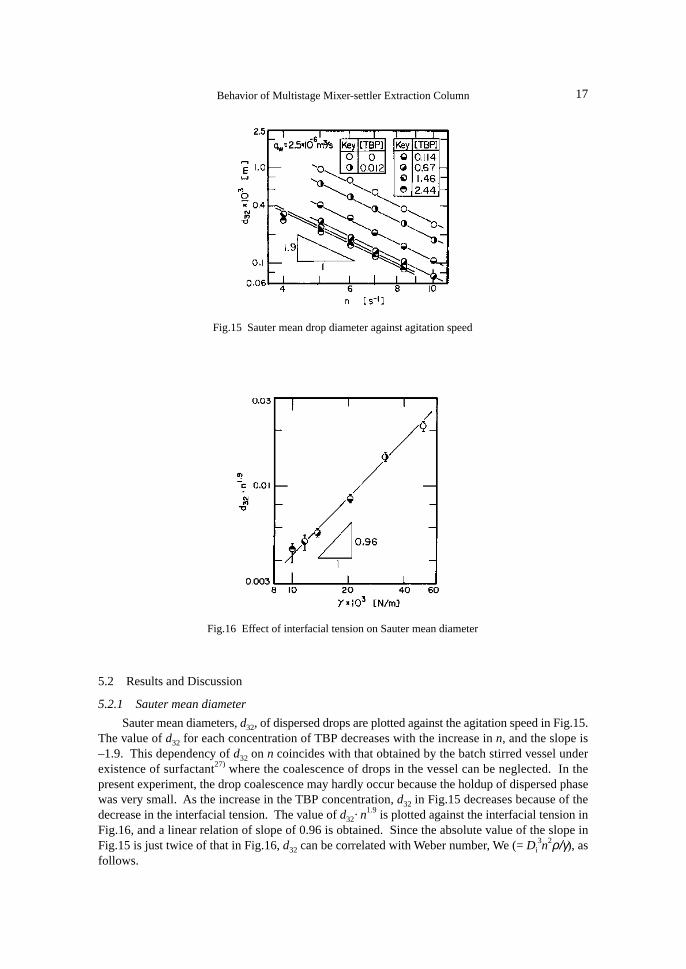
Sauter mean diameters, d32, of dispersed drops are plotted against the agitation speed in Fig.15.The value of d32 for each concentration of TBP decreases with the increase in n, and the slope is–1.9. This dependency of d32 on n coincides with that obtained by the batch stirred vessel underexistence of surfactant27) where the coalescence of drops in the vessel can be neglected. In thepresent experiment, the drop coalescence may hardly occur because the holdup of dispersed phasewas very small. As the increase in the TBP concentration, d32 in Fig.15 decreases because of thedecrease in the interfacial tension. The value of d32· n
1.9 is plotted against the interfacial tension inFig.16, and a linear relation of slope of 0.96 is obtained. Since the absolute value of the slope inFig.15 is just twice of that in Fig.16, d32 can be correlated with Weber number, We (= Di
3n2ρ/γ), asfollows.
Fig.15 Sauter mean drop diameter against agitation speed
Fig.16 Effect of interfacial tension on Sauter mean diameter


19Behavior of Multistage Mixer-settler Extraction Column
The absolute value of dependence of d32/Di on We number becomes smaller than in Eq.(9), but it isstill larger than 0.6 derived theoretically by Hinze.
5.2.3 Drop size distribution
Volumetric drop size distribution of the dispersed drops in the mixer of the MS column isshown in Fig.18. At a small agitation speed, two peaks are observed in the distribution. When thedistribution is divided into two single peak distributions under an assumption that the first distri-bution (smaller drops) is symmetric, the first one is given by normal distribution and the secondone by a logarithmic normal distribution. The fractions, FV2, of the second distribution to the total
Fig.18 Volumetric drop size distribution
Fig.19 Fraction of second peak in drop size distribution against average residence time of organic phase

20 K. Takahashi and S. NII
distribution are given against θO in Fig.19. The value of θO was varied by three methods: by theagitation speed, by the TBP concentration and the flow rate of continuous phase. In any case, FV2
decreases with θO, that is, the fraction of the first distribution increased with the holdup φL. Thisindicates that the drops of the first distribution may be the circulating ones within the mixer andsuffer several times breakage, because the increase in the circulating drops results in the increaseof φL. The drops of the second distribution may be generated by the initial breakage of the inlet-dispersed phase, whose distribution is given by a logarithmic normal distribution like as the spraydispersion39).
The drop size in the MS column varies with the residence time of the dispersed phase as wellas the agitation speed and the interfacial tension between phases; it is correlated by Eq.(11). Thedrop size distribution has two peaks and the fraction of the first peak for small drop increases withthe residence time of dispersed phase.
6. Mass Transfer Coefficients in MS Column
To design the extraction column, the mass transfer characteristics must be also known. In theusual extraction column, the diameter of dispersed drops and the dispersed phase holdup dependon the vertical position of the column2-4), and the accurate estimation of these variations is diffi-cult40). This makes it difficult to determine the mass transfer coefficients in the extraction col-umn. On the other hand, the partition between stages in the MS column is more complete thanthose in other extraction columns, and the hydrodynamic behavior in one stage may not be af-fected by those in other stages, i.e., the behavior is independent for each stage. The Sauter meandrop diameter in the Wirz column does not change with the stage number41) and flooding in theMS column occurs simultaneously in every stage18). This independence of each stage makes theanalysis of mass transfer behavior simple.
The volumetric mass transfer coefficients of the MS column were measured with a singlestage column42), and the mass transfer coefficients of both dispersed and continuous phases weredetermined by use of the interfacial area estimated from the Sauter mean drop diameter21) and thedispersed phase holdup22). These coefficients were compared with theoretical values and withmass transfer coefficients obtained from a rigid sphere correlation.
6.1 Experimental
Experimental apparatus used in this work is a single stage MS column that is the same as inthe previous paper22). This corresponds to one stage of the MS column shown in Fig.2, and bothinner column diameter and column height are 100 mm. The column is divided into a mixer partof 59 mm height and a settler part of 38 mm height by a stator ring of 3 mm thickness having 50mm opening. A drop coalescer, a three dimensional lattice of 12 mm height and 2.5 × 2.3 mmrectangular pitch made of glass fiber meshes coated with PTFE, is set on the stator ring. Agitationin the mixer is carried out by a lifter-turbine impeller which has 6-blade of 10 mm height and 14mm width under a disk of 50 mm diameter. The impeller position is 51 mm from the bottom ofcolumn to the upper surface of impeller disk.
An aqueous solution of I2-KI is fed to the mixer, rises into the settler through the coalescerand is led to the leveler from the bottom of the settler. A dispersed phase of heptane is startedfeeding to the mixer after filling the column with the aqueous solution, rises through the coalescerwith the aqueous phase and goes out from the top of the column. Iodine in the aqueous phase isextracted into the organic phase in the column, and the concentrations in the outlet aqueous and

21Behavior of Multistage Mixer-settler Extraction Column
6.2 Results and Discussion
6.2.1 Volumetric over-all mass transfer coefficient
It is assumed that the extraction of iodine proceeds only within the mixer and both the con-centrations of continuous and dispersed phases leaving the mixer are equal to those within themixer (i.e., complete mixing). The volumetric over-all mass transfer coefficient, Kca, based onthe continuous phase concentration is obtained by the following equation.
organic phases decrease with time and become constant. Since steady state is achieved after flow-ing ca. 0.0018 m3 solution (about four times volume of the mixer), aqueous and organic samplesare taken from the outlet levelers after flowing ca. 0.005 m3 solution. Iodine concentrations in theorganic phase are determined by a spectrophotometer and those in the aqueous phase by the titra-tion with a solution of sodium thiosulfate. The distribution ratio of iodine, m, between aqueoussolution and heptane is determined for each experimental run by measuring the iodine concentra-tions in both phases after equilibrating the outlet organic phase with the outlet aqueous phase. Thedistribution ratios, which vary with the concentration of iodic ion43), were between 5 and 8 in thepresent experiments. For this value of m, the mass transfer resistance in aqueous phase is domi-nant.
In the measurement of mass transfer coefficient within the dispersed phase, a heptane solu-tion of iodine is fed as a dispersed phase and an aqueous solution of sodium thiosulfate as a con-tinuous phase, and the iodine concentrations in the outlet organic phase and the feed solution aremeasured. The physical properties used in the present study are shown in Table 1, which are almostsame as heptane-water system.
Table 1 Physical properties of phases
dispersed phase continuous phase
density [kg/m3] 682 997viscosity [Pa·s] 8.94 × 10⁻⁴
diffusivity [m2/s] 3.86 × 10⁻⁹ 1.33 × 10⁻⁹
interfacial tension [N/m] 5.06 × 10⁻²
Where Cc is the iodine concentration in aqueous phase, VM volume of the mixer, Qc flow rate ofaqueous phase and suffixes, out and in, express outlet and inlet, respectively. Cc,out* is the aqueousconcentration in equilibrium with the outlet organic phase and given by Cc,out* = Cd,out/m, whereCd,out is the average concentration of outlet organic droplets. The assumption of complete mixingdoes not mean a uniform concentration of the dispersed phase, but the average concentration ofdispersed drops leaving the mixer is equal to that within the mixer. Dispersed drops have variousconcentrations corresponding to the residence time of the drop in the mixer.
The values of Kca are shown in Figs.20 and 21 for a constant flow rate of continuous phaseand that of dispersed phase, respectively. Kca increased with the agitation speed, n, and the valuefor n = 12.1 s–1 is about ten times that for n = 5.7 s–1. The effect of dispersed phase flow rate, Qd,on Kca in Fig.20 is larger than that of continuous phase flow rate in Fig.21. Kca increases with theincrease in Qd, while it decreases with the increase in Qc.
K ca (C c,out – C c,out*) V M = Q c(C c,in – C c,out) (12)

22 K. Takahashi and S. NII
Fig.20 Effect of dispersed phase flow rate on volumetric over-all mass transfer coefficient
Fig.21 Effect of continuous phase flow rate on volumetric over-all mass transfer coefficient

23Behavior of Multistage Mixer-settler Extraction Column
Where VL and VU are volumes below and above the impeller, respectively, and VM the volume ofmixer. The value of φU is calculated by Eqs.(7) and (8), and φL by Eqs.(5)–(7). On the other hand,d32 is correlated by Eq.(11). The specific interfacial area can be calculated from Eqs.(13) and (14)with the assumption that the values of d32 above and below the impeller are same. An example ofcalculated value of a for the present experimental condition is shown in Fig.22 with φU, φL and d32.As the agitation speed increases, values of φU and φL increase and d32 decreases, i.e., the interfacialarea increases largely with the increase in n. The calculated values of a for each experiment areshown in Figs.20 and 21. It increases with n or Qd and decreases with Qc. The changes in Kca aresimilar to those in a, i.e., the volumetric over-all mass transfer coefficient varies according to thechange in interfacial area. The over-all mass transfer coefficient Kc does not change with n, Qd orQc.
6.2.3 Over all mass transfer coefficient
The over-all mass transfer coefficient Kc was obtained by dividing the volumetric coefficientby the interfacial area and shown in Fig.23 as ShOc (=Kcd32/Dc) to compare with the data for vari-
6.2.2 Interfacial area
To obtain the mass transfer coefficient, specific interfacial area, a, in the mixer must be known,which is given by
where φ is dispersed phase holdup in the mixer and d32 Sauter mean diameter of dispersed drops.In the present mixer the value of φ below the impeller differed from that above the impeller, thevalue of φ could be obtained by averaging φU and φL as
Fig.22 Calculated values of drop size, dispersed phase holdup and specific interfacial area
a = 6φ / d32 (13)
φ = (φ UV U + φ LV L) / V M (14)

24 K. Takahashi and S. NII
ous extraction columns given by Kumar and Hartland44). The diffusion coefficient of iodine inwater was given by Darral and Oldham45) as in Table 1. Reynolds number, Re, in the abscissa wasobtained with the slip velocity (relative velocity) calculated by Eq.(7) with the column cross sec-tional area and φL instead of A and φU in Eq.(7), respectively.
According to Kumar and Hartland, correlation for several extraction columns, i.e., Kühni col-umn, rotating disc column (RD), enhanced coalescing column (EC) and pulsed sieve extractioncolumn (PSE) are almost same. While, the correlation is apart from the present experimentalpoints. Reynolds number in the present experiments is small due to the small slip velocity be-cause of the small drop diameter. Drop diameters were in the range of 0.15–0.67 mm as shown inFig.22. With such a small drop diameter, the extraction columns given by lines 1–5 in Fig.23could not be operated. Since relatively large number of drops circulate within the mixer in thepresent experiments, the dispersed phase holdup is larger than that in the Kühni column (line 1),and vs calculated by Eq.(7) are small as 0.0007–0.003 m/s. Because the distribution ratio in thepresent experiments is large, mass transfer resistance in the continuous phase is dominant and ShOc
is larger than the theoretical value of Shc = 2 for the quiescent continuous phase.
6.2.4 Dispersed phase mass transfer coefficient
The volumetric dispersed phase mass transfer coefficient, kda, was determined by the follow-ing equation from the back extraction of iodine in the iodine-heptane solution by the aqueous solu-tion of sodium thiosulfate.
Fig.23 Correlation of ShOc against Re·Sc
Where Cd,in is the inlet iodine concentration in heptane. The iodine concentration at the interfacewas assumed to be zero because of the instantaneous reaction between iodine from the organicphase and sodium thiosulfate in the aqueous phase. The effects of flow rates of dispersed andcontinuous phases on kda are shown in Figs.24 and 25, respectively. The value of kda increased
k daC d,outV M = Q d (C d,in – C d,out) (15)

25Behavior of Multistage Mixer-settler Extraction Column
with the increase in Qd, while it varied little with the change in Qc.By use of the calculated interfacial area, the dispersed phase mass transfer coefficients were
obtained from the volumetric mass transfer coefficients in Figs.24 and 25 and shown in Fig.26.The coefficient increased with the agitation speed, but it varied little with the change in Qd or Qc.
6.2.5 Dispersed phase mass transfer coefficient based on rigid sphere model
For the present back-extraction, the average concentration, Cd,t, of iodine in a drop of resi-
Fig.24 Effect of dispersed phase flow rate on volumetric dispersed phase mass transfer coefficient
Fig.25 Effect of continuous phase flow rate on volumetric dispersed phase mass transfer coefficient

26 K. Takahashi and S. NII
The value of Cd,out was calculated by use of the average residence time θd(= VMφ / Qd) as t in Eq.(16),and kd was determined from Eq.(15).
Fig.26 Dispersed phase mass transfer coefficient, lines are calculated form Eq.(19)
dence time t is given by the diffusion model within a rigid sphere as follows 46).
Fig.27 Comparison between kd calculated for drop of average residence time and observed values
Cd,in – Cd,t
Cd,in= 1 – 6
π 21n2Σ
n = 1
∞exp –
4Ddn2π 2td 2 (16)

27Behavior of Multistage Mixer-settler Extraction Column
The value of kd calculated by Eq.(19) is shown in Fig.28. In the calculation, Sauter mean diameterd32 was used as the drop diameter d in Eq.(16), and the diffusion coefficient of iodine in heptanewas estimated with Wilke-Chang correlation by use of the observed value for CO2 in heptane(Sherwood et. al.47)) as shown in Table 1. Although kd decreases with θd, the change is very smallfor θd > 10 s. In the present experiments θd varied between 15 s and 51 s, and the effect of θd on kd
could be negligible.
The calculated values of kd are larger by several orders than the observed ones as shown inFig.27. The calculated concentration of outlet drop having the residence time θd is very small.There are drops of various residence times, and the concentration of drop increases with the de-crease in the residence time. Therefore, the average concentration of outlet drops may differ fromthe value calculated by the average residence time.
Under an assumption of the complete mixing within the mixer, the residence time distributionis expressed as
Then, the fraction, Y, of iodine back extracted within the mixer is given as
On the other hand, the dispersed phase mass transfer coefficient is derived from Eq.(15) as follows
Fig.28 Dispersed phase mass transfer coefficient based on rigid sphere model
k d =Qd
aVM
Cd,in – Cd,out
Cd,out=
d32
6Qd

28 K. Takahashi and S. NII
The theoretical values of kd calculated for the experimental conditions are shown in Fig.26with two lines as a largest and a smallest values for various flow rates of the dispersed and thecontinuous phase. The variation of calculated kd with the flow rates is small and it mainly de-pends on the change in drop diameter which varies with the average residence time, i.e., the dis-persed phase holdup. Though all experimental values are somewhat larger than the theoreticalones, the difference between them is small. It can be concluded that the dispersed phase masstransfer coefficient can be calculated based on the diffusion model within the droplet by takinginto account the residence time of the drops.
6.2.6 Continuous phase mass transfer coefficient
According to the addition rule of mass transfer resistance expressed by the volumetric masstransfer coefficients
Fig.29 Correlation between volumetric mass transfer coefficient in continuous phase and specific interfacialarea
The volumetric mass transfer coefficients, kca, in the continuous phase were determined from Kcain Figs.20 and 21 and kda in Fig.24 and 25. As shown in Fig.29, kca is proportional to the specificinterfacial area, that is, kc varies little with the agitation speed or the flow rates of dispersed andcontinuous phases.
The dispersed drops are circulated with the continuous phase below the impeller in the mixer.When the drop diameter is small as in the present experiment, the relative velocity between thedrop and the continuous phase may be small, which depends on the gravitation force. Here, weassume that the terminal settling velocity of a rigid sphere having the same diameter and density asthe dispersed drop expresses the relative velocity. The terminal velocity, vt, is given as follows 48).
vt = d 2∆ρg / 18η for Re < 1 (21)
1 / K ca = (1 / k ca) + (1 / mkda) (20)
29Behavior of Multistage Mixer-settler Extraction Column
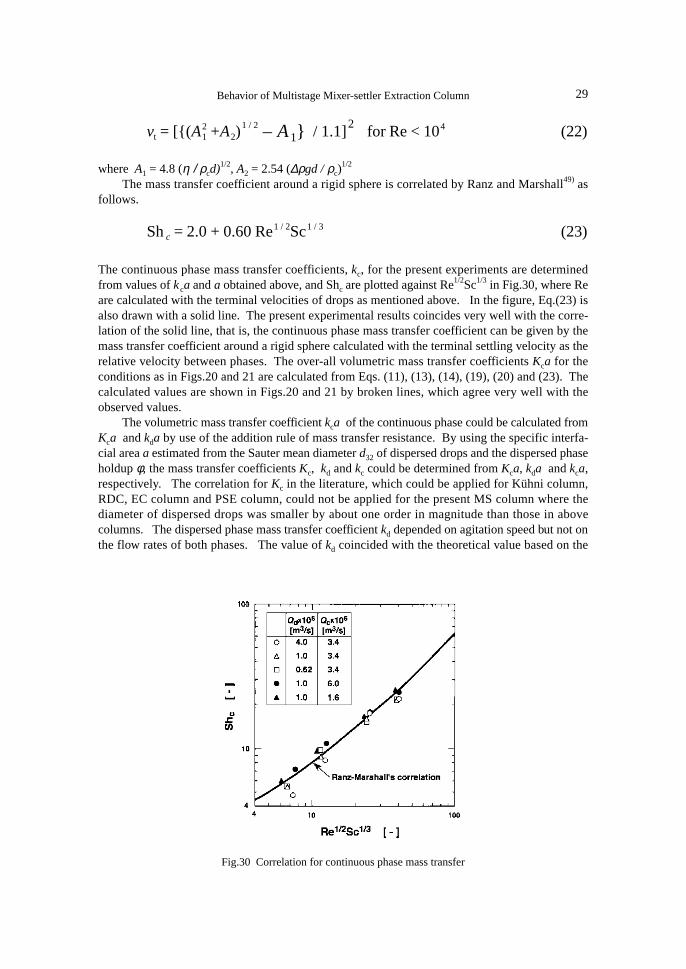
The continuous phase mass transfer coefficients, kc, for the present experiments are determinedfrom values of kca and a obtained above, and Shc are plotted against Re1/2Sc1/3 in Fig.30, where Reare calculated with the terminal velocities of drops as mentioned above. In the figure, Eq.(23) isalso drawn with a solid line. The present experimental results coincides very well with the corre-lation of the solid line, that is, the continuous phase mass transfer coefficient can be given by themass transfer coefficient around a rigid sphere calculated with the terminal settling velocity as therelative velocity between phases. The over-all volumetric mass transfer coefficients Kca for theconditions as in Figs.20 and 21 are calculated from Eqs. (11), (13), (14), (19), (20) and (23). Thecalculated values are shown in Figs.20 and 21 by broken lines, which agree very well with theobserved values.
The volumetric mass transfer coefficient kca of the continuous phase could be calculated fromKca and kda by use of the addition rule of mass transfer resistance. By using the specific interfa-cial area a estimated from the Sauter mean diameter d32 of dispersed drops and the dispersed phaseholdup φ, the mass transfer coefficients Kc, kd and kc could be determined from Kca, kda and kca,respectively. The correlation for Kc in the literature, which could be applied for Kühni column,RDC, EC column and PSE column, could not be applied for the present MS column where thediameter of dispersed drops was smaller by about one order in magnitude than those in abovecolumns. The dispersed phase mass transfer coefficient kd depended on agitation speed but not onthe flow rates of both phases. The value of kd coincided with the theoretical value based on the
where A1 = 4.8 (η / ρcd)1/2, A2 = 2.54 (∆ρgd / ρc)1/2
The mass transfer coefficient around a rigid sphere is correlated by Ranz and Marshall49) asfollows.
Fig.30 Correlation for continuous phase mass transfer
vt = [{(A12 +A2)
1 / 2 – A1} / 1.1]2 for Re < 104 (22)
Sh c = 2.0 + 0.60 Re1 / 2Sc1 / 3 (23)

30 K. Takahashi and S. NII
diffusion within a rigid sphere using the residence time distribution of dispersed drops. The con-tinuous phase mass transfer coefficient kc did not vary with the agitation speed as well as the flowrates of both phases. The continuous phase mass transfer coefficient could be given by the corre-lation of mass transfer around a rigid sphere. The terminal settling velocity of a rigid sphere withthe same diameter and density as the dispersed drop was used as the relative velocity between thedispersed drop and the continuous phase.
7. Stage Efficiency in MS Column
The stage efficiency is convenient for the calculation of the practical stage number in themultistage counter current extraction column. The efficiency depends on the mass transfer coeffi-cients, the interfacial area, the flow rates and the axial mixing between stages. The stage efficiency

31Behavior of Multistage Mixer-settler Extraction Column
into five stages of 60 mm in height by stator rings of 31 mm in opening diameter. The top and thebottom stages were used as the settlers, and a 6-blade turbine impeller of 30 mm in diameter wasset at the center of each stage for three stages. Time to reach a steady state was about twice of thatfor the MS column.
7.2 Results and Discussion
7.2.1 Stage efficiency
Liquid-liquid equilibrium for the extraction of iodine from aqueous phase into heptane is givenby
where Cd and Cc are the iodine concentrations in heptane and aqueous phase, respectively, and mdistribution ratio of iodine which is expressed by m = 36.6/(1 + 748[I–])43), where [I–] is iodic ionconcentration in kmol/m3. Since mutual solubilities between heptane and water are very small, theoperating line for the multistage counter-current extraction is expressed by
where Qc is the raffinate phase flow rate, Qd the extract phase flow rate, Cd,in the iodine concentra-tion in organic phase fed to the bottom of the column, and Cc,out the iodine concentration in aque-ous phase from the bottom of the column. Stage number is counted from the bottom of the col-umn. The stage efficiency EOd based on the concentration of organic phase is defined as follows.
Where Cd,p* (= mCc,p) is the organic phase concentration in equilibrium with the aqueous phase ofp-th stage. The equilibrium line and the operating line given by Eqs.(24) and (25), respectively, arestraight lines on Cd–Cc diagram as shown in Fig.31. Under an assumption that the stage efficiencydoes not vary with the stage number, the points (Cc, out, Cd, 1), (Cc, 2, Cd, 2), · · · , (Cc, p, Cd, p), · · · ,
Cd = mCc (24)
Fig.31 Diagram to determine stage efficiency
E Od = (C d,p – C d,p – 1) / (C d,p * – C d,p – 1) (26)
C d,p – C d,in = (Q c /Q d)(C c,p + 1 – C c,out) (25)

32 K. Takahashi and S. NII
To satisfy Eq.(32) for any value of Cc,p.
From the definition of the stage efficiency,
This equation is rearranged as follows.
By substituting Cd, 1 – Cd, in =EOd (Cd, 1* – Cd, in) = EOd(mCc, out – Cd, in) to Eq.(30),
(Cc, P, Cd, out), which represent the concentrations of the dispersed and the continuous phases leav-ing the stage, are on a straight line as shown by Cd = aCc + b in Fig.31, and the following relationcan be obtained.
From these equations
where r = a/(Qc/Qd). The series {Cd,p - Cd,p-1} is a geometric progression, and the summation of theseries is
C d,p – C d,p – 1 = (Q c / Q d)(C c,p + 1 – C c,p) (27)
C d,p + 1 – C d,p = a(C c,p + 1 – C c,p) (28)
C d,p + 1 – C d,p = r (C d,p – C d,p – 1) (29)
{a – mEOd – (1 – E Od)(Q c / Q d)}C c,p + b – (1 – E Od)
× {C d,in – (Q c / Q d) C c, out} = 0 (32)
a = mE Od + (1 – E Od)(Q c /Q d),
b = (1 – E Od) {C d,in – (Q c /Q d) C c,out} (33)
E Od (mC c, out – C d, in) (1 + r + r2 + ⋅ ⋅ ⋅ +rP– 1) – (C d, out – C d, in) = 0 (34)
E Od =
Cd,p – Cd,p – 1
Cd,p* – Cd,p – 1
=(aCc,p+b) – {(Q c /Q d)(Cc,p – Cc,out) + Cd,in}
mCc,p – {(Q c /Q d)(Cc,p – Cc,out) + Cd,in}(31)
{C d,p – C d,p – 1}Σ
= C d,out – C d,in = (C d,1 – C d,in)(1 + r + r2 + ⋅ ⋅ ⋅ +rP – 1) (30)

33Behavior of Multistage Mixer-settler Extraction Column
The ratio of flow rate is given by Qc/Qd = (Cd,out – Cd,in)(Cc,in – Cc,out) from the mass balance of thecolumn. The value of EOd can be determined from Eqs.(34) and (35) with the measured values ofCc,, in, Cc,, out, Cd, in, Cd, out and m.
7.2.2 Effects of agitation speed, flow rates and distribution ratio on stage efficiency
Stage efficiencies EOd of MS column and the MIXCO column are shown in Fig.32 against theagitation speed n for the distribution ratio m = 6.0 and flow ratio Qc/Qd = 4. EOd of MS columnincreased monotonously with the increase in n and high stage efficiency could be obtained at astrong agitation in the present experimental condition. While EOd of the MIXCO column stopsincreasing for large value of n, and the value is smaller than that of the MS column in spite of thefact that the holdup of dispersed phase (i.e., the interfacial area) of the MIXCO column is largerthan that of MS column. The stage efficiency of the MIXCO column may be affected by the axialmixing between stages. Since the axial mixing increased with the agitation speed, the differencein EOd between two columns became large with n. The MS column may be a high performanceextraction column, which can achieve large stage efficiency as well as a large throughput and astable operation at a vigorous agitation. However, if the agitation speed is continued to increase, alarge part of dispersed drops will pass through the coalescer without coalescing and be accompa-nied by the continuous phase, the decrease in the stage efficiency follows. Though smaller dropscan be coalesced with the coalescer of smaller mesh pitch, the pressure drop by the coalescer in-creases with the decrease in mesh pitch, which decreases the throughput17).
The effect of throughput on the stage efficiency is given in Fig.33 for a given Qc/Qd and m.Here, UO and UW are superficial velocities of the dispersed and the continuous phases respectively,and UO + UW = 1.33 × 10⁻³ m/s corresponds to Qd + Qc = 3.75 × 10⁻⁶ m3/s for the present column.EOd varied little with the total throughput UO + UW. The holdup of dispersed phase increases withthe increase in UO and decrease with the increase in UW, and the effect of UO is larger than that ofUW
22), i.e., the holdup may increase by doubling UO + UW under a constant Qc/Qd. While the resi-
where
Fig 32 Comparison of stage efficiencies between MS column and MIXCO column
r = a (Q c / Q d) = E Od {m / (Q c / Q d) – 1} + 1 (35)

34 K. Takahashi and S. NII
dence time of dispersed phase decreases with the increase in UW, and the size of dispersed dropincreases with the decrease in the residence time21). As the effect of the flow rate on the stageefficiency, the contribution of the holdup is positive and that of the residence time is negative,because the interfacial area is proportional to the holdup and inversely proportional to the dropsize. The former may be compensated by the latter in case of Fig.33. On the other hand, EOd for agiven m increased with the flow ratio Qc/Qd, and that for a given Qc/Qd decreased with the distribu-tion ratio m as shown in Figs.34 and 35.
When the stage efficiency EOc defined by the following equation with the concentration ofcontinuous phase is used, the dependency of the stage efficiency on m and Qc/Qd may be differentfrom the above results.
Fig.33 Effect of throughput on stage efficiency
Where C*c,p = Cd,p / m. In the same way as for EOd, the following equation can be derived.
Where r = 1/{EOc(Qc/Qd)/m + 1 – EOc}. In Fig.35, EOc for the same data used to calculate EOd arealso plotted against m. EOc increases with the increase in m, in contrast to the change of EOd. Thevalue of EOc is larger than EOd for m > Qc/Qd and the reverse is also true. The change of EOc islarge for m < Qc/Qd, while that of EOd is large for m > Qc/Qd.
7.2.3 Estimation of stage efficiency
Under the assumption that mass transfer occurs only within the mixer and the concentrationsCc,p and Cd,p of the outlets from p-th stage are equal to those in the mixer, i.e., complete mixingwithin the mixer, the volumetric over-all mass transfer coefficient, Kca, based on the continuousphase concentration is given as
E Oc = (C c,p – C c,p + 1) / (C c,p* – C c,p + 1) (36)
(E Ocr / m) (mC c,out – C d,in) (1 + r + r2 + ⋅ ⋅ ⋅ +rP – 1)
– (C c,in – C d,out) = 0 (37)

35Behavior of Multistage Mixer-settler Extraction Column
Fig.34 Effect of flow ratio on stage efficiency
Fig.35 Effect of distribution ratio on stage efficiency
where VM is volume of the mixer. Equation (38) is rearranged as
From Eqs.(36) and (39), following relation between the stage efficiency and the volumetric masstransfer coefficient is derived.
In the same way, the stage efficiency, EOd, based on the dispersed phase concentration is ex-pressed as follows.
K caV M(C c,p – C c,p*) = Q c(C c,p – 1 – C c,p) (38)
K caV M / Q c = (C c,p – 1 – C c,p) / (C c,p – C c,p*) (39)
E Oc = (K caV M / Q c) / {1 + (K caV M / Q c)} (40)

36 K. Takahashi and S. NII
Where Cd,p* is the dispersed phase concentration in equilibrium with Cc,p, Kda the volumetric over-all mass transfer coefficient based on dispersed phase concentration (= (Qd /VM) (Cd,p – Cd,p+1)/(Cd,p* – Cd,p)). The stage efficiency can be determined by Eq.(40) or (41) if the volumetric over-allmass transfer coefficient is estimated.
By using the extraction data with a single stage MS column with which the values of Kca inFigs.20 and 21 were obtained, the stage efficiency EOc is calculated by Eq.(36) and shown in Fig.36.The efficiency increases with the agitation speed in the same way as in Fig.32, and it increaseswith the increase in the dispersed phase flow rate and decreases with the increase in the continuousphase flow rate. For the experimental conditions of Fig.36, the stage efficiency is calculated fromEq.(40) with Kca. The over-all volumetric mass transfer coefficient Kca is calculated from Eq.(20)with a, kc and kd. The interfacial area a is calculated from Eq.(13) with φ and d32. The dispersedphase holdup φ is calculated from Eq.(14) with φU and φL. The holdup φU above the impeller in themixer is calculated from Eqs.(7) and (8), and φL below the impeller from Eqs.(5)–(7). The dropsize d32 is obtained from the correlation of Eq.(11). The continuous phase mass transfer coeffi-cient kc is calculated from Eq.(23) with the terminal settling velocity vt given by Eqs.(21) and (22).The dispersed phase mass transfer coefficient is calculated from Eq.(19) using Eqs.(16)–(18). Thecalculated results are shown with solid lines in Fig.36. They agree well with the experimentalresults for any flow rates of both phases. This indicates that the stage efficiency can be estimatedrationally for the MS column.
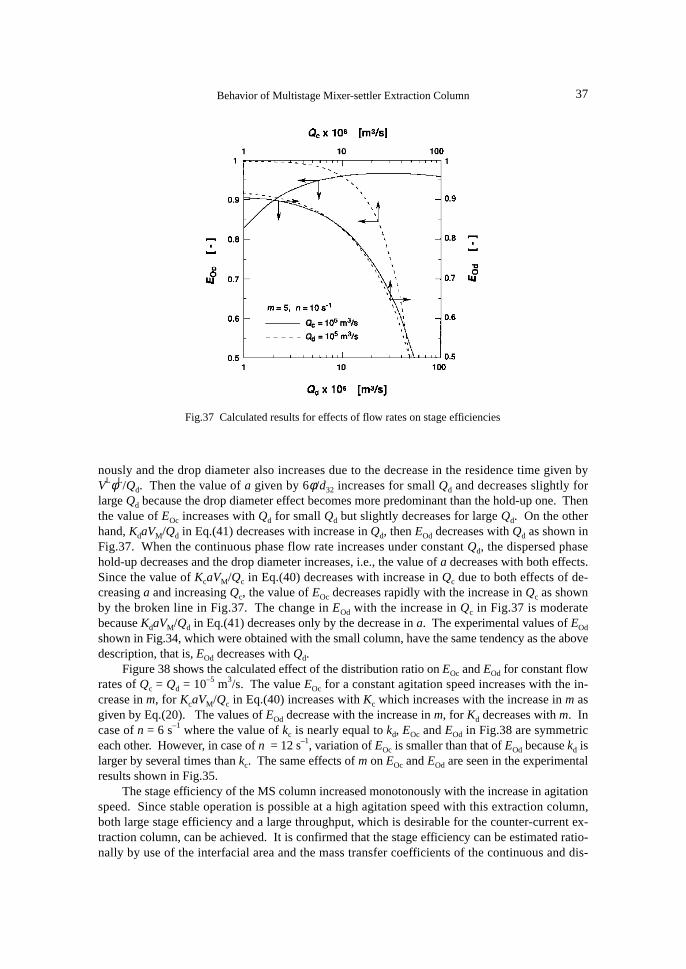
To clarify the effects of flow rates on EOc or EOd, the stage efficiencies were calculated forvarious flow rates by use of the same physical properties and the same column geometry as used inFig.36. Figure 37 show the effects of flow rates on EOc or EOd. The calculated value of EOc in-creases with the increase in Qd, while EOd decreases largely with the increase in Qd (solid lines).This behavior can be explicable in terms of the change in interfacial area, a, because the masstransfer coefficients of both phases vary little with the change of flow rate as mentioned above.When the value of Qd increases at a constant Qc, the dispersed phase hold-up increases monoto-
Fig.36 Comparison of experimental stage efficiencies with calculated ones
E Od = (K daV M / Q d) / {1 + (K daV M / Q d)} (41)
37Behavior of Multistage Mixer-settler Extraction Column
nously and the drop diameter also increases due to the decrease in the residence time given byVLφL/Qd. Then the value of a given by 6φ/d32 increases for small Qd and decreases slightly forlarge Qd because the drop diameter effect becomes more predominant than the hold-up one. Thenthe value of EOc increases with Qd for small Qd but slightly decreases for large Qd. On the otherhand, KdaVM/Qd in Eq.(41) decreases with increase in Qd, then EOd decreases with Qd as shown inFig.37. When the continuous phase flow rate increases under constant Qd, the dispersed phasehold-up decreases and the drop diameter increases, i.e., the value of a decreases with both effects.Since the value of KcaVM/Qc in Eq.(40) decreases with increase in Qc due to both effects of de-creasing a and increasing Qc, the value of EOc decreases rapidly with the increase in Qc as shownby the broken line in Fig.37. The change in EOd with the increase in Qc in Fig.37 is moderatebecause KdaVM/Qd in Eq.(41) decreases only by the decrease in a. The experimental values of EOd
shown in Fig.34, which were obtained with the small column, have the same tendency as the abovedescription, that is, EOd decreases with Qd.
Figure 38 shows the calculated effect of the distribution ratio on EOc and EOd for constant flowrates of Qc = Qd = 10–5 m3/s. The value EOc for a constant agitation speed increases with the in-crease in m, for KcaVM/Qc in Eq.(40) increases with Kc which increases with the increase in m asgiven by Eq.(20). The values of EOd decrease with the increase in m, for Kd decreases with m. Incase of n = 6 s–1 where the value of kc is nearly equal to kd, EOc and EOd in Fig.38 are symmetriceach other. However, in case of n = 12 s–1, variation of EOc is smaller than that of EOd because kd islarger by several times than kc. The same effects of m on EOc and EOd are seen in the experimentalresults shown in Fig.35.
The stage efficiency of the MS column increased monotonously with the increase in agitationspeed. Since stable operation is possible at a high agitation speed with this extraction column,both large stage efficiency and a large throughput, which is desirable for the counter-current ex-traction column, can be achieved. It is confirmed that the stage efficiency can be estimated ratio-nally by use of the interfacial area and the mass transfer coefficients of the continuous and dis-
Fig.37 Calculated results for effects of flow rates on stage efficiencies

38 K. Takahashi and S. NII
persed phases. The interfacial area is determined with the dispersed phase holdup and the drop sizeand the mass transfer coefficients in both phases with a rigid sphere model. The calculated stageefficiency EOd based on the dispersed phase concentration increased with the flow ratio Qc/Qd ofthe continuous phase to the dispersed phase. The calculated value of EOd decreases with the in-crease in m, while EOc based on the continuous phase concentration increases with m. These ten-dencies were also observed in the experimental results.
8. Extraction of Copper by MS Extraction Column
Solvent extraction is useful for the removal of heavy metals from wastewater. An effectiveremoval of metal from a dilute solution can be achieved by multistage counter-current extraction.We have proposed a multistage mixer-settler extraction column (MS column) which realizes a largethroughput18) and a high stage efficiency19) simultaneously under a strong agitation. Copper, oneof hazardous materials contained in the wastewater from various electroplating, mines and metal-lurgy, chemicals, electronic etc. industries50) must be prevented from being discharged into theenvironment. Heavy metal in a dilute solution just as a rinse water is difficult to remove, and theseparation technique of high efficiency is necessary.
Copper was extracted from a dilute solution through a five-stage MS column, and the extrac-tion rate of copper by LIX84I was measured within a flat interface stirred vessel (FISV)51). Thesimulation for the multi-stage counter-current extraction, where both the mass transfer and the ex-tractive reaction are taken into account, are discussed by use of the specific interfacial area deter-mined from the dispersed phase holdup and the dispersed drop size, mass transfer coefficients inthe continuous and the dispersed phases, and the extractive reaction rate at the interface. The simu-lated results are compared with the observed ones, and the effects of stage number and flow ratesof both phases on the removal of copper are estimated by the simulation.
Fig.38 Calculated results for effects of distribution ratio on stage efficiencies

39Behavior of Multistage Mixer-settler Extraction Column
8.1 Experimental
The MS column used for copper extraction is shown schematically in Fig.2. The column wasmade of acrylic resin pipe of 100 mm inner diameter and has five stages and a drop coalescer atthe bottom of the column. Each stage consists of a mixer of 60 mm height and a settler of 40 mmheight. A three-dimensional drop coalescer of 12 mm height made of glass fiber mesh coated withPTFE is set on a stator ring of 50 mm opening diameter between the mixer and the settler. A lifter-turbine impeller which has six blades under a disk of 50 mm diameter carries out agitation in themixer.
The feed solution was an aqueous solution of 0.15 mol/m3 copper(II) chloride with the pHadjusted to 2.6 by the addition of hydrochloric acid. Diluent was Shellsol 71 (Shell ChemicalsCo., Ltd.) and the copper extractant, LIX84I (Henkel Co.), was dissolved in the diluent. The feedsolution is fed into the mixer of top stage and contacted with the organic solution. Both the aque-ous and the organic solutions rise together through the drop coalescer and separated into each phasewithin the settler. The aqueous solution goes down into the mixer of lower stage through the down-spout, and finally is led to the outlet leveler from the bottom of the column. The organic solutionfed to the bottom of the column flows into the bottom stage mixer through the riser tube then risesinto the settler with the aqueous solution. After separation from the aqueous phase within thesettler, the organic solution rises into upper stage and finally is led to the outlet leveler from thetop of the column. The flow rates of the aqueous and the organic solutions were 3.3 × 10⁻⁶ and 0.6× 10⁻⁶ m3/s, respectively. The organic solution was fed after filling the column with the aqueoussolution. When the aqueous volume fed to the column exceeded four times of the column volume,the outlet copper concentration became constant (i.e., steady state). The steady state copper con-centration in the outlet solution was determined by an atomic absorption spectrophotometer(Shimazu Co., type AA-6400F).
The extraction rates of copper by LIX84I were measured by a FISV. The vessel has 55 mminside diameter and 200 cm3 in volume with four baffles and two paddle impellers of 24 mm diam-eter at height of 12 mm and 35 mm from the bottom of the vessel. The organic solution of 5 ×10⁻⁵ m3 was laid on the aqueous solution of 5 × 10⁻⁵ m3, and both phases were stirred at 2 s–1. Theextraction rate of copper was determined from the concentration change in the aqueous phase.Mass transfer coefficients in the organic and the aqueous phases were measured by the iodine trans-fer from heptane solution of iodine into Na2S2O3 aqueous solution and that from I2-KI aqueoussolution into heptane, respectively. These measurements with the stirred vessel were carried outwithin the water bath of 298 ± 0.5 K.
8.2 Results and Discussion
8.2.1 Copper extraction with MS column
Concentration ratios X (= CA,out/CA,in) of copper in the outlet aqueous solution to that in theinlet solution are shown in Fig.39 against agitation speed n. The ratio is reduced largely by chang-ing the extractant concentration CRH,in from 1.78 to 8.78 mol/m3. For CRH,in = 8.78 mol/m3 and n =10 s–1, the value of X is 0.002, which indicates that the effective removal of copper from a diluteaqueous solution is achieved by the multi-stage counter-current extraction.
8.2.2 Mass transfer coefficients in FISV
The extractive reaction between copper ion and LIX84I may proceed at the interface, sincecopper ion does not dissolve into the organic phase and LIX84I can hardly dissolve into the aque-ous phase. It is necessary to estimate the interfacial concentrations by the use of the mass transfercoefficients to assess the effects of the reactants on the interfacial extractive reaction rate at the

40 K. Takahashi and S. NII
interface. The mass transfer coefficient, kI2,hep, in the organic phase was measured by the iodinetransfer from heptane into Na2S2O3 aqueous solution and shown in Fig.40. It was correlated asfollows.
Fig.39 Extraction of copper with a five-stage mixer-settler extraction column
Fig.40 Mass transfer coefficient of iodine transfer within heptane or aqueous solution in FISV
k 12,hep = 1.53 × 10– 5n0.8 (42)

41Behavior of Multistage Mixer-settler Extraction Column
The diffusion coefficients of ions are calculated based on the Vinograd-McBain’s equation53), andthe value of DI2,W given by Darrall and Oldham45) is used.
8.2.3 Copper extraction rate in FISV
Extraction rates, NA, of copper across the flat interface in the FISV were determined from thechange in copper concentration of aqueous phase. Interfacial concentrations were obtained by thefollowing equations.
On the other hand, the mass transfer coefficient, kI2,W, in the aqueous phase is determined by use ofthe additive rule of mass transfer resistance from kI2,hep and the over-all mass transfer coefficient,KI2,W, measured by the iodine transfer from I2-KI aqueous solution into heptane. The coefficientskI2,W are also shown in Fig.40 and given by
k 12,W = 7.9 × 10– 5n0.8 (43)
The mass transfer coefficient, kRH,O, of LIX84I in Shellsol71 is estimated from kI2,hep by the use ofthe correlation between the mass transfer coefficient and the diffusion coefficient given by Asai etal.52), where the diffusion coefficients are obtained from Sherwood and Pigford 47).
Where V is molar volume at normal boiling point and the subscript, ker, expresses kerosene.Shellsol71 is regarded as the same as kerosene. In the same way, the mass transfer coefficients,kA,W, of Cu2+ and kH,W, of H+ in the aqueous phase are determined as follows.
Where suffix i and b express interface and bulk of solutions, respectively. Here, it is assumedthat CRH,i is independent of the diffusion of complex (CuR2) in the organic phase. Equations(48)and (49) are derived on the basis of the following extractive reaction.
k RH,O = k RH,ker = DRH,ker / DI2,hep
2 / 3k I2,hep
=DRH,ker
DI2,ker
DI2,ker
DI2,hep
2 / 3
k I2,hep =VI2
VRH
0.6DCO2,ker
DCO2,hep
2 / 3
k I2,hep (44)
k A,W = DCu,W /DI2,W
2 / 3k I2,W (45)
k H,W = DH,W /DI2,W
2 / 3k I2,W (46)
Cu2 + + 2RH → CuR2 + 2H+ (50)
C H,i = C H,b + 2N A / k H,W (48)
C A,i = C A,b – N A / k A,W (47)
C RH,i = C RH,b – 2N A / k RH,O (49)

42 K. Takahashi and S. NII
Fig.41 Effects of concentrations of copper, hydrogen ion and LIX84I on extraction rate of copper
Given the interfacial concentrations, the effects of these species on the extraction rate of copperare shown in Fig.41. The apparent extraction rate of copper by hydroxyoxime was given byKomasawa et al.54) as follows:
The backward extraction rate is neglected in Eq.(51). The extraction rate is generally given byforward and backward reactions, the backward reaction rate for the present case, however, de-creases with the increase in pH value and is very small for pH > 2 (Takahashi and Takeuchi55)).Since the main component of LIX84I is also hydroxyoxime, the extraction rate of copper in thepresent case may be expressed by Eq.(51), and the reaction rate constant kf is determined as 4.26 ×10⁻⁷ m/s.
8.2.4 Calculation of copper extraction within MS column
We aim to calculate the outlet concentration of copper, CA,out, given the inlet concentrations ofcopper, CA,in, hydrogen ion, CH,in, extractant, CRH,in, the aqueous phase flow rates, Qc, the organicphase flow rate, Qd, the agitation speed, n, and the number of stages, P.
Schematic diagram for the calculation is shown in Fig.42. A stage is counted from the bottomtoward the top of the column. The value of CA,out, which is equal to CA,1 under the assumption ofcomplete mixing within the stage, is assumed, and the calculation is carried out stage to stage fromthe bottom toward the top of the column. If the calculated value, CA,P+1 is not equal to CA,in, the
NA = k fCACRH / CH (51)

43Behavior of Multistage Mixer-settler Extraction Column
calculation is repeated with another assumed value of CA,out until CA,P+1 = CA,in, and the value CA,out
is determined.For the p-th stage, CA,p+1, CH,p+1 and CRH,p are given by the following equations, respectively.
Fig.42 Diagram for calculation of multi-stage counter-current extraction
Where NA,p is the extraction rate in p-th stage, a is the specific interfacial area in the mixer and VM
is the volume of the mixer. When CA,p, CH,p and CRH,p-1 are known, CRH,p is given by Eq.(54) andthe interfacial concentrations CA,p,i, CH,p,i and CRH,p,i are obtained from the same equations asEqs.(47)–(49). By substituting these interfacial concentrations into Eq.(51), the following 2nd or-der equation of NA,p is obtained.
ANA,p2 + BNA,p + C = 0 (55)
Where
CA,p + 1 = CA,p + NA,paVM / Qc (52)
CH,p + 1 = CH,p – 2N A,paVM / Qc (53)
CRH,p = CRH,p – 1 – 2N A,paVM / Qd (54)
A = k f
1k A,c
2aV M
Q d
+ 2k RH,d
– 2k H,c

44 K. Takahashi and S. NII
where kA,c and kH,c are the mass transfer coefficient of copper and hydrogen ion in the continuousphase, respectively, and kRH,d is the mass transfer coefficient of extractant in the dispersed phase.The value of NA,p is determined from Eq.(55), and CA,p+1, CH,p+1 and CRH,p are determined fromEqs.(52)–(54).
8.2.5 Specific interfacial area
The specific interfacial area, a (= 6φ /d32), is determined from the Sauter mean diameter, d32,of the dispersed drops and the holdup, φ, of dispersed phase in the mixer. The value of d32 in theMS column was measured by Takahashi and Takeuchi21) for tributylphosphate (TBP)-heptane-wa-ter system, and given by Eq.(11). The interfacial tension, γ , which appeared in Eq.(11), was mea-sured for the present system by the drop volume method and shown in Fig.43.
The dispersed phase holdup, φU, above the impeller in the MS column differed largely fromφL below the impeller22). Since agitation above the lifter-turbine impeller is mild, φU can be ex-pressed by Eq.(7) in term of the slip velocity, vs, between two phases rising concurrently aroundthe impeller. By using vs measured for TBP-heptane-water system22), the ratios of vs to the termi-nal settling velocity, vt, are plotted against φL in Fig.44. The value of vt is calculated by Eqs.(21)and (22). The value of vs/vt for TBP free heptane is independent of φL and a simple relation wasobtained.
Fig.43 Interfacial tension of LIX84I-heptane-water system
C = k fCA,pCRH,p – 1
vS = 0.21vt (56)
B = –k f C A,p
2aV M
Q d
+ 2k RH,d
+C RH,p – 1
k A,c
– C H,p

45Behavior of Multistage Mixer-settler Extraction Column
On the other hand, vs/vt for TBP-heptane solution increased with the increase in φL, and exceededunity for large concentrations of TBP. Since vs can not exceed vt, the increase in vs/vt might resultfrom the application of Eq.(11) to TBP-heptane solution. The drop size in the mixer may increasewith the dispersed phase holdup in the same way as in the stirred vessel56). The effect of dispersedphase holdup on the drop size depends on the drop coalescence in the mixer. The coalescencebehavior may vary with the materials consisting two-phase system as well as the existence of masstransfer between phases (Komasawa and Ingham5)). Equation (11) was derived from the experi-ments with small holdup of dispersed phase, where the coalescence of drops could be neglected.The actual drop size for TBP solution might be larger than that calculated from Eq.(11) because ofthe drop coalescence. If the drop size is estimated correctly, vs may be determined from Eq.(56).For the present extraction system, it is assumed that the coalescence of drop is negligible, and φU isdetermined from Eq.(7) by use of Eq.(56).
The holdup φL below the impeller can be determined from the assumption that the dispersedphase transfers from below to above the impeller by two mechanisms. One is the transfer by mix-ing due to the difference between φL and φU and the other is the transfer by carriage of total flow(Takahashi and Takeuchi22)). The value of φL is calculated by Eqs.(5)–(7) given Qd and Qc by theuse of φU determined above. In practical calculations, d32 can be calculated by the trial and errormethod with an assumed value of θd, where θd is determined with φL obtained by use of d32. Thecalculation is repeated until the assumed value of θd coincides with the calculated one. The spe-cific interfacial area was determined with the average holdup obtained from φL and φU by weight-ing the volumes below and above the impeller.
8.2.6 Mass transfer coefficients within MS column
It was shown by Nii et al.42) that the mass transfer coefficients in the dispersed and the con-tinuous phases within the MS column can be determined on the basis of mass transfer within andaround a rigid sphere, because the dispersed drop is very small (< 1 mm). The dispersed phasemass transfer coefficient, kRH,d, for the extractant is calculated by Eqs.(16)–(19). The mass trans-fer coefficients, kA,c and kH,c, of copper and hydrogen ion in the continuous phase are determined
Fig.44 Ratio of slip velocity to terminal settling velocity for TBP-heptane-water system

46 K. Takahashi and S. NII
from Eqs.(21)–(23).The outlet concentration CA,out from the extraction column for the experimental conditions
was calculated with the extraction rate constant kf = 4.26 ×10⁻⁷ m/s, and shown as X in Fig.39 withbroken lines. The observed values of X are much smaller than the calculated ones for both extrac-tant concentrations, CRH,in = 1.78 and 8.78 mol/m3.
8.2.7 Extraction rate with purified extractant
When copper is extracted by LIX65N within the FISV (Takahashi and Takeuchi57)), the ex-traction rates with purified extractant differs largely from those with unpurified one. And the be-havior of the extraction rate with unpurified extractant within the dispersed stirred vessel coin-cides with that of purified extractant within the FISV. The behavior can be explained thus: thesurface active impurities might affect the extraction rate and the effect might be small for the dis-persed system because of the low interfacial concentration of the impurities due to the large spe-cific interfacial area. Since the same effect of the impurities can be expected for the present ex-tractant LIX84I, the extraction rates are measured with the purified LIX84I within the FISV. Theextraction rate increases by ca. 4.5 times by the purification of extractant as shown in Fig.45, andthe rate constant is given by kf = 1.91 × 10⁻⁶ m/s for the purified extractant.
By using this rate constant, the outlet concentration CA,out from the extraction column is calcu-lated for the experimental condition and shown in Fig.39 with solid lines. The calculated value ofX agrees with the observed values. This indicates that the effect of impurities on the extractionrate might decrease with the increase in the specific interfacial area for the extractant LIX84I, too.
8.2.8 Simulation for various conditions of extraction column
The values of X calculated for various stage numbers are shown in Fig.46. The values de-crease exponentially with the increase in the stage number, i.e., the counter-current multi-stageextraction is useful to remove metal ion from the dilute solution. The value of X also decreaseswith the increase in CRH,in, i.e., the low copper loading ratio to extractant is effective for the copper
Fig.45 Comparison between extraction rates with and without purification of extractant

47Behavior of Multistage Mixer-settler Extraction Column
removal. The effects of both the continuous and the dispersed phase flow rates on X are shown inFig.47. The calculations are carried out for a constant copper loading ratio to the extractant, CA,inQc/(2CRH,inQd) = 0.15, i.e., CRH,in is varied in proportion to Qc for a given set of Qd and CA,in. When Qc
is small, X for small Qd is smaller than that for large Qd, which indicates that the increase in CRH,in
under a given loading ratio is more effective for the copper removal than the increase in Qd. Thevalue of X increases with the increase in Qc, because the extraction efficiency decreases due to the
Fig.47 Effects of flow rates and extractant concentration on calculated X
Fig.46 Calculated X for various stage number

48 K. Takahashi and S. NII
decrease in the residence time with Qc. The increase in X with Qc is larger for smaller Qd and thecurve for Qd = 10–6 m3/s went over the curves for Qd = 4 ×10⁻⁶ and 1.6 ×10⁻⁵ m3/s. This resultedfrom the fact that CRH,in increases inversely proportional to Qd under a constant value of CA,inQc/(2CRH,inQd), and the mass transfer resistance in the continuous phase increases with the increase inCRH,in as described later. In the case of the loading ratio 0.15, copper removal is small at large Qc.Then, calculation for various CRH,in are carried out with relatively large Qc (Qc = 5 ×10⁻⁵ m3/s wasabout half of the maximum throughput given by Nii et al.18)) and shown in Fig.47 with lines 4, 5and 6. The removal of copper is effective at large CRH,in, and it is more effective with the columnof large stage number (P = 10). When the pH of feed solution is high, pHin = 4.0, copper is re-moved effectively with small CRH,in. In addition, the decrease rate in X with CRH,in is small in therange of large CRH,in, because the mass transfer resistance in the continuous phase becomes signifi-cant in this condition.
The extraction rate is expressed as follows by the use of the extraction driving force, CA, andthe total resistance, RT, for extraction.
NA = ∆CA /RT =k fCA.iCRH.i / CH.i (57)
When the mass transfer resistance is negligible, the extraction resistance is given by only reactionresistance, Rr, and the interfacial concentrations become equal to the bulk concentrations. Then
In the same way, the following equations are obtained with the resistance Rr + Rc when mass trans-fer resistance in the dispersed phase is negligible and Rr + Rd when mass transfer resistance in thecontinuous phase is negligible, respectively.
Where Rc and Rd are the mass transfer resistance in the continuous phase and the dispersed phase,respectively. From Eqs.(57) - (60), the ratios of individual resistance to the total resistance aregiven by
NA = ∆CA / R r = k fCACRH / CH (58)
Figure 48 shows the values of Rc/RT and Rd/RT within the top stage. The resistance of coppertransfer within the aqueous phase increased with the increase in CRH,in, and Rc/RT for pHin = 4.0reached 0.86 at CRH,in = 100 mol/m3. This indicated that the mass transfer in aqueous phase wasthe controlling step for large CRH,in, while the mass transfer resistance in the organic phase de-creased with CRH,in. For pHin = 2.6, the mass transfer resistance can be considered negligible ex-cept for the aqueous resistance at large CRH,in.
Copper is extracted by LIX84I from the dilute solution with a five-stage mixer-settler extrac-
N A = ∆C A / (R r + R c) = k fC A.iC RH / C H.i (59)
N A = ∆C A / (R r + R d) = k fC AC RH.i / C H (60)
R d / R T = C A.iC H(C RH – C RH.i) / (C AC H.iC RH) (62)
R c / R T = C RH.i(C AC H.i – C A.iC H) / (C AC H.iC RH) (61)
R r / R T = C A,iC HC RH,i / (C AC H,iC RH) (63)

49Behavior of Multistage Mixer-settler Extraction Column
tion column. The ratio X of the outlet concentration to the inlet concentration of copper decreaseslargely with the agitation speed n and is 0.002 for n = 10 s–1 and CA,inQc/(2CRH,inQd) = 0.05. Thisindicates that an effective removal of copper is achieved by the extraction with multi-stage extrac-tion column. The extraction rate of copper by LIX84I measured with a flat interface stirred vesselvaries with and without the purification of extractant. The extraction rate with the purified extrac-tant is ca. 4.5 times larger than that with the unpurified one. For the simulation of the extractionwithin the mixer-settler column, the calculation method taken into account the mass transfer andthe extractive reaction as well as hydrodynamics is proposed. The simulated results agree wellwith the observed results when the extraction rate of purified extractant is used. This indicatesthat the effect of impurities on the extraction rate may be reduced for the dispersed system, be-cause the interfacial concentration of surface-active impurities decreases with the increase in thespecific interfacial area. The simulated results suggest that the copper removal is improved byincreasing the stage number. The increase in the extractant concentration under a given copperloading ratio is more effective for copper removal than the increase in the dispersed phase flowrate, furthermore the mass transfer resistance within aqueous phase is significant only at large ex-tractant concentrations.
References
1) Godfrey, J.C. and M.J. Slater; Liquid-Liquid Extraction Equipment, p. 227–735, John Wiley & Sons,New York (1994).
2) Sarkar, S. and C.R. Phillips; “Characterization of Hydrodynamic Parameters in Rotating Disc andOldshue-Rushton Columns. Hydrodynamic Modeling, Drop Size, Holdup and Flooding,” Can, J. Chem.Eng., 63, 701–709 (1985).
3) Kumar, A., L. Steiner and S. Hartland; “Capacity and Hydrodynamics of an Agitated Extraction Col-umn,” IEC Proc. Des. Dev., 25, 728–733 (1986).
4) Kirou, V.I., L.L. Tavlarides, J.C. Bonnet and C. Tsouris; “Flooding, Holdup, and Drop Size Measure-
Fig.48 Ratio of mass transfer resistance to total resistance foe copper extraction

50 K. Takahashi and S. NII
ments in a Multistage Column Extractor,” AIChE J., 34, 283–292 (1988).5) Komasawa, I. and J. Ingham; “Effect of System Properties on the Performance of Liquid-Liquid Extrac-
tion Column II,” Chem. Eng. Sci., 33, 479–485 (1978).6) Sheibel, E.G.; “Fractional Liquid Extraction,” Chem. Eng. Progr., 44, 681–690 (1948).7) Bonnet, J.C. and G.V. Jeffreys; “Hydrodynamics and Mass Transfer Characteristics of a Scheibl Extrac-
tor,” AIChE J., 31, 788–794 (1985) .8) Steiner, L., E.Von Fisher and S. Hartland; “Performance of a Liquid-Liquid Extraction Column with
Enhanced Coalescence Lattice,” AIChE Symp. Ser., 80, No.238, 130–138 (1984).9) Gaubinger, W., G. Husung and R. Marr; “Operating Behaviour of the Self-stabilizing High Performance
Extractor SHE,” Ger. Chem. Eng., 6, 74–79 (1983).10) Bailes, P.J. and E.H. Stitt; Chem. Eng. Res. Des., 65, 514–523 (1987).11) Treybal, R.E.;” A Versatile, New Liquid Extractor,” Chem. Eng. Progr., 60, 77–82 (1964).12) Wirz, W.; German Patent 1918225 (1968).13) Rincon-Rubio, L.M., A. Kumar and S. Hartland; “Characterization of Flooding in Wirz Extraction Col-
umn,” Can. J. Chem. Eng., 71, 844–851 (1993).14) Horvath, M. and S. Hartland; “Mixer-Settler-Extraction Column: Mass-Transfer Efficiency and Entrain-
ment,” IEC Proc. Des. Dev., 24, 1220–1225 (1985).15) Anon: “Extractor Agitates, then Separates,” Chem. Eng., 68, May 1, 58–60 (1961).16) Misek, T. and J. Marek; “Asymmetric Rotating Disc Extractor.” Brit. Chem. Eng., 15, 202–207 (1970).17) Takahashi, K., H. Nakashima, S. Nii and H. Takeuchi; “Maximum Throughput in Multistage Mixer-Set-
tler Extraction Column,” Kagakukougaku Ronbunshu, 19, 440–445 (1993).18) Nii, S., J. Suzuki and K. Takahashi; “Effect of Internal Structure on Throughput of Mixer-Settler Extrac-
tion Column,” J. Chem. Eng. Japan, 30, 253–259 (1997).19) Takahashi, K., S. Nii, K. Nakanishi and H. Takeuchi; “Stage Efficiency of Mixer-Settler Extraction Col-
umn,” J. Chem. Eng. Japan, 26, 715–719 (1993).20) Kagakukougaku Kyoukai; Kagakukougaku Benran, 5th Ed., p. 261–264, Maruzen, Tokyo, Japan (1988).21) Takahashi, K. and H. Takeuchi; “Interfacial Area of Liquid-Liquid Dispersion in a Mixer-Settler Extrac-
tion Column,” Solvent Extraction 1990, p. 1357–1362, Elsevier, Kyoto, Japan (1992).22) Takahashi, K. and H. Takeuchi; “Holdup of Dispersed Phase in a Mixer-SettlerExtraction Column,”
Chem. Eng. Japan, 23, 12–17 (1990).23) Thornton, J.D.; “Spray Liquid-Liquid Extraction Columns: Prediction of Limiting Holdup and Flooding
Rates,” Chem. Eng. Sci., 5, 201–208 (1956).24) Takahashi, K.; Chap.4 Drop Size and Mass Transfer in Liquid-Liquid Dispersion, Agitation and Mixing,
p. 55–67, Maki Shoten, Tokyo, Japan (1990).25) Fisher, E.A.; Dr. thesis, ETH, Zurich (1973).26) Imai, M. and S. Furusaki; “Sauter Mean Drop Size of W/O/W Emulsions in Agitated Vessel,”
Kagakukougaku Ronbunnshu, 10, 707–713 (1984).27) Takahashi, K., F. Ohtsubo and H. Takeuchi; “Mean Drop Diameter of W/O and W/O/W Dispersions in
an Agitation vessel,” Kagakukougaku Ronbunnshu, 6, 651–656 (1980).28) Hinze, J.O.; “Fundamentals of Hydrodynamic Mechanism of Splitting in Dispersion Processes,” AIChE
J., 1, 289–295 (1955).29) Calderbank, P.H.; “Physical Rate Processes in Industrial Fermentation: The interfacial Area in Gas-Liq-
uid Contacting with Mechanical Agitation,” Trans. Inst. Chem. Engrs., 36, 443–463 (1958).30) Chen, H.T. and S. Middleman; “Drop Size Distribution in Agitated Liquid-Liquid Systems,” AIChE J.,
13, 989–995 (1967).31) Coulaloglou, C.A. and L.L. Tavlarides; “Drop Size Distributions and Coalescence Frequencies of Liq-
uid-Liquid Dispersions in Flow Vessels,” AIChE J., 22, 289–297 (1976).32) Mlynek, Y. and W. Resnick; “Drop Sizes in an Agitated Liquid-Liquid System,” AIChE J., 18, 122–127
(1972).33) Vermeulen, T., G.M. Williams and G.E. Langlois; “Interfacial Area in Liquid-Liquid and Gas-Liquid
Agitation,” Chem. Eng. Progr., 51, 85–94F (1955).34) Konno, M. and S. Saito; “Correlation of Drop Sizes in Liquid-Liquid Agitation at Low Dispersed Phase
Volume Fractions,” J. Chem. Eng. Japan, 20, 533–535 (1987).

51Behavior of Multistage Mixer-settler Extraction Column
34) Konno, M., M. Aoki and S. Saito; “Scale Effect on Breakup Process in Liquid-Liquid Agitated Tanks,”J. Chem. Eng. Japan, 16, 312–319 (1983).
35) Nnarsimhan, G., G. Nejtelt and D. Rambrishua; “Breakage Functions for Droplets in Agitated Liquid-Liquid Dispersions,” AIChE J., 30, 457–467 (1984).
36) Hong, P.O. and J.M. Lee; “Changes of the Average Drop Sizes during the Initial Period of Liquid-LiquidDispersions in Agitated Vessels,” IEC Proc. Des. Dev., 24, 868–872 (1985).
37) Skelland, A.H.P. and J.M. Lee; “Drop Size and Continuous-Phase Mass Transfer in Agitated Vessels,”AIChE J., 27, 99–111 (1981).
38) Bapat, P.M. and L.L. Tavlarides; “Mass Transfer in a Liquid-Liquid CFSTR,” AIChE J., 31, 659–666(1985).
39) Sada, E., K. Takahashi, K. Morikawa and S. Ito; “Drop Size Distribution for Spray by Full Cone Nozzle,”Can. J. Chem. Eng., 56, 455–459(1978).
40) Tsouris, C., V.I. Kirou and L.L. Tavlarides; “Drop Size Distribution and Holdup Profiles in a MultistageExtraction Column,” AIChE J., 40, 407–418 (1994).
41) Rincon-Rubio, L.M., A. Kumar and S. Hartland; “Drop-Size Distribution and Average Drop Size in aWirz Extraction Column,” Trans. IChemE., 72, 493–502 (1994).
42) Nii, S., J. Suzuki, K. Tani and K. Takahashi; “Mass Trasfer Coefficients in Mixer-Settler Extraction Col-umn,” J. Chem. Eng. Japan, 30, 1083–1089 (1997).
43) Takahashi, K., M. Nakano and H. Takeuchi; “Mass Trasfer Coefficients in a Flat Type Supported LiquidMembrane,” Kagakukougaku Ronbunshu, 13, 256–259 (1987).
44) Kumar, A. and S. Hartland; “Mass Transfer in a Kuhni Column,” Ind. Eng. Chem. Res., 27, 1198–1203(1988).
45) Darrall, K.G. and G. Oldham; “The Diffusion Coefficients of the Tri-iodide Ion in Aqueous Solution,” J.Chem. Soc.(A), 2584–2586 (1968).
46) Crank, J.; The Mathematics of Diffusion, p. 90–93, Oxford, UK (1975).47) Sherwood, T.K., R.L. Pigford and C.R. Wilke; Mass Transfer, p. 25–34, McGraw-Hill, Kogakusha, Ja-
pan (1975).48) Kagakukougaku Kyoukai; Kagakukougaku Benran, 5th Ed., p. 234–234, Maruzen, Tokyo, Japan (1988).49) Ranz, W.E. and W.R. Marshall; “Evaporation from Drops,” Chem. Eng. Progr., 48, 173–180(1952).50) Espinola, A., L.F.M. Oliveira and F.L. Ayres; “Flow Electrolysis for Decontaminating Plate Industries
Waste Water,” Extr. and Proc. for Treat. and Minim. of Waste 1994, TMS, p. 369–376, San Francisco,USA (1994).
51) Tani, K., T. Ohta, S. Nii and K. Takahashi; “Copper Removal from Dilute Aqueous Solution by Extrac-tion with Counter-Current Multi-Stage Column,” J. Chem.Eng. Japan, 31, 398–406 (1998).
52) Asai, S., J. Hatanaka and Y. Uekawa; “Liquid-Liquid Mass Transfer in an Agitated Vessel with a FlatInterface,” J. Chem. Eng. Japan, 16, 463–469 (1983).
53) Tsuboi, K., K. Takahashi and H. Takeuchi; “Simultaneous Trasfer of Two Metal Ions across Cation Ex-change Membrane,” J. Chem. Eng. Japan, 24, 220–225 (1991).
54) Komasawa, I., T. Ohtake and T. Muraoka; “Extraction Kinetics of Copper withHydroxyoxime Extract-ant,” J. Chem. Eng. Japan, 13, 204–208 (1980).
55) Takahashi, K. and H. Takeuchi; “Stripping Rates of Copper for LIX65N-Copper System,”Kagakukougaku Ronbunshu, 10, 543–544 (1984).
56) Davies, G.A.; Science andPractice of Liquid-Liquid Extraction, J.D. Thornton(ed.), p. 247–252, Oxford,UK (1992).
57) Takahashi, K. and H. Takeuchi; “Rates of Copper Extraction by LIX65N,” Kagakukougaku Ronbunshu,10, 409–414 (1984).