becoming a good marketing analyst - sas group presentations... · modern marketing”, forbes...
TRANSCRIPT
Becoming a Unicorn, a Leprechaun, or a Good Marketing AnalystFairy Tales Really Can Come True
0
Toronto Area SAS Society
December 9th, 2016
Presented by Emma Warrillow
About the presenter
A marketing strategist with a talent for numbers, Emma Warrillow uses
analytics as the foundation for customer-centric marketing strategies. Emma
has worked in both the corporate and consulting side of marketing analytics
for more than two decades.
Through her company, DiG (Data Insight Group Inc.), Emma and her team of
senior database and analytics professionals help companies understand their
customer data and make sense of what it is saying about their customers.
With a Masters degree in Management Sciences (University of Waterloo) and
an undergraduate degree in Mathematics and Statistics (Queen’s University),
Emma is uniquely qualified to understand the analytics and business of
customer relationship strategies.
She is a recognized expert in her field and is a highly sought-after speaker,
judge, panelist, and frequent contributor to industry publications.
Emma makes data make sense.
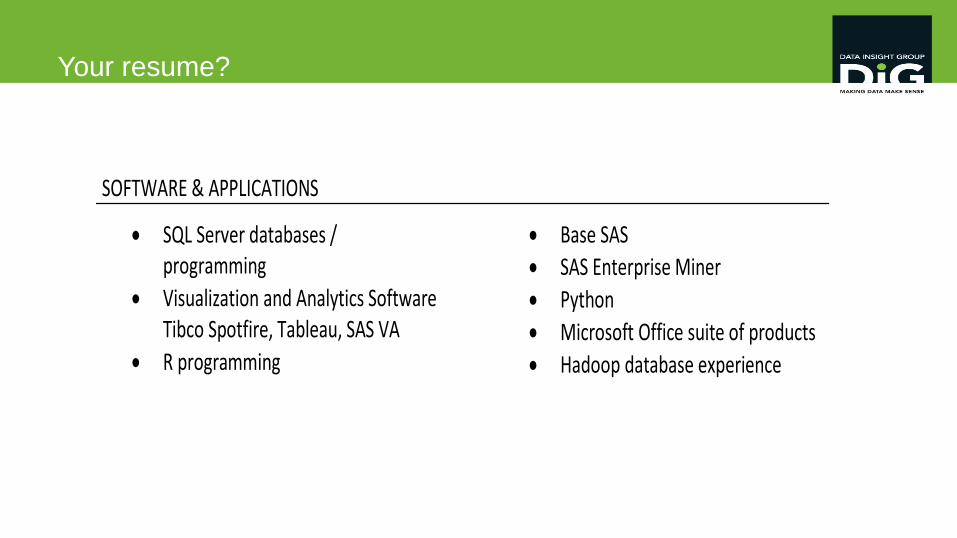
Your resume?RONALD E. ANDERSON
SOFTWARE & APPLICATIONS
SQL Server databases / programming
Visualization and Analytics Software Tibco Spotfire, Tableau, SAS VA
R programming
Base SAS
SAS Enterprise Miner
Python
Microsoft Office suite of products
Hadoop database experience
EXPERIENCE
The Unicorns will Rule Modern Marketing
“It is no longer enough to be good at coding in SAS®—or a
whiz with Excel—and to know a few marketing buzzwords”
John Ellet – “The Rise of the Unicorns – Why Marketing Technologists Will Rule
Modern Marketing”, Forbes Magazine
Agenda
5 Keys to Becoming a “Unicorn” in Marketing Analytics :
• Putting on your business hat
• Asking the questions
• Telling the story
• Painting the picture
• Staying relevant
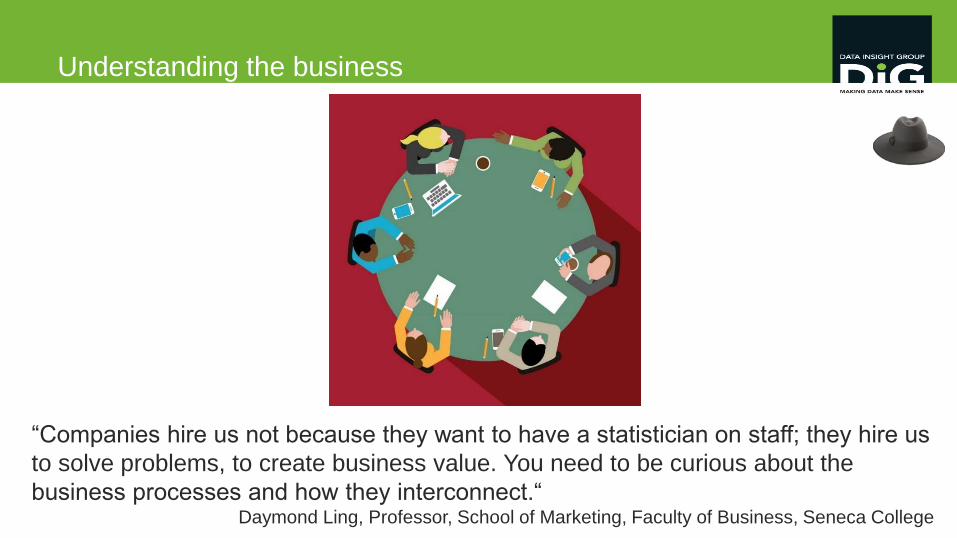
Understanding the business
“Companies hire us not because they want to have a statistician on staff; they hire us
to solve problems, to create business value. You need to be curious about the
business processes and how they interconnect.“ Daymond Ling, Professor, School of Marketing, Faculty of Business, Seneca College

Do you know how the business works? How is revenue generated in the organization? For each
product offering?
How does the organization define an active customer?
How many customers does the organization have?
Can they identify a customer who has churned? How is
churn defined?
How does a customer make a purchase?
• When is that information recorded?
• Where is that information recorded?
• What about a cancellation or a return?
What is the average purchase size?
The average lifetime value of a customer?
What are the organizational goals for this year?
Key metrics used to measure them? For your
department?
Establishing the Objective
Analytic objectives should align with business objectives.
“Everything that can be counted does not necessarily count;
everything that counts cannot necessarily be counted.”
Albert Einstein

Tapping into the business expert
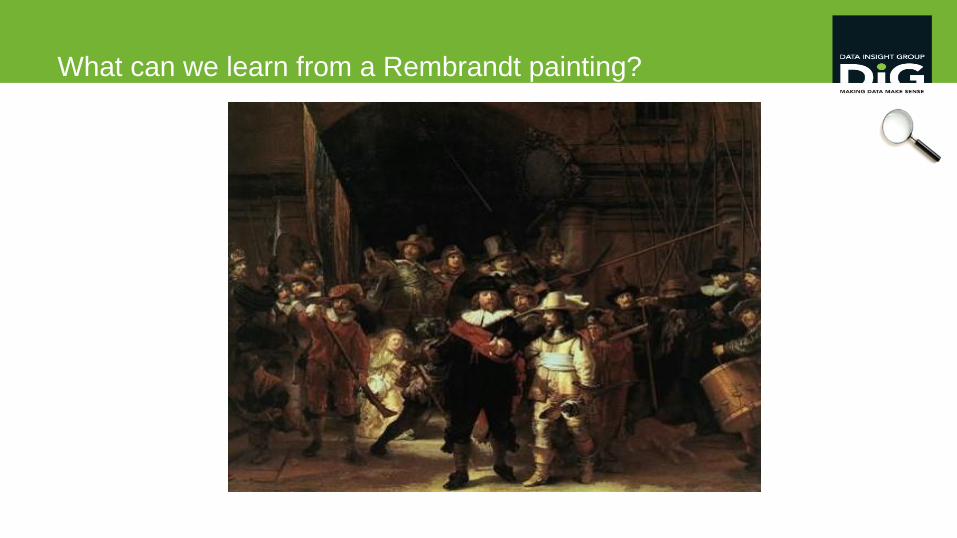
What can we learn from a Rembrandt painting?
Questions beget questions
Analysis is iterative and, as a result, takes time
The more you learn, the more you want to know
Each answer reveals more questions
At some point enough is enough

The Challenge: Analyst vs. Business
Effort / Time
Utility
Quick
And
Dirty
Sweet
Spot
Analysis
Paralysis
Analytical
Bias
Business
Bias
Quality
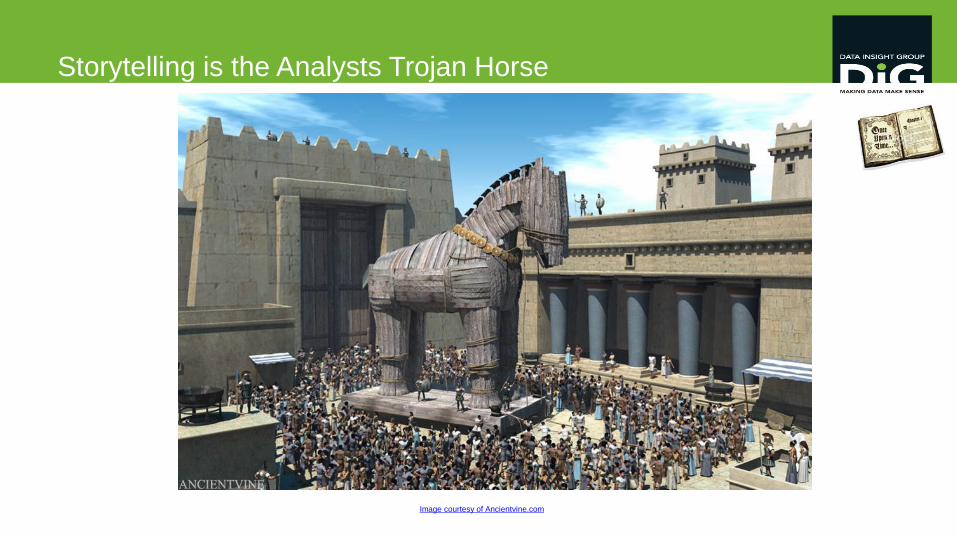
Storytelling is the Analysts Trojan Horse
Image courtesy of Ancientvine.com

The Power of the Story
“In the average one-minute speech, the typical student uses 2.5 statistics. Only
one student in ten tells a story. Those are the speaking statistics.
The “remembering” statistics, on the other hand, are almost a mirror Image:
When students are asked to recall the speeches, 63% remember the stories.
Only 5% remember any individual statistic.”
Chip and Dan Heath, Made to Stick
The Power of the Story
Memorable Impactful Personal
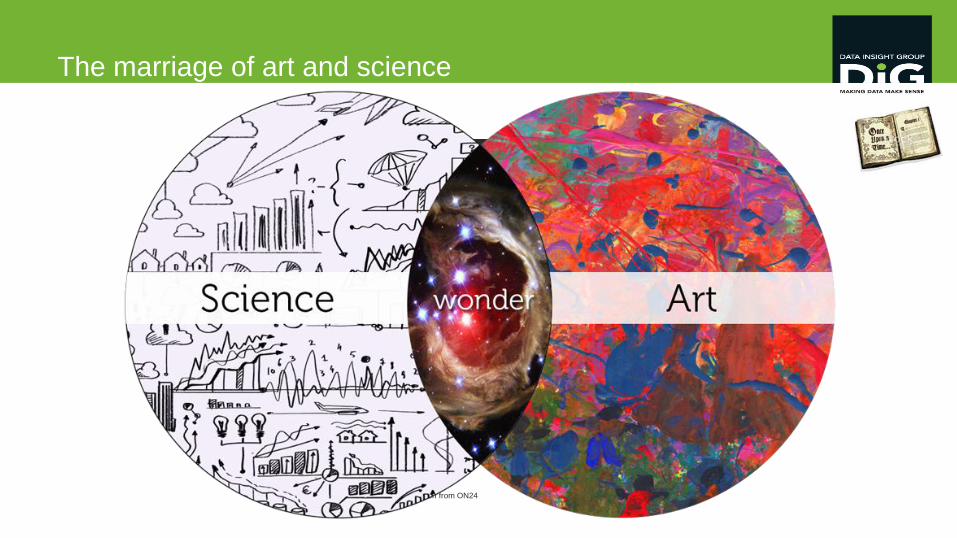
The marriage of art and science
Image used with permission from ON24
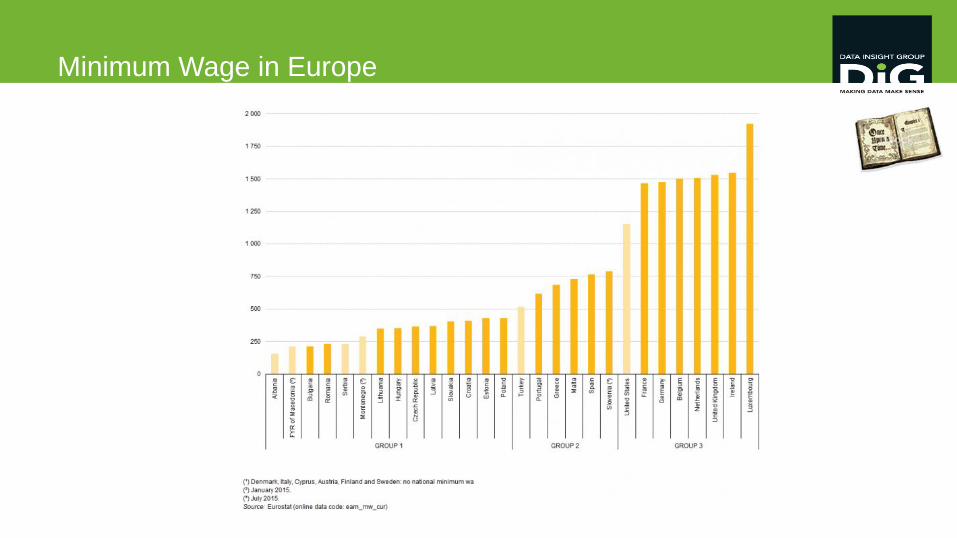
Minimum Wage in Europe
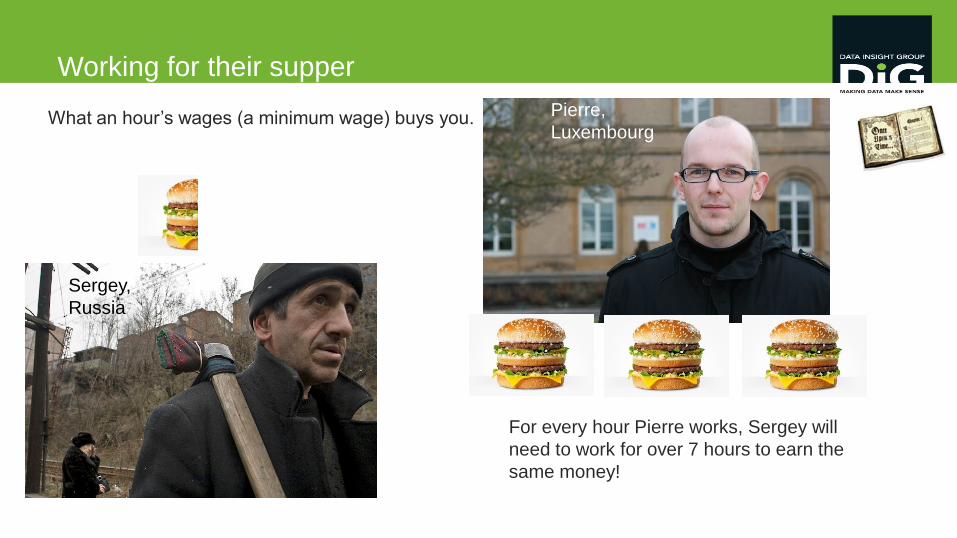
Working for their supper
What an hour’s wages (a minimum wage) buys you. Pierre,
Luxembourg
Sergey,
Russia
For every hour Pierre works, Sergey will
need to work for over 7 hours to earn the
same money!
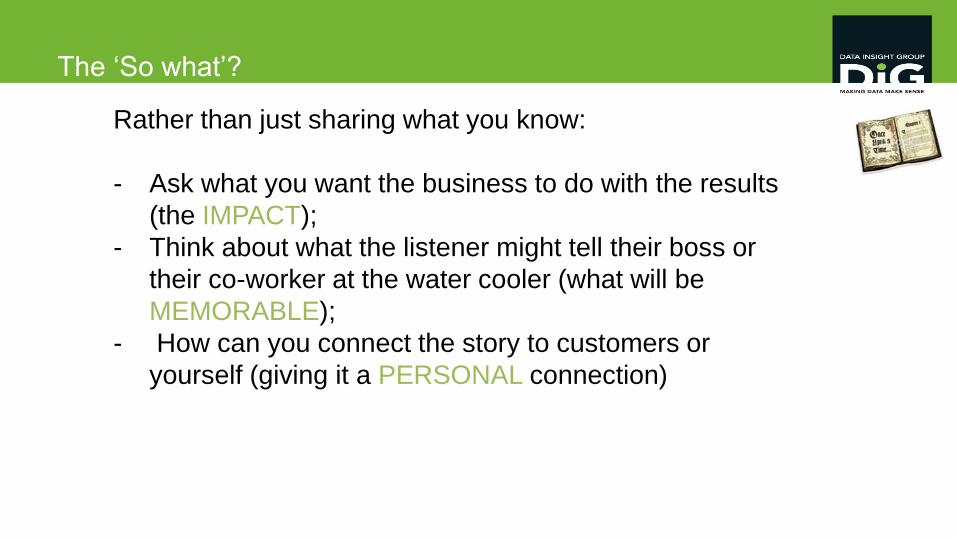
The ‘So what’?
Rather than just sharing what you know:
- Ask what you want the business to do with the results
(the IMPACT);
- Think about what the listener might tell their boss or
their co-worker at the water cooler (what will be
MEMORABLE);
- How can you connect the story to customers or
yourself (giving it a PERSONAL connection)
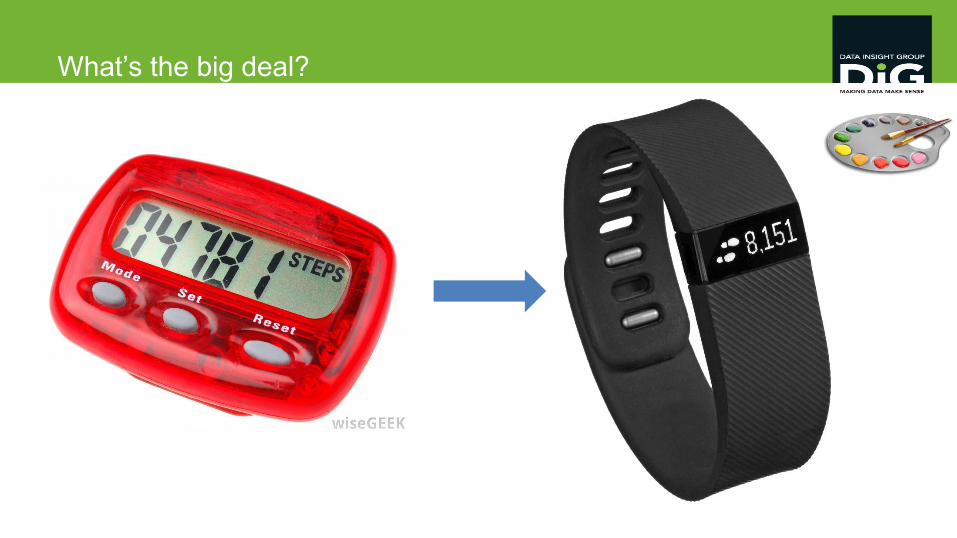
What’s the big deal?

Telling the Story in Pictures Personal
Memorable
Impactful
Creating the big picture
What story you are telling?
What questions are you answering?
Does my slide/report illustrate what I am trying to show?
Who is your audience? What level of information do they
require?
Is it visually interesting?
Or it is overwhelming?
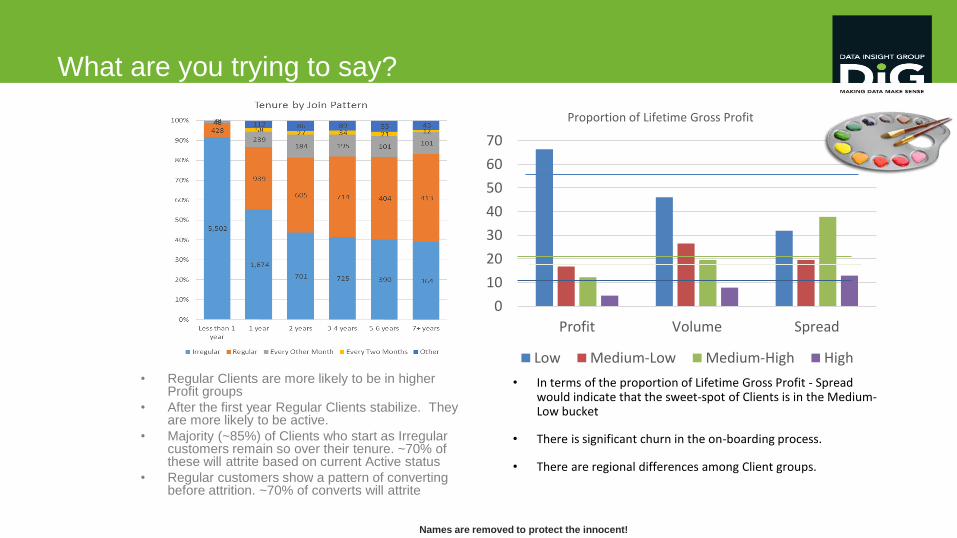
What are you trying to say?
• Regular Clients are more likely to be in higher Profit groups
• After the first year Regular Clients stabilize. They are more likely to be active.
• Majority (~85%) of Clients who start as Irregular customers remain so over their tenure. ~70% of these will attrite based on current Active status
• Regular customers show a pattern of converting before attrition. ~70% of converts will attrite
• In terms of the proportion of Lifetime Gross Profit - Spread would indicate that the sweet-spot of Clients is in the Medium-Low bucket
• There is significant churn in the on-boarding process.
• There are regional differences among Client groups.
Names are removed to protect the innocent!
0
10
20
30
40
50
60
70
Profit Volume Spread
Proportion of Lifetime Gross Profit
Low Medium-Low Medium-High High
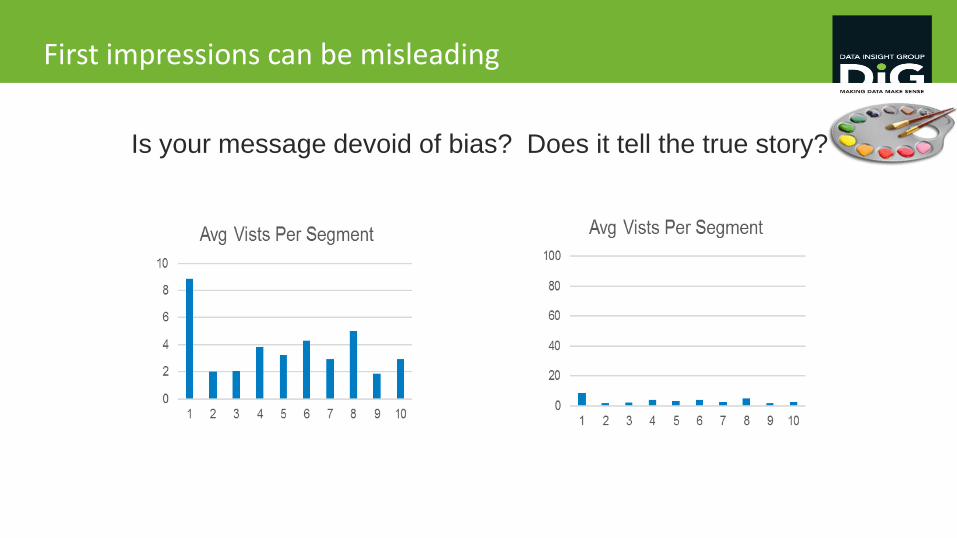
First impressions can be misleading
Is your message devoid of bias? Does it tell the true story?
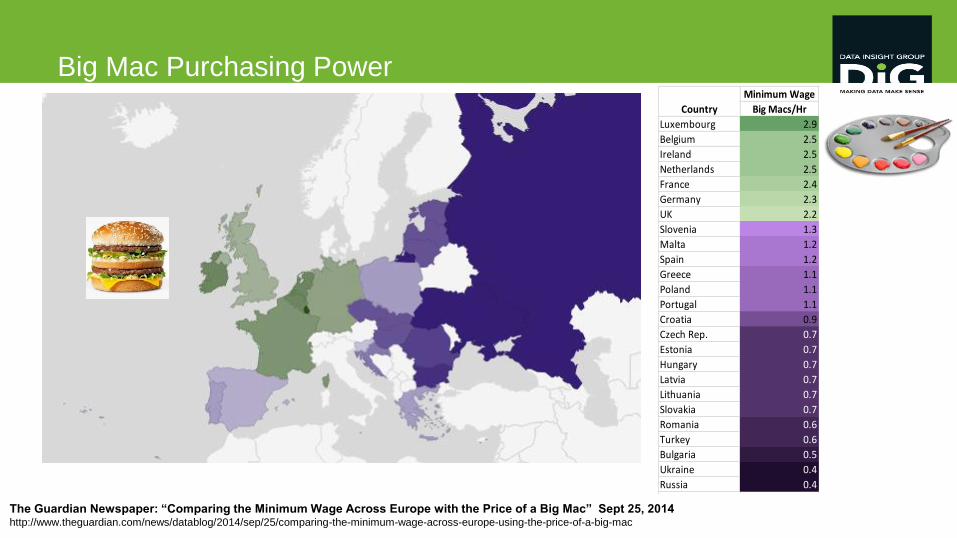
Big Mac Purchasing Power
The Guardian Newspaper: “Comparing the Minimum Wage Across Europe with the Price of a Big Mac” Sept 25, 2014http://www.theguardian.com/news/datablog/2014/sep/25/comparing-the-minimum-wage-across-europe-using-the-price-of-a-big-mac
Minimum Wage To earn a Big Mac
Big Macs/Hr Hrs Minutes
Luxembourg 2.9 0.34 21
Belgium 2.5 0.40 24
Ireland 2.5 0.40 24
Netherlands 2.5 0.40 24
France 2.4 0.42 25
Germany 2.3 0.43 26
UK 2.2 0.45 27
Slovenia 1.3 0.77 46
Malta 1.2 0.83 50
Spain 1.2 0.83 50
Greece 1.1 0.91 55
Poland 1.1 0.91 55
Portugal 1.1 0.91 55
Croatia 0.9 1.11 67
Czech Rep. 0.7 1.43 86
Estonia 0.7 1.43 86
Hungary 0.7 1.43 86
Latvia 0.7 1.43 86
Lithuania 0.7 1.43 86
Slovakia 0.7 1.43 86
Romania 0.6 1.67 100
Turkey 0.6 1.67 100
Bulgaria 0.5 2.00 120
Ukraine 0.4 2.50 150
Russia 0.4 2.50 150
Country
Knowing the landscape
Marketing today is complex and ever-changing!
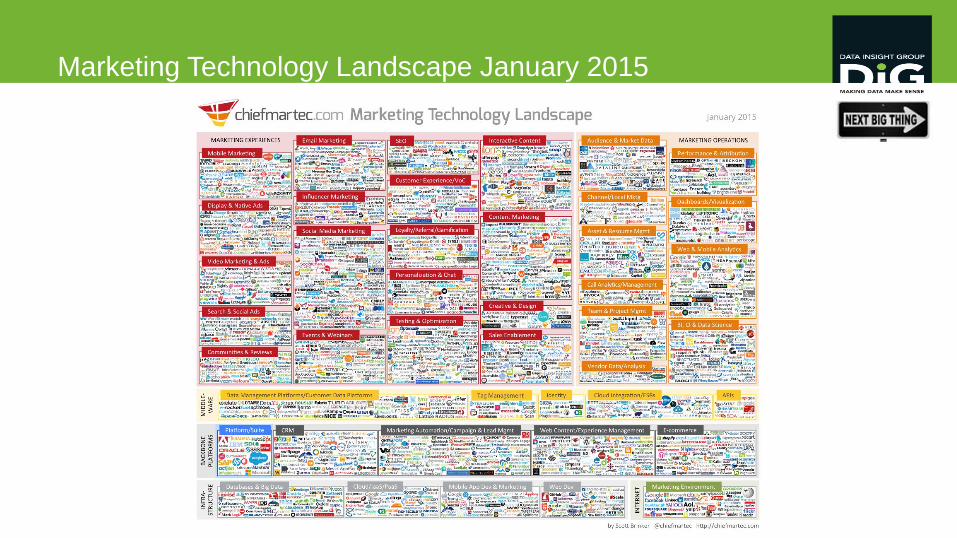
Marketing Technology Landscape January 2015
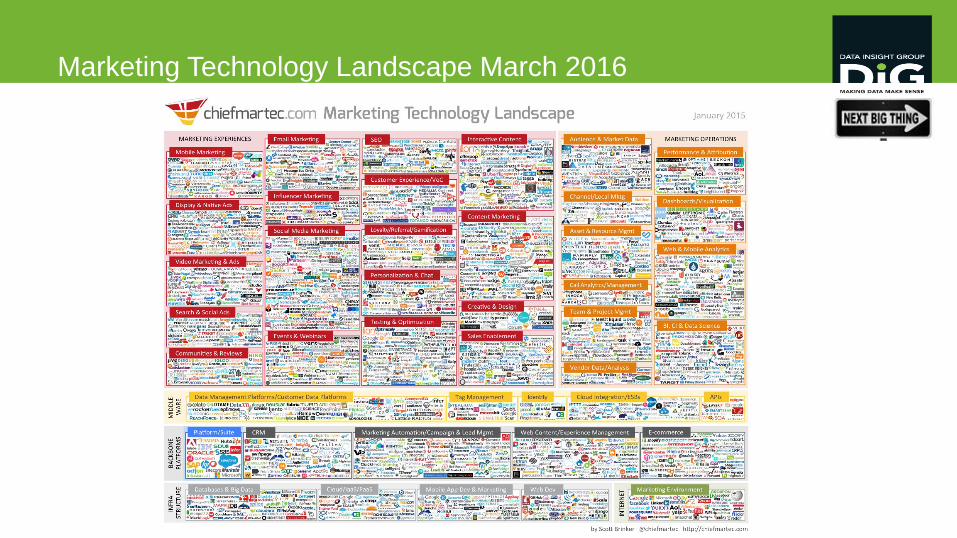
Marketing Technology Landscape March 2016
Stay connected!
• Read publications, blogs
• Follow industry leaders on Twitter or LinkedIn
• Join Meet-ups
• Connect with your vendors (e.g. SAS!) – ask for demos
• Attend conferences (SAS Global Forum!)
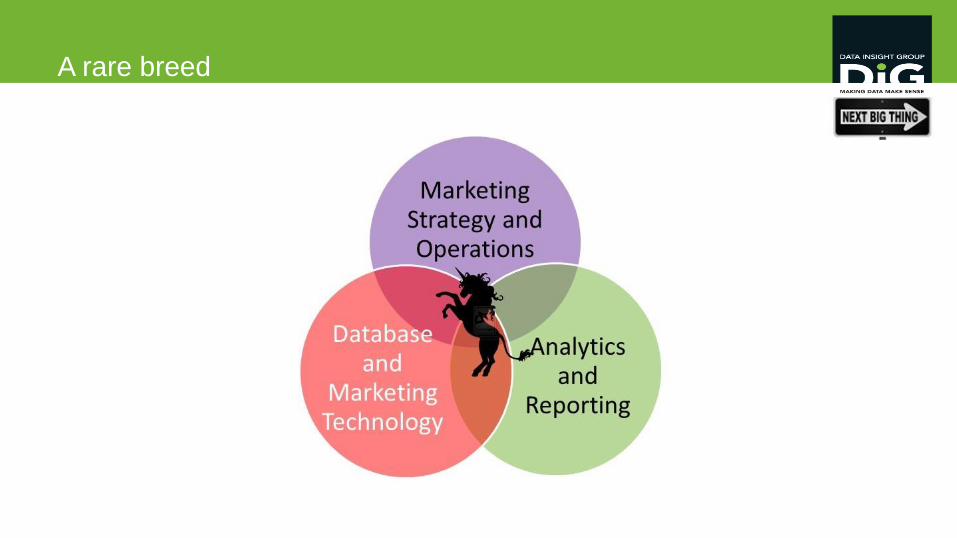
A rare breed
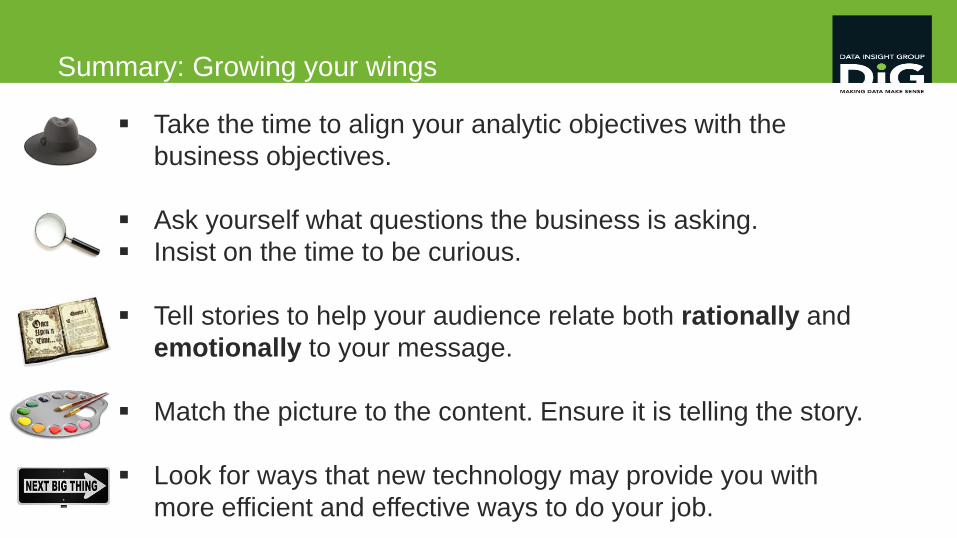
Summary: Growing your wings
Take the time to align your analytic objectives with the
business objectives.
Ask yourself what questions the business is asking.
Insist on the time to be curious.
Tell stories to help your audience relate both rationally and
emotionally to your message.
Match the picture to the content. Ensure it is telling the story.
Look for ways that new technology may provide you with
more efficient and effective ways to do your job.
31
Questions?