beattie oscar kellogg report final - rural leaders
TRANSCRIPT
i
Sustainable Impact Investing into New Zealand’s Horticultural Sector
Is there an Opportunity and Can We Capitalise on It?
Kellogg Rural Leadership Programme Course 41 2020
Oscar Beattie
ii
I wish to thank the Kellogg Programme Investing Partners for their continued support:
Disclaimer
In submitting this report, the Kellogg Scholar has agreed to the publication of this material in its submitted
form.
This report is a product of the learning journey taken by participants during the Kellogg Rural Leadership
Programme, with the purpose of incorporating and developing tools and skills around research, critical
analysis, network generation, synthesis and applying recommendations to a topic of their choice. The report
also provides the background for a presentation made to colleagues and industry on the topic in the final
phase of the Programme.
Scholars are encouraged to present their report findings in a style and structure that ensures accessibility and
uptake by their target audience. It is not intended as a formal academic report as only some scholars have
had the required background and learning to meet this standard.
This publication has been produced by the scholar in good faith on the basis of information available at the
date of publication, without any independent verification. On occasions, data, information, and sources
may be hidden or protected to ensure confidentially and that individuals and organisations cannot be
identified.
Readers are responsible for assessing the relevance and accuracy of the content of this publication & the
Programme or the scholar cannot be liable for any costs incurred or arising by reason of any person using or
relying solely on the information in this publication.
This report is copyright but dissemination of this research is encouraged, providing the Programme and author
are clearly acknowledged.
Scholar contact details may be obtained through the New Zealand Rural Leadership Trust for media,
speaking and research purposes.

iii
Executive Summary
The global perspective on investment is changing from traditional financial metrics to the relatively
recent idea of “impact investing”. This is where investments are made with the objectives of creating
a positive impact on environmental and social matters as well as receiving financial returns. The
growth in this movement has raised questions on whether there is potential within New Zealand’s
horticultural industry to market its perceived sustainability and therefore access this pool of capital.
With this theory in mind, this report looks to quantify the sustainability of the sector as well as
analysing the ability of the investment sector in New Zealand to take advantage of impact investing
theory.
To achieve this aim, this study uses an analytical framework to measure the carbon footprint of
orchards and vineyards as a proxy for environmental sustainability. The model uses a case study of
six different orchards and vineyards, owned by Craigmore Sustainables, to get an understanding of
the variability within the sector. In addition to the carbon footprint modelling, four informal
interviews of leading New Zealand primary industry investment managers and large-scale corporate
farmers and foresters were performed to get an understanding of the extent to which the primary
industry and its investors are concerned and report on sustainability.
Using the purpose-built carbon model, the producing orchards and vineyards were shown to have a
net positive impact on the environment through large sequestration by the plants and compost. The
two developing apple and kiwifruit orchards were shown to have comparatively high net emissions in
their early years. It was shown that there is significant variation in the sequestration potential of
different crop types (apples have the greatest potential sequestration per ha). In addition, the impact
of organics was tested across the kiwifruit orchards with organic management producing less
emissions overall than a conventional orchard.
Across the multiple interviews and literature reviewed, it was shown that there is significant variation
in the positioning of investment funds and corporate farmers on the idea of impact investing. In
general, foreign, and younger investors appeared to be further advanced in the understanding of
impact investment and its opportunities. However, for the New Zealand market to fully appreciate
and take advantage of impact investment opportunities that will arise in the primary industry space,
there needs to be changes to the consistency and transparency of sustainability reporting and fund
raising.
Although this study provides a baseline understanding of the potential sustainability of the
horticultural industry, there are several recommendations that need to be considered in either
further research or by leading organisations within the sector. These are:

iv
• Where possible, the increase in establishment and use of other quantifiable sustainability
metrics in addition to carbon footprinting.
• Provide actual on-orchard data to test the strength and applicability of the carbon footprint
modelling.
• Further research into the environmental sustainability of orchards in an intensity-based
approach such as kg CO2-eq per tray produced or per $ return.
In addition, there are also recommendations for the industry’s investment sector to capture the
possibilities of the impact investment movement:
• To increase the measurement and reporting of the sustainability of the industry and
therefore utilise the existing foreign impact investment interest as well as being prepared for
when the domestic New Zealand investor base ultimately increase their focus on impact
investment.
• For the industry to either create a universal accredited standard of reporting and
measurement for sustainability of a business or to align itself to current global reporting
standards and initiatives.
These recommendations will help to increase investor confidence in the industry and therefore
increase the potential uptake of the opportunity for impact investment.

v
Acknowledgements
I would like to thank the support of the Craigmore Sustainables team, both on and off orchard, for
their financial support, time, and willingness to help.
Without the time and understanding of the interviewee’s this project would not have been able to
have an application to the actual industry and would have had to rely on literature and other reading.
Therefore, I would like to thank the support of Nick Tapp from Craigmore Sustainables, Andrew
Watters from MyFarm Investments, Phil Taylor from Port Blakely and Colin Glass from Dairy Holdings
Limited.
To the Kellogg team; Chris, Scott, Patrick and Lisa. Your time and effort in creating this great
programme is massively appreciated and I will take away many of your personal anecdotes as well as
all of the rest of the course’s coaching and guidance.
And finally, to the rest of the Kellogg cohort, thank you for helping to make this a brilliant experience
and I look forward to continuing to build this network into the future.
vi
Table of Contents
Executive Summary ................................................................................................................. iii
Acknowledgements .................................................................................................................. v
Table of Contents .................................................................................................................... vi
List of Tables ......................................................................................................................... viii
List of Figures .......................................................................................................................... ix
Glossary of Terms & Abbreviations ............................................................................................ i
Introduction .............................................................................................................2
Literature Review ......................................................................................................4
2.1 Primary Industry Sustainability ................................................................................................. 4
2.2 Analytical Assessment for Sustainability ................................................................................... 5 2.2.1 Carbon Modelling Methodology .................................................................................. 5 2.2.2 Carbon Modelling on Horticultural Systems ................................................................ 5
2.3 Impact Investing ........................................................................................................................ 8
Methodology .......................................................................................................... 10
3.1 Research Approach ................................................................................................................. 10
3.2 Carbon Footprint Model ......................................................................................................... 10 3.2.1 Carbon Emissions Assumptions ................................................................................. 13 3.2.2 Carbon Sequestration Assumptions ........................................................................... 15 3.2.3 Soil Carbon Assumptions ............................................................................................ 18
3.3 Description of Case Study Orchards ........................................................................................ 19
Carbon Footprint Results ......................................................................................... 23
4.1 Orchard Net Carbon Footprint ................................................................................................ 23 4.1.1 Comparison Across Different Crop Types .................................................................. 25 4.1.2 Comparison Across Different Production Methodologies ......................................... 25 4.1.3 Comparison Across Different Plant Ages ................................................................... 27
Discussion ............................................................................................................... 30
5.1 Is the Industry Sustainable? .................................................................................................... 30 5.1.1 Horticulture’s Carbon Footprint ................................................................................. 30 5.1.2 Different Crop Types .................................................................................................. 30 5.1.3 Organic or Conventional?........................................................................................... 31 5.1.4 Footprint from Development ..................................................................................... 32 5.1.5 Additional Key Drivers ................................................................................................ 33 5.1.6 Model Comparison to Literature ................................................................................ 34
5.2 Impact Investing Opportunities .............................................................................................. 35 5.2.1 Gathering Diverse Opinions on Sustainable Investment and Reporting .................... 35 5.2.2 Investor Driven Sustainable Investment .................................................................... 36 5.2.3 Sustainability Reporting to Investors ......................................................................... 38 5.2.4 Fund Raising: Opportunities for Change .................................................................... 39
vii
Conclusion .............................................................................................................. 41
Recommendations .................................................................................................. 42
References .............................................................................................................. 43
Appendices ............................................................................................................. 46
9.1 Carbon Model Calculations and Assumptions ........................................................................ 46
9.2 Detailed Carbon Footprint Per Orchard .................................................................................. 51
viii
List of Tables
Table 1: Kiwifruit carbon emissions from research ............................................................................. 6 Table 2: Apple carbon emissions from research ................................................................................. 7 Table 3: Grape carbon emissions from research ................................................................................. 8 Table 4: Fuel use on a kiwifruit orchard (Page, 2009) ....................................................................... 13 Table 5: Property and orchard capital embodied emissions ............................................................. 14 Table 6: Fertiliser embodied emissions ............................................................................................. 14 Table 7: Agrichemical embodied emissions ...................................................................................... 15 Table 8: CO2 sequestration per plant relative to age ....................................................................... 15 Table 9: Production relative to maturity for kiwifruit and apples ..................................................... 16 Table 10: CO2 Sequestration of Different Grape Varieties ............................................................... 17 Table 11: Production relative to maturity for grapes ........................................................................ 17 Table 12: Soil carbon inputs from the plant (Page, 2009) ................................................................. 18 Table 13: N2O emissions ................................................................................................................... 19 Table 14: Sample orchards summary ................................................................................................ 19 Table 15: Carbon footprint per orchard for the 2019-20 season ...................................................... 23 Table 16: Carbon footprint of organic Angus and conventional Gold Crest orchards ...................... 27 Table 17: Comparison of kiwifruit emissions to literature ................................................................ 34

ix
List of Figures
Figure 1: Visual representation of carbon footprint model .............................................................. 12 Figure 2: Carbon Emissions Per Scope ............................................................................................... 24 Figure 3: Sequestration potential of the different crop types .......................................................... 25 Figure 4: Kiwifruit carbon footprint from development ................................................................... 28 Figure 5: Apple carbon footprint from development ........................................................................ 29 Figure 6: Sustainable Investment Spectrum (The Aotearoa Circle, 2020) ......................................... 35 Figure 7: Stimulus packages in response to Covid-19, by type of stimulus (Generation Investment
Management, 2020a) ................................................................................................... 37

i
Glossary of Terms & Abbreviations
Canopy Hectare Common measurement of an orchard or vineyard; the area that is under
canopy or covered in the permanent crop
Carbon Emissions The release of carbon into the atmosphere
Carbon Footprint Total greenhouse gas emissions caused by an individual, event, organization, service, or product, expressed as carbon dioxide equivalent
CO2-eq Carbon dioxide equivalent, is a metric measure used to compare the
emissions from various greenhouse gases on the basis of their global- warming potential, by converting amounts of other gases to the equivalent amount of carbon dioxide with the same global warming potential
ESG Environmental, Social, Governance; a type of reporting that measures the impact of a business on sustainability
GHG Greenhouse Gas; gases that trap heat in the atmosphere
GWP Global Warming Potential; average warming effect of greenhouse gases over
100 years after their emission using carbon dioxide as a reference
Impact Investing Investing with the intention of generating a measurable and beneficial societal and/or environmental impact alongside a financial return
LCA Life Cycle Analysis; a tool that provides a systematic way to consider the
impact of a material or component over its full life – from extraction to processing/manufacturing to construction/installation to use to eventual disposal
N2O Emissions Nitrous Oxide emissions, N2O is a gas commonly released from agricultural
processes and practices that has a GWP of 310 times more than CO2
Scope 1 Emissions Direct emissions; occur from sources that are owned or controlled by the company, for example emissions from the vehicle fleet
Scope 2 Emissions Electricity indirect emissions; emissions that are related to the generation of
electricity purchased by the company
Scope 3 Emissions Other indirect emissions; emissions that are a consequence of the activities of the company, but occur from sources not owned or controlled by the company
Sequestration A natural or artificial process by which carbon dioxide is removed from the atmosphere and held in solid or liquid form
Sustainability Meeting the needs of the present without compromising the ability of future
generations to meet their needs. Commonly referred to as having three pillars: economic, environmental and social

2
Introduction
In the last decade, a growing number of investors have changed their focus away from purely
financial returns. Where originally their primary, and often only, objective was financial returns, they
have recently become increasingly concerned about the impact that their investments are having on
the environment and society. This phenomenon has led to the theory of “impact investing” where
investors require their investments to generate a measurable societal, environmental and financial
return. This style of investing has until recently been focused on the larger European and US markets
with $30tn of global sustainable investment assets under management in 2018 (KPMG, 2019).
While this change in the financial sector has been occurring, New Zealand’s primary sector has also
been going through significant growth. This growth has been especially prominent in the horticultural
sector with on and off-farm investment in the industry increasing from $6.5 bn in 2000 to $57.3 bn in
2019 (New Zealand Institute for Plant and Food Research Ltd, 2020; The Horticulture & Food
Research Institute of New Zealand Ltd, 2000). Although sector growth has largely been due to is
profitability, there has also been an image created of a sustainable industry that is producing a
quality product without damaging our waterways or climate. Therefore, there lies a potential
opportunity for the growth in the impact investing sector and the horticultural industry to combine
and for New Zealand horticultural-based investments to be marketed as providing a positive impact
to the environment and society as well as providing financial returns. In other words, the sector
could be an impact investment.
This potential opportunity has already started to arise for Craigmore Sustainables; a farm, orchard,
and forest investment manager with more than 15,000 hectares under management in New Zealand.
As Craigmore has continued to grow, it has come to realise the increasing international focus on
sustainable or impact investing and the opportunities for an asset manager that produces returns
while managing the land sustainably.
However, there is little quantitative evidence of whether the horticultural industry is actually having
a positive or negative effect on the environment and society. Because of this lack of knowledge, this
research has the following aims:
1. To provide an understanding of the environmental impact of the horticultural industry
through the creation of a carbon footprint model as a proxy measure of sustainability

3
2. To provide an insight into the potential opportunities for impact investment and whether the
current reporting and fund-raising systems coming out of New Zealand’s primary sector are
“mature” enough to capitalise on this opportunity
To reach these aims this research has the following questions:
1. What is the potential carbon footprint of the horticultural industry? This question provides
understanding into the following three complexities of the sector:
a. How different crop types compare in their carbon emissions with a comparison
between a selection of kiwifruit and apple orchards and a wine grape vineyard?
b. How different production methods compare in their carbon emissions with a
comparison between conventional orchards and an organic kiwifruit orchard?
c. How different plant ages compare in their carbon emissions with a comparison
between orchards under development and mature producing orchards?
2. What are the changes, if any, that the New Zealand primary industry investment sector
needs to make to take advantage of any impact investment opportunities that may arise in
the next decade?
4
Literature Review
2.1 Primary Industry Sustainability
The term, “sustainability”, is used regularly in literature and is a common phrase used in public and
private policy and marketing. However, there are no universal definitions to the meaning of the
phrase. A commonly referred to definition was proposed by the World Commission on Environment
and Development, popularly called the Brundtland Report. This describes sustainable development
as “the development that meets the needs of the present without compromising the ability of future
generations to meet their needs” (WCED, 1987). However, there have been a number of issues raised
with this phrase, most notably that the “needs” of the present and future are not clearly articulated.
Alternative definitions have been proposed, but none have been universally accepted (Custance &
Hillier, 1998; Tellegen, 2006). Although there is no universal definition, it is commonly accepted that
the “needs” referred to in the WCED report are broken into three areas: economic, social and
environmental. This report only focuses on the environmental aspect of these three viewpoints.
When referring to environmental sustainability in a global sense, a common problem referred to is
global warming and the impact of greenhouse gases on changing climatic cycles. Although not the
only environmental concern, this is the most universal globally and arguably the most commonly
referenced. There have been several global agreements that have focused on reducing GHG with
targets to address climate change. The first of these was the Kyoto protocol that was created in 1997
to lower global greenhouse gas production, with targets for all developed nations. Following this
early treaty, the Paris Agreement was signed by all countries (developed and developing) in 2015. A
major directive of the agreement calls for steps to be taken to limit the increase in the earth’s
temperature to 1.5 degrees. In order to meet these targets in New Zealand, the Climate Change
Response (Zero Carbon) Amendment Act was passed in 2019 (Ministry for the Environment, 2019a).
In New Zealand, agriculture produces 48% of the greenhouse gas emissions, while in most other
developed countries it is between 10 and 12% (Pinares-Patino, Waghorn, Hegarty and Hoskin, 2009).
This has led to increased scrutiny on agricultural practices and their sustainability. Although to date
this has largely been focused on the dairy and sheep & beef industries, as the horticultural industry
has expanded there has been increasing pressure to understand its environmental credentials.
However, this scrutiny and regulation is not necessarily a detriment to the industry. As well as
potentially changing consumer preferences and marketing, there are significant risks to the farming
industry with the impact of changing climates. It is estimated that with an increase of 1.5 degrees of

5
warming, 4% of all land will undergo a transformation from one ecosystem to another, with 13%
transforming at 2 degrees (The Aotearoa Circle, 2020). Therefore, it is in the interests of all farmers,
growers and producers that the impact of climate change and sustainability are taken seriously.
2.2 Analytical Assessment for Sustainability
2.2.1 Carbon Modelling Methodology
The commonly used tool for carbon modelling and environmental management is the life cycle
assessment or analysis (LCA). LCA assesses the environmental impact of a product throughout its life
cycle, from extraction of raw materials through to end of life disposal. It is widely recognised as one
of the most sophisticated and comprehensive analytical assessments available (Sharma, 2002).
As well as the ambiguity in defining the term “sustainability” there are also different methods to
calculate the life cycle of a product or process. As a result of the pressure from governments, the
public and consumers, protocols have been created to measure the carbon footprints of goods and
services. The first to be created was the UK’s Publicly Available Selection for GHG Emission
Measurement of Goods and Services (PAS 2050). This was published in 2008 and became widely used
as a publishing standard for GHG emissions. Since then there have been a range of other approaches
created such as the International Standards Organisation’s ISO 14040 and 14044. McLaren et al.
(2009) undertook a study to measure the variance between the PAS 2050 protocols and the ISO
standards on the life cycle of an apple grown in New Zealand all the way to consumption in the UK.
This found that the more comprehensive ISO LCA approach produced a result that was 22% higher in
emissions that the PAS 2050 approach. The majority of this difference was related to the inclusion of
the travel of the consumer between the home and the retailer.
2.2.2 Carbon Modelling on Horticultural Systems
Kiwifruit
Although there have been several studies into the carbon emissions of kiwifruit orchards, particularly
in New Zealand, there is limited comparability across the research due to the different
methodologies used and the inputs included in the research. The table below summarises the
different assumptions used in four of the studies on kiwifruit carbon emissions. As can be seen from
these results, there is a high degree of variation amongst the inputs and resulting outputs of the
studies. Nabavi-Pelesarai et al (2016) is not relevant for comparison as it is based on kiwifruit
production in Iran and therefore has limited climatic and system comparability to New Zealand

6
grown kiwifruit. Mithraratne, Barber & McLaren (2010) and Muller et al. (2015) are both New
Zealand based studies, but they do not include the emissions related to soil decomposition and
therefore have less functionality. For this research, the Page et al. (2011) study was deemed to be
the most comparable as it includes the soil emissions related to decomposition. However, this study
is only focused on organic orchards and therefore is expected to have marginally less emissions than
a conventional orchard. For comparison, when the soil emissions are excluded from the Page et al.
(2011) study, the modelled orchard would be expected to emit 2.75 tCO2-eq per ha.
Table 1: Kiwifruit carbon emissions from research
Source Includes Notable Exclusions
Orchard capital,
Orchard Carbon Emissions
As Per Study
Conversion
Carbon Emissions Per Ha
Mithraratne, Barber &
McLaren (2010)
Page, Kelly, Minor &
Cameron (2011)
Muller, Holmes, Deurer &
Clothier (2015)
agrichemicals, fertiliser,
fuel and electricity and
seasonal workers
Orchard capital,
agrichemicals, fertiliser,
fuel, electricity, and soil
emissions
Agrichemicals, fertiliser
and fuel and electricity
Soil emissions (e.g. 0.58 kgCO2eqv per tray
decomposition)
Only studies organic
orchards, excludes
inorganic fertiliser and
agrichemicals
Soil emissions (e.g.
decomposition), orchard
capital
10,000 trays per 5.75 tCO2eqv per ha
Nabavi-Pelesaraei, Rafiee, Agrichemicals, fertiliser
Hosseinzadeh-Bandbafha and fuel and electricity
& Shamshirband (2016)
Soil emissions (e.g.
decomposition), orchard
capital
There are very few studies that also include the carbon sequestration of the kiwifruit vines. Page et
al. (2011) estimates the carbon sequestration per orchard to be 19.6 tCO2-eq per ha annually. This is
based on sequestration in the biomass of the vines (photosynthesis minus respiration) of 13.7 tCO2-
eq per ha with 5.9 tCO2-eq per ha temporarily stored in the applied compost. The temporary nature
of this storage is due to the decomposition of the organic matter which is accounted for in the
expected emissions as documented in the table above. The Page et al. (2011) study is the considered
the most comparable research due to its relatively recent publication and PAS 2050 calculation
methodology.
Overall, the Page et al. (2011) study found that the net carbon sequestration for an organic kiwifruit
orchard in New Zealand was 2.4 t CO2-eq per ha.
Apples
Carbon footprint studies on apple orchards are predominantly focused on the whole supply chain,
from the orchard to consumption in market (usually the United Kingdom). McLaren et al. (2009) and
Saunders, Barber & Taylor (2006) are examples of these supply chain footprint studies. The orchard
ha
16.91 tCO2eqv per ha
n/a
16.91 tCO2eqv per ha
5,379 kg CO2eqv per ha
Gold Kiwifruit
5.38 tCO2eqv per ha
3,948 kg CO2eqv per ha Green Kiwifruit 3.95 tCO2eqv per ha
4,927 kg CO2eqv per ha Integrated Mgmt. 4.93 tCO2eqv per ha
4,400 kg CO2eqv per ha Orga nic Mgmt. 4.40 tCO2eqv per ha
1,310 kg CO2eqv per ha
n/a 1.31 tCO2eqv per ha
7
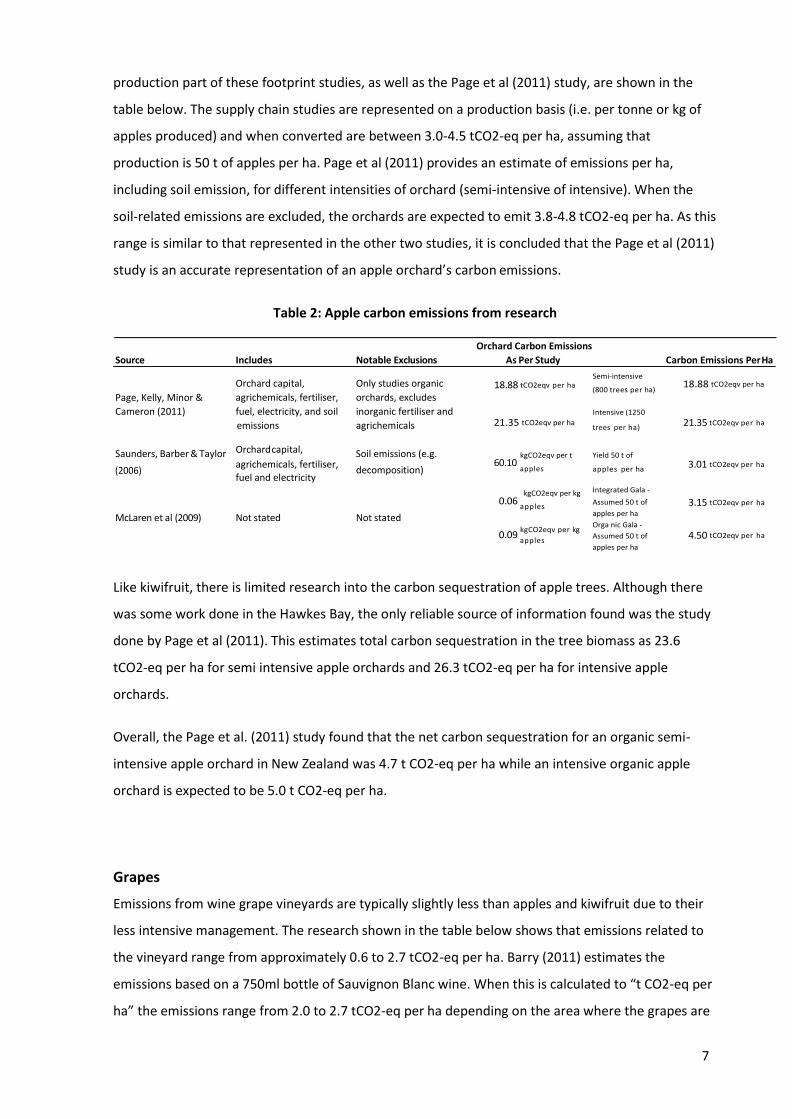
production part of these footprint studies, as well as the Page et al (2011) study, are shown in the
table below. The supply chain studies are represented on a production basis (i.e. per tonne or kg of
apples produced) and when converted are between 3.0-4.5 tCO2-eq per ha, assuming that
production is 50 t of apples per ha. Page et al (2011) provides an estimate of emissions per ha,
including soil emission, for different intensities of orchard (semi-intensive of intensive). When the
soil-related emissions are excluded, the orchards are expected to emit 3.8-4.8 tCO2-eq per ha. As this
range is similar to that represented in the other two studies, it is concluded that the Page et al (2011)
study is an accurate representation of an apple orchard’s carbon emissions.
Table 2: Apple carbon emissions from research
Source Includes Notable Exclusions
Orchard Carbon Emissions
As Per Study Carbon Emissions Per Ha
Page, Kelly, Minor &
Cameron (2011)
Orchard capital,
agrichemicals, fertiliser,
fuel, electricity, and soil
Only studies organic
orchards, excludes
inorganic fertiliser and
Semi-intensive 18.88 tCO2eqv per ha
(800 trees per ha)
Intensive (1250
18.88 tCO2eqv per ha
emissions agrichemicals 21.35 tCO2eqv per ha trees per ha) 21.35 tCO2eqv per ha
Saunders, Barber & Taylor
Orchard capital,
Soil emissions (e.g.
kgCO2eqv per t
Yield 50 t of
(2006) agrichemicals, fertiliser, fuel and electricity
decomposition) 60.10
apples
kgCO2eqv per kg
apples per ha 3.01 tCO2eqv per ha
Integrated Gala -
McLaren et al (2009) Not stated Not stated
0.06 apples
0.09 kgCO2eqv per kg
apples
Assumed 50 t of
apples per ha
Orga nic Gala -
Assumed 50 t of
apples per ha
3.15 tCO2eqv per ha
4.50 tCO2eqv per ha
Like kiwifruit, there is limited research into the carbon sequestration of apple trees. Although there
was some work done in the Hawkes Bay, the only reliable source of information found was the study
done by Page et al (2011). This estimates total carbon sequestration in the tree biomass as 23.6
tCO2-eq per ha for semi intensive apple orchards and 26.3 tCO2-eq per ha for intensive apple
orchards.
Overall, the Page et al. (2011) study found that the net carbon sequestration for an organic semi-
intensive apple orchard in New Zealand was 4.7 t CO2-eq per ha while an intensive organic apple
orchard is expected to be 5.0 t CO2-eq per ha.
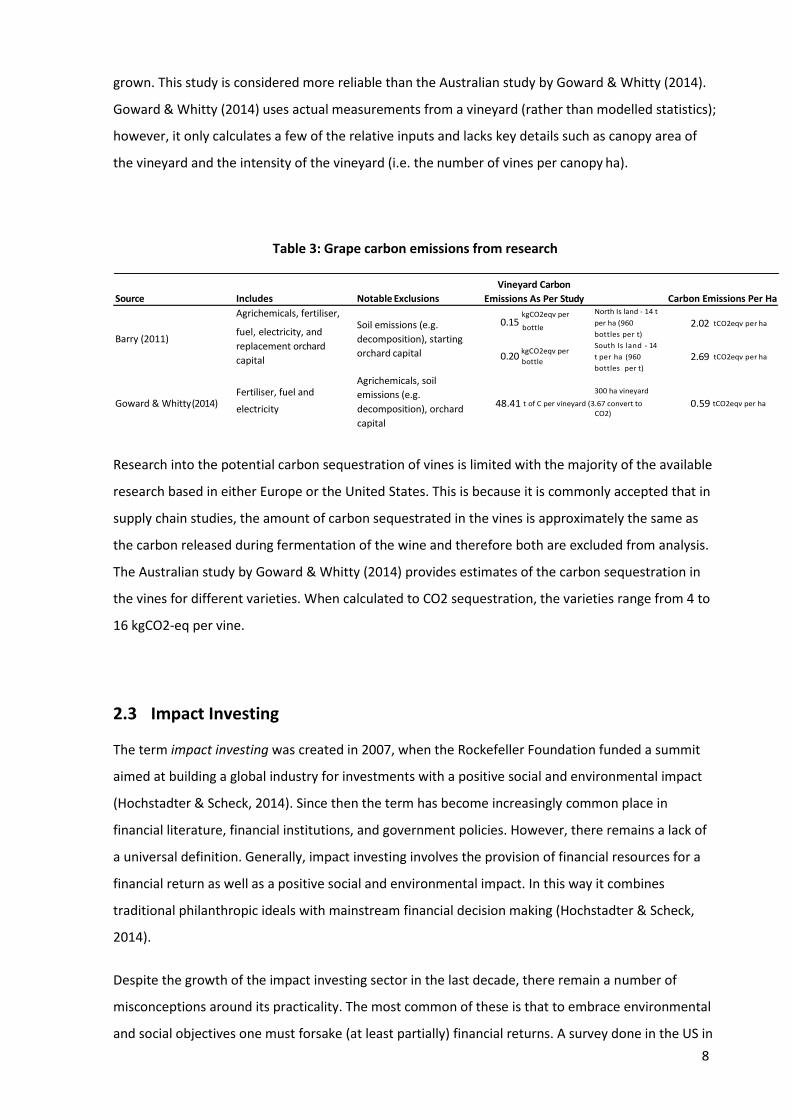
Grapes
Emissions from wine grape vineyards are typically slightly less than apples and kiwifruit due to their
less intensive management. The research shown in the table below shows that emissions related to
the vineyard range from approximately 0.6 to 2.7 tCO2-eq per ha. Barry (2011) estimates the
emissions based on a 750ml bottle of Sauvignon Blanc wine. When this is calculated to “t CO2-eq per
ha” the emissions range from 2.0 to 2.7 tCO2-eq per ha depending on the area where the grapes are
8
grown. This study is considered more reliable than the Australian study by Goward & Whitty (2014).
Goward & Whitty (2014) uses actual measurements from a vineyard (rather than modelled statistics);
however, it only calculates a few of the relative inputs and lacks key details such as canopy area of
the vineyard and the intensity of the vineyard (i.e. the number of vines per canopy ha).
Table 3: Grape carbon emissions from research
Source Includes Notable Exclusions
Agrichemicals, fertiliser,
Vineyard Carbon
Emissions As Per Study
kgCO2eqv per
North Is land - 14 t
Carbon Emissions Per Ha
Barry (2011)
fuel, electricity, and
replacement orchard
capital
Fertiliser, fuel and
Soil emissions (e.g.
decomposition), starting
orchard capital
Agrichemicals, soil
emissions (e.g.
0.15 bottle
0.20 kgCO2eqv per
bottle
per ha (960
bottles per t)
South Is land - 14
t per ha (960
bottles per t)
300 ha vineyard
2.02 tCO2eqv per ha
2.69 tCO2eqv per ha
Goward & Whitty (2014) electricity decomposition), orchard
capital
48.41 t of C per vineyard (3.67 convert to CO2)
0.59 tCO2eqv per ha
Research into the potential carbon sequestration of vines is limited with the majority of the available
research based in either Europe or the United States. This is because it is commonly accepted that in
supply chain studies, the amount of carbon sequestrated in the vines is approximately the same as
the carbon released during fermentation of the wine and therefore both are excluded from analysis.
The Australian study by Goward & Whitty (2014) provides estimates of the carbon sequestration in
the vines for different varieties. When calculated to CO2 sequestration, the varieties range from 4 to
16 kgCO2-eq per vine.
2.3 Impact Investing
The term impact investing was created in 2007, when the Rockefeller Foundation funded a summit
aimed at building a global industry for investments with a positive social and environmental impact
(Hochstadter & Scheck, 2014). Since then the term has become increasingly common place in
financial literature, financial institutions, and government policies. However, there remains a lack of
a universal definition. Generally, impact investing involves the provision of financial resources for a
financial return as well as a positive social and environmental impact. In this way it combines
traditional philanthropic ideals with mainstream financial decision making (Hochstadter & Scheck,
2014).
Despite the growth of the impact investing sector in the last decade, there remain a number of
misconceptions around its practicality. The most common of these is that to embrace environmental
and social objectives one must forsake (at least partially) financial returns. A survey done in the US in

9
2017 by the Morgan Stanley Institute for Sustainable Investing found that the majority of investors
(53%) still believe that investing sustainably requires a financial trade off (Morgan Stanley Institute
for Sustainable Investing, 2017). However, this idea has been proven to be incorrect. Eccles, Ioannou
& Serafeim (2014) found that high sustainability companies, those that voluntarily adopted
sustainability policies in 1993, significantly outperformed low sustainability, those that adopted no
sustainability policies, in the period between 1993 and 2010. Based on traditional financial metrics,
investing $1 in a portfolio of high sustainability companies in 1993 would have grown to $7.10 by
2010. While similarly investing $1 in a portfolio of low sustainability companies would have grown to
$4.40. This growth in interest and potential returns has led to a large number of traditional and new
global financial firms taking up impact investing.

10
Methodology
3.1 Research Approach
This research primarily uses an analytical framework through a purpose-built Excel “carbon
footprint” model. The model is based on assumptions sourced from relevant literature. This model
then has a sample of six different orchards modelled for their net carbon movement in the 2019-20
season. These sample orchards have been selected from Craigmore Sustainables’ permanent crop
portfolio based on their variability for crop type, production method and age (i.e. stage of maturity).
In addition to the carbon footprint modelling, four informal interviews of leading New Zealand
primary industry investment managers and large-scale corporate farmers and foresters were
performed. This was then compared to international and New Zealand based literature on
sustainability and sustainability reporting for an understanding of the extent to which the primary
industry and its investors are concerned and report on sustainability.
3.2 Carbon Footprint Model
To provide comparability in analytical modelling, all inputs and outputs need to be compared on the
same “functional unt”. For the sake of this study and report, the functional unit has been
represented as a canopy hectare. This refers to the area of an orchard that is under canopy or
covered in the permanent crop. This varies from the total area as all orchards require some
additional area (outside of the “canopy”) for headlands, tracks and other spare land.
Another important consideration for carbon footprinting is the setting of system boundaries for
modelling. The model created largely uses Scope 1, 2 & 3 based emissions (depending on the
definition) while focusing on the cradle to gate system boundary. Ministry for the Environment
(2019b) describes Scope 1 emissions as those directly related to sources owned or controlled by the
company, Scope 2 as the emissions from the generation of purchased energy (largely electricity) and
Scope 3 as the indirect emission occurred because of the activities of the organisation but generated
from sources out of their control. Cradle to gate in a horticultural context refers to the emissions
(both direct and indirect) that have occurred in the processes of the orchard (such as from the
materials it purchases and the production of the fruit) but the calculations stop at the orchard gate.
Therefore, emissions arising from the transport and processing of the product to market are not
included.

11
As far as possible this model aims to follow the PAS 2050 protocols. However, there may some
instances where in the interest of time and simplicity some of the assumptions and parameters used
will fall outside the PAS 2050 protocols.
There are a number of areas that this model either assumes or doesn’t include for simplicity. These
are:
• The impact of different soil types on the soil carbon sequestration or emissions
• The impact of different climates within New Zealand on the carbon sequestration or
emissions
• The carbon currently stored in the soil at varying depths
• The termination or removal of the orchard. This would theoretically result in the removal of
stored carbon and therefore emissions. However, as the lifespan of orchards can be multiple
decades and this model is only on an annual basis, this has been discounted
• The impact of the land use change from either pasture or annual cropping into permanent
crop has not been included. Although this may have a positive or negative impact on the
carbon footprint of some orchards, as this model was designed on an annual basis, this has
been discounted
The carbon footprint model is prepared using the most applicable assumptions available from the
studies available at the time of writing of this report. The “carbon cycle” represented in the model is
shown on the following page. As previously represented, this is aimed to follow the “cradle to gate”
principles and therefore doesn’t include any fruit produced in the analysis.

12
Figure 1: Visual representation of carbon footprint model
13
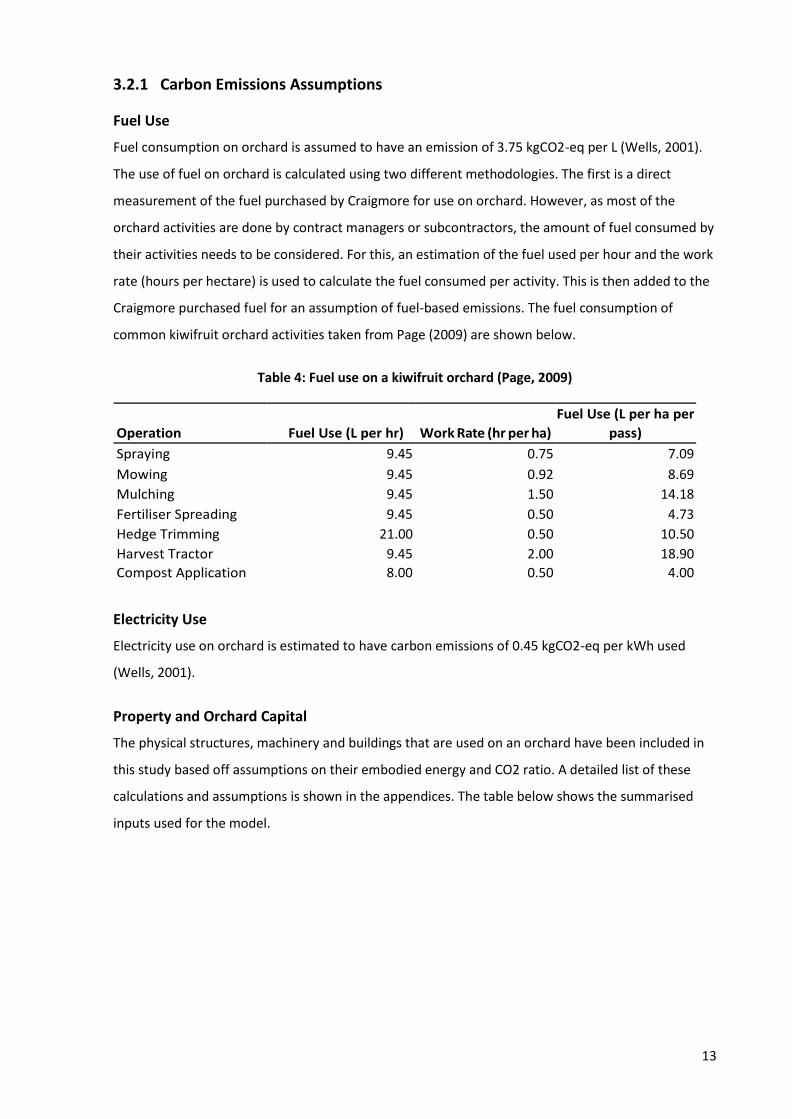
3.2.1 Carbon Emissions Assumptions
Fuel Use
Fuel consumption on orchard is assumed to have an emission of 3.75 kgCO2-eq per L (Wells, 2001).
The use of fuel on orchard is calculated using two different methodologies. The first is a direct
measurement of the fuel purchased by Craigmore for use on orchard. However, as most of the
orchard activities are done by contract managers or subcontractors, the amount of fuel consumed by
their activities needs to be considered. For this, an estimation of the fuel used per hour and the work
rate (hours per hectare) is used to calculate the fuel consumed per activity. This is then added to the
Craigmore purchased fuel for an assumption of fuel-based emissions. The fuel consumption of
common kiwifruit orchard activities taken from Page (2009) are shown below.
Table 4: Fuel use on a kiwifruit orchard (Page, 2009)
Operation
Fuel Use (L per hr)
Work Rate (hr per ha)
Fuel Use (L per ha per
pass)
Spraying 9.45 0.75 7.09
Mowing 9.45 0.92 8.69
Mulching 9.45 1.50 14.18
Fertiliser Spreading 9.45 0.50 4.73
Hedge Trimming 21.00 0.50 10.50
Harvest Tractor 9.45 2.00 18.90
Compost Application 8.00 0.50 4.00
Electricity Use
Electricity use on orchard is estimated to have carbon emissions of 0.45 kgCO2-eq per kWh used
(Wells, 2001).
Property and Orchard Capital
The physical structures, machinery and buildings that are used on an orchard have been included in
this study based off assumptions on their embodied energy and CO2 ratio. A detailed list of these
calculations and assumptions is shown in the appendices. The table below shows the summarised
inputs used for the model.

14
Table 5: Property and orchard capital embodied emissions
Input Embodied Emission Source
Buildings 59.00 kgCO2eqv per m2 Wells (2001)
Vehicles 12.80 kgCO2eqv per kg Wells (2001)
Other Machinery 6.40 kgCO2eqv per kg Wells (2001)
Irrigation Pumps 12.80 kgCO2eqv per kg Saunders et al. (2006)
Irrigation Wells 32.00 kgCO2eqv per m drill Saunders et al. (2006)
Irrigation Mainlines
Irrigation Laterals & Dripline
Posts
6.24 kgCO2eqv per m
5.12 kgCO2eqv per m
1.44 kgCO2eqv per post
Saunders et al. (2006)
Saunders et al. (2006)
Barber & Scarrow (2001)
Wire 0.10 kgCO2eqv per m Barber & Scarrow (2001)
Agbeam 4.48 kgCO2eqv per m Mithraratne et al. (2010)
String 0.96 kgCO2eqv per m Own assumption (appendices)
Stringing Poles 0.40 kgCO2eqv per pole Own assumption (appendices)
6m Shelter Posts 8.00 kgCO2eqv per post Own assumption (appendices)
6m Shelter Cloth 2.18 kgCO2eqv per m2 Own assumption (appendices)
Undervine Shelter Cloth 2.05 kgCO2eqv per m2 Own assumption (appendices)
Hailnet Cloth 0.83 kgCO2eqv per m2 Own assumption (appendices)
Hailnet Posts 8.00 kgCO2eqv per post Own assumption (appendices)
Frost Fans 12,800.00 kgCO2eqv per fan Page (2009)
Fertiliser Inputs
The embodied emissions in fertiliser include the emissions associated with the raw materials and
fossil fuels required for its manufacture as well as the packaging and transport of the materials to the
farmer or grower. The emissions of the different fertilisers used on the orchards have been
estimated either on their nutrient components or as an organic fertiliser. The table below
summarises the assumptions used for the model.
Table 6: Fertiliser embodied emissions
Input Embodied Emission Source
N Fertiliser 3.25 kgCO2eqv per kgN Wells (2001)
P Fertiliser 0.90 kgCO2eqv per kgP Wells (2001)
K Fertiliser 0.60 kgCO2eqv per kgK Wells (2001)
S Fertiliser 0.30 kgCO2eqv per kgS Wells (2001)
Organic Fertiliser 0.40 kgCO2eqv per kgFert Page (2009)
Lime 0.43 kgCO2eqv per kgLime Wells (2001)
Agrichemical Spray Inputs
The agrichemicals used on the orchards have been broken down into different categories based on
the information available. The table below summarises the assumptions used for the model.

15
Table 7: Agrichemical embodied emissions
Input Embodied Emission Source
Herbicide (Glyphosate) 33.00 kgCO2eqv per kg Saunders et al. (2006)
Herbicide (General) 18.60 kgCO2eqv per kg Saunders et al. (2006)
Insecticide 18.90 kgCO2eqv per kg Saunders et al. (2006)
Fungicide 12.60 kgCO2eqv per kg Saunders et al. (2006)
Plant Growth Regulator 10.50 kgCO2eqv per kg Saunders et al. (2006)
Mineral Oil 7.20 kgCO2eqv per kg Saunders et al. (2006)
Copper Spray 8.92 kgCO2eqv per kg Wells (2001)
Sulphur Spray 8.92 kgCO2eqv per kg Wells (2001)
Biostimulant 0.40 kgCO2eqv per kg Page (2009)
Other 7.20 kgCO2eqv per kg Saunders et al. (2006)
Embodied Emissions in Compost Preparation
The preparation of compost has had an assumed embodied emission of 0.04 kgCO2-eq per kg
applied.
3.2.2 Carbon Sequestration Assumptions
Kiwifruit Carbon Sequestration
The net carbon sequestration of a plant is a based on the photosynthesis accumulated during the
growing season minus the plant respiration. This can then be converted to carbon dioxide
sequestration my multiplying by the weight of carbon by 3.67 (due to the molecular weight ratio of
carbon in CO2). For mature kiwifruit vines the CO2 sequestration has been assumed at 40.99 kg CO2
per vine per year (Page, 2009). There is limited information on the CO2 sequestration in younger
plants. An assumption has therefore been made on the size of the plant relative to the mature state.
This is then applied to the mature CO2 sequestration value to get an assumption for sequestration
during establishment. See below for this assumption.
Table 8: CO2 sequestration per plant relative to age
Years since planting 1 2 3 4 5 6 7 8
CO2 Sequestration per plant
relative to mature state
5%
15%
40%
65%
85%
90%
95%
100%
As CO2 sequestrated in the fruit is released back to the atmosphere, the fruit portion of the plant’s
sequestration has been discounted. The breakdown of the plant’s sequestration by the leaves, fine
roots, stems and fruit has been assumed for a mature, fully producing kiwifruit vine as 22:22:23:33
respectively (Kroodsma & Field, 2006). Therefore, the CO2 sequestrated by a mature kiwifruit vine’s
leaves, fine roots and stems has been calculated as 27.46 kg CO2 per vine per year (based on 40.99 x

16
(1-33%)). In younger plants the production is less. Therefore, an assumption has been made on the
production factor relative to maturity or full production. This is shown below.
Table 9: Production relative to maturity for kiwifruit and apples
Years since planting/grafting 1 2 3 4 5 6 7
Production relative to maturity /
full production 0% 33% 50% 67% 80% 95% 100%
Kiwifruit Fruit Portion of
Sequestration 0% 11% 17% 22% 26% 31% 33%
Kiwifruit Leaves, Roots & Stems
Portion of Sequestration 100% 89% 84% 78% 74% 69% 67%
Therefore, the equation to calculate carbon sequestration per ha (kgCO2qv per ha) is:
𝑃𝑙𝑎𝑛𝑡𝑠 𝑝𝑒𝑟 ℎ𝑎 × 𝑀𝑎𝑡𝑢𝑟𝑒 𝑆𝑒𝑞𝑢𝑒𝑠𝑡𝑟𝑎𝑡𝑖𝑜𝑛 𝑝𝑒𝑟 𝑃𝑙𝑎𝑛𝑡 × 𝐷𝑖𝑠𝑐𝑜𝑢𝑛𝑡 𝑓𝑜𝑟 𝐴𝑔𝑒 𝑜𝑓 𝑃𝑙𝑎𝑛𝑡
× (1 − 𝐹𝑟𝑢𝑖𝑡 𝑃𝑜𝑟𝑡𝑖𝑜𝑛 𝑅𝑒𝑙𝑎𝑡𝑖𝑣𝑒 𝑡𝑜 𝐴𝑔𝑒)
Apples Carbon Sequestration
Similar principles apply to apple carbon sequestration. However, an additional assumption has been
made based on the rootstock used.
A traditional mature apple tree has been assumed to sequestrate 62.85 kg CO2 per year (Page,
2009). However, if M9 dwarf rootstock is used the plant has been assumed to be 35% of the
traditional tree, meaning mature sequestration per tree is 22.00 kg CO2 per year. If M106 rootstock
is used in an intensive orchard, the plant has been assumed to be 50% of the traditional tree,
meaning mature sequestration per tree is 31.43 kg CO2 per year. If M106 rootstock is used in a semi-
intensive orchard, the plant has been assumed to be 70% of the traditional tree, meaning mature
sequestration per tree is 44.00 kg CO2 per year (Page, 2009).
Assumed CO2 sequestration per plant relative to age and production relative to maturity is the same
as kiwifruit.
Therefore, the equation to calculate carbon sequestration per ha (kgCO2qv per ha) is:
𝑃𝑙𝑎𝑛𝑡𝑠 𝑝𝑒𝑟 ℎ𝑎 × 𝑀𝑎𝑡𝑢𝑟𝑒 𝑆𝑒𝑞𝑢𝑒𝑠𝑡𝑟𝑎𝑡𝑖𝑜𝑛 𝑅𝑒𝑙𝑎𝑡𝑖𝑣𝑒 𝑡𝑜 𝑅𝑜𝑜𝑡𝑠𝑡𝑜𝑐𝑘 × 𝐷𝑖𝑠𝑐𝑜𝑢𝑛𝑡 𝑓𝑜𝑟 𝐴𝑔𝑒 𝑜𝑓 𝑃𝑙𝑎𝑛𝑡
× (1 − 𝐹𝑟𝑢𝑖𝑡 𝑃𝑜𝑟𝑡𝑖𝑜𝑛 𝑅𝑒𝑙𝑎𝑡𝑖𝑣𝑒 𝑡𝑜 𝐴𝑔𝑒)

17
Wine Grapes Carbon Sequestration
CO2 sequestration in wine grapes has been estimated based on the variety. Goward & Whitty (2014)
provided estimates of the carbon sequestrated in the roots and stems. This was then converted to all
of the vine, based on the assumption that 30% of the carbon is sequestrated in the leaves and fruit.
This can then be converted to carbon dioxide sequestration my multiplying by the weight of carbon
by 3.67. The same methodology for younger vines, as per kiwifruit and apples, was used for grapes.
See below for a summary of the CO2 sequestration of different varieties.
Table 10: CO2 Sequestration of Different Grape Varieties
Variety
Carbon Stored in the Roots &
Stems
Carbon Stored in the Leaves,
Roots, Stems & Fruit CO2 Sequestrated per Vine
Chardonnay 2.04 kg per vine 2.91 kg per vine 10.70 kg per vine
Sauvignon Blanc 1.92 kg per vine 2.74 kg per vine 10.07 kg per vine
Riesling 1.44 kg per vine 2.06 kg per vine 7.55 kg per vine
Pinot Gris 0.78 kg per vine 1.11 kg per vine 4.09 kg per vine
Shiraz 2.52 kg per vine 3.60 kg per vine 13.21 kg per vine
Cabernet Sauvignon 3.11 kg per vine 4.44 kg per vine 16.31 kg per vine
Merlot 1.90 kg per vine 2.71 kg per vine 9.96 kg per vine
Pinot Noir 1.27 kg per vine 1.81 kg per vine 6.66 kg per vine
The fruit portion of the carbon sequestration in the grape vines has been estimated based on
information from Goward & Whitty (2014). This is shown below.
Table 11: Production relative to maturity for grapes
Years since planting/grafting
1
2
3
4
5
6
7
Production relative to maturity /
full production 0% 27% 53% 80% 100% 100% 100%
Grape Fruit Portion of
Sequestration 0% 4% 8% 12% 15% 15% 15%
Grape Leaves, Roots & Stems
Portion of Sequestration 100% 96% 92% 88% 85% 85% 85%
Therefore, the equation to calculate carbon sequestration per ha (kgCO2-eq per ha) is:
𝑃𝑙𝑎𝑛𝑡𝑠 𝑝𝑒𝑟 ℎ𝑎 × 𝑀𝑎𝑡𝑢𝑟𝑒 𝑆𝑒𝑞𝑢𝑒𝑠𝑡𝑟𝑎𝑡𝑖𝑜𝑛 𝑝𝑒𝑟 𝐺𝑟𝑎𝑝𝑒 𝑉𝑎𝑟𝑖𝑒𝑡𝑦 × 𝐷𝑖𝑠𝑐𝑜𝑢𝑛𝑡 𝑓𝑜𝑟 𝐴𝑔𝑒 𝑜𝑓 𝑃𝑙𝑎𝑛𝑡
× (1 − 𝐹𝑟𝑢𝑖𝑡 𝑃𝑜𝑟𝑡𝑖𝑜𝑛 𝑅𝑒𝑙𝑎𝑡𝑖𝑣𝑒 𝑡𝑜 𝐴𝑔𝑒)
Natural Shelter Carbon Sequestration
The carbon sequestration potential in natural shelterbelts was calculated using Ministry for Primary
Industries (2018) data. This proposed that there is approximately 0.67 t C accumulated per year in a
hectare of orchard, assuming that there is 400 m of shelterbelt per hectare of orchard. The
shelterbelt is assumed to have reached maturity at 30 years old. Therefore, natural shelter, that is
younger than 30 years, is assumed to sequestrate 6.15 kgCO2-eq per m planted annually.

18
3.2.3 Soil Carbon Assumptions
Changes in soil carbon levels are a trade-off between carbon inputs from the addition of compost
and plant material (prunings, leaves and decomposing roots), and carbon loss from the
decomposition of organic material in the soil.
Soil Carbon Inputs from the Plant
As described in the sections above, the carbon that is sequestrated by a plant is stored in the plant’s
leaves, stems, fruit and roots. Carbon in the fruit is removed from the system, therefore the
remaining carbon is stored in the leaves, stems and roots. As a deciduous plant, the leaves are
returned to the soil annually. In addition to the leaves, it is a standard horticultural practice to prune
a portion of the plant’s stems and return them to the soil as mulch. Therefore, carbon inputs to the
soil annually are a sum of the leaf material, pruned and mulched stems, and the decomposing roots.
The calculation below has been used to estimate the soil carbon inputs from the plant in the model
(kgCO2-eq per ha).
𝑃𝑙𝑎𝑛𝑡𝑠 𝑝𝑒𝑟 ℎ𝑎 × ∑(𝐶𝑂2 𝑖𝑛 𝐿𝑒𝑎𝑓 𝑀𝑎𝑡𝑒𝑟𝑖𝑎𝑙 (𝑘𝑔𝐶𝑂2𝑒𝑞𝑣 𝑝𝑒𝑟 𝑝𝑙𝑎𝑛𝑡)
+ 𝐶𝑂2 𝑖𝑛 𝑅𝑜𝑜𝑡 𝑀𝑎𝑡𝑒𝑟𝑖𝑎𝑙 (𝑘𝑔𝐶𝑂2𝑒𝑞𝑣 𝑝𝑒𝑟 𝑝𝑙𝑎𝑛𝑡)
+ (𝐶𝑂2 𝑖𝑛 𝑆𝑡𝑒𝑚 𝑀𝑎𝑡𝑒𝑟𝑖𝑎𝑙 (𝑘𝑔𝐶𝑂2𝑒𝑞𝑣 𝑝𝑒𝑟 𝑝𝑙𝑎𝑛𝑡) × 𝑃𝑒𝑟𝑐𝑒𝑛𝑡 𝑜𝑓 𝑆𝑡𝑒𝑚𝑠 𝑃𝑟𝑢𝑛𝑒𝑑
× 𝑃𝑒𝑟𝑐𝑒𝑛𝑡 𝑜𝑓 𝑃𝑟𝑢𝑛𝑒𝑑 𝑀𝑎𝑡𝑒𝑟𝑖𝑎𝑙 𝑅𝑒𝑡𝑢𝑟𝑛𝑒𝑑 𝑡𝑜 𝑆𝑜𝑖𝑙))
The below table summarises the inputs for a mature kiwifruit, apple and grape orchard/vineyard.
Table 12: Soil carbon inputs from the plant (Page, 2009)
Soil CO2 Input Soil CO2 Input CO2 Content of Percent of Pruned Material Soil CO2 Input Soil CO2 Input
Plant from the Leaves from the Roots the Stems Stems Pruned Returned to Soil from the Stems from the Plant
Kiwifruit 9.02 kgCO2eq 9.02 kgCO2eq 9.43 kgCO2eq 50% 100% 4.72 kgCO2eq 22.76 kgCO2eq
Apples (M9 Rootstock) 4.84 per 4.84 per 5.06 per 30% 100% 1.52 per 11.20 per
Grapes (Sauvignon Blanc) 1.51 plant 2.11 plant 4.93 plant 50% 100% 2.47 plant 6.09 plant
Soil Carbon Inputs from Compost
Carbon is estimated to be 40% of compost dry matter (Page, 2009). Therefore, soil carbon inputs
from compost is derived from kg of compost applied multiplied by 50% to get dry matter and
multiplied by 40% to get carbon. This is then converted to CO2 (multiplied by 3.67).
19
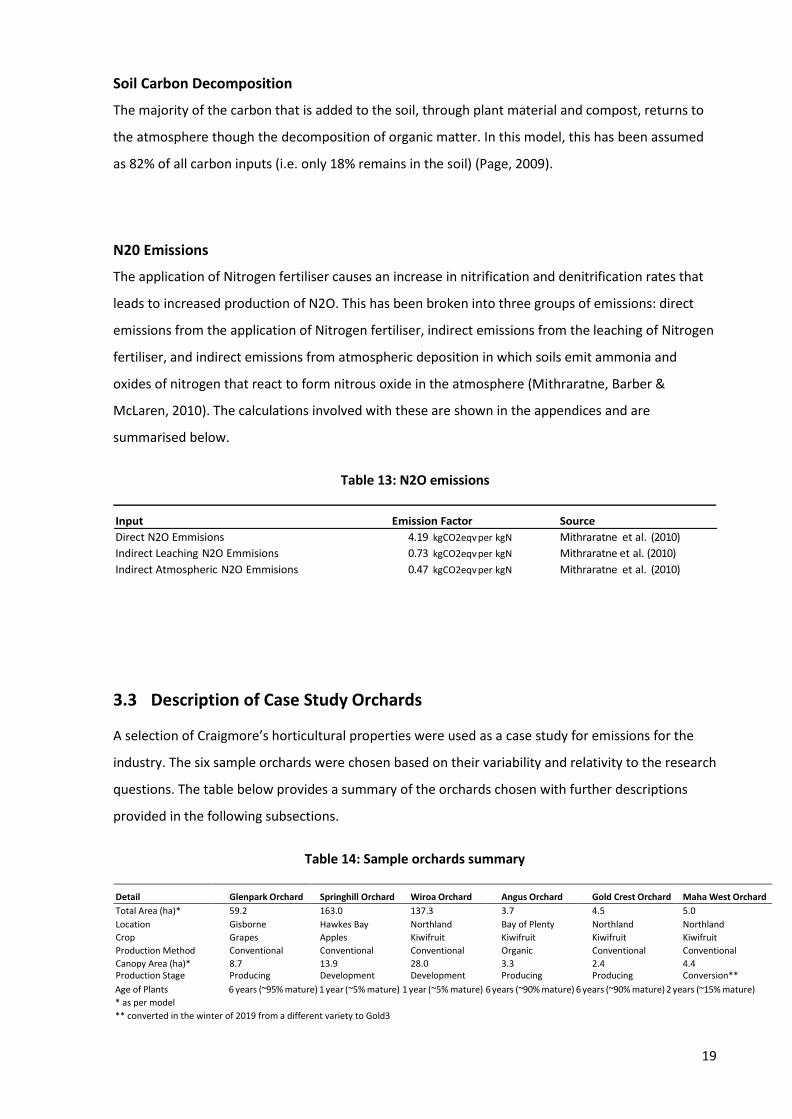
Soil Carbon Decomposition
The majority of the carbon that is added to the soil, through plant material and compost, returns to
the atmosphere though the decomposition of organic matter. In this model, this has been assumed
as 82% of all carbon inputs (i.e. only 18% remains in the soil) (Page, 2009).
N20 Emissions
The application of Nitrogen fertiliser causes an increase in nitrification and denitrification rates that
leads to increased production of N2O. This has been broken into three groups of emissions: direct
emissions from the application of Nitrogen fertiliser, indirect emissions from the leaching of Nitrogen
fertiliser, and indirect emissions from atmospheric deposition in which soils emit ammonia and
oxides of nitrogen that react to form nitrous oxide in the atmosphere (Mithraratne, Barber &
McLaren, 2010). The calculations involved with these are shown in the appendices and are
summarised below.
Table 13: N2O emissions
Input Emission Factor Source
Direct N2O Emmisions 4.19 kgCO2eqv per kgN Mithraratne et al. (2010)
Indirect Leaching N2O Emmisions 0.73 kgCO2eqv per kgN Mithraratne et al. (2010)
Indirect Atmospheric N2O Emmisions 0.47 kgCO2eqv per kgN Mithraratne et al. (2010)
3.3 Description of Case Study Orchards
A selection of Craigmore’s horticultural properties were used as a case study for emissions for the
industry. The six sample orchards were chosen based on their variability and relativity to the research
questions. The table below provides a summary of the orchards chosen with further descriptions
provided in the following subsections.
Table 14: Sample orchards summary
Detail Glenpark Orchard Springhill Orchard Wiroa Orchard Angus Orchard Gold Crest Orchard Maha West Orchard
Total Area (ha)* 59.2 163.0 137.3 3.7 4.5 5.0
Location Gisborne Hawkes Bay Northland Bay of Plenty Northland Northland
Crop Grapes Apples Kiwifruit Kiwifruit Kiwifruit Kiwifruit
Production Method Conventional Conventional Conventional Organic Conventional Conventional
Canopy Area (ha)* 8.7 13.9 28.0 3.3 2.4 4.4 Production Stage Producing Development Development Producing Producing Conversion**
Age of Plants 6 years (~95% mature) 1 year (~5% mature) 1 year (~5% mature) 6 years (~90% mature) 6 years (~90% mature) 2 years (~15% mature)
* as per model
** converted in the winter of 2019 from a different variety to Gold3

20
Wiroa Orchard
Wiroa Orchard is a 137 ha former dairy farm that was purchased in May 2019. The orchard is two
years into a large scale Gold3 conventional kiwifruit development. The orchard had 27.9 canopy
hectares of vines planted in winter of 2019 with a further 32 canopy hectares planted in the late
winter/spring of 2020. For the sake of this report, only the 2019 planted orchard has been modelled
in this study.
The orchard is planted in an intensive manner with approximately 936 vines per hectare. The vines
are supported by a trellis system composed of wooden posts, wire and steel agbeam. There are three
forms of artificial shelter throughout the orchard: 1.6m undervine shelter throughout the orchard,
6m artificial shelter above the vines throughout the orchard, and 6m artificial shelter around the
perimeter of blocks that require extra shelter. Water is supplied through the Kerikeri Irrigation
Scheme and reticulated around the orchard through a network of mainlines and submains. As a
former dairy farm, there are a number of sheds around the property as well as one small dwelling.
Craigmore manages the development and operations of the orchard with a third party. The majority
of the machinery and activities are supplied by the third party apart from an orchard tractor and
several implements.
Angus Orchard
Angus Orchard is a 4 ha organic kiwifruit orchard that was purchased in June 2017. The orchard is
expected to be certified in organics (BioGro certification) in 2021. This is a three-year process that
was started in 2018. The orchard has 3.3 canopy hectares of Gold3 kiwifruit vines that are
approaching maturity.
The orchard is planted in a semi-intensive manner with approximately 600 vines per hectare. The
vines are supported by a trellis system composed of wooden posts, wire and steel agbeam. The
majority of the orchard is covered in hail cloth of moderate quality. Approximately 10% of the
orchard is not covered due to powerlines running through the orchard and because of damage to the
nets. Natural shelter surrounds the orchard. Water is supplied through a 138 m deep bore and
reticulated around the orchard through a network of mainlines and submains. The only other
infrastructure on the property is a small irrigation and chemical shed.
The orchard is managed by a third party with all of the machinery and orchard activities supplied by
the third party.
21
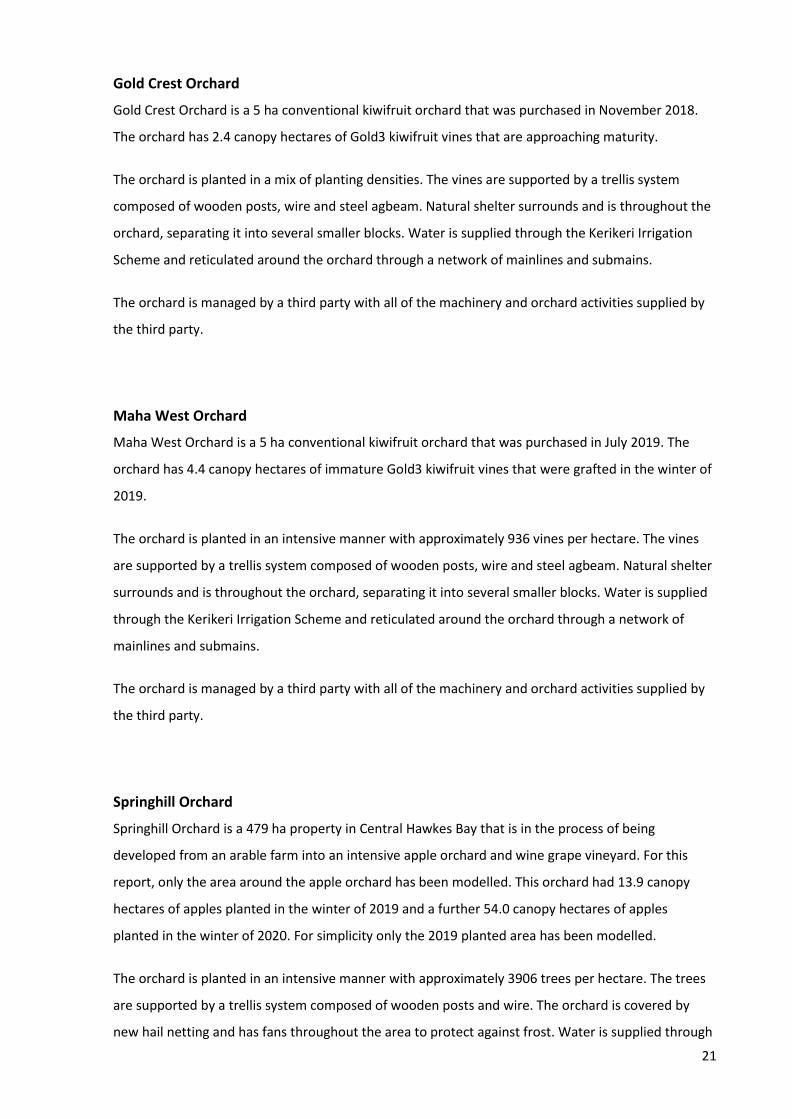
Gold Crest Orchard
Gold Crest Orchard is a 5 ha conventional kiwifruit orchard that was purchased in November 2018.
The orchard has 2.4 canopy hectares of Gold3 kiwifruit vines that are approaching maturity.
The orchard is planted in a mix of planting densities. The vines are supported by a trellis system
composed of wooden posts, wire and steel agbeam. Natural shelter surrounds and is throughout the
orchard, separating it into several smaller blocks. Water is supplied through the Kerikeri Irrigation
Scheme and reticulated around the orchard through a network of mainlines and submains.
The orchard is managed by a third party with all of the machinery and orchard activities supplied by
the third party.
Maha West Orchard
Maha West Orchard is a 5 ha conventional kiwifruit orchard that was purchased in July 2019. The
orchard has 4.4 canopy hectares of immature Gold3 kiwifruit vines that were grafted in the winter of
2019.
The orchard is planted in an intensive manner with approximately 936 vines per hectare. The vines
are supported by a trellis system composed of wooden posts, wire and steel agbeam. Natural shelter
surrounds and is throughout the orchard, separating it into several smaller blocks. Water is supplied
through the Kerikeri Irrigation Scheme and reticulated around the orchard through a network of
mainlines and submains.
The orchard is managed by a third party with all of the machinery and orchard activities supplied by
the third party.
Springhill Orchard
Springhill Orchard is a 479 ha property in Central Hawkes Bay that is in the process of being
developed from an arable farm into an intensive apple orchard and wine grape vineyard. For this
report, only the area around the apple orchard has been modelled. This orchard had 13.9 canopy
hectares of apples planted in the winter of 2019 and a further 54.0 canopy hectares of apples
planted in the winter of 2020. For simplicity only the 2019 planted area has been modelled.
The orchard is planted in an intensive manner with approximately 3906 trees per hectare. The trees
are supported by a trellis system composed of wooden posts and wire. The orchard is covered by
new hail netting and has fans throughout the area to protect against frost. Water is supplied through

22
two large bores and is partially stored in two large reservoirs on site. The water is reticulated around
the orchard through a network of mainlines and submains that also provide fertigation to the trees.
The property has a large house on site as well as numerous other buildings.
The orchard is being developed by Craigmore and therefore owns and operates the majority of the
machinery. The orchard has been set up in a modern design to provide the option for robotics and
other technology in the future. Three-row sprayers are currently used on orchard. These have arms
from the sprayer that enter the rows each side of the where the machine is running and therefore
theoretically reduce running costs. This is expected to also have a positive impact on emissions from
less fuel use as the orchard develops.
Glenpark Vineyard
Glenpark is a 59 hectare property near Gisborne that has an 8.7 canopy hectare Sauvignon Blanc
vineyard with the remaining land used for cropping. The vineyard is close to maturity with the vines
planted in 2013. For the purpose of this report, only the emissions related to the vineyard are
calculated.
The vineyard is of a high quality with the vines planted on a post and wire trellis. Water is supplied to
the property though a surface take from the Waipaoa River and reticulated around the vineyard
through a network of mainlines and submains. The property has a small woolshed and moderate
implement shed on site as well as a number of smaller buildings.
The orchard is managed by a third party with all of the machinery and orchard activities supplied by
the third party.
23
Carbon Footprint Results
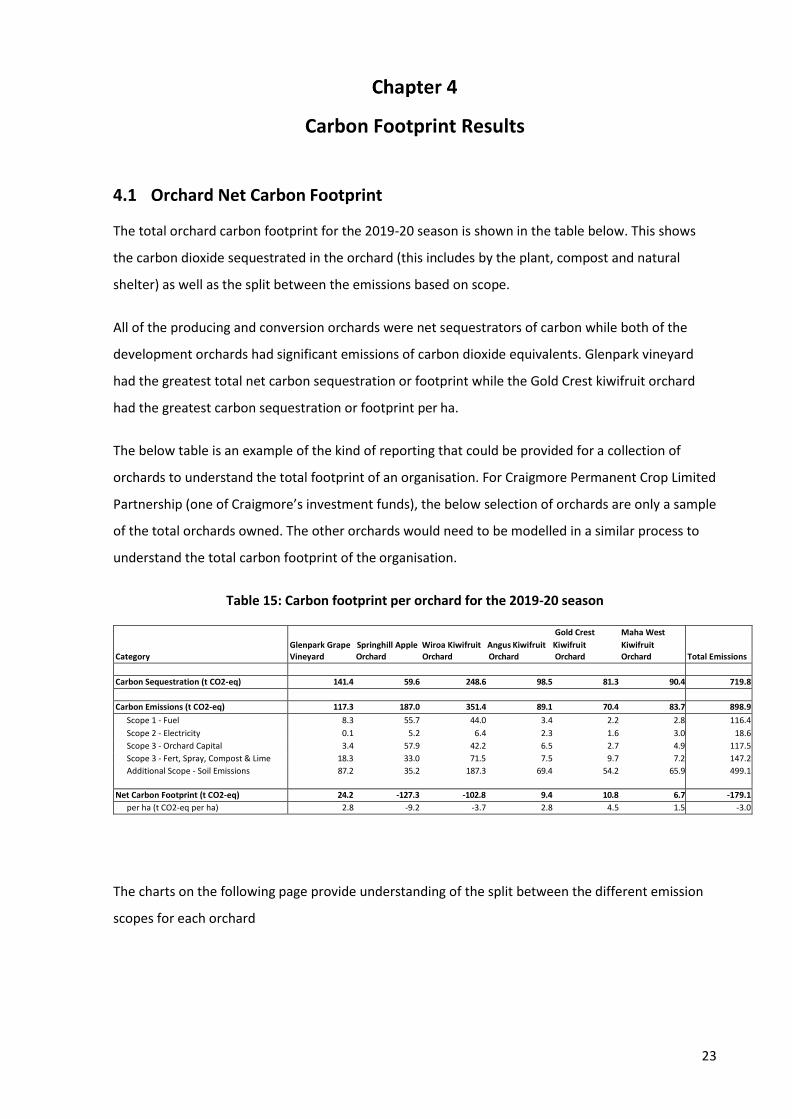
4.1 Orchard Net Carbon Footprint
The total orchard carbon footprint for the 2019-20 season is shown in the table below. This shows
the carbon dioxide sequestrated in the orchard (this includes by the plant, compost and natural
shelter) as well as the split between the emissions based on scope.
All of the producing and conversion orchards were net sequestrators of carbon while both of the
development orchards had significant emissions of carbon dioxide equivalents. Glenpark vineyard
had the greatest total net carbon sequestration or footprint while the Gold Crest kiwifruit orchard
had the greatest carbon sequestration or footprint per ha.
The below table is an example of the kind of reporting that could be provided for a collection of
orchards to understand the total footprint of an organisation. For Craigmore Permanent Crop Limited
Partnership (one of Craigmore’s investment funds), the below selection of orchards are only a sample
of the total orchards owned. The other orchards would need to be modelled in a similar process to
understand the total carbon footprint of the organisation.
Table 15: Carbon footprint per orchard for the 2019-20 season
Category
Gold Crest Maha West
Glenpark Grape Springhill Apple Wiroa Kiwifruit Angus Kiwifruit Kiwifruit Kiwifruit
Vineyard Orchard Orchard Orchard Orchard Orchard
Total Emissions
Carbon Sequestration (t CO2-eq) 141.4 59.6 248.6 98.5 81.3 90.4 719.8
Carbon Emissions (t CO2-eq) 117.3 187.0 351.4 89.1 70.4 83.7 898.9
Scope 1 - Fuel 8.3 55.7 44.0 3.4 2.2 2.8 116.4
Scope 2 - Electricity 0.1 5.2 6.4 2.3 1.6 3.0 18.6
Scope 3 - Orchard Capital 3.4 57.9 42.2 6.5 2.7 4.9 117.5
Scope 3 - Fert, Spray, Compost & Lime 18.3 33.0 71.5 7.5 9.7 7.2 147.2
Additional Scope - Soil Emissions 87.2 35.2 187.3 69.4 54.2 65.9 499.1
Net Carbon Footprint (t CO2-eq) 24.2 -127.3 -102.8 9.4 10.8 6.7 -179.1
per ha (t CO2-eq per ha) 2.8 -9.2 -3.7 2.8 4.5 1.5 -3.0
The charts on the following page provide understanding of the split between the different emission
scopes for each orchard

24
Figure 2: Carbon Emissions Per Scope

25
4.1.1 Comparison Across Different Crop Types
The primary difference between crop types arises from the carbon sequestration potential of the
plants. The inputs required to operate the orchard do not vary greatly between the different crop
types. The graph below shows the carbon sequestration potential of the different orchards modelled,
as well as an assumption for if the Springhill and Wiroa orchard developments were complete. The
brown bar represents the permanent soil CO2 inputs from the plant after decomposition losses, the
green bar represents the CO2 that is permanently stored in the plant biomass (i.e. what remains
after the soil inputs) and the light blue bar represents the CO2 that is added to the soil but is then
lost to decomposition. Excluded from this analysis is the sequestration related to the natural shelter
and the compost to make a relative comparison. Therefore, the sum of all three bars is the total CO2
sequestration potential of the different orchards and crop types.
Figure 3: Sequestration potential of the different crop types
4.1.2 Comparison Across Different Production Methodologies
The organic Angus Orchard and the conventionally managed Gold Crest Orchard have been chosen to
compare the different production methodologies of orchards. Both are kiwifruit orchards of a similar
age and stage of production.
The orchards have the following differences that are not related to their production methodology:
• The amount of natural shelter. Angus has approximately 200 m per ha (~660 m in total) while
Gold Crest has approximately 610 m per ha (~1,800 m in total).

26
• Gold Crest is a mix of strip male and opposing female planting design and has been assumed
at approx. 700 vines per ha (i.e. a mix of planting densities) while Angus is purely a strip male
orchard and therefore has less vines per ha (assumed at approx. 600 per ha)
• Angus orchard is partially covered by hail netting (approx. 90% covered) while Gold Crest has
no overhead shelter
• Angus Orchard sources water from a well on the property while Gold Crest has water
reticulated to the property through the Kerikeri Irrigation Scheme
• Gold Crest applied 2,000 kg per ha of lime-based products while Angus applied 1,000 kg per
ha (for this model, gypsum has been assumed to have the same carbon emissions as lime)
The orchards have the following differences that are related to their production methodology:
• Fertiliser inputs
o Gold Crest has several different fertiliser compounds applied (both foliar and solid
fertiliser) with an NPKS ratio (kg applied per ha) of 126:29:360:150 respectively. In
addition, there was approx. 100 kg per ha applied of Calmag (calculated in the model
using the organic fertiliser assumptions). A capital allocation of 14 tonnes per ha of
compost was also applied.
o Angus had two applications of organic fertiliser mixes as well as 300 kg per ha of
fishmeal applied. The organic fertiliser applications provided an NPKS ratio (kg
applied per ha) of 24:377:288. in addition, 15.5 tonnes per ha of compost was
applied.
• Spray inputs
o While organic orchards still apply sprays, Gold Crest applied 65 more kg of spray per
ha (214 kg per ha vs. 149 kg per ha). The chemicals used by a conventional orchard
are also considered to be higher emitters than the predominant copper sprays,
mineral oils and bio-stimulants used on the Angus orchard.
• Fuel use
o Gold Crest is expected to use approximately 252 L of fuel per ha per year while Angus
is expected to use 276 L of fuel per ha per year. This is primarily because of more

27
mowing runs in the Angus orchard. This variance only creates a minimal difference to
the carbon footprint model
The table below compares the different carbon footprints, on a per canopy hectare basis, of the
organic Angus Orchard and the conventionally managed Gold Crest Orchard. The grey cells have been
discounted to get an accurate comparison when excluding the orchard differences that are not
related to production methodology.
Table 16: Carbon footprint of organic Angus and conventional Gold Crest orchards
Units
Angus Orchard
Organic
Gold Crest Orchard
Conventional
Difference
Carbon Sequestration
CO2 Sequestrated in Permanent Plant Biomass t CO2-eq per ha 3.0 3.5 -0.5
CO2 Sequestrated in Natural Shelter t CO2-eq per ha 1.2 3.8 -2.5
CO2 Sequestrated in Soil (Plant) t CO2-eq per ha 14.3 16.7 -2.4
CO2 Sequestrated in Soil (Compost) t CO2-eq per ha 11.4 10.3 1.1
Total Carbon Sequestration t CO2-eq per ha 29.8 34.1 -4.3
Carbon Emissions
Direct Carbon Emissions (Scope 1 & 2)
Fuel t CO2-eq per ha 1.0 0.9 0.1
Electricity t CO2-eq per ha 0.7 0.7 0.0
Total t CO2-eq per ha 1.7 1.6 0.1
Embodied Carbon Emissions (Scope 3)
Orchard Capital t CO2-eq per ha 2.0 1.1 0.8
Fertiliser Inputs t CO2-eq per ha 0.5 0.7 -0.3
Spray Inputs t CO2-eq per ha 0.7 1.9 -1.2
Compost Preparation t CO2-eq per ha 0.7 0.6 0.1
Lime Inputs t CO2-eq per ha 0.4 0.9 -0.4
Total t CO2-eq per ha 4.2 5.2 -1.0
Soil Carbon Emissions (Additional Scope)
Decomposition of Plant Matter t CO2-eq per ha 11.7 13.7 -2.0
Decomposition of Compost t CO2-eq per ha 9.3 8.4 0.9
N2O Emissions t CO2-eq per ha 0.0 0.7 -0.7
Total t CO2-eq per ha 21.0 22.8 -1.7
Total Carbon Emissions t CO2-eq per ha 27.0 29.6 -2.6
Net Carbon Footprint (Actual) t CO2-eq per ha 2.8 4.5 -1.7
Difference with equal shelter, capital, plant density t CO2-eq per ha 2.8 0.7 2.1
4.1.3 Comparison Across Different Plant Ages
Of the kiwifruit and apple orchards chosen for this case study, two were in the first year
development stage (Springhill apples and Wiroa kiwifruit), one was in the year following
grafting/conversion to a different variety (Maha West kiwifruit), and two were approximately 90%
mature (Angus and Gold Crest kiwifruit). To compare the relative carbon footprint of orchards from
development to maturity, the data collected from these orchards has been amalgamated.

28
For a kiwifruit orchard’s carbon footprint from development, the following assumptions were made:
• An intensive planting density (936 plants per ha) with mature production reached in Year 8
following planting.
• Assumes no natural shelter
• Compost applied as per the Wiroa orchard for Year 1, Maha West for Year 2 until Year 6, and
Gold Crest from Year 6 until Year 8
• Pruning of growth starts at 0% for Year 1 and Year 2 and then increases to 50% by Year 6
(Page, 2009)
• Soil decomposition emissions based on the plant sequestration and pruning regime.
• All other emissions based on the Wiroa orchard for Year 1, Maha West for Year 2 until Year 6,
and Gold Crest from Year 6 until Year 8
In the figure below, the drop off in sequestration after Year 5 is primarily due to the decrease in
compost applied between the two years as well as the increasing production offsetting the close to
mature sequestration per plant. Therefore, a higher proportion of the total carbon sequestrated is
removed from the system and calculation as fruit.
Figure 4: Kiwifruit carbon footprint from development
For an apple orchard’s carbon footprint from development, the following assumptions were made:

29
• An intensive planting density (3,906 plants per ha) with mature production reached in Year 7
following planting.
• Assumes no natural shelter and no compost applied
• Pruning of growth starts at 0% for Year 1 and Year 2 and then increases to 30% by Year 4
(Page, 2009)
• Soil decomposition emissions based on the plant sequestration and pruning regime.
• All other emissions based on the Springhill orchard for Year 1 (11.2 tCO2-eq per ha),
increasing to a mature emissions of 17 t CO2-eq per ha by Year 5
Figure 5: Apple carbon footprint from development

30
Discussion
5.1 Is the Industry Sustainable?
5.1.1 Horticulture’s Carbon Footprint
New Zealand’s horticultural sector has undergone considerable investment growth in the last 20
years. Both domestic and international investors have been drawn by the prospect of asset growth
and promising future returns with on and off-farm investment in the industry increasing from $6.5 bn
in 2000 to $57.3 bn in 2019 (New Zealand Institute for Plant and Food Research Ltd, 2020; The
Horticulture & Food Research Institute of New Zealand Ltd, 2000). This growth has until recently
been largely driven by financial returns. However, there is a growing interest in the industry as a
sustainable option for food production that both provides a nutritional, healthy product as well as
acting as a carbon sink for the atmosphere.
This study has strived to measure the assumption that the industry has a net positive impact on the
environment. In this study, an analytical carbon model was used as a proxy to get an understanding
of the general sustainability of the horticultural industry. Using this generalisation, the results have
shown that the horticultural sector can be considered to have a positive impact on the environment.
The Glenpark vineyard had a net carbon sequestration of 24.2 t CO2-eq while both the producing
kiwifruit orchards (Gold Crest and Angus) and the recently converted Maha West kiwifruit orchard
had a net positive impact of sequestrating 10.8, 9.4 and 6.7 t CO2-eq, respectively. Both the
development orchards were the only ones to have a net carbon emission or footprint with the
Springhill apple development having net emissions of 127.3 t CO2-eq and the Wiroa kiwifruit
development having net emissions of 102.8 t CO2-eq.
5.1.2 Different Crop Types
The analyses across the different crop types was focused on their respective sequestration potential.
This was because the carbon emissions (Scopes 1, 2 & 3) were largely relative to the orchard’s
management rather than the crop type. As was expected, both the vineyard at Glenpark and the
close to mature kiwifruit orchards had a similar sequestration potential. This was because both are
similar plants, being perennial deciduous vines that require structural support. In comparison the
apple orchard at Springhill has the potential for considerably larger sequestration as a larger tree.
This was shown with the comparison between the “as if mature” Springhill, Wiroa and the Glenpark

31
vineyard. The Springhill orchard has the potential to sequester 2.2x the mature Wiroa kiwifruit
orchard and 3.5x the Glenpark vineyard.
One of the input factors that does differ between crop types is the application of compost. Both the
vineyard and the apple orchard didn’t apply any compost whereas all of the kiwifruit orchards
applied at least 9 tonnes of compost per hectare. This impacts the sequestration and emissions of
the orchards through soil carbon inputs and decomposition as well as the Scope 3 embodied
emissions relative to the creation and preparation of the compost.
5.1.3 Organic or Conventional?
To compare the difference between organic and conventionally managed orchards, the conventional
Gold Crest and the organic Angus orchard were analysed. The results showed that across the whole
orchard system, the Gold Crest orchard had a greater net sequestration than the organic Angus
orchard. However, a large proportion of this result was influenced by factors other than the
production methodology. Therefore, when the different plant densities, amount of natural shelter
and orchard capital, and the amount of lime applied had been removed the organic system was
proven to be more “sustainable” by sequestrating an extra 2.1 t CO2-eq per hectare.
This variation between the organic and conventional management is primarily from the amount of
compost applied and the agrichemicals used. The higher compost application with the organics is as a
replacement for the inorganic nitrogen applied in the conventional system. However, as the amount
of compost impacts both the sequestration potential of the orchard and the emissions (both
embodied and from decomposition) the net impact of applying more compost is actually only
minimal (only contributes 0.1 t CO2-eq to the variation between both systems). The significantly
higher agrichemical spray related emissions for the Gold Crest orchard provide the main difference
between the emissions. Although the Gold Crest orchard does apply more sprays, part of the
difference is potentially due to the different orchard locations (Gold Crest is in Northland and Angus
is in Bay of Plenty) requiring different spray programmes.
Muller, Holmes, Deurer & Clothier (2015) modelled the difference in emissions between organic and
conventionally grown kiwifruit. Their study was based on the emissions of the use of agrichemicals,
fertilisers, fuel and electricity. They found that there was an insignificant difference between
conventional (“integrated”) and organically managed orchards. The conventional orchards emitted
4.93 t CO2-eq per ha while the organic orchards emitted 4.40 t CO2-eq per ha. In comparison, this
research found that the organic Angus orchard emitted 4.0 t CO2-eq per ha compared to the
conventional Gold Crest orchard emissions of 5.7 t CO2-eq per ha. A potential fault of this model is

32
that only the inorganic N is included in the N2O emissions. In reality, the organic N applied (from
fishmeal and compost) would also impact these emissions. This would potentially reduce the greater
variation between the organic and conventional systems shown in this research versus the Muller,
Holmes, Deurer & Clothier (2015) study.
Overall, both the study and this research showed benefits in environmental sustainability, for having
organic management. Further research could analyse the intensity of this result by comparing the
footprint on a production basis (i.e. per tray of kiwifruit produced) or on a returns basis (i.e. per $
income per hectare).
5.1.4 Footprint from Development
The age of the orchard and the plants within it impacts both the sequestration potential and the
emissions, particularly the soil organic matter decomposition. To provide an understanding of the
changes that occur as an orchard matures, a comparison was made between kiwifruit and apple
orchards as they develop.
The kiwifruit orchard summary showed a steady increase in net footprint until Year 5 where the
change in compost assumptions reduced the expected net sequestration to approximately 2.5 t CO2-
eq per hectare per year. The modelled orchard started having a net positive footprint (i.e. net
sequestration) in Year 2 with a cumulative net positive impact achieved in Year 4.
Overall, the total Scope 1, 2 & 3 emissions (i.e. not including the decomposition) stayed relatively
constant with the main variation caused by increases in soil decomposition as the compost and plant
matter added to the soil increased. The split within the emissions changed as the orchard developed.
In the development year, there is a higher proportion of Scope 1 emissions due to the fuel required
for ground preparation and the construction of the orchard while a mature orchard has higher Scope
3 emissions, particularly from fertiliser and spray inputs. This is shown with the fuel portion being
37% of the combined Scope 1, 2 and 3 emissions for Wiroa while this is only 14% for Gold Crest. In
contrast the fertiliser and spray inputs comprise 6% of the combined Scope 1, 2 and 3 emissions for
Wiroa while this is 38% for Gold Crest.
The apple orchard summary showed a more even increase in net footprint without the impact of
changing compost applications. Overall, an apple orchard is shown to have a greater net
sequestration at maturity (4.7 t CO2-eq per ha compared to 2.6 t CO2-eq per ha for kiwifruit).
However, the orchard also has a greater net negative footprint (net emissions) in the early

33
development years. A positive net footprint is not expected to be reached until Year 4 with a
cumulative net positive impact not achieved until Year 9.
As there is no literature that has already researched the emissions of orchards in the development
phase, there are no checks that can be used to compare the reliability of this research. However, as
the model is believed to be reasonably accurate at a mature level there is no reason why these
assumptions may not be in the correct range of emissions for the younger orchards (shown with net
kiwifruit footprint of 2.6 t CO2-eq per ha compared to Page (2009) net footprint of 2.4 t CO2-eq per
ha).
5.1.5 Additional Key Drivers
In addition to the key drivers of plant age, orchard management and crop type, the orchard layout
had a major impact on the properties net carbon footprint. This was particularly relevant to the
amount of orchard capital required and the planting density.
The more capital required to operate the orchard (e.g. hail nets or additional buildings) the greater
the embodied emissions. This can be seen in comparison between the Gold Crest and Angus
orchards. The Gold Crest orchard has natural shelter and limited orchard infrastructure apart from
the necessary vine support structures and irrigation. In comparison, the Angus orchard is largely
covered by hail netting, has less natural shelter and sources water from a well on the property. These
factors mean that the Gold Crest orchard sequestrates an extra 2.5 t CO2-eq per hectare from the
natural shelter and has 0.8 t CO2-eq per hectare less embodied emissions in its orchard capital.
The planting density has a large impact on the modelled sequestration and therefore the potential
decomposition of soil organic matter. This is demonstrated by increasing the planting density of the
Angus orchard to the intensive double planted, opposing female 4m by 6m design (i.e. 936 plants per
hectare compared to the actual ~600 per hectare). This would increase the net sequestration of the
orchard by a factor of at least 2 (19.6 t CO2-eq per hectare compared to the actual 9.4 t CO2-eq per
hectare). However, this could be influenced by the model set up rather than an actual increase. For
example, the modelled linear increase in sequestration as the planting density increases may in
reality reach a certain equilibrium in that as the density increases the plants get smaller, thereby
maintaining a relatively even sequestration per hectare. This issue requires further research for
better understanding and is a potential issue with this model.

34
5.1.6 Model Comparison to Literature
As a measure of the modelling accuracy the results for the mature kiwifruit orchards (Gold Crest and
Angus) were compared to the relevant literature. As can be seen in the table below the modelled
systems were relatively similar to the literature (after adaptations had been made for the different
metrics used). Both modelled orchards had similar emissions to the Mithraratne, Marber & McLaren
(2010 study) and the Muller, Holmes, Deurer & Clothier (2015) study. The variance between Muller,
Holmes, Deurer & Clothier (2015) and Nabavi-Pelesaraei, Rafiee, Hosseinzadeh-Bandbafha &
Shamshirband (2016) is because of the exclusion of compost and lime in the latter research. The
difference between the Page, Kelly, Minor & Cameron (2011) study and this research (both had
similar model assumptions) is because of the soil emissions. The large variation between these is due
to the higher plant density and greater compost application impacting soil inputs and therefore
decomposition. The literature modelled a density of 500 plants per hectare compared to 600 and 700
plants per hectare for Angus and Gold Crest respectively. It also modelled a compost application of 8
tonnes per hectare compared to 15.5 and 14 tonnes per hectare for Angus and Gold Crest
respectively.
Table 17: Comparison of kiwifruit emissions to literature
Source Relative Emissions
Orchard capital,
Result from the
Literature
Comparison from Gold
Crest Orchard
Comparison from Angus
Orchard
Mithraratne, Barber &
McLaren (2010)
Page, Kelly, Minor &
Cameron (2011)
Muller, Holmes, Deurer &
Clothier (2015)
Nabavi-Pelesaraei, Rafiee,
Hosseinzadeh-Bandbafha
& Shamshirband (2016)
agrichemicals, fertiliser, fuel
and electricity and seasonal
workers
Orchard capital,
agrichemicals, fertiliser,
fuel, electricity, and soil
emissions
Agrichemicals, fertiliser and
fuel and electricity (gold
Kiwifruit)
Agrichemicals, fertiliser and
fuel and electricity
5.8 tCO2-eq per
ha
16.9 tCO2-eq per
ha
5.4 tCO2-eq per
ha
1.3 tCO2-eq per
ha
6.2 tCO2-eq per
ha
29.6 tCO2-eq per
ha
5.7 tCO2-eq per
ha
4.2 tCO2-eq per
ha
5.3 tCO2-eq per
ha
27.0 tCO2-eq per
ha
4.0 tCO2-eq per
ha
2.9 tCO2-eq per
ha
The results from the Glenpark vineyard are similar to the Barry (2011) literature, although the more
intensive nature of Glenpark means that its relevant emissions are slightly higher (approx. 3.1 t CO2-
eq per hectare compared to 2.0-2.7 t CO2-eq per hectare in the research).
As the Springhill example orchard is only in development its emissions are only approximately 63% of
the most comparable Page, Kelly, Minor & Cameron (2011) study. As this orchard develops it would
be expected to have similar if not greater emissions than the comparable research due to its highly
intensive and capital heavy set up.

35
5.2 Impact Investing Opportunities
5.2.1 Gathering Diverse Opinions on Sustainable Investment and Reporting
The global perspective on investment is changing. The next generation of investment is becoming
increasingly focused on shifting to whole system value creation rather than purely financial returns.
Even the world’s largest investment fund, BlackRock, has recognised this shifting paradigm. Larry
Fink, BlackRock’s CEO, stated that “To prosper over time, every company must not only deliver
financial performance, but also show how it makes a positive contribution to society” (KPMG, 2019).
However, this increasing focus on sustainable and impact investment is not universal. Some financial
institutions remain towards the beginning of the journey and are still traditionally focused solely on
the financial returns. This spectrum from traditional investment, through to impact investment is
shown in the figure below.
Figure 6: Sustainable Investment Spectrum (The Aotearoa Circle, 2020)
To gauge an understanding of how New Zealand managed primary industry investment groups and
corporate scale farmers see themselves on the above spectrum, leaders within four different
organisations were interviewed.
The first of these is Craigmore Sustainables (“Craigmore”). Craigmore is a farm and forest investment
manager in New Zealand. The majority of their capital comes from overseas high net worth
individuals and institutions, particularly from Europe. As asset managers focused on overseas capital,
36
they are exposed to the changing investment opinions and provide an understanding of the interests
and opinions of large foreign investors.
The second is Port Blakely. Port Blakely is a tightly controlled, 6th generational family owned global
forestry company with a strong presence in the New Zealand forestry sector. As a foreign (US) family
owned business, they provide a different perspective to Craigmore while also providing an
understanding of the interests of foreign investment into New Zealand.
The third is MyFarm. MyFarm are focused on New Zealand-based investment into the primary
sector. As an investment vehicle driven by relatively large numbers of New Zealand investors, they
provide a domestic perspective on sustainable investment into the primary sector.
The final interview was of Dairy Holdings Limited (“DHL”). DHL is New Zealand’s largest dairy farming
company with the majority of ownership with two long term New Zealand farming families and a
minority ownership by Sooke Investments, a Canadian public sector pension fund. This example
provides an understanding of the perspective of large New Zealand family investment as well as the
influence of foreign capital on a business.
5.2.2 Investor Driven Sustainable Investment
The first attribute to moving further down the scale towards impact investment is to understand the
drivers of the investors in the sector. This provides background to the changing mindset in the
markets and is at the core of the reason why investment vehicles will change their focus and strategy
for capital deployment going forward.
Interest from the investors of the four organisations in sustainable investment and reporting was
varied. On the scale shown in the previous section, Port Blakely was closely aligned to the impact
investment theory. Sustainability, and a positive impact on the environment and social matters, was
a key part of their vision and goals. Although not necessarily required, the family investors would go
to the extent of taking a reduction in potential short-term financial returns in order to provide a
longer-term whole value chain benefit. Craigmore investor’s interests were mixed. The majority of
investors would like Craigmore to sit further towards the impact investment side but struggled to
clearly articulate and put their ambitions and interests into practice. DHL investors, both domestic
and foreign, are interested and supportive in the progress that DHL is making in this space, however
their primary focus remains on financial returns. In comparison MyFarm’s investors are still heavily
focused on economic parameters and financial returns. The company itself is making proactive
investment decisions based on potential sustainability risks and opportunities (e.g. investment into

37
Manuka honey); however, this is largely because of the financial benefits of these decisions rather
than a target of whole system gain.
The causes of the varied opinions of the four organisations interviewed showed that there is a large
variation between the opinion of the different nationalities and types of the investors into New
Zealand’s primary sector. Investors from different areas and nations around the world are in
different spaces on the impact investment spectrum. Craigmore has found that particularly Northern
European (i.e. Scandinavian) states are more focused on the sustainability of their investments. In
comparison the domestic New Zealand based investors are still largely focused on financial metrics,
as seen by the opinions of the MyFarm and the domestic DHL investors. For DHL, the new Canadian
investors are further advanced on the sustainable investment journey and are more concerned with
their public image and responsibility. This analysis has also been seen in different government
stimulus responses to Covid economic downturns. The figure below shows that there is a significant
difference in the scale of funds flowing into environmentally intensive sectors and the efforts which
steer stimulus towards (green) or away from (brown) pro-environmental recovery. European nations
in general are more focused on sustainable investment than particularly the US, China and India.
Canada is shown to offer promise but is split between both green and brown stimulus packages.
Figure 7: Stimulus packages in response to Covid-19, by type of stimulus (Generation Investment Management, 2020a)
38
In addition to the location of investors, the analysis showed that there is a significant difference in
opinion between with the age and type of investors. MyFarm’s investors are largely “baby boomers”.
This demographic has grown up in and become accustomed to the traditional attitude towards
investment (i.e. prioritising financial returns). As this demographic moves further towards the
younger generations, primarily “millennials”, the opinion of investors towards sustainability and
impact is expected to change. This sentiment is also held by investors such as Karam Hinduja who, at
29 years old, is a fourth generation of the Hinduja family, the third richest in India. He sees this new
wave of investors as one of the key movements in the 2020s which will bring impact investing into
the mainstream; “the more dire our global challenges become, the more this group will mobilise with
capital and entrepreneurship” (Chiu, 2020). A study in the US by Morgan Stanley, found that there is
a variation in interest in sustainable investing between the general pool of investors (75% interested)
and millennials (86% interested) (Morgan Stanley Institute for Sustainable Investing, 2017). As well as
the age and generation of investors, the type of investors also plays a key role in the attitude they
have to impact investing. For example, Port Blakely’s family investors have a holistic opinion to
investment where they understand that a sustainable focus will be beneficial for financial returns, as
well as the environment and society, in the long term. This view is likely to have arisen because of
the multi-generational approach they have taken to investment (6th generation of family ownership)
compared to larger financial institutions being more focused on the shorter-term rewards.
5.2.3 Sustainability Reporting to Investors
For effective sustainable and impact investment there needs to be accurate and comparable data
and reporting of environmental and social goals. However, there is generally a lack of consistency
and availability amongst companies on their reporting of sustainability or “ESG”. Of the
organisations interviewed, Craigmore is the most advanced in this space and uses internally built ESG
metrics for annual reporting to investors. These use quantitative metrics where possible; however,
the majority are narrative based. In comparison, Port Blakely relies more on a trust and narrative
based approach to its sustainability reporting. This is because of the smaller, tightly controlled family
investors compared to the larger financial institutions with Craigmore. MyFarm have just started the
process of looking at ESG metrics and are not actively reporting on them currently. DHL has aligned
its reporting to its major product customer, Fonterra. They have manipulated and applied their own
quantitative-based metrics to the Cooperative Difference programme. In general, there are several
different options available to investment management companies for sustainability reporting. The
most widely used example of this is the Global Reporting Initiative (GRI) which is aimed at providing
transparent global standards and a common language for reporting a company’s impacts. However,
39
these standards are not commonly applied in New Zealand with only 17 of the 50 S&P/NZX 50 Index
companies using GRI, despite a large portion of investors wanting ESG reporting (95% of Kiwisaver
investors want ESG factors considered when investing) (The Aotearoa Circle, 2020).
This lack of consistency is one of the issues with sustainable investing as it allows for companies to
“greenwash” their reports. “Greenwashing” is when products and assets have claimed green
credentials that in reality have little positive impact. This is why it is important that the standards are
either universal or externally accredited. An example of this is the Forest Stewardship Council (FSC)
certification for Port Blakely. Despite their relationship with the investing family being built on trust
and an understanding of the vision, it still helps to provide external and universal accreditation and
confirmation that their vision and values are being followed. This requirement for external
verification is one of the reasons that accreditation organisations such as “Certified B Corporation”
are so successful.
Another solution to the lack of consistency is to have a national accounting system alongside
standard definitions for “green” and “sustainable” investment. This is emerging in global markets,
particularly in Europe. There are now definitions for “green or sustainable” debt investments with
the Green Bond Principles and the Climate Bonds Initiative. The EU have also recently created a
specific standard and taxonomy for finance in a sustainable economy through the EU Technical
Expert Group on Sustainable Finance (HEG) (The Aotearoa Circle, 2020). However, the New Zealand
market lacks a specific standard and would potentially not be well aligned to other global standards
due to its different climate and productions systems. Groups such as the Aotearoa Circle, a
partnership of public and private sector leaders committed to the pursuit of sustainable prosperity of
New Zealand’s natural resources, are actively working towards a unified definition that could be used
for sustainability accounting.
5.2.4 Fund Raising: Opportunities for Change
Since inception, Craigmore has had to change their fund-raising approaches as their understanding of
the investors they are pitching to, has increased and as the interests and drivers of the investor’s
decision making have shifted. Originally, they focused purely on the financial and economic aspects
of Craigmore’s investment opportunities. In the last few years this changed to being more focused on
the competitive advantage of New Zealand as a food producing nation and the economics involved
with the food production. However, recently they have seen an increasing relevance of the
sustainability metrics and the impact that Craigmore’s farms and orchards have on the environment
and society. This shift is particularly obvious in the European investors and is the reason for starting
40
to move the focus of the fund-raising pitches to a more sustainability-based approach. In
comparison, MyFarm relies on the economics and financial performance of their investment vehicles
in their fund-raising efforts. Sustainability is considered in their investment decisions; however, it
does not seem to add any value to their pitches to New Zealand investors. At the current time and to
the current investor base, it is not believed that being able to use a statement such being “net carbon
zero” would add any value or increase market demand from investors. These differences in opinion
again highlight the variation between the New Zealand and foreign (particularly European) investors.
The recent report by The Aotearoa Circle highlighted “mobilising of capital” as one of the three
themes that need to occur for New Zealand to move towards a sustainable finance economy (The
Aotearoa Circle, 2020). A key pathway of this theme is to scale up the access to impact investing
opportunities. Even though the domestic New Zealand investors are only just starting on the journey
towards becoming focused on impact investment, the international equity markets are increasingly
focused in this space, as highlighted by the difference between MyFarm and Craigmore. This
international focus is already being capitalised on by large investment managers around the world. In
January 2020, BlackRock made an active decision to make sustainability integral to the way the
company operates. This is grounded from the two core convictions created from market research;
one that companies who focus on sustainability related issues will be more resilient in the long term,
and two that “we are on the front end of a profound, long-term structural shift in global investor
preferences toward sustainability that is not fully priced into the market today and may therefore
drive outperformance during a long transition period” (BlackRock, 2020). This mentality has already
been used for some time by other funds such as Generation Investment Management. Since their
founding in 2004, Generation has been focused on the development of sustainable investment and
demonstrating the long-term commercial benefits of this decision. This has allowed them to grow to
US$ 25.7bn assets under management as of September 2020 (Generation Investment Management,
2020b). Overall, this shifting focus overseas presents an attractive opportunity for primary sector
investment managers, and corporate farmers requiring capital, to market themselves as sustainable
through transparent metrics and thereby access the growing impact focused investor base.

41
Conclusion
This research provides a potential understanding of the environmental sustainability of the
horticultural industry by using the carbon footprint of a selection of Craigmore Sustainables’
horticultural properties as a proxy. Overall, the producing orchards and vineyards were shown to
have a net positive impact on the environment through large sequestration by the plants and
compost. The total impact of the six orchards measured was a net emission of 179.1 t CO2-eq in the
2019-20 season. However, this was heavily weighted towards the two developing orchards that were
shown to have comparatively high net emissions in their early years. It was shown that there is
significant variation in the sequestration potential of different crop types (apples have the greatest
potential sequestration per ha). In addition, the impact of organics was tested across the kiwifruit
orchards with organic management producing less emissions overall than a conventional orchard.
By measuring and clarifying the general assumptions on sustainability, this study allows for better
understanding into the potential for impact investing into the sector. The ability of orchards and
vineyards to be a carbon sink, following development, allows for investors to have confidence that
they are not only gaining financial returns but also having a net positive impact on the environment.
This quantifiable metric provides the ability for Craigmore, to source additional capital that would
otherwise not be available to it, thereby providing an opportunity for the continued growth of the
sector.
Across the multiple interviews and literature reviewed, it was shown that there is significant variation
in the positioning of investment funds and corporate farmers on the idea of impact investing. Foreign
and younger investors and correspondingly their asset managers, appeared to be further advanced in
the understanding of impact investment and its opportunities. However, for the New Zealand market
to fully appreciate and take advantage of impact investment opportunities that will arise in the
primary industry space, there needs to be changes to the consistency and transparency of
sustainability reporting and fund raising. These could include universal external accreditation
programmes or consistent national accounting standards.
42
Recommendations
The recommendations that emerge from this report can be broken down into two separate areas:
those for the modelling and measurement of sustainability in the horticultural industry, and those for
the industry’s investment sector to capture the possibilities of the impact investment movement.
Although this study provides a baseline understanding of the potential sustainability of the
horticultural industry, there are several factors that need to be considered in either further research
or by leading organisations within the sector. These are:
• Where possible, the increase in establishment and use of other quantifiable sustainability
metrics in addition to carbon footprinting. Although the carbon footprint provides a proxy of
the environmental sustainability of the industry, other metrics will be key to the practical
uptake and continued use of sustainability reporting that is required for effective impact
investment
• Provide actual on-orchard data to test the strength and applicability of the carbon footprint
modelling. Examples of this could be soil carbon measurements or measurements of plant
biomass (this has been trialled in the viticulture industry with relationships between trunk
diameter and carbon sequestrations analysed)
• Further research into the environmental sustainability of orchards in an intensity-based
approach such as kg CO2-eq per tray produced or per $ return. This would align the focus of
the impact reporting more closely to the idea of “whole value chain” benefits rather than
compartmentalising the different objectives.
The recommendations for the primary industry investment sector are:
• To increase the measurement and reporting of the sustainability of the industry and
therefore utilise the existing foreign impact investment interest as well as being prepared for
when the domestic New Zealand investor base ultimately increase their focus on impact
investment.
• For the industry to either create a universal accredited standard of reporting and
measurement for sustainability of a business or to align itself to current global reporting
standards and initiatives. This will increase investor confidence in the industry and therefore
increase the potential for impact investment.

43
References
Barber, A., & Scarrow, S. (2001). Kiwifruit energy audit. Pukekohe and Tauranga: Agriculture New
Zealand Ltd.
Barry, M.T. (2011). Life cycle assessment and the New Zealand wine industry: A tool to support
continuous environmental improvement. (Masters thesis). Massey University, Wellington, New
Zealand
BlackRock. (2020). Helping our clients invest sustainably. Retrieved from
https://www.blackrock.com/au/individual/about-us/sustainability-progress-update
Chiu, B. (2020, January 10). A next gen investor’s prediction on impact investing in 2020s. Retrieved
from https://www.forbes.com/sites/bonniechiu/2020/01/10/a-next-gen-investors-predictions-
on-impact-investing-in-2020s/#1258c645646c
Custance, J., & Hillier, H. (1998). Statistical issues in developing indictors of sustainable development.
Journal of Royal Statistical Society, 161(3), 281-291.
Eccles, R.G., Ioannou, I., & Serafeim. (2014). The Impact of Corporate Sustainability on Organizational
Processes and Performance. Management Science, 60(11), 2835-2857.
Generation Investment Management. (2020a). Sustainability Trends Report 2020. Retrieved from
https://str2020.generationim.com/chapters/introduction
Generation Investment Management. (2020b). Our Story. Retrieved from
https://www.generationim.com/firm-overview/our-story/
Goward, J., & Whitty, M. (2014). Estimating and Predicting Carbon Sequestration in a Vineyard using
Precision Viticulture Techniques. In, Proceedings of the 19th Association of Public Authority
Surveyors Conference (APAS2014), Pokolbin, Australia, 31 March – 2 April 2014.
Hochstadter, A.K., & Scheck, B. (2014). What’s in a name: an analysis of impact investing
understandings by academics and practitioners. Journal of Business Ethics, 132, 449-475. DOI:
10.1007/s10551-014-2327-0
KPMG. (2019). The numbers that are changing the world: Revealing the growing appetite for
responsible investing. Retrieved from

44
https://assets.kpmg/content/dam/kpmg/ie/pdf/2019/10/ie-numbers-that-are-changing-the-
world.pdf
Kroodsma, D.A., & Field, C.B. (2006). Carbon sequestration in California agriculture, 1980-2000.
Ecological Applications, 16(5), 1975-1985.
McLaren, S., Hume, A., Barber, A., Clothier, B., Deurer, M., East, A., Greenhalgh, S., McDonald, R.,
Palmer, J., & Sinclair, R. (2009). Carbon Footprinting for the Apple Supply Chain: Project
Summary. Auckland, New Zealand: Landcare Research.
Ministry for Primary Industries. (2018). Carbon sequestration potential of non ETS land on farms.
Wellington: Manaaki Whenua – Landcare Research.
Ministry for the Environment. (2019a). Climate Change Response (Zero Carbon) Amendment Bill:
Summary. Wellington: Ministry for the Environment.
Ministry for the Environment. (2019b). Measuring Emissions: A guide for organisations. 2019
Detailed Guide. Wellington: Ministry for the Environment.
Mithraratne, N., Barber, A., & McLaren, S.J. (2010). Carbon Footprinting for the Kiwifruit Supply Chain
– Report on Methodology and Scoping Study. Auckland, New Zealand: Landcare Research.
Morgan Stanley Institute for Sustainable Investing. (2017). Sustainable Signals: New Data from the
Individual Investor. Retrieved from
https://www.morganstanley.com/pub/content/dam/msdotcom/ideas/sustainable-
signals/pdf/Sustainable_Signals_Whitepaper.pdf.
Muller, K., Holmes, A., Deurer, M., & Clothier, B.E. (2015). Eco-efficiency as a sustainability measure
for kiwifruit production in New Zealand. Journal of Cleaner Production, 106, 333-342.
http://dx.doi.org/10.1016/j.jclepro.2014.07.049
Nabavi-Pelesaraei, A., Rafiee, S., Hosseinzadeh-Bandbafha, H., & Shamshirband, S. (2016). Modelling
energy consumption and greenhouse gas emissions for kiwifruit production using artificial
neural networks. Journal of Cleaner Production, 133, 924-931.
http://dx.doi.org/10.1016/j.jclepro.2016.05.188
New Zealand Institute for Plant and Food Research Ltd. (2020). Fresh Facts: New Zealand Horticulture
2019. Retrieved from https://www.freshfacts.co.nz/files/freshfacts-2019.pdf

45
Page, G. (2009). An environmentally-based systems approach to sustainability analyses of organic
fruit production systems in New Zealand. (Doctoral thesis). Massey University, Palmerston
North, New Zealand.
Page, G., Kelly, T., Minor, M., & Cameron, E. (2011). Modelling Carbon Footprints of Organic Orchard
Production Systems to Address Carbon Trading: An Approach Based on Life Cycle Assessment.
HortScience, 46(2), 324-327.
Pinares-Patino, C.S., Waghorn, G.C., Hegarty, R.S., & Hoskin, S.O. (2009). Effects of intensified cation
of pastoral farming on greenhouse gas emissions in New Zealand. New Zealand Veterinary
Journal, 57(5), 252-261. DOI: 10.1080/00480169.2009.58618
Saunders, C., Barber, A., & Taylor, G. (2006). Food Miles – Comparative Energy/Emissions
Performance of New Zealand’s Agriculture Industry. Lincoln, New Zealand: Agribusiness and
Economics Research Unit, Lincoln University.
Sharma, V. (2002). Report on the international conference on EcoBalance and life cycle assessment in
India. The International Journal of Life Cycle Assessment, 7(3), 179-179.
Tellegen, E. (2006). Sociology & sustainable development. A literature review. The Hague: DHO, The
Dutch Network for Sustainable Higher Education.
The Aotearoa Circle. (2020). Sustainable Finance Forum: Interim Report 2019. New Zealand: The
Aotearoa Circle.
The Horticulture & Food Research Institute of New Zealand Ltd. (2000). Horticulture Facts and
Figures 2000. Retrieved from https://www.freshfacts.co.nz/files/new-zealand-horticulture-
facts-and-figures-2000.pdf
WCED. (1987). Our common future, OUP. Oxford: Oxford University Press
Wells, C. (2001). Total Energy Indicators of Agricultural Sustainability: Dairy Farming Case Study.
Wellington, New Zealand: Ministry of Agriculture and Forestry.

46
Appendices
9.1 Carbon Model Calculations and Assumptions
The direct emission for fuel use (kgCO2-eq per ha) is estimated as:
∑(𝐹𝑢𝑒𝑙 𝑈𝑠𝑒 𝑓𝑟𝑜𝑚 𝐶𝑜𝑛𝑡𝑟𝑎𝑐𝑡𝑜𝑟 𝐴𝑐𝑡𝑖𝑣𝑖𝑡𝑖𝑒𝑠 + 𝐹𝑢𝑒𝑙 𝑃𝑢𝑟𝑐ℎ𝑎𝑠𝑒𝑠 (𝐿 𝑝𝑒𝑟 ℎ𝑎))
× 𝐸𝑛𝑒𝑟𝑔𝑦 𝐶𝑜𝑒𝑓𝑓𝑖𝑐𝑖𝑒𝑛𝑡 (𝑀𝐽 𝑝𝑒𝑟 𝐿) × 𝐶𝑂2 𝐸𝑚𝑖𝑠𝑠𝑖𝑜𝑛 𝐶𝑜𝑒𝑓𝑓𝑖𝑖𝑒𝑛𝑡 (𝑘𝑔𝐶𝑂2𝑒𝑞𝑣 𝑝𝑒𝑟 𝑀𝐽)
Using the following assumptions:
− 46.70 MJ per L (Wells, 2001)
− 0.08 kgCO2-eq per MJ (Wells, 2001)
The direct emission for electricity use (kgCO2-eq per ha) is estimated as: 𝐸𝑙𝑒𝑐𝑡𝑟𝑖𝑐𝑡𝑦 𝑈𝑠𝑒 (𝑘𝑊ℎ 𝑝𝑒𝑟 ℎ𝑎) × 𝐸𝑛𝑒𝑟𝑔𝑦 𝐶𝑜𝑒𝑓𝑓𝑖𝑐𝑖𝑒𝑛𝑡 (𝑀𝐽 𝑝𝑒𝑟 𝑘𝑊ℎ)
× 𝐶𝑂2 𝐸𝑚𝑖𝑠𝑠𝑖𝑜𝑛 𝐶𝑜𝑒𝑓𝑓𝑖𝑖𝑒𝑛𝑡 (𝑘𝑔𝐶𝑂2𝑒𝑞𝑣 𝑝𝑒𝑟 𝑀𝐽)
Using the following assumptions:
− 7.45 MJ per kWh (Wells, 2001) − 0.06 kgCO2-eq per MJ (Wells, 2001)
The embodied emission for a building (kgCO2-eq per building) is estimated as: 𝑆𝑖𝑧𝑒 𝑜𝑓 𝐵𝑢𝑖𝑙𝑑𝑖𝑛𝑔 (𝑚2) × 𝐸𝑛𝑒𝑟𝑔𝑦 𝐶𝑜𝑒𝑓𝑓𝑖𝑐𝑖𝑒𝑛𝑡 (𝑀𝐽 𝑝𝑒𝑟 𝑚2) × 𝐶𝑂2 𝐸𝑚𝑖𝑠𝑠𝑖𝑜𝑛 𝐶𝑜𝑒𝑓𝑓𝑖𝑐𝑖𝑒𝑛𝑡 (𝑘𝑔𝐶𝑂2𝑒𝑞𝑣 𝑝𝑒𝑟 𝑀𝐽)
𝑊𝑜𝑟𝑘𝑖𝑛𝑔 𝑈𝑠𝑒𝑓𝑢𝑙 𝐿𝑖𝑓𝑒 𝑜𝑓 𝐵𝑢𝑖𝑙𝑑𝑖𝑛𝑔
Using the following assumptions: − 590 MJ per m2 (Wells, 2001)
− 0.10 kgCO2-eq per MJ (Wells, 2001)
The embodied emission for a vehicle (kgCO2-eq per vehicle) is estimated as: 𝑀𝑎𝑠𝑠 𝑜𝑓 𝑉𝑒ℎ𝑖𝑐𝑙𝑒 (𝑘𝑔) × 𝐸𝑛𝑒𝑟𝑔𝑦 𝐶𝑜𝑒𝑓𝑓𝑖𝑐𝑖𝑒𝑛𝑡 (𝑀𝐽 𝑝𝑒𝑟 𝑘𝑔) × 𝐶𝑂2 𝐸𝑚𝑖𝑠𝑠𝑖𝑜𝑛 𝐶𝑜𝑒𝑓𝑓𝑖𝑐𝑖𝑒𝑛𝑡 (𝑘𝑔𝐶𝑂2𝑒𝑞𝑣 𝑝𝑒𝑟 𝑀𝐽)
𝑊𝑜𝑟𝑘𝑖𝑛𝑔 𝑈𝑠𝑒𝑓𝑢𝑙 𝐿𝑖𝑓𝑒 𝑜𝑓 𝑉𝑒ℎ𝑖𝑐𝑙𝑒
Using the following assumptions: − Mass conversion factor of 40.8 kg per hp + 190 kg (Wells, 2001)
− 160 MJ per kg (Wells, 2001)
− 0.08 kgCO2-eq per MJ (Wells, 2001)
The embodied emission for other machinery (kgCO2-eq per machine) is estimated as: 𝑀𝑎𝑠𝑠 𝑜𝑓 𝑀𝑎𝑐ℎ𝑖𝑛𝑒 (𝑘𝑔) × 𝐸𝑛𝑒𝑟𝑔𝑦 𝐶𝑜𝑒𝑓𝑓𝑖𝑐𝑖𝑒𝑛𝑡 (𝑀𝐽 𝑝𝑒𝑟 𝑘𝑔) × 𝐶𝑂2 𝐸𝑚𝑖𝑠𝑠𝑖𝑜𝑛 𝐶𝑜𝑒𝑓𝑓𝑖𝑐𝑖𝑒𝑛𝑡 (𝑘𝑔𝐶𝑂2𝑒𝑞𝑣 𝑝𝑒𝑟 𝑀𝐽)
𝑊𝑜𝑟𝑘𝑖𝑛𝑔 𝑈𝑠𝑒𝑓𝑢𝑙 𝐿𝑖𝑓𝑒 𝑜𝑓 𝑀𝑎𝑐ℎ𝑖𝑛𝑒
Using the following assumptions: − 80 MJ per kg (Wells, 2001)
− 0.08 kgCO2-eq per MJ (Wells, 2001)
The embodied emission for irrigation pumps (kgCO2-eq per pump) is estimated as: 𝑀𝑎𝑠𝑠 𝑜𝑓 𝑃𝑢𝑚𝑝 (𝑘𝑔) × 𝐸𝑛𝑒𝑟𝑔𝑦 𝐶𝑜𝑒𝑓𝑓𝑖𝑐𝑖𝑒𝑛𝑡 (𝑀𝐽 𝑝𝑒𝑟 𝑘𝑔) × 𝐶𝑂2 𝐸𝑚𝑖𝑠𝑠𝑖𝑜𝑛 𝐶𝑜𝑒𝑓𝑓𝑖𝑐𝑖𝑒𝑛𝑡 (𝑘𝑔𝐶𝑂2𝑒𝑞𝑣 𝑝𝑒𝑟 𝑀𝐽)
𝑊𝑜𝑟𝑘𝑖𝑛𝑔 𝑈𝑠𝑒𝑓𝑢𝑙 𝐿𝑖𝑓𝑒 𝑜𝑓 𝑃𝑢𝑚𝑝
Using the following assumptions: − 160 MJ per kg (Saunders et al., 2006)
− 0.08 kgCO2-eq per MJ (Wells, 2001)
The embodied emission for irrigation wells (kgCO2-eq per well) is estimated as:

47
𝐷𝑒𝑝𝑡ℎ 𝑜𝑓 𝑊𝑒𝑙𝑙 (𝑚) × 𝐸𝑛𝑒𝑟𝑔𝑦 𝐶𝑜𝑒𝑓𝑓𝑖𝑐𝑖𝑒𝑛𝑡 (𝑀𝐽 𝑝𝑒𝑟 𝑚) × 𝐶𝑂2 𝐸𝑚𝑖𝑠𝑠𝑖𝑜𝑛 𝐶𝑜𝑒𝑓𝑓𝑖𝑐𝑖𝑒𝑛𝑡 (𝑘𝑔𝐶𝑂2𝑒𝑞𝑣 𝑝𝑒𝑟 𝑀𝐽)
𝑊𝑜𝑟𝑘𝑖𝑛𝑔 𝑈𝑠𝑒𝑓𝑢𝑙 𝐿𝑖𝑓𝑒 𝑜𝑓 𝑊𝑒𝑙𝑙
Using the following assumptions: − 400 MJ per m (Saunders et al., 2006)
− 0.08 kgCO2-eq per MJ (Wells, 2001)
The embodied emission for irrigation mainlines (kgCO2-eq per property) is estimated as: 𝐿𝑒𝑛𝑔𝑡ℎ 𝑜𝑓 𝑃𝑖𝑝𝑒 (𝑚) × 𝐸𝑛𝑒𝑟𝑔𝑦 𝐶𝑜𝑒𝑓𝑓𝑖𝑐𝑖𝑒𝑛𝑡 (𝑀𝐽 𝑝𝑒𝑟 𝑚) × 𝐶𝑂2 𝐸𝑚𝑖𝑠𝑠𝑖𝑜𝑛 𝐶𝑜𝑒𝑓𝑓𝑖𝑐𝑖𝑒𝑛𝑡 (𝑘𝑔𝐶𝑂2𝑒𝑞𝑣 𝑝𝑒𝑟 𝑀𝐽)
𝑊𝑜𝑟𝑘𝑖𝑛𝑔 𝑈𝑠𝑒𝑓𝑢𝑙 𝐿𝑖𝑓𝑒 𝑜𝑓 𝑃𝑖𝑝𝑒
Using the following assumptions: − 0.65 kg per m of pipe
− 120 MJ per kg of pipe (Saunders et al., 2006) − 0.08 kgCO2-eq per MJ (Wells, 2001)
The embodied emission for irrigation dripline (kgCO2-eq per ha) is estimated as:
𝐷𝑟𝑖𝑝𝑙𝑖𝑛𝑒 𝑝𝑒𝑟 ℎ𝑎 (𝑚) × 𝐸𝑛𝑒𝑟𝑔𝑦 𝐶𝑜𝑒𝑓𝑓𝑖𝑐𝑖𝑒𝑛𝑡 (𝑀𝐽 𝑝𝑒𝑟 𝑚) × 𝐶𝑂2 𝐸𝑚𝑖𝑠𝑠𝑖𝑜𝑛 𝐶𝑜𝑒𝑓𝑓𝑖𝑐𝑖𝑒𝑛𝑡 (𝑘𝑔𝐶𝑂2𝑒𝑞𝑣 𝑝𝑒𝑟 𝑀𝐽)
𝑊𝑜𝑟𝑘𝑖𝑛𝑔 𝑈𝑠𝑒𝑓𝑢𝑙 𝐿𝑖𝑓𝑒 𝑜𝑓 𝑃𝑖𝑝𝑒
Using the following assumptions: − 0.40 kg per m of pipe
− 160 MJ per kg of pipe (Saunders et al., 2006)
− 0.08 kgCO2-eq per MJ (Wells, 2001)
The embodied emission for posts (kgCO2-eq per ha) is estimated as: 𝑃𝑜𝑠𝑡𝑠 𝑝𝑒𝑟 ℎ𝑎 × 𝐸𝑛𝑒𝑟𝑔𝑦 𝐶𝑜𝑒𝑓𝑓𝑖𝑐𝑖𝑒𝑛𝑡 (𝑀𝐽 𝑝𝑒𝑟 𝑝𝑜𝑠𝑡) × 𝐶𝑂2 𝐸𝑚𝑖𝑠𝑠𝑖𝑜𝑛 𝐶𝑜𝑒𝑓𝑓𝑖𝑐𝑖𝑒𝑛𝑡 (𝑘𝑔𝐶𝑂2𝑒𝑞𝑣 𝑝𝑒𝑟 𝑀𝐽)
𝑊𝑜𝑟𝑘𝑖𝑛𝑔 𝑈𝑠𝑒𝑓𝑢𝑙 𝐿𝑖𝑓𝑒 𝑜𝑓 𝑃𝑜𝑠𝑡𝑠
Using the following assumptions: − 18 MJ per post (Barber & Scarrow, 2001)
− 0.08 kgCO2-eq per MJ (Wells, 2001)
The embodied emission for wire (kgCO2-eq per ha) is estimated as: 𝑊𝑖𝑟𝑒 𝑝𝑒𝑟 ℎ𝑎 (𝑚) × 𝐸𝑛𝑒𝑟𝑔𝑦 𝐶𝑜𝑒𝑓𝑓𝑖𝑐𝑖𝑒𝑛𝑡 (𝑀𝐽 𝑝𝑒𝑟 𝑚) × 𝐶𝑂2 𝐸𝑚𝑖𝑠𝑠𝑖𝑜𝑛 𝐶𝑜𝑒𝑓𝑓𝑖𝑐𝑖𝑒𝑛𝑡 (𝑘𝑔𝐶𝑂2𝑒𝑞𝑣 𝑝𝑒𝑟 𝑀𝐽)
𝑊𝑜𝑟𝑘𝑖𝑛𝑔 𝑈𝑠𝑒𝑓𝑢𝑙 𝐿𝑖𝑓𝑒 𝑜𝑓 𝑊𝑖𝑟𝑒
Using the following assumptions: − 1.3 MJ per m (Barber & Scarrow, 2001)
− 0.08 kgCO2-eq per MJ (Wells, 2001)
The embodied emission for agbeam (kgCO2-eq per ha) is estimated as: 𝐴𝑔𝑏𝑒𝑎𝑚 𝑝𝑒𝑟 ℎ𝑎 (𝑚) × 𝐸𝑛𝑒𝑟𝑔𝑦 𝐶𝑜𝑒𝑓𝑓𝑖𝑐𝑖𝑒𝑛𝑡 (𝑀𝐽 𝑝𝑒𝑟 𝑚) × 𝐶𝑂2 𝐸𝑚𝑖𝑠𝑠𝑖𝑜𝑛 𝐶𝑜𝑒𝑓𝑓𝑖𝑐𝑖𝑒𝑛𝑡 (𝑘𝑔𝐶𝑂2𝑒𝑞𝑣 𝑝𝑒𝑟 𝑀𝐽)
𝑊𝑜𝑟𝑘𝑖𝑛𝑔 𝑈𝑠𝑒𝑓𝑢𝑙 𝐿𝑖𝑓𝑒 𝑜𝑓 𝐴𝑔𝑏𝑒𝑎𝑚
Using the following assumptions:
− 56 MJ per m (Mithraratne, 2010)
− 0.08 kgCO2-eq per MJ (Wells, 2001)
The embodied emission for string (kgCO2-eq per ha) is estimated as: 𝑆𝑡𝑟𝑖𝑛𝑔 𝑝𝑒𝑟 ℎ𝑎 (𝑚) × 𝐸𝑛𝑒𝑟𝑔𝑦 𝐶𝑜𝑒𝑓𝑓𝑖𝑐𝑖𝑒𝑛𝑡 (𝑀𝐽 𝑝𝑒𝑟 𝑚) × 𝐶𝑂2 𝐸𝑚𝑖𝑠𝑠𝑖𝑜𝑛 𝐶𝑜𝑒𝑓𝑓𝑖𝑐𝑖𝑒𝑛𝑡 (𝑘𝑔𝐶𝑂2𝑒𝑞𝑣 𝑝𝑒𝑟 𝑀𝐽)
𝑊𝑜𝑟𝑘𝑖𝑛𝑔 𝑈𝑠𝑒𝑓𝑢𝑙 𝐿𝑖𝑓𝑒 𝑜𝑓 𝑆𝑡𝑟𝑖𝑛𝑔
Using the following assumptions: − 7.5 g per m of string − 160 MJ per kg of string (Saunders et al., 2006)
− 0.08 kgCO2-eq per MJ (Wells, 2001)
The embodied emission for stringing poles (kgCO2-eq per ha) is estimated as: 𝑃𝑜𝑙𝑒𝑠 𝑝𝑒𝑟 ℎ𝑎 × 𝐸𝑛𝑒𝑟𝑔𝑦 𝐶𝑜𝑒𝑓𝑓𝑖𝑐𝑖𝑒𝑛𝑡 (𝑀𝐽 𝑝𝑒𝑟 𝑝𝑜𝑙𝑒) × 𝐶𝑂2 𝐸𝑚𝑖𝑠𝑠𝑖𝑜𝑛 𝐶𝑜𝑒𝑓𝑓𝑖𝑐𝑖𝑒𝑛𝑡 (𝑘𝑔𝐶𝑂2𝑒𝑞𝑣 𝑝𝑒𝑟 𝑀𝐽)
𝑊𝑜𝑟𝑘𝑖𝑛𝑔 𝑈𝑠𝑒𝑓𝑢𝑙 𝐿𝑖𝑓𝑒 𝑜𝑓 𝑃𝑜𝑙𝑒

48
Using the following assumptions:
− 5 MJ per pole
− 0.08 kgCO2-eq per MJ (Wells, 2001)
The embodied emission for 6m Shelter Posts (kgCO2-eq per ha) is estimated as: 𝑃𝑜𝑠𝑡𝑠 𝑝𝑒𝑟 ℎ𝑎 × 𝐸𝑛𝑒𝑟𝑔𝑦 𝐶𝑜𝑒𝑓𝑓𝑖𝑐𝑖𝑒𝑛𝑡 (𝑀𝐽 𝑝𝑒𝑟 𝑝𝑜𝑠𝑡) × 𝐶𝑂2 𝐸𝑚𝑖𝑠𝑠𝑖𝑜𝑛 𝐶𝑜𝑒𝑓𝑓𝑖𝑐𝑖𝑒𝑛𝑡 (𝑘𝑔𝐶𝑂2𝑒𝑞𝑣 𝑝𝑒𝑟 𝑀𝐽)
𝑊𝑜𝑟𝑘𝑖𝑛𝑔 𝑈𝑠𝑒𝑓𝑢𝑙 𝐿𝑖𝑓𝑒 𝑜𝑓 𝑃𝑜𝑠𝑡
Using the following assumptions: − 100 MJ per post
− 0.08 kgCO2-eq per MJ (Wells, 2001)
The embodied emission for 6m Shelter Cloth (kgCO2-eq per ha) is estimated as: 𝐶𝑙𝑜𝑡ℎ 𝑝𝑒𝑟 ℎ𝑎 (𝑚2) × 𝐸𝑛𝑒𝑟𝑔𝑦 𝐶𝑜𝑒𝑓𝑓𝑖𝑐𝑖𝑒𝑛𝑡 (𝑀𝐽 𝑝𝑒𝑟 𝑚2) × 𝐶𝑂2 𝐸𝑚𝑖𝑠𝑠𝑖𝑜𝑛 𝐶𝑜𝑒𝑓𝑓𝑖𝑐𝑖𝑒𝑛𝑡 (𝑘𝑔𝐶𝑂2𝑒𝑞𝑣 𝑝𝑒𝑟 𝑀𝐽)
𝑊𝑜𝑟𝑘𝑖𝑛𝑔 𝑈𝑠𝑒𝑓𝑢𝑙 𝐿𝑖𝑓𝑒 𝑜𝑓 𝐶𝑙𝑜𝑡ℎ
Using the following assumptions: − 170 g per m2 of cloth
− 160 MJ per kg of cloth (Saunders et al., 2006)
− 0.08 kgCO2-eq per MJ (Wells, 2001)
The embodied emission for Undervine Shelter Cloth (kgCO2-eq per ha) is estimated as: 𝐶𝑙𝑜𝑡ℎ 𝑝𝑒𝑟 ℎ𝑎 (𝑚2) × 𝐸𝑛𝑒𝑟𝑔𝑦 𝐶𝑜𝑒𝑓𝑓𝑖𝑐𝑖𝑒𝑛𝑡 (𝑀𝐽 𝑝𝑒𝑟 𝑚2) × 𝐶𝑂2 𝐸𝑚𝑖𝑠𝑠𝑖𝑜𝑛 𝐶𝑜𝑒𝑓𝑓𝑖𝑐𝑖𝑒𝑛𝑡 (𝑘𝑔𝐶𝑂2𝑒𝑞𝑣 𝑝𝑒𝑟 𝑀𝐽)
𝑊𝑜𝑟𝑘𝑖𝑛𝑔 𝑈𝑠𝑒𝑓𝑢𝑙 𝐿𝑖𝑓𝑒 𝑜𝑓 𝐶𝑙𝑜𝑡ℎ
Using the following assumptions:
− 160 g per m2 of cloth
− 160 MJ per kg of cloth (Saunders et al., 2006)
− 0.08 kgCO2-eq per MJ (Wells, 2001)
The embodied emission for Hailnet Posts (kgCO2-eq per ha) is estimated as: 𝑃𝑜𝑠𝑡𝑠 𝑝𝑒𝑟 ℎ𝑎 × 𝐸𝑛𝑒𝑟𝑔𝑦 𝐶𝑜𝑒𝑓𝑓𝑖𝑐𝑖𝑒𝑛𝑡 (𝑀𝐽 𝑝𝑒𝑟 𝑝𝑜𝑠𝑡) × 𝐶𝑂2 𝐸𝑚𝑖𝑠𝑠𝑖𝑜𝑛 𝐶𝑜𝑒𝑓𝑓𝑖𝑐𝑖𝑒𝑛𝑡 (𝑘𝑔𝐶𝑂2𝑒𝑞𝑣 𝑝𝑒𝑟 𝑀𝐽)
𝑊𝑜𝑟𝑘𝑖𝑛𝑔 𝑈𝑠𝑒𝑓𝑢𝑙 𝐿𝑖𝑓𝑒 𝑜𝑓 𝑃𝑜𝑠𝑡
Using the following assumptions: − 100 MJ per post
− 0.08 kgCO2-eq per MJ (Wells, 2001)
The embodied emission for Hailnet Cloth (kgCO2-eq per ha) is estimated as: 𝐶𝑙𝑜𝑡ℎ 𝑝𝑒𝑟 ℎ𝑎 (𝑚2) × 𝐸𝑛𝑒𝑟𝑔𝑦 𝐶𝑜𝑒𝑓𝑓𝑖𝑐𝑖𝑒𝑛𝑡 (𝑀𝐽 𝑝𝑒𝑟 𝑚2) × 𝐶𝑂2 𝐸𝑚𝑖𝑠𝑠𝑖𝑜𝑛 𝐶𝑜𝑒𝑓𝑓𝑖𝑐𝑖𝑒𝑛𝑡 (𝑘𝑔𝐶𝑂2𝑒𝑞𝑣 𝑝𝑒𝑟 𝑀𝐽)
𝑊𝑜𝑟𝑘𝑖𝑛𝑔 𝑈𝑠𝑒𝑓𝑢𝑙 𝐿𝑖𝑓𝑒 𝑜𝑓 𝐶𝑙𝑜𝑡ℎ
Using the following assumptions: − 65 g per m2 of cloth
− 160 MJ per kg of cloth (Saunders et al., 2006)
− 0.08 kgCO2-eq per MJ (Wells, 2001)
The embodied emission for Frost Fans (kgCO2-eq per ha) is estimated as: 𝐹𝑎𝑛𝑠 𝑝𝑒𝑟 ℎ𝑎 × 𝐸𝑛𝑒𝑟𝑔𝑦 𝐶𝑜𝑒𝑓𝑓𝑖𝑐𝑖𝑒𝑛𝑡 (𝑀𝐽 𝑝𝑒𝑟 𝑓𝑎𝑛) × 𝐶𝑂2 𝐸𝑚𝑖𝑠𝑠𝑖𝑜𝑛 𝐶𝑜𝑒𝑓𝑓𝑖𝑐𝑖𝑒𝑛𝑡 (𝑘𝑔𝐶𝑂2𝑒𝑞𝑣 𝑝𝑒𝑟 𝑀𝐽)
𝑊𝑜𝑟𝑘𝑖𝑛𝑔 𝑈𝑠𝑒𝑓𝑢𝑙 𝐿𝑖𝑓𝑒 𝑜𝑓 𝐹𝑎𝑛
Using the following assumptions: − 1 tonne per machine
− 160 MJ per kg of machine (Page, 2009)
− 0.08 kgCO2-eq per MJ (Wells, 2001)
The embodied emission for Nitrogen in inorganic fertiliser (kgCO2-eq per ha) is estimated as: 𝐴𝑝𝑝𝑙𝑖𝑐𝑎𝑡𝑖𝑜𝑛 𝑅𝑎𝑡𝑒 (𝑘𝑔 𝐹𝑒𝑟𝑡 𝑝𝑒𝑟 ℎ𝑎) × 𝑃𝑟𝑜𝑝𝑜𝑟𝑡𝑖𝑜𝑛 𝑜𝑓 𝑁 𝑖𝑛 𝐹𝑒𝑟𝑡 (%)
× 𝐸𝑛𝑒𝑟𝑔𝑦 𝐶𝑜𝑒𝑓𝑓𝑖𝑐𝑖𝑒𝑛𝑡 (𝑀𝐽 𝑝𝑒𝑟 𝑘𝑔𝑁) × 𝐶𝑂2 𝐸𝑚𝑖𝑠𝑠𝑖𝑜𝑛 𝐶𝑜𝑒𝑓𝑓𝑖𝑖𝑒𝑛𝑡 (𝑘𝑔𝐶𝑂2𝑒𝑞𝑣 𝑝𝑒𝑟 𝑀𝐽)
Using the following assumptions:

49
− 65 MJ per kg of N (Welles, 2001)
− 0.05 kgCO2-eq per MJ (Wells, 2001)
The embodied emission for Phosphorus in inorganic fertiliser (kgCO2-eq per ha) is estimated as: 𝐴𝑝𝑝𝑙𝑖𝑐𝑎𝑡𝑖𝑜𝑛 𝑅𝑎𝑡𝑒 (𝑘𝑔 𝐹𝑒𝑟𝑡 𝑝𝑒𝑟 ℎ𝑎) × 𝑃𝑟𝑜𝑝𝑜𝑟𝑡𝑖𝑜𝑛 𝑜𝑓 𝑃 𝑖𝑛 𝐹𝑒𝑟𝑡 (%)
× 𝐸𝑛𝑒𝑟𝑔𝑦 𝐶𝑜𝑒𝑓𝑓𝑖𝑐𝑖𝑒𝑛𝑡 (𝑀𝐽 𝑝𝑒𝑟 𝑘𝑔𝑃) × 𝐶𝑂2 𝐸𝑚𝑖𝑠𝑠𝑖𝑜𝑛 𝐶𝑜𝑒𝑓𝑓𝑖𝑖𝑒𝑛𝑡 (𝑘𝑔𝐶𝑂2𝑒𝑞𝑣 𝑝𝑒𝑟 𝑀𝐽)
Using the following assumptions:
− 15 MJ per kg of P (Welles, 2001)
− 0.06 kgCO2-eq per MJ (Wells, 2001)
The embodied emission for Potassium in inorganic fertiliser (kgCO2-eq per ha) is estimated as: 𝐴𝑝𝑝𝑙𝑖𝑐𝑎𝑡𝑖𝑜𝑛 𝑅𝑎𝑡𝑒 (𝑘𝑔 𝐹𝑒𝑟𝑡 𝑝𝑒𝑟 ℎ𝑎) × 𝑃𝑟𝑜𝑝𝑜𝑟𝑡𝑖𝑜𝑛 𝑜𝑓 𝐾 𝑖𝑛 𝐹𝑒𝑟𝑡 (%)
× 𝐸𝑛𝑒𝑟𝑔𝑦 𝐶𝑜𝑒𝑓𝑓𝑖𝑐𝑖𝑒𝑛𝑡 (𝑀𝐽 𝑝𝑒𝑟 𝑘𝑔𝐾) × 𝐶𝑂2 𝐸𝑚𝑖𝑠𝑠𝑖𝑜𝑛 𝐶𝑜𝑒𝑓𝑓𝑖𝑖𝑒𝑛𝑡 (𝑘𝑔𝐶𝑂2𝑒𝑞𝑣 𝑝𝑒𝑟 𝑀𝐽)
Using the following assumptions:
− 10 MJ per kg of K (Welles, 2001)
− 0.06 kgCO2-eq per MJ (Wells, 2001)
The embodied emission for Sulphur in inorganic fertiliser (kgCO2-eq per ha) is estimated as: 𝐴𝑝𝑝𝑙𝑖𝑐𝑎𝑡𝑖𝑜𝑛 𝑅𝑎𝑡𝑒 (𝑘𝑔 𝐹𝑒𝑟𝑡 𝑝𝑒𝑟 ℎ𝑎) × 𝑃𝑟𝑜𝑝𝑜𝑟𝑡𝑖𝑜𝑛 𝑜𝑓 𝑆 𝑖𝑛 𝐹𝑒𝑟𝑡 (%) × 𝐸𝑛𝑒𝑟𝑔𝑦 𝐶𝑜𝑒𝑓𝑓𝑖𝑐𝑖𝑒𝑛𝑡 (𝑀𝐽 𝑝𝑒𝑟 𝑘𝑔𝑆)
× 𝐶𝑂2 𝐸𝑚𝑖𝑠𝑠𝑖𝑜𝑛 𝐶𝑜𝑒𝑓𝑓𝑖𝑖𝑒𝑛𝑡 (𝑘𝑔𝐶𝑂2𝑒𝑞𝑣 𝑝𝑒𝑟 𝑀𝐽)
Using the following assumptions: − 5 MJ per kg of S (Welles, 2001)
− 0.06 kgCO2-eq per MJ (Wells, 2001)
The embodied emission for organic fertiliser (kgCO2-eq per ha) is estimated as: 𝐴𝑝𝑝𝑙𝑖𝑐𝑎𝑡𝑖𝑜𝑛 𝑅𝑎𝑡𝑒 (𝑘𝑔 𝐹𝑒𝑟𝑡 𝑝𝑒𝑟 ℎ𝑎) × 𝐸𝑛𝑒𝑟𝑔𝑦 𝐶𝑜𝑒𝑓𝑓𝑖𝑐𝑖𝑒𝑛𝑡 (𝑀𝐽 𝑝𝑒𝑟 𝑘𝑔)
× 𝐶𝑂2 𝐸𝑚𝑖𝑠𝑠𝑖𝑜𝑛 𝐶𝑜𝑒𝑓𝑓𝑖𝑖𝑒𝑛𝑡 (𝑘𝑔𝐶𝑂2𝑒𝑞𝑣 𝑝𝑒𝑟 𝑀𝐽)
Using the following assumptions:
− 5 MJ per kg of organic fertiliser (Page, 2009)
− 0.08 kgCO2-eq per MJ (Wells, 2001)
The embodied emission for lime (kgCO2-eq per ha) is estimated as: 𝐴𝑝𝑝𝑙𝑖𝑐𝑎𝑡𝑖𝑜𝑛 𝑅𝑎𝑡𝑒 (𝑘𝑔 𝐿𝑖𝑚𝑒 𝑝𝑒𝑟 ℎ𝑎) × 𝐸𝑛𝑒𝑟𝑔𝑦 𝐶𝑜𝑒𝑓𝑓𝑖𝑐𝑖𝑒𝑛𝑡 (𝑀𝐽 𝑝𝑒𝑟 𝑘𝑔)
× 𝐶𝑂2 𝐸𝑚𝑖𝑠𝑠𝑖𝑜𝑛 𝐶𝑜𝑒𝑓𝑓𝑖𝑖𝑒𝑛𝑡 (𝑘𝑔𝐶𝑂2𝑒𝑞𝑣 𝑝𝑒𝑟 𝑀𝐽)
Using the following assumptions: − 0.6 MJ per kg of lime (Wells., 2001) − 0.72 kgCO2-eq per MJ (Wells, 2001)
The embodied emission for agrichemical sprays (kgCO2-eq per ha) is estimated as:
𝑆𝑝𝑟𝑎𝑦 𝑅𝑎𝑡𝑒 (𝑔 𝑝𝑒𝑟 100𝐿) 𝑁𝑢𝑚𝑏𝑒𝑟 𝑜𝑓 𝑆𝑝𝑟𝑎𝑦𝑠 𝑝𝑒𝑟 𝑌𝑒𝑎𝑟 ×
100 𝐿 × 𝑊𝑎𝑡𝑒𝑟 𝑅𝑎𝑡𝑒 (𝐿 𝑝𝑒𝑟 𝐻𝑎)
÷ 1000 (𝑡𝑜 𝑐𝑜𝑛𝑣𝑒𝑟𝑡 𝑡𝑜 𝑘𝑔) × 𝐸𝑛𝑒𝑟𝑔𝑦 𝐶𝑜𝑒𝑓𝑓𝑖𝑐𝑖𝑒𝑛𝑡 (𝑀𝐽 𝑝𝑒𝑟 𝑘𝑔) × 𝐶𝑂2 𝐸𝑚𝑖𝑠𝑠𝑖𝑜𝑛 𝐶𝑜𝑒𝑓𝑓𝑖𝑖𝑒𝑛𝑡 (𝑘𝑔𝐶𝑂2𝑒𝑞𝑣 𝑝𝑒𝑟 𝑀𝐽)
Using the following assumptions:
− 550 MJ per kg of herbicide (Glyphosate) (Barber, 2004)
− 310 MJ per kg of herbicide (general) (Barber, 2004)
− 315 MJ per kg of insecticide (Barber, 2004)
− 210 MJ per kg of fungicide (Barber, 2004)
− 175 MJ per kg of plant growth regulator (Barber, 2004)
− 120 MJ per kg of mineral oil (Barber, 2004) − 111.5 MJ per kg of copper spray (Wells, 2001)
− 111.5 MJ per kg of sulphur spray (Wells, 2001)
− 5 MJ per kg of bio-stimulant (Page, 2009)
− 120 MJ per kg of other agrichemical (Barber, 2004)
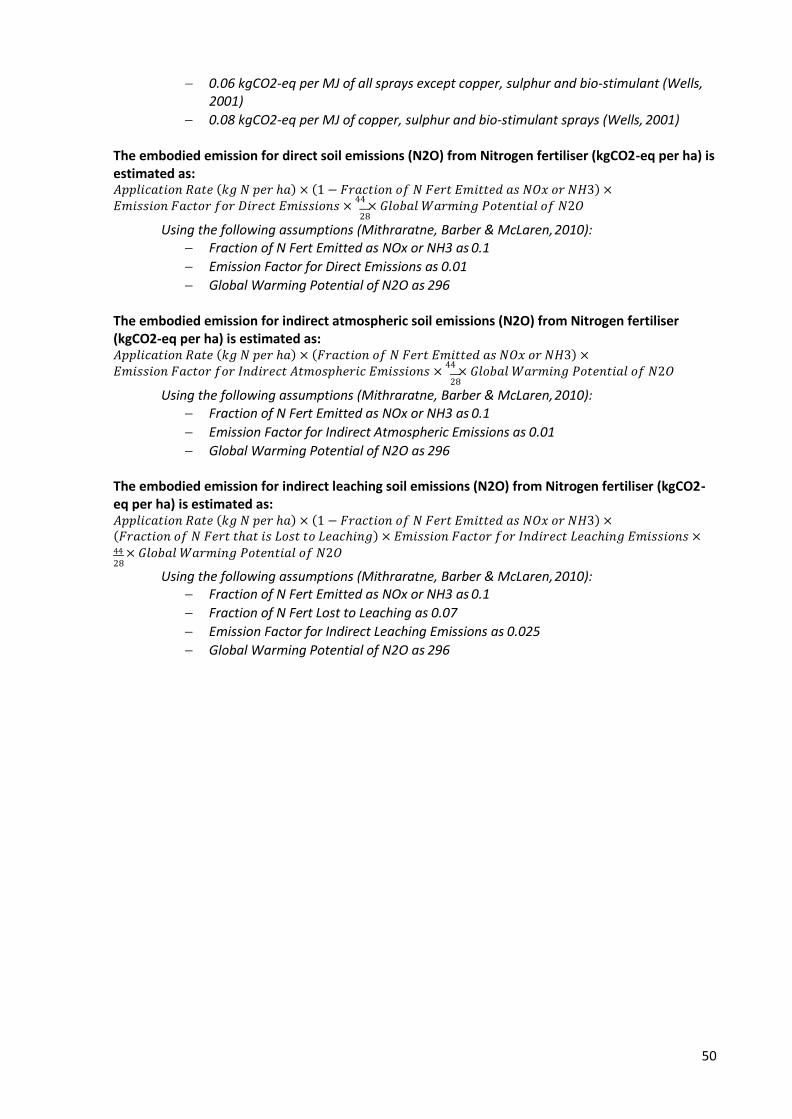
50
− 0.06 kgCO2-eq per MJ of all sprays except copper, sulphur and bio-stimulant (Wells, 2001)
− 0.08 kgCO2-eq per MJ of copper, sulphur and bio-stimulant sprays (Wells, 2001)
The embodied emission for direct soil emissions (N2O) from Nitrogen fertiliser (kgCO2-eq per ha) is estimated as: 𝐴𝑝𝑝𝑙𝑖𝑐𝑎𝑡𝑖𝑜𝑛 𝑅𝑎𝑡𝑒 (𝑘𝑔 𝑁 𝑝𝑒𝑟 ℎ𝑎) × (1 − 𝐹𝑟𝑎𝑐𝑡𝑖𝑜𝑛 𝑜𝑓 𝑁 𝐹𝑒𝑟𝑡 𝐸𝑚𝑖𝑡𝑡𝑒𝑑 𝑎𝑠 𝑁𝑂𝑥 𝑜𝑟 𝑁𝐻3) × 𝐸𝑚𝑖𝑠𝑠𝑖𝑜𝑛 𝐹𝑎𝑐𝑡𝑜𝑟 𝑓𝑜𝑟 𝐷𝑖𝑟𝑒𝑐𝑡 𝐸𝑚𝑖𝑠𝑠𝑖𝑜𝑛𝑠 ×
44 × 𝐺𝑙𝑜𝑏𝑎𝑙 𝑊𝑎𝑟𝑚𝑖𝑛𝑔 𝑃𝑜𝑡𝑒𝑛𝑡𝑖𝑎𝑙 𝑜𝑓 𝑁2𝑂
28
Using the following assumptions (Mithraratne, Barber & McLaren, 2010): − Fraction of N Fert Emitted as NOx or NH3 as 0.1
− Emission Factor for Direct Emissions as 0.01
− Global Warming Potential of N2O as 296
The embodied emission for indirect atmospheric soil emissions (N2O) from Nitrogen fertiliser (kgCO2-eq per ha) is estimated as: 𝐴𝑝𝑝𝑙𝑖𝑐𝑎𝑡𝑖𝑜𝑛 𝑅𝑎𝑡𝑒 (𝑘𝑔 𝑁 𝑝𝑒𝑟 ℎ𝑎) × (𝐹𝑟𝑎𝑐𝑡𝑖𝑜𝑛 𝑜𝑓 𝑁 𝐹𝑒𝑟𝑡 𝐸𝑚𝑖𝑡𝑡𝑒𝑑 𝑎𝑠 𝑁𝑂𝑥 𝑜𝑟 𝑁𝐻3) × 𝐸𝑚𝑖𝑠𝑠𝑖𝑜𝑛 𝐹𝑎𝑐𝑡𝑜𝑟 𝑓𝑜𝑟 𝐼𝑛𝑑𝑖𝑟𝑒𝑐𝑡 𝐴𝑡𝑚𝑜𝑠𝑝ℎ𝑒𝑟𝑖𝑐 𝐸𝑚𝑖𝑠𝑠𝑖𝑜𝑛𝑠 ×
44 × 𝐺𝑙𝑜𝑏𝑎𝑙 𝑊𝑎𝑟𝑚𝑖𝑛𝑔 𝑃𝑜𝑡𝑒𝑛𝑡𝑖𝑎𝑙 𝑜𝑓 𝑁2𝑂
28
Using the following assumptions (Mithraratne, Barber & McLaren, 2010): − Fraction of N Fert Emitted as NOx or NH3 as 0.1
− Emission Factor for Indirect Atmospheric Emissions as 0.01
− Global Warming Potential of N2O as 296
The embodied emission for indirect leaching soil emissions (N2O) from Nitrogen fertiliser (kgCO2- eq per ha) is estimated as: 𝐴𝑝𝑝𝑙𝑖𝑐𝑎𝑡𝑖𝑜𝑛 𝑅𝑎𝑡𝑒 (𝑘𝑔 𝑁 𝑝𝑒𝑟 ℎ𝑎) × (1 − 𝐹𝑟𝑎𝑐𝑡𝑖𝑜𝑛 𝑜𝑓 𝑁 𝐹𝑒𝑟𝑡 𝐸𝑚𝑖𝑡𝑡𝑒𝑑 𝑎𝑠 𝑁𝑂𝑥 𝑜𝑟 𝑁𝐻3) × (𝐹𝑟𝑎𝑐𝑡𝑖𝑜𝑛 𝑜𝑓 𝑁 𝐹𝑒𝑟𝑡 𝑡ℎ𝑎𝑡 𝑖𝑠 𝐿𝑜𝑠𝑡 𝑡𝑜 𝐿𝑒𝑎𝑐ℎ𝑖𝑛𝑔) × 𝐸𝑚𝑖𝑠𝑠𝑖𝑜𝑛 𝐹𝑎𝑐𝑡𝑜𝑟 𝑓𝑜𝑟 𝐼𝑛𝑑𝑖𝑟𝑒𝑐𝑡 𝐿𝑒𝑎𝑐ℎ𝑖𝑛𝑔 𝐸𝑚𝑖𝑠𝑠𝑖𝑜𝑛𝑠 × 44 × 𝐺𝑙𝑜𝑏𝑎𝑙 𝑊𝑎𝑟𝑚𝑖𝑛𝑔 𝑃𝑜𝑡𝑒𝑛𝑡𝑖𝑎𝑙 𝑜𝑓 𝑁2𝑂 28
Using the following assumptions (Mithraratne, Barber & McLaren, 2010): − Fraction of N Fert Emitted as NOx or NH3 as 0.1
− Fraction of N Fert Lost to Leaching as 0.07
− Emission Factor for Indirect Leaching Emissions as 0.025
− Global Warming Potential of N2O as 296

51
9.2 Detailed Carbon Footprint Per Orchard
Crop Area
8.70
13.88
27.95
3.30
2.38
4.43
60.64
Crop Grapes Apple Kiwifruit Kiwifruit Kiwifruit Kiwifruit
Management Conventional Conventional Conventional Organic Conventional Conventional
Production Stage Producing Development Development Producing Producing Conversion
Carbon Sequestration
CO2 Sequestrated in Permanent Plant Biomass 40.8 20.5 18.4 9.8 8.2 8.5 106.1 1.8
CO2 Sequestrated in Natural Shelter 0.0 0.0 10.4 4.1 8.9 5.4 28.8 0.5 CO2 Sequestrated in Soil (Plant and Compost) 100.7 39.2 219.8 84.7 64.1 76.4 584.9 9.6
Total Carbon Sequestration t CO2-eq 141.4 59.6 248.6 98.5 81.3 90.4 719.8 11.9
per ha 16.3 4.3 8.9 29.8 34.1 20.4 11.9
1.9
0.3
Carbon Emissions
Direct Carbon Emissions (Scope 1 & 2)
Fuel
Electricity
8.3
0.1
55.7
5.2
44.0
6.4
3.4
2.3
2.2
1.6
2.8
3.0
116.4
18.6
Total t CO2-eq 8.4 60.9 50.5 5.7 3.8 5.7 135.0 2.2
Embodied Carbon Emissions (Scope 3)
Orchard Capital 3.4 57.9 42.2 6.5 2.7 4.9 117.5 1.9
Fertiliser Inputs 3.8 3.6 4.2 1.5 1.7 2.3 17.2 0.3
Spray Inputs 14.6 5.5 7.9 2.3 4.4 1.3 36.0 0.6
Compost Preparation 0.0 0.0 11.1 2.3 1.5 3.6 18.3 0.3 Lime Inputs 0.0 24.0 48.3 1.4 2.1 0.0 75.8 1.2
Total t CO2-eq 21.7 90.9 113.7 14.0 12.4 12.1 264.8 4.4
Soil Carbon Emissions (Additional Scope)
Decomposition of Plant Matter 82.5 32.1 28.9 38.6 32.5 13.9 228.6 3.8
Decomposition of Compost 0.0 0.0 151.4 30.8 20.1 48.8 251.0 4.1 N2O Emissions 4.7 3.1 7.0 0.0 1.6 3.2 19.5 0.3
Total t CO2-eq 87.2 35.2 187.3 69.4 54.2 65.9 499.1 8.2
Total Carbon Emissions t CO2-eq 117.3 187.0 351.4 89.1 70.4 83.7 898.9 14.8
per ha 13.5 13.5 12.6 27.0 29.6 18.9 14.8
Net Carbon Footprint t CO2-eq 24.2 -127.3 -102.8 9.4 10.8 6.7 -179.1 -3.0
per ha 2.8 -9.2 -3.7 2.8 4.5 1.5 -3.0
Orchard Units Glenpark Vineyard Springhill Orchard Wiroa Orchard Angus Orchard Gold Crest
Orchard
Maha West Total Sample Emissions per
Orchard Emissions hectare