beam q217 & q317 performance review - beedie.sfu.ca · cineplex is canada’s leading...
TRANSCRIPT

BEAM | Q217 & Q317 Performance ReviewNovember 3, 2017
8888 University Drive | Burnaby | British Columbia | Canada | www.beedie.sfu.ca/beam
Strictly Private & Confidential — Not For Public Distribution
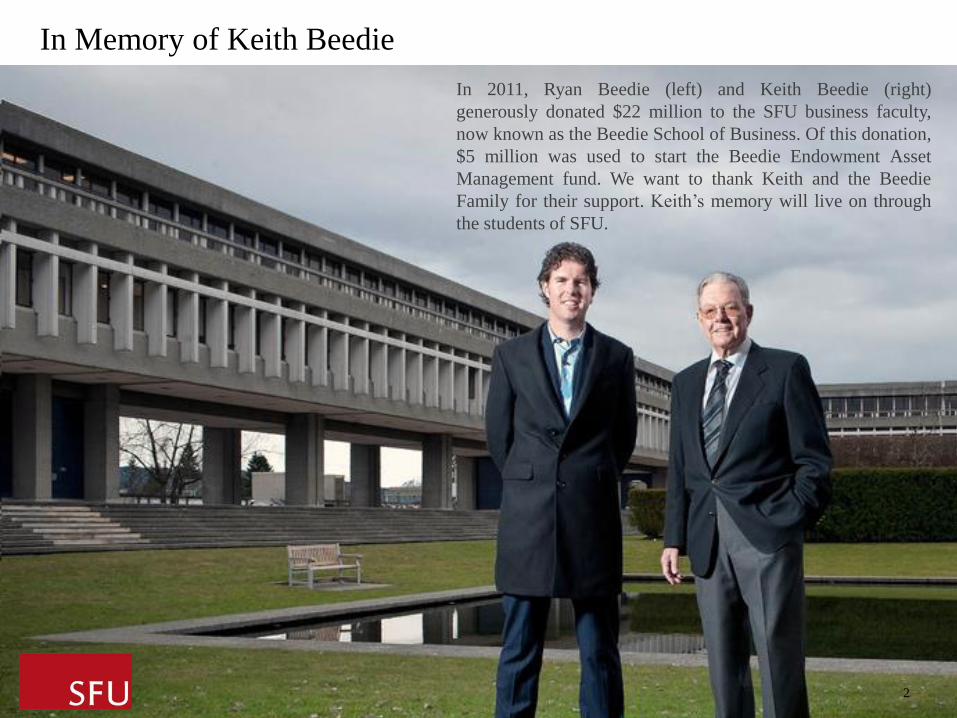
In 2011, Ryan Beedie (left) and Keith Beedie (right)
generously donated $22 million to the SFU business faculty,
now known as the Beedie School of Business. Of this donation,
$5 million was used to start the Beedie Endowment Asset
Management fund. We want to thank Keith and the Beedie
Family for their support. Keith’s memory will live on through
the students of SFU.
2
In Memory of Keith Beedie
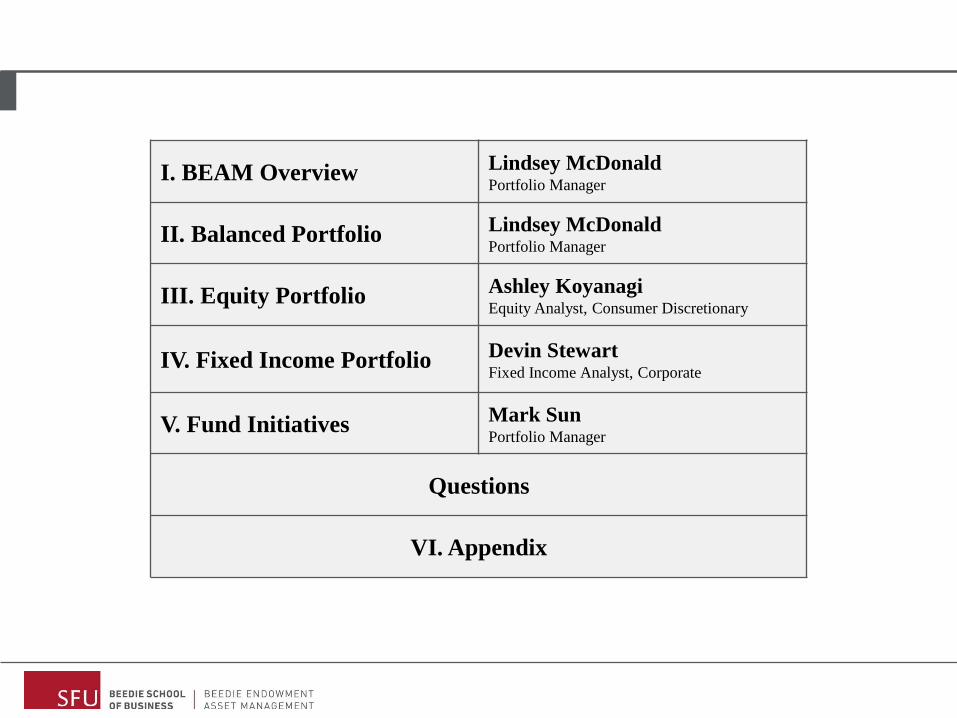
I. BEAM Overview Lindsey McDonaldPortfolio Manager
II. Balanced Portfolio Lindsey McDonaldPortfolio Manager
III. Equity Portfolio Ashley KoyanagiEquity Analyst, Consumer Discretionary
IV. Fixed Income Portfolio Devin StewartFixed Income Analyst, Corporate
V. Fund Initiatives Mark SunPortfolio Manager
Questions
VI. Appendix

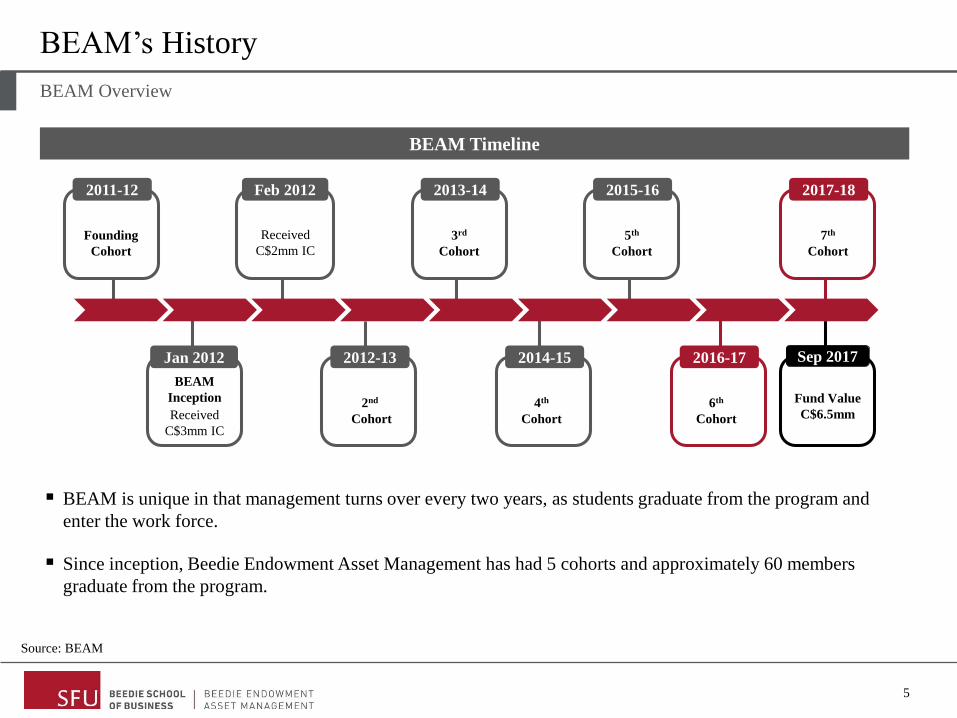
Feb 2012
Received
C$2mm IC
2011-12
Founding
Cohort
▪ BEAM is unique in that management turns over every two years, as students graduate from the program and
enter the work force.
▪ Since inception, Beedie Endowment Asset Management has had 5 cohorts and approximately 60 members
graduate from the program.
5
BEAM’s History
Source: BEAM
BEAM Timeline
BEAM Overview
Jan 2012
BEAM
Inception
Received
C$3mm IC
2012-13
2nd
Cohort
2013-14
3rd
Cohort
2015-16
5th
Cohort
2014-15
4th
Cohort
2017-18
7th
Cohort
2016-17
6th
Cohort
Sep 2017
Fund Value
C$6.5mm
6
BEAM’s Objectives
Source: BEAM
Objectives
BEAM Overview
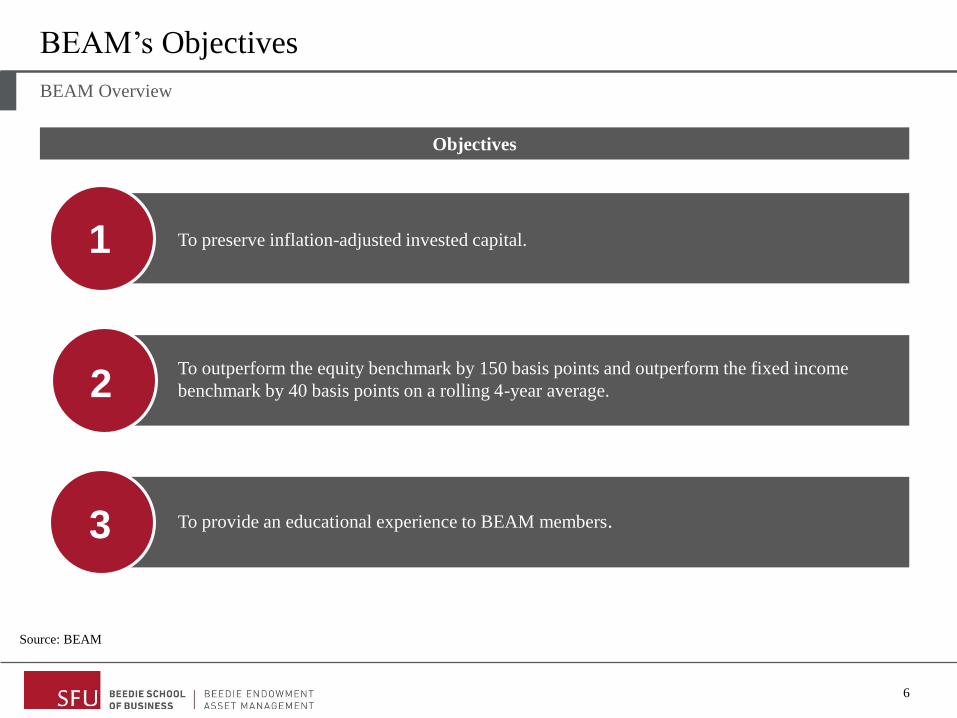
To preserve inflation-adjusted invested capital. 1
To outperform the equity benchmark by 150 basis points and outperform the fixed income
benchmark by 40 basis points on a rolling 4-year average.2
To provide an educational experience to BEAM members.3
7
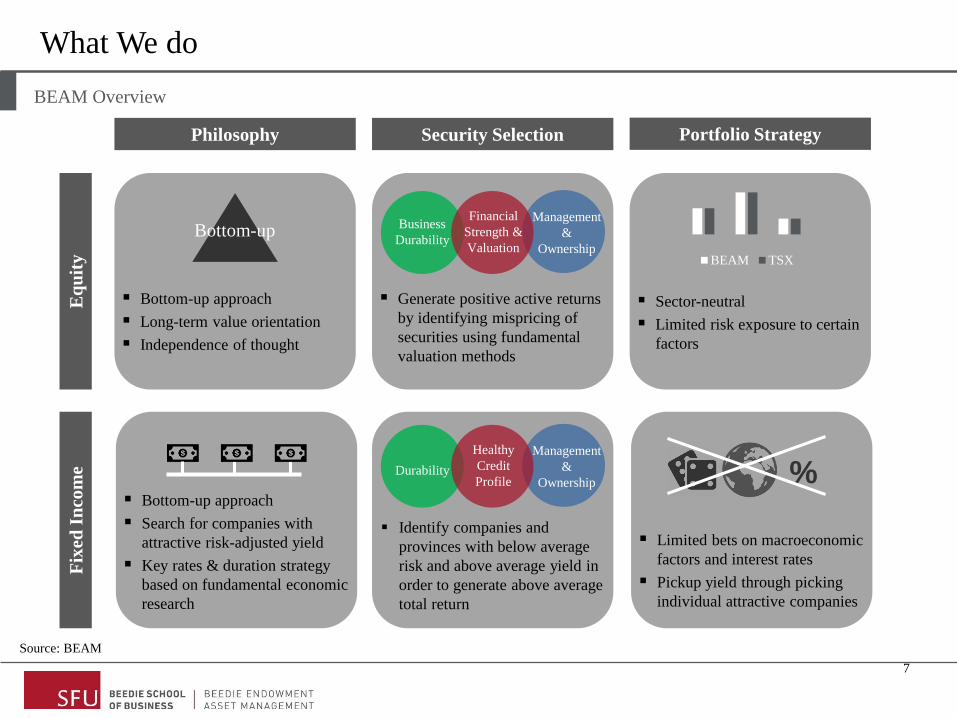
What We do
Philosophy
BEAM OverviewBEAM OverviewE
qu
ity
Fix
ed I
nco
me
Portfolio StrategySecurity Selection
Business
Durability
Management
&
Ownership
Financial
Strength &
Valuation
Bottom-up
BEAM TSX
▪ Bottom-up approach
▪ Long-term value orientation
▪ Independence of thought
%
▪ Sector-neutral
▪ Limited risk exposure to certain
factors
▪ Generate positive active returns
by identifying mispricing of
securities using fundamental
valuation methods
▪ Bottom-up approach
▪ Search for companies with
attractive risk-adjusted yield
▪ Key rates & duration strategy
based on fundamental economic
research
▪ Limited bets on macroeconomic
factors and interest rates
▪ Pickup yield through picking
individual attractive companies
Durability
Management
&
Ownership
Healthy
Credit
Profile
▪ Identify companies and
provinces with below average
risk and above average yield in
order to generate above average
total return
Source: BEAM

9
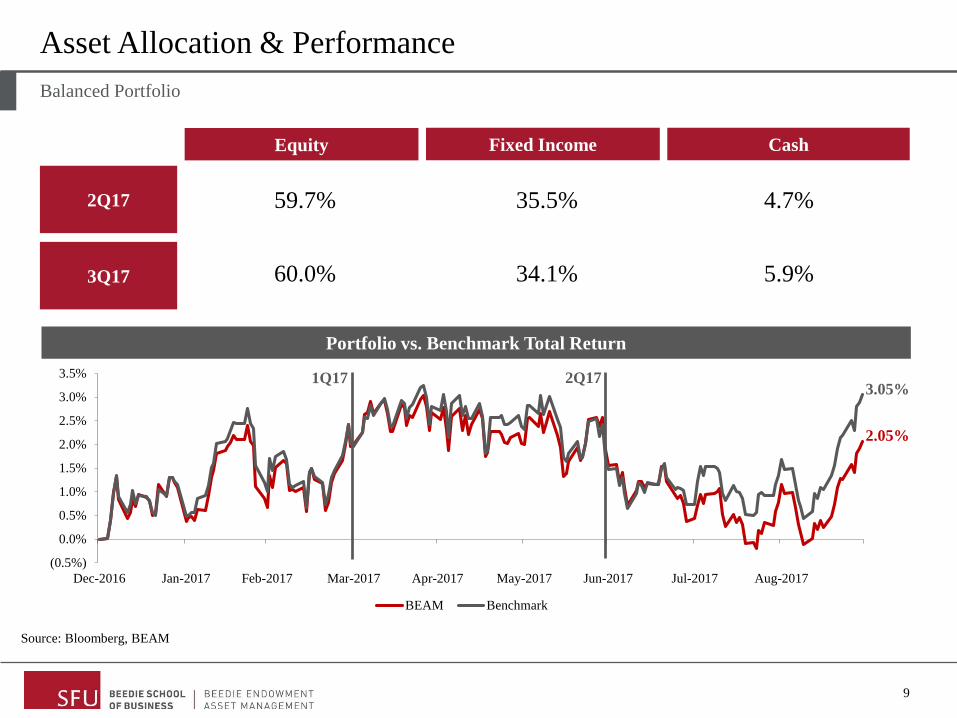
Balanced Portfolio
Asset Allocation & Performance
2Q17
3Q17
Portfolio vs. Benchmark Total Return
Equity Fixed Income Cash
59.7% 35.5% 4.7%
60.0% 34.1% 5.9%
Source: Bloomberg, BEAM
(0.5%)
0.0%
0.5%
1.0%
1.5%
2.0%
2.5%
3.0%
3.5%
Dec-2016 Jan-2017 Feb-2017 Mar-2017 Apr-2017 May-2017 Jun-2017 Jul-2017 Aug-2017
BEAM Benchmark
2Q173.05%
2.05%
1Q17
10
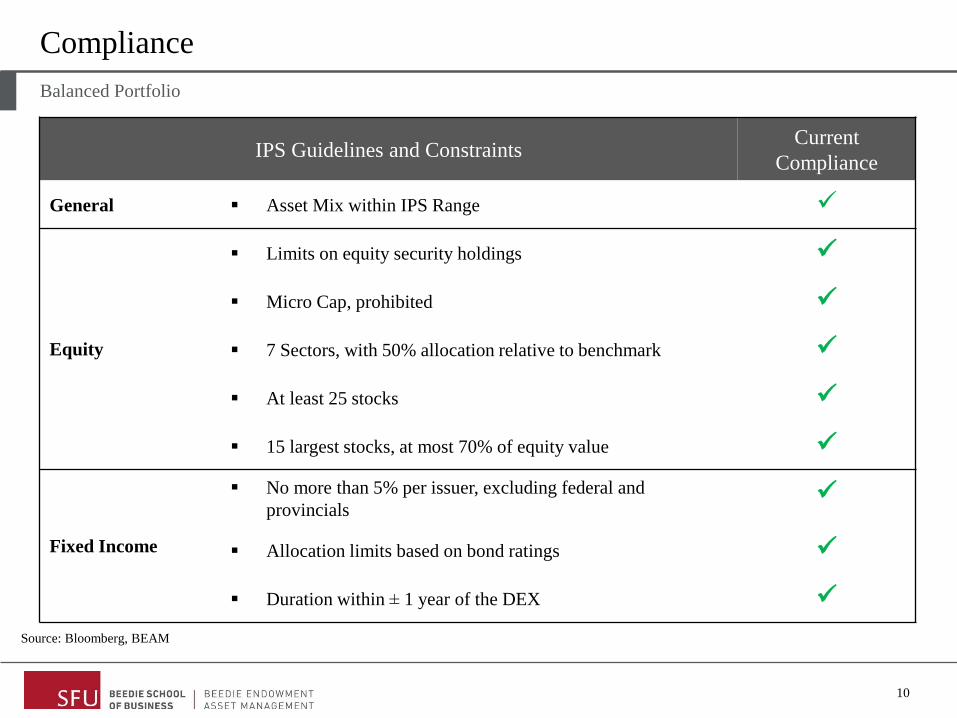
Compliance
IPS Guidelines and ConstraintsCurrent
Compliance
General ▪ Asset Mix within IPS Range ✓
Equity
▪ Limits on equity security holdings ✓
▪ Micro Cap, prohibited ✓
▪ 7 Sectors, with 50% allocation relative to benchmark ✓
▪ At least 25 stocks ✓
▪ 15 largest stocks, at most 70% of equity value ✓
Fixed Income
▪ No more than 5% per issuer, excluding federal and
provincials✓
▪ Allocation limits based on bond ratings ✓
▪ Duration within ± 1 year of the DEX ✓
Balanced Portfolio
Source: Bloomberg, BEAM
(1.5%)
(0.5%)
0.5%
1.5%
2.5%
3.5%
4.5%
5.5%
Dec-2016 Jan-2017 Feb-2017 Mar-2017 Apr-2017 May-2017 Jun-2017 Jul-2017 Aug-2017
BEAM Benchmark
12
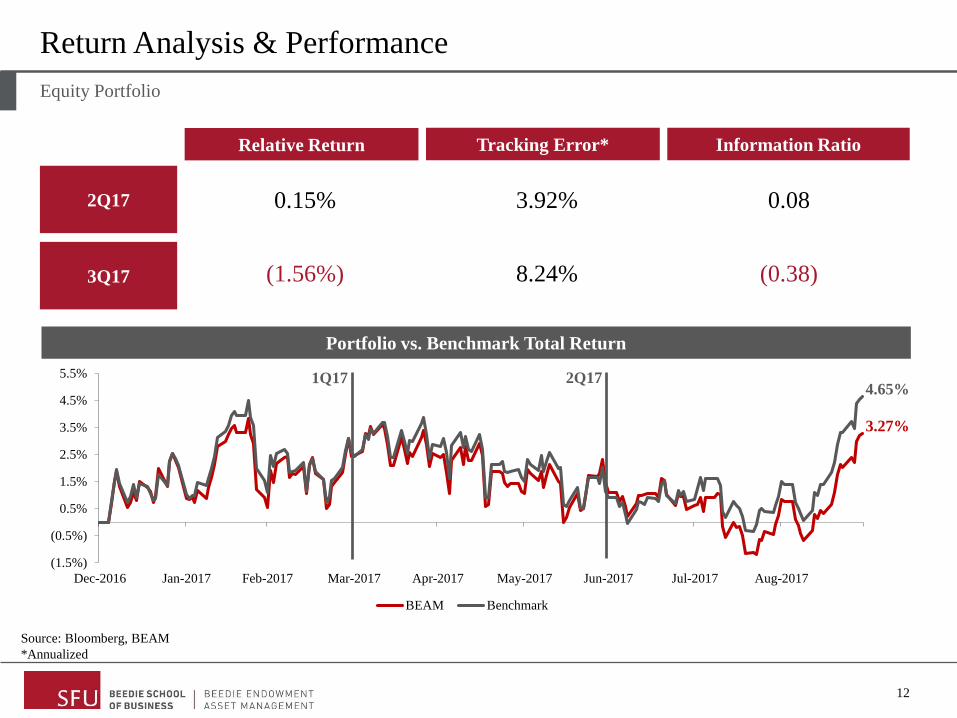
Equity Portfolio
Return Analysis & Performance
2Q17
3Q17
Portfolio vs. Benchmark Total Return
Relative Return Tracking Error* Information Ratio
0.15% 3.92% 0.08
(1.56%) 8.24% (0.38)
Source: Bloomberg, BEAM
*Annualized
2Q174.65%
3.27%
1Q17
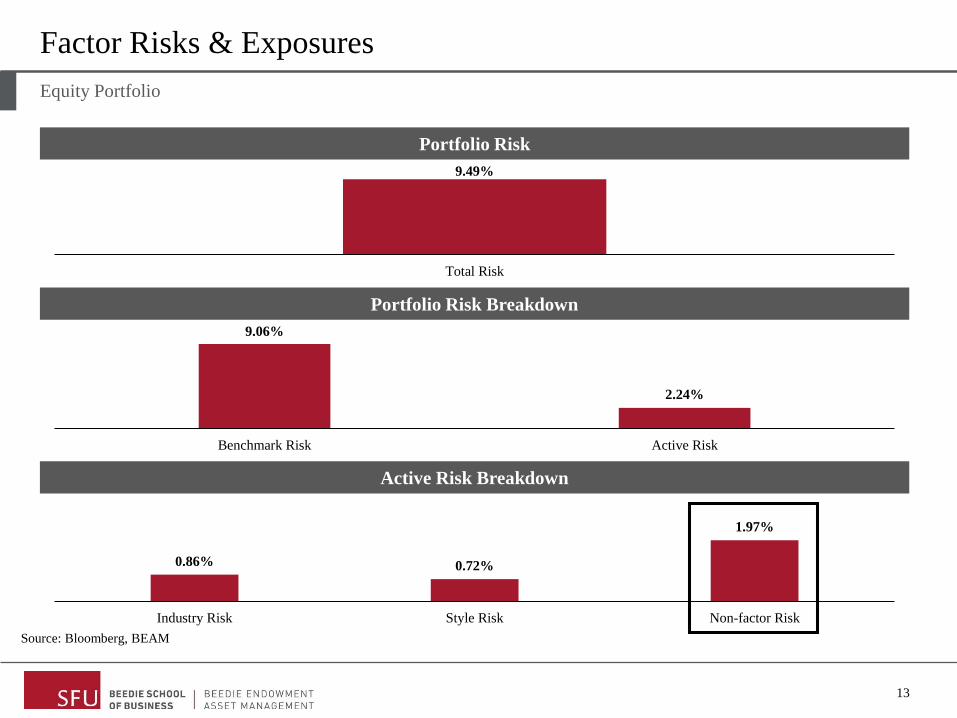
9.49%
Total Risk
9.06%
2.24%
Benchmark Risk Active Risk
0.86% 0.72%
1.97%
Industry Risk Style Risk Non-factor Risk
13
Equity Portfolio
Factor Risks & Exposures
Source: Bloomberg, BEAM
Portfolio Risk
Portfolio Risk Breakdown
Active Risk Breakdown
14
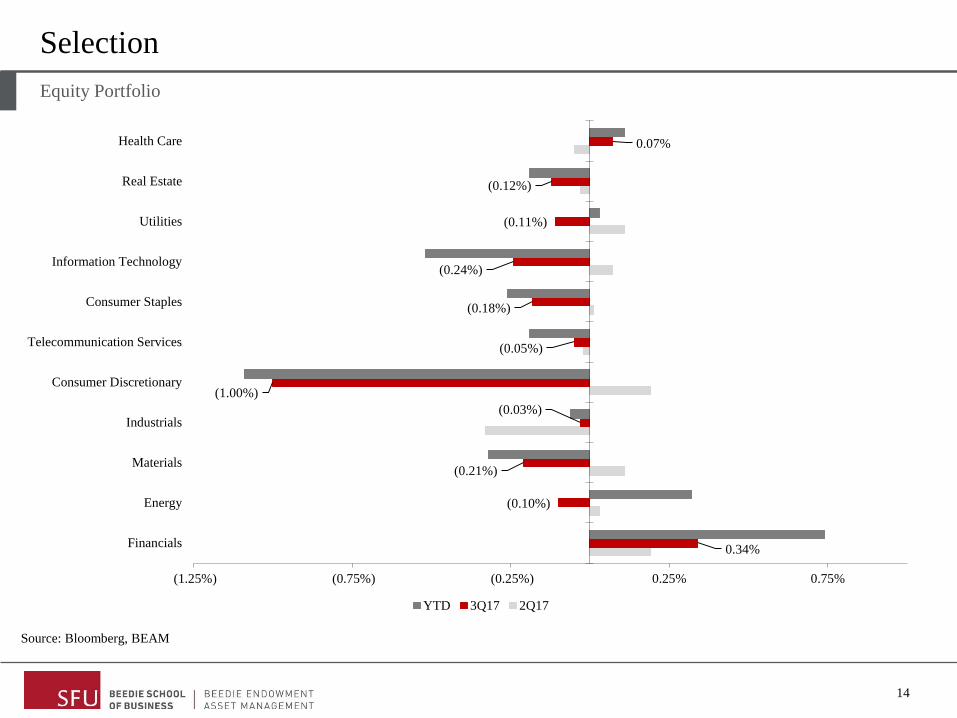
Selection
Source: Bloomberg, BEAM
Equity Portfolio
0.34%
(0.10%)
(0.21%)
(0.03%)
(1.00%)
(0.05%)
(0.18%)
(0.24%)
(0.11%)
(0.12%)
0.07%
(1.25%) (0.75%) (0.25%) 0.25% 0.75%
Financials
Energy
Materials
Industrials
Consumer Discretionary
Telecommunication Services
Consumer Staples
Information Technology
Utilities
Real Estate
Health Care
YTD 3Q17 2Q17
0.27%
0.15% 0.13% 0.13% 0.12%
(0.02%) (0.02%) (0.03%) (0.03%)(0.06%)
(0.5%)
(0.4%)
(0.3%)
(0.2%)
(0.1%)
0.0%
0.1%
0.2%
0.3%
0.4%
0.5%
(0.36%)
(0.26%)
(0.18%)(0.13%)
(0.05%)
0.00%0.05%
0.10%0.13%
0.23%
(0.5%)
(0.4%)
(0.3%)
(0.2%)
(0.1%)
0.0%
0.1%
0.2%
0.3%
0.4%
0.5%
15
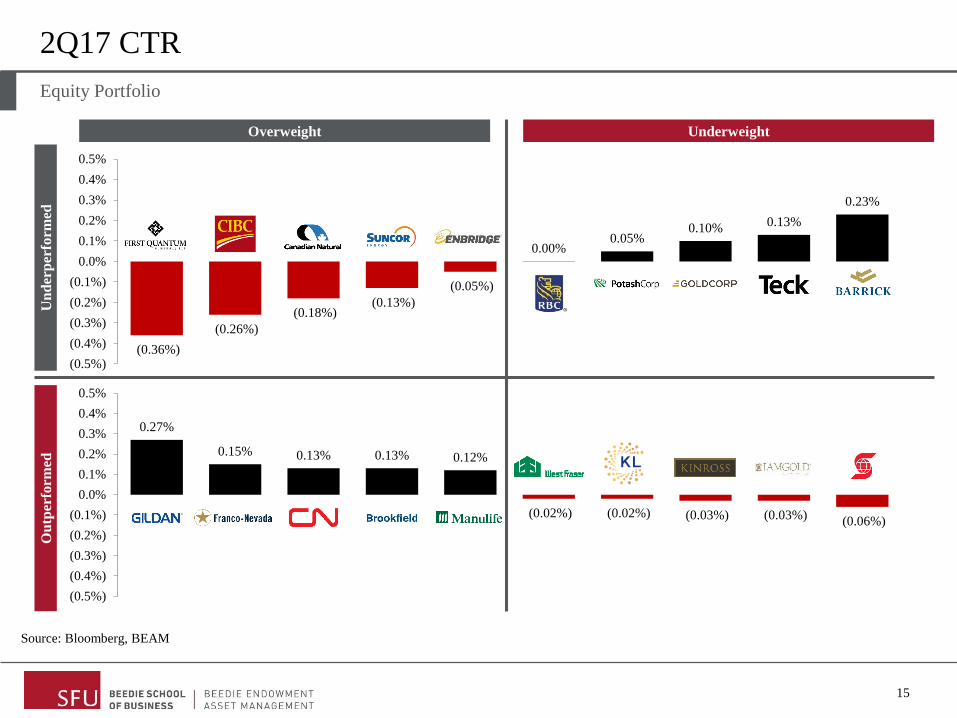
2Q17 CTRU
nd
erp
erfo
rmed
Ou
tper
form
ed
Overweight Underweight
Source: Bloomberg, BEAM
Equity Portfolio
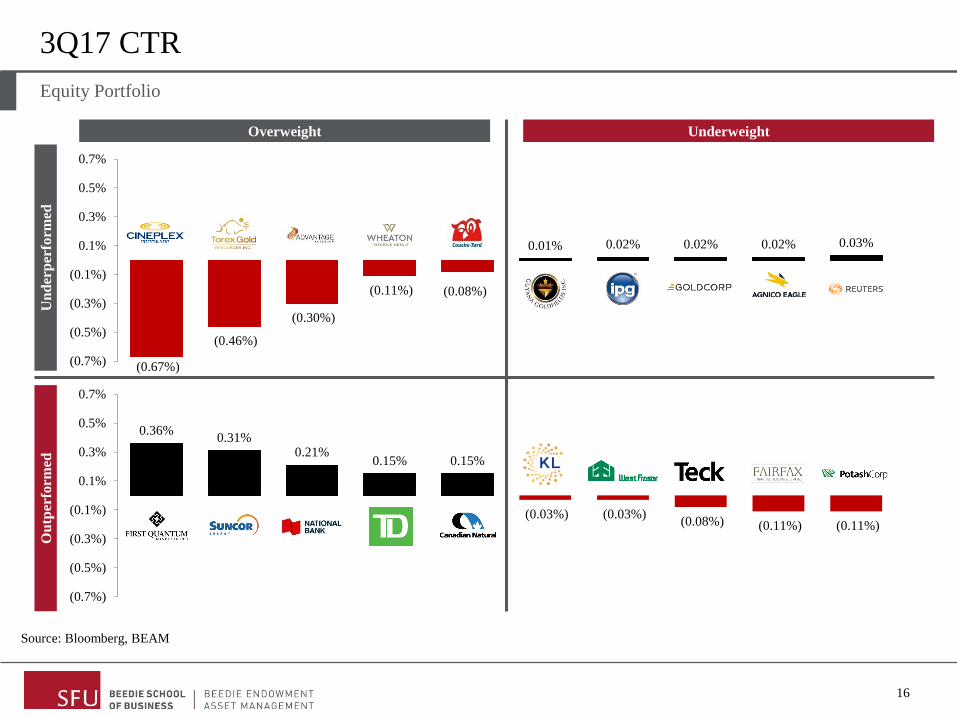
16
3Q17 CTRU
nd
erp
erfo
rmed
Ou
tper
form
ed
Overweight Underweight
Source: Bloomberg, BEAM
Equity Portfolio
(0.67%)
(0.46%)
(0.30%)
(0.11%) (0.08%)
0.01% 0.02% 0.02% 0.02% 0.03%
(0.7%)
(0.5%)
(0.3%)
(0.1%)
0.1%
0.3%
0.5%
0.7%
0.36%0.31%
0.21%0.15% 0.15%
(0.03%) (0.03%)(0.08%) (0.11%) (0.11%)
(0.7%)
(0.5%)
(0.3%)
(0.1%)
0.1%
0.3%
0.5%
0.7%
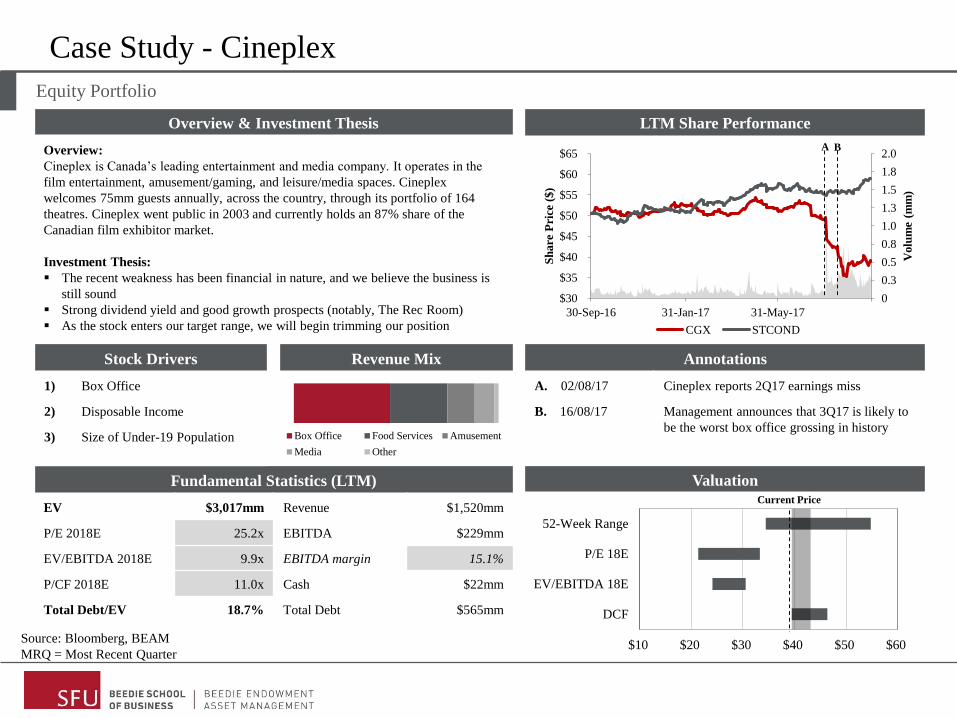
0
0.3
0.5
0.8
1.0
1.3
1.5
1.8
2.0
$30
$35
$40
$45
$50
$55
$60
$65
30-Sep-16 31-Jan-17 31-May-17
Volu
me
(mm
)
Sh
are
Pri
ce (
$)
CGX STCOND
$10 $20 $30 $40 $50 $60
DCF
EV/EBITDA 18E
P/E 18E
52-Week Range
Fundamental Statistics (LTM)
EV $3,017mm Revenue $1,520mm
P/E 2018E 25.2x EBITDA $229mm
EV/EBITDA 2018E 9.9x EBITDA margin 15.1%
P/CF 2018E 11.0x Cash $22mm
Total Debt/EV 18.7% Total Debt $565mm
Valuation
1) Box Office
2) Disposable Income
3) Size of Under-19 Population
Annotations
A. 02/08/17 Cineplex reports 2Q17 earnings miss
B. 16/08/17 Management announces that 3Q17 is likely to
be the worst box office grossing in history
Overview & Investment Thesis
Overview:
Cineplex is Canada’s leading entertainment and media company. It operates in the
film entertainment, amusement/gaming, and leisure/media spaces. Cineplex
welcomes 75mm guests annually, across the country, through its portfolio of 164
theatres. Cineplex went public in 2003 and currently holds an 87% share of the
Canadian film exhibitor market.
Investment Thesis:
▪ The recent weakness has been financial in nature, and we believe the business is
still sound
▪ Strong dividend yield and good growth prospects (notably, The Rec Room)
▪ As the stock enters our target range, we will begin trimming our position
LTM Share Performance
Stock Drivers Revenue Mix
A B
Case Study - Cineplex
Source: Bloomberg, BEAM
MRQ = Most Recent Quarter
Current Price
Box Office Food Services Amusement
Media Other
Equity Portfolio
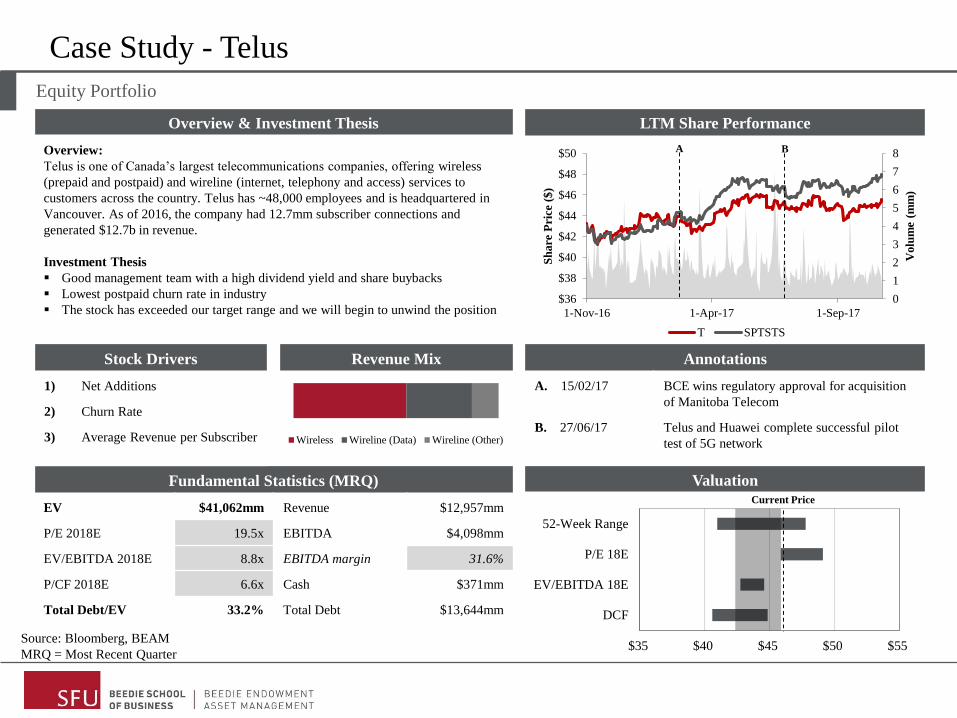
$35 $40 $45 $50 $55
DCF
EV/EBITDA 18E
P/E 18E
52-Week Range
Fundamental Statistics (MRQ)
EV $41,062mm Revenue $12,957mm
P/E 2018E 19.5x EBITDA $4,098mm
EV/EBITDA 2018E 8.8x EBITDA margin 31.6%
P/CF 2018E 6.6x Cash $371mm
Total Debt/EV 33.2% Total Debt $13,644mm
Valuation
1) Net Additions
2) Churn Rate
3) Average Revenue per Subscriber
Annotations
A. 15/02/17 BCE wins regulatory approval for acquisition
of Manitoba Telecom
B. 27/06/17 Telus and Huawei complete successful pilot
test of 5G network
Overview & Investment Thesis
Overview:
Telus is one of Canada’s largest telecommunications companies, offering wireless
(prepaid and postpaid) and wireline (internet, telephony and access) services to
customers across the country. Telus has ~48,000 employees and is headquartered in
Vancouver. As of 2016, the company had 12.7mm subscriber connections and
generated $12.7b in revenue.
Investment Thesis
▪ Good management team with a high dividend yield and share buybacks
▪ Lowest postpaid churn rate in industry
▪ The stock has exceeded our target range and we will begin to unwind the position
LTM Share Performance
Stock Drivers Revenue Mix
$36
$38
$40
$42
$44
$46
$48
$50
1-Nov-16 1-Apr-17 1-Sep-17
0
1
2
3
4
5
6
7
8
Sh
are
Pri
ce (
$)
Volu
me
(mm
)
T SPTSTS
A B
Case Study - Telus
Source: Bloomberg, BEAM
MRQ = Most Recent Quarter
Wireless Wireline (Data) Wireline (Other)
Current Price
Equity Portfolio
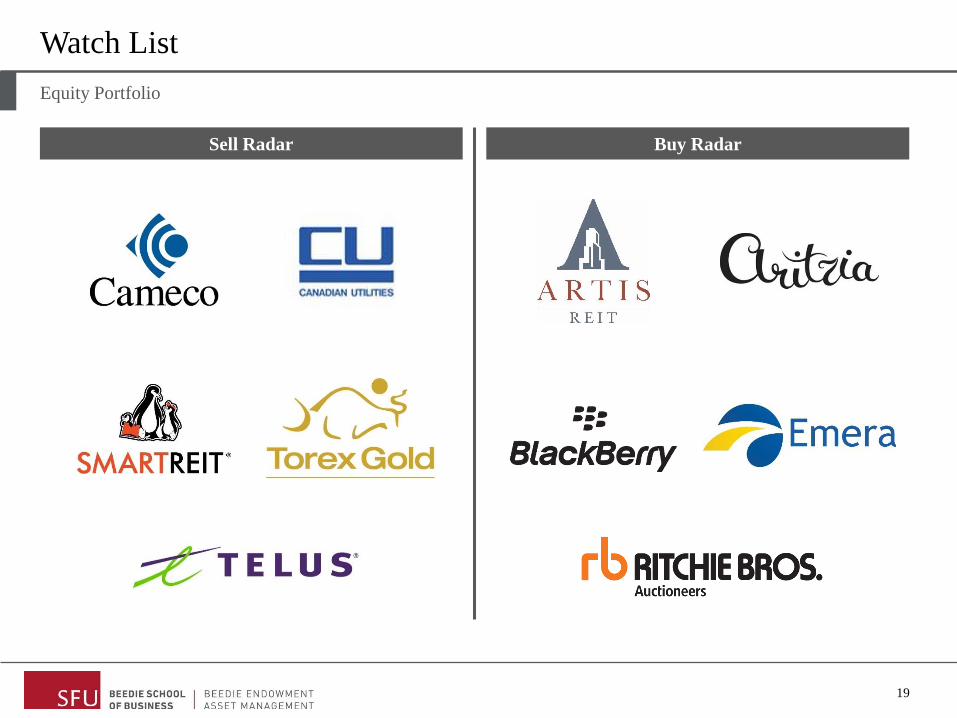
Sell Radar
19
Equity Portfolio
Watch List
Buy Radar
(1.0%)
0.0%
1.0%
2.0%
3.0%
4.0%
5.0%
Dec-2016 Jan-2017 Feb-2017 Mar-2017 Apr-2017 May-2017 Jun-2017 Jul-2017 Aug-2017
Portfolio Benchmark
21
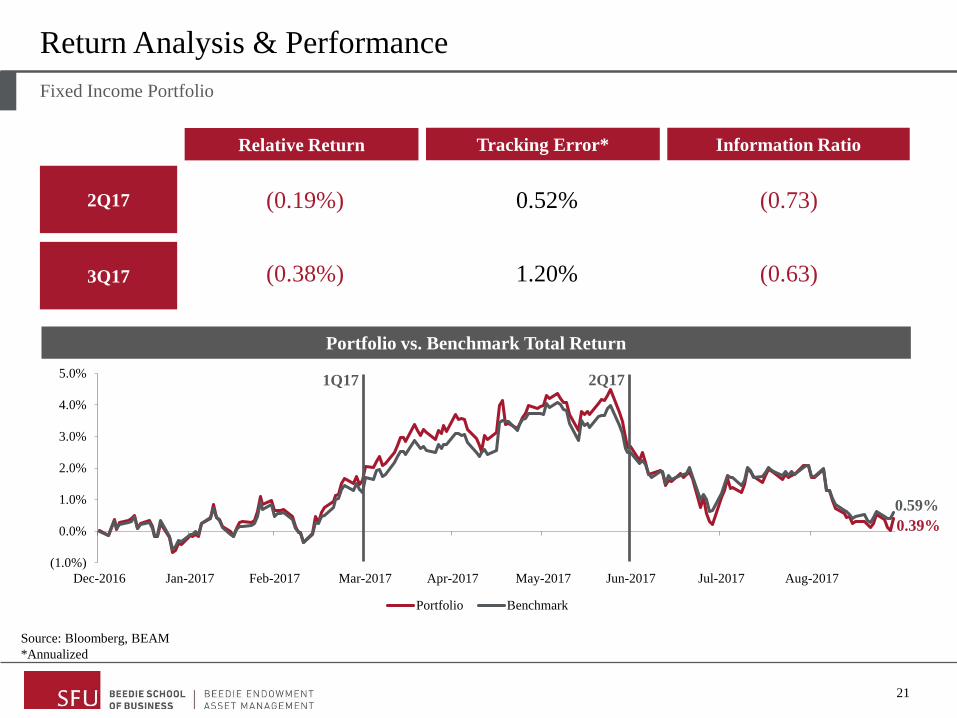
Fixed Income Portfolio
Return Analysis & Performance
2Q17
3Q17
Portfolio vs. Benchmark Total Return
Relative Return Tracking Error* Information Ratio
(0.19%) 0.52% (0.73)
(0.38%) 1.20% (0.63)
Source: Bloomberg, BEAM
*Annualized
2Q171Q17
0.59%
0.39%
22
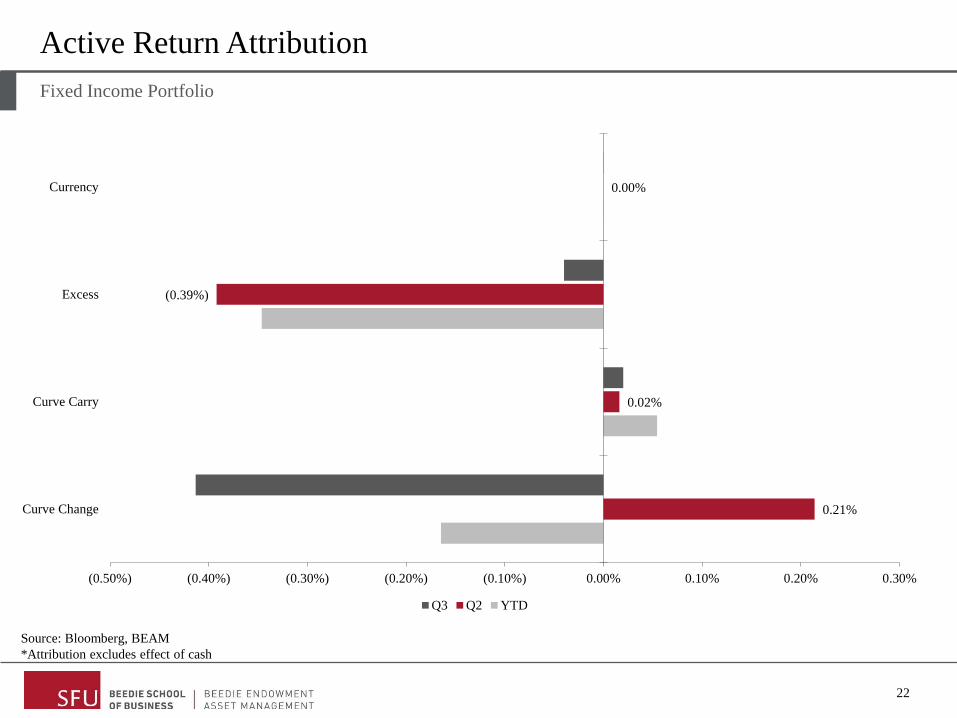
Fixed Income Portfolio
Active Return Attribution
Source: Bloomberg, BEAM
*Attribution excludes effect of cash
0.21%
0.02%
(0.39%)
0.00%
(0.50%) (0.40%) (0.30%) (0.20%) (0.10%) 0.00% 0.10% 0.20% 0.30%
Curve Change
Curve Carry
Excess
Currency
Q3 Q2 YTD
2Q17
23
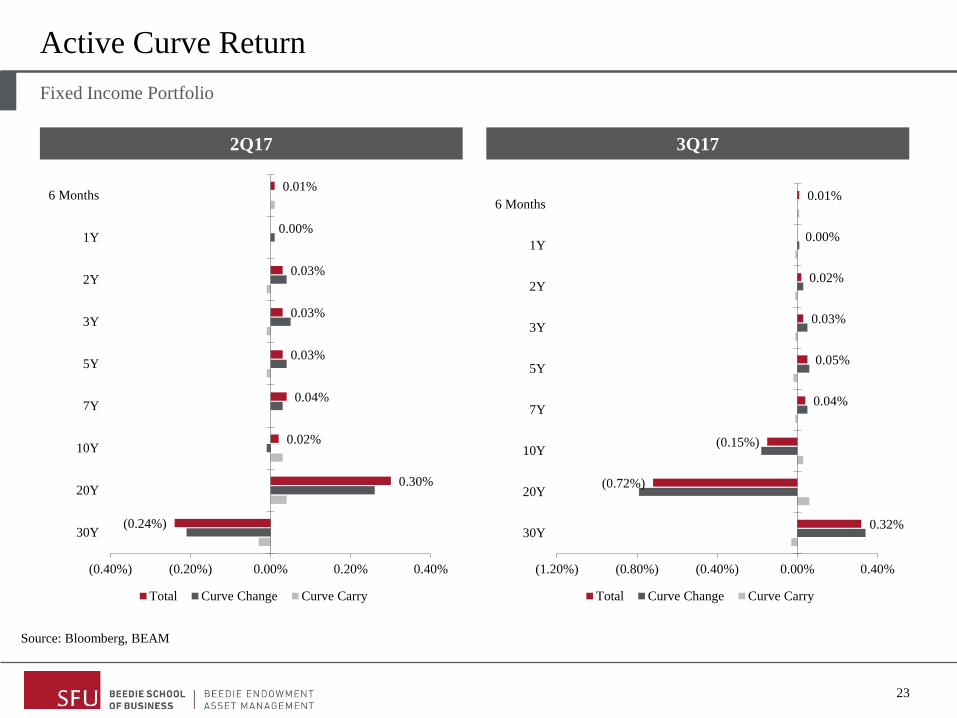
Fixed Income Portfolio
Active Curve Return
3Q17
(0.24%)
0.30%
0.02%
0.04%
0.03%
0.03%
0.03%
0.00%
0.01%
(0.40%) (0.20%) 0.00% 0.20% 0.40%
30Y
20Y
10Y
7Y
5Y
3Y
2Y
1Y
6 Months
Total Curve Change Curve Carry
Source: Bloomberg, BEAM
0.32%
(0.72%)
(0.15%)
0.04%
0.05%
0.03%
0.02%
0.00%
0.01%
(1.20%) (0.80%) (0.40%) 0.00% 0.40%
30Y
20Y
10Y
7Y
5Y
3Y
2Y
1Y
6 Months
Total Curve Change Curve Carry
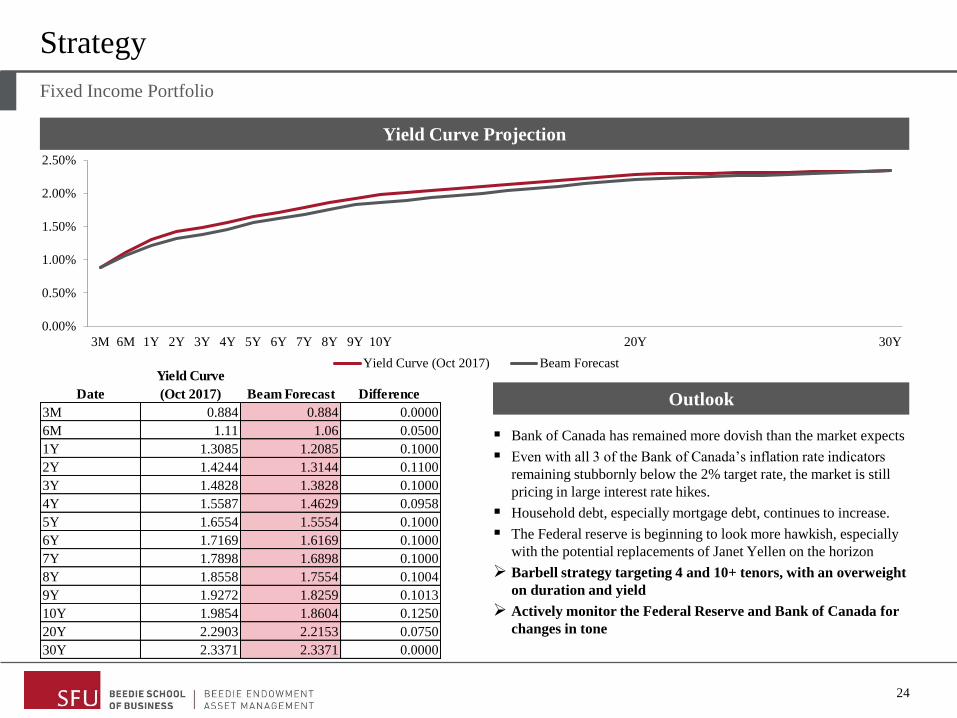
Yield Curve
Date (Oct 2017) Beam Forecast Difference
3M 0.884 0.884 0.0000
6M 1.11 1.06 0.0500
1Y 1.3085 1.2085 0.1000
2Y 1.4244 1.3144 0.1100
3Y 1.4828 1.3828 0.1000
4Y 1.5587 1.4629 0.0958
5Y 1.6554 1.5554 0.1000
6Y 1.7169 1.6169 0.1000
7Y 1.7898 1.6898 0.1000
8Y 1.8558 1.7554 0.1004
9Y 1.9272 1.8259 0.1013
10Y 1.9854 1.8604 0.1250
20Y 2.2903 2.2153 0.0750
30Y 2.3371 2.3371 0.0000
24
Fixed Income Portfolio
Strategy
Outlook
Yield Curve Projection
▪ Bank of Canada has remained more dovish than the market expects
▪ Even with all 3 of the Bank of Canada’s inflation rate indicators
remaining stubbornly below the 2% target rate, the market is still
pricing in large interest rate hikes.
▪ Household debt, especially mortgage debt, continues to increase.
▪ The Federal reserve is beginning to look more hawkish, especially
with the potential replacements of Janet Yellen on the horizon
➢ Barbell strategy targeting 4 and 10+ tenors, with an overweight
on duration and yield
➢ Actively monitor the Federal Reserve and Bank of Canada for
changes in tone
0.00%
0.50%
1.00%
1.50%
2.00%
2.50%
3M 6M 1Y 2Y 3Y 4Y 5Y 6Y 7Y 8Y 9Y 10Y 20Y 30Y
Yield Curve (Oct 2017) Beam Forecast
25
Contribution to Duration Comparison
Fixed Income Portfolio
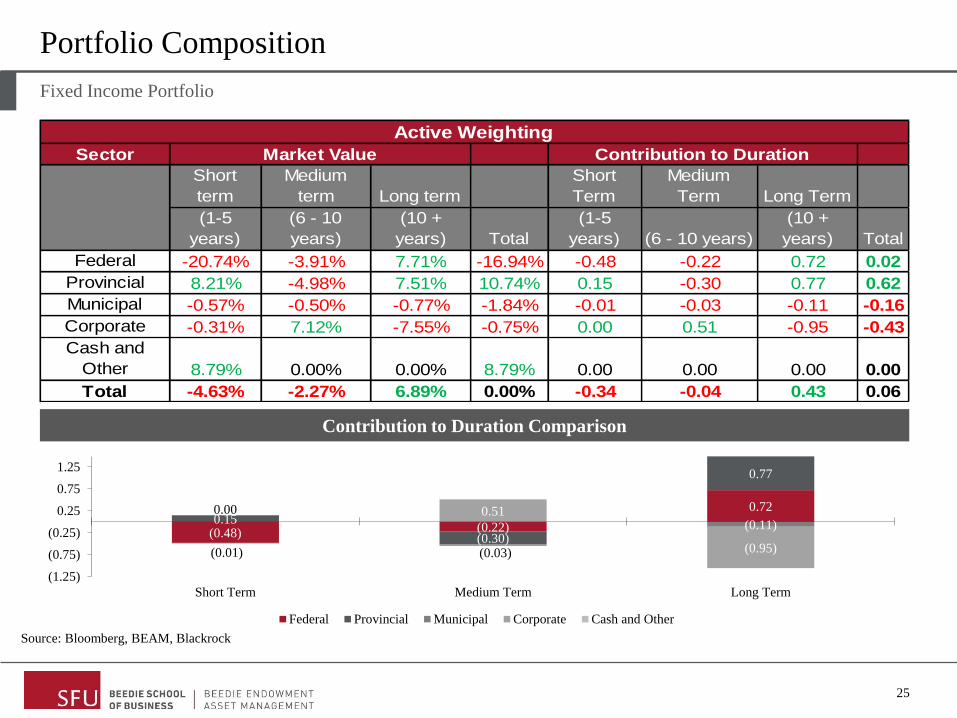
Portfolio Composition
Sector
Short
term
Medium
term Long term
Short
Term
Medium
Term Long Term
(1-5
years)
(6 - 10
years)
(10 +
years) Total
(1-5
years) (6 - 10 years)
(10 +
years) Total
Federal -20.74% -3.91% 7.71% -16.94% -0.48 -0.22 0.72 0.02
Provincial 8.21% -4.98% 7.51% 10.74% 0.15 -0.30 0.77 0.62
Municipal -0.57% -0.50% -0.77% -1.84% -0.01 -0.03 -0.11 -0.16
Corporate -0.31% 7.12% -7.55% -0.75% 0.00 0.51 -0.95 -0.43
Cash and
Other 8.79% 0.00% 0.00% 8.79% 0.00 0.00 0.00 0.00
Total -4.63% -2.27% 6.89% 0.00% -0.34 -0.04 0.43 0.06
Active Weighting
Market Value Contribution to Duration
(0.48) (0.22)
0.720.15
(0.30)
0.77
(0.01) (0.03)
(0.11)
0.00 0.51
(0.95)
(1.25)
(0.75)
(0.25)
0.25
0.75
1.25
Short Term Medium Term Long Term
Federal Provincial Municipal Corporate Cash and Other
Source: Bloomberg, BEAM, Blackrock
26
Fixed Income Portfolio
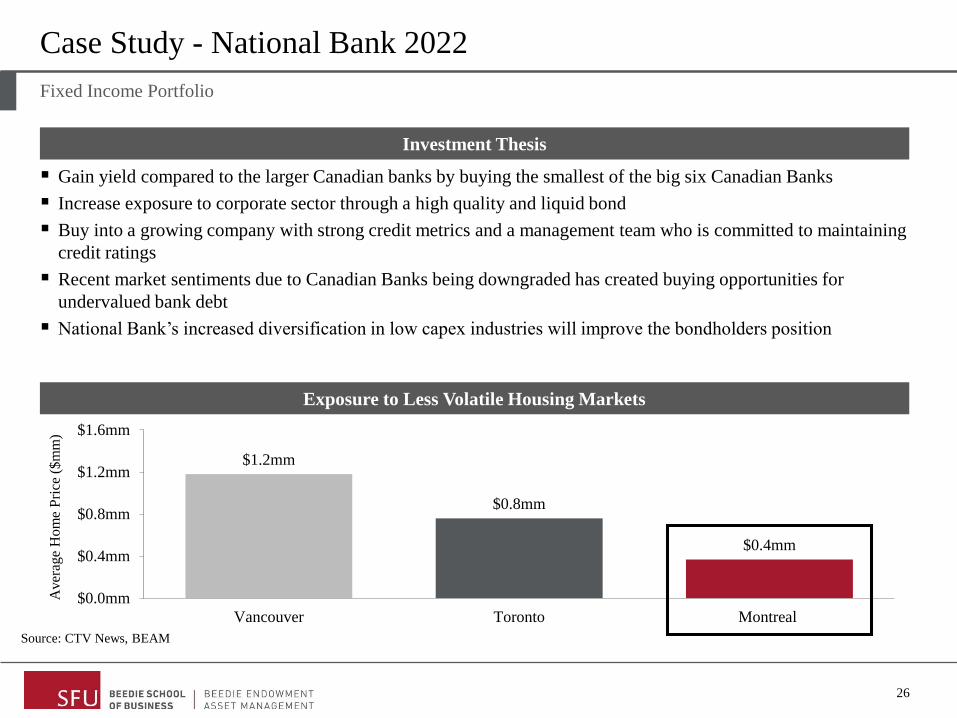
Case Study - National Bank 2022
Exposure to Less Volatile Housing Markets
$1.2mm
$0.8mm
$0.4mm
$0.0mm
$0.4mm
$0.8mm
$1.2mm
$1.6mm
Vancouver Toronto Montreal
Aver
age
Ho
me
Pri
ce (
$m
m)
Investment Thesis
▪ Gain yield compared to the larger Canadian banks by buying the smallest of the big six Canadian Banks
▪ Increase exposure to corporate sector through a high quality and liquid bond
▪ Buy into a growing company with strong credit metrics and a management team who is committed to maintaining
credit ratings
▪ Recent market sentiments due to Canadian Banks being downgraded has created buying opportunities for
undervalued bank debt
▪ National Bank’s increased diversification in low capex industries will improve the bondholders position
Source: CTV News, BEAM

28
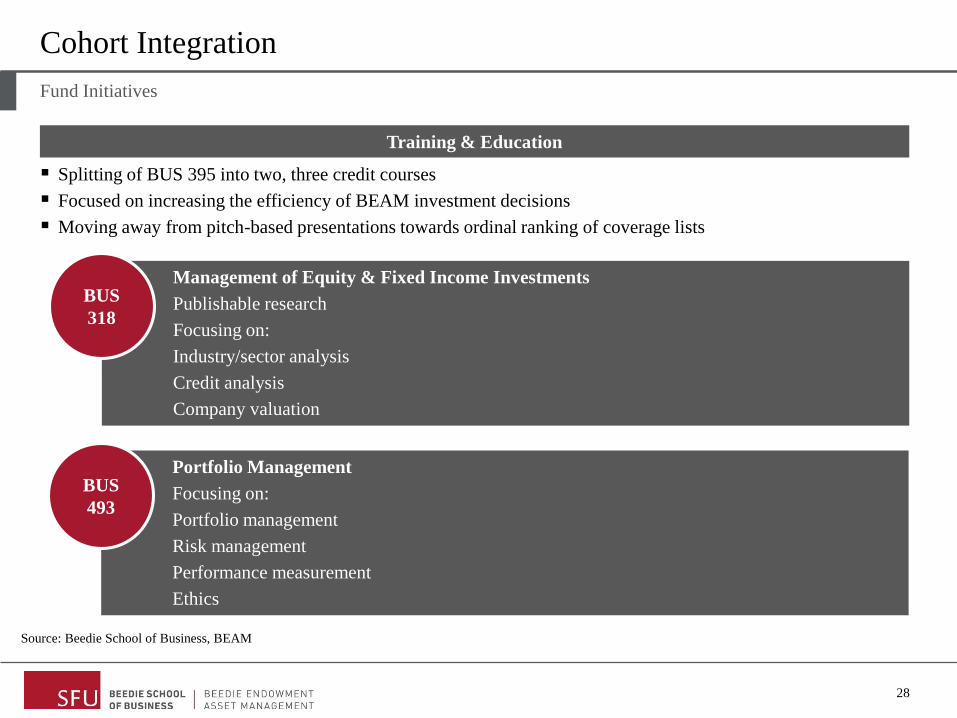
Cohort Integration
Training & Education
▪ Splitting of BUS 395 into two, three credit courses
▪ Focused on increasing the efficiency of BEAM investment decisions
▪ Moving away from pitch-based presentations towards ordinal ranking of coverage lists
Fund Initiatives
BUS
493
BUS
318
Management of Equity & Fixed Income Investments
Publishable research
Focusing on:
Industry/sector analysis
Credit analysis
Company valuation
BUS
493
Portfolio Management
Focusing on:
Portfolio management
Risk management
Performance measurement
Ethics
Source: Beedie School of Business, BEAM
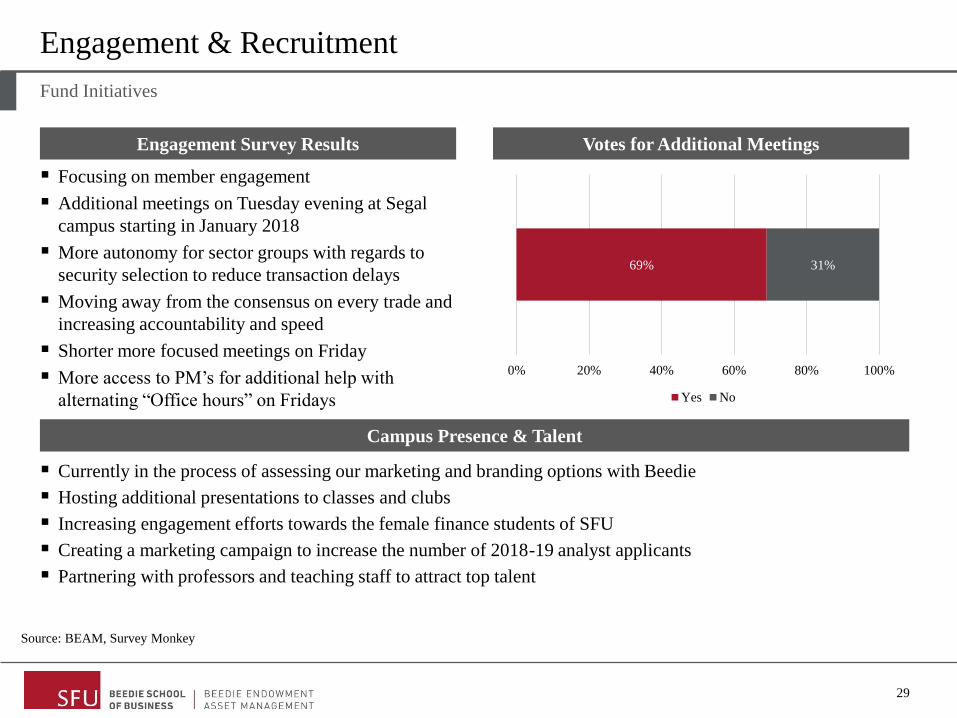
Engagement Survey Results
29
Fund Initiatives
Engagement & Recruitment
Votes for Additional Meetings
▪ Focusing on member engagement
▪ Additional meetings on Tuesday evening at Segal
campus starting in January 2018
▪ More autonomy for sector groups with regards to
security selection to reduce transaction delays
▪ Moving away from the consensus on every trade and
increasing accountability and speed
▪ Shorter more focused meetings on Friday
▪ More access to PM’s for additional help with
alternating “Office hours” on Fridays
Source: BEAM, Survey Monkey
Campus Presence & Talent
▪ Currently in the process of assessing our marketing and branding options with Beedie
▪ Hosting additional presentations to classes and clubs
▪ Increasing engagement efforts towards the female finance students of SFU
▪ Creating a marketing campaign to increase the number of 2018-19 analyst applicants
▪ Partnering with professors and teaching staff to attract top talent
69% 31%
0% 20% 40% 60% 80% 100%
Yes No
▪ Send monthly reports to the SFU treasury outlining
performance and attribution at the balanced and
asset-class level starting in January 2018
30
Accountability
GIPS Compliance
Record Retention
▪ Common model, presentation, and publication templates
▪ Mandatory to post all BEAM-related work to OneDrive and Slack
▪ Use and improve on previous analysts’ work to reduce the learning curve
▪ Currently revamping the way we store and organize historical transactional data from the custodian
Performance Updates
Fund Initiatives
Source: BEAM, Global Investment Performance Standards
▪ In the process of gathering and transferring historical
portfolio records to Bloomberg
▪ Goal is for BEAM to be GIPS compliant with
performance and transactions on record since
inception

31
Fund Initiatives
Source: BEAM, Slack

Questions
32
VI. Appendix
33
34
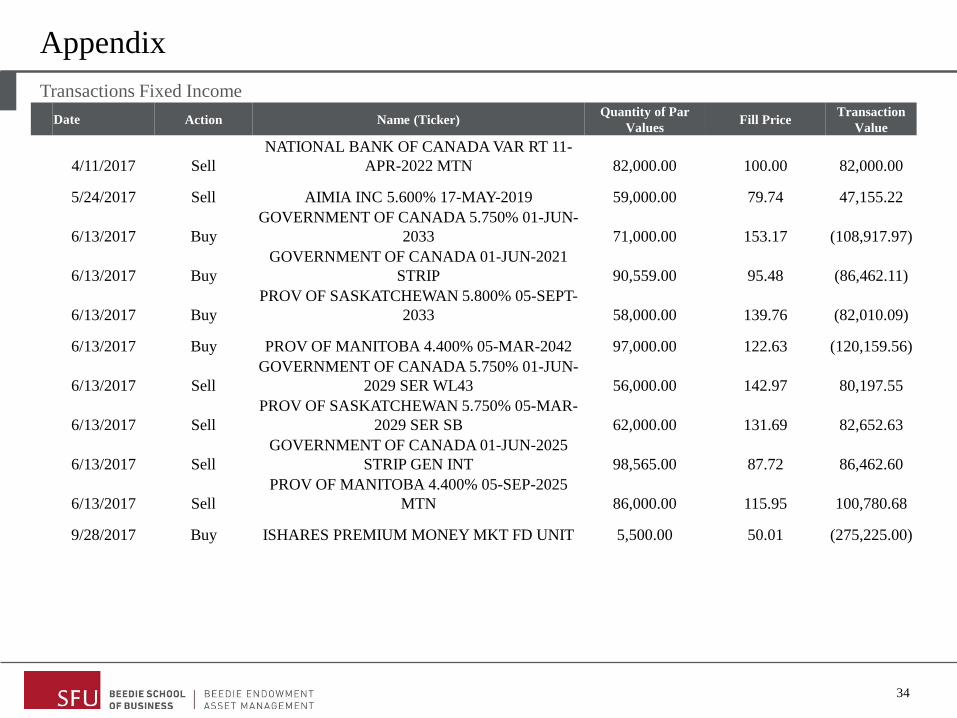
Transactions Fixed Income
Appendix
Date Action Name (Ticker)Quantity of Par
ValuesFill Price
Transaction
Value
4/11/2017 Sell
NATIONAL BANK OF CANADA VAR RT 11-
APR-2022 MTN 82,000.00 100.00 82,000.00
5/24/2017 Sell AIMIA INC 5.600% 17-MAY-2019 59,000.00 79.74 47,155.22
6/13/2017 Buy
GOVERNMENT OF CANADA 5.750% 01-JUN-
2033 71,000.00 153.17 (108,917.97)
6/13/2017 Buy
GOVERNMENT OF CANADA 01-JUN-2021
STRIP 90,559.00 95.48 (86,462.11)
6/13/2017 Buy
PROV OF SASKATCHEWAN 5.800% 05-SEPT-
2033 58,000.00 139.76 (82,010.09)
6/13/2017 Buy PROV OF MANITOBA 4.400% 05-MAR-2042 97,000.00 122.63 (120,159.56)
6/13/2017 Sell
GOVERNMENT OF CANADA 5.750% 01-JUN-
2029 SER WL43 56,000.00 142.97 80,197.55
6/13/2017 Sell
PROV OF SASKATCHEWAN 5.750% 05-MAR-
2029 SER SB 62,000.00 131.69 82,652.63
6/13/2017 Sell
GOVERNMENT OF CANADA 01-JUN-2025
STRIP GEN INT 98,565.00 87.72 86,462.60
6/13/2017 Sell
PROV OF MANITOBA 4.400% 05-SEP-2025
MTN 86,000.00 115.95 100,780.68
9/28/2017 Buy ISHARES PREMIUM MONEY MKT FD UNIT 5,500.00 50.01 (275,225.00)
35
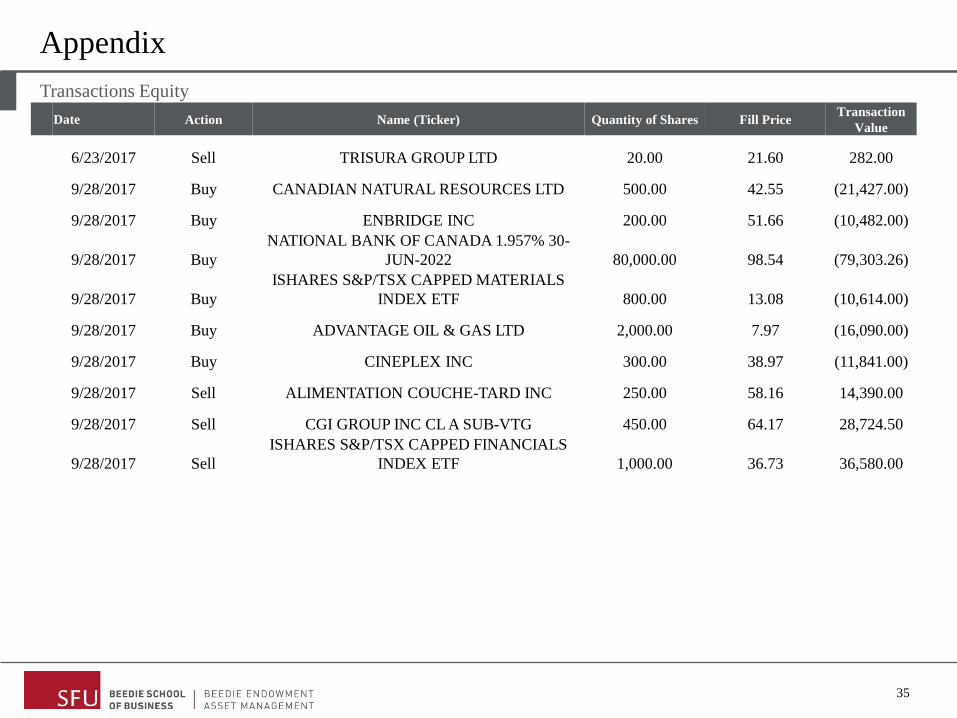
Transactions Equity
Appendix
Date Action Name (Ticker) Quantity of Shares Fill PriceTransaction
Value
6/23/2017 Sell TRISURA GROUP LTD 20.00 21.60 282.00
9/28/2017 Buy CANADIAN NATURAL RESOURCES LTD 500.00 42.55 (21,427.00)
9/28/2017 Buy ENBRIDGE INC 200.00 51.66 (10,482.00)
9/28/2017 Buy
NATIONAL BANK OF CANADA 1.957% 30-
JUN-2022 80,000.00 98.54 (79,303.26)
9/28/2017 Buy
ISHARES S&P/TSX CAPPED MATERIALS
INDEX ETF 800.00 13.08 (10,614.00)
9/28/2017 Buy ADVANTAGE OIL & GAS LTD 2,000.00 7.97 (16,090.00)
9/28/2017 Buy CINEPLEX INC 300.00 38.97 (11,841.00)
9/28/2017 Sell ALIMENTATION COUCHE-TARD INC 250.00 58.16 14,390.00
9/28/2017 Sell CGI GROUP INC CL A SUB-VTG 450.00 64.17 28,724.50
9/28/2017 Sell
ISHARES S&P/TSX CAPPED FINANCIALS
INDEX ETF 1,000.00 36.73 36,580.00