beacon economics inland empire forecast
DESCRIPTION
Annual forecast of economic conditions in Riverside and San Bernardino countiesTRANSCRIPT

2014Riverside/San BernardinoEconomicForecast
Presented byBeacon Economics, LLCUniversity of California at Riverside, School of Business Administration
Volume 7 Number 1 October 2014
This publication was prepared by:
Beacon Economics
Christopher Thornberg, Founding Partner Jordan G. Levine, Economist5777 West Century Boulevard, Suite 895 5777 West Century Boulevard, Suite 895Los Angeles, California 90045 Los Angeles, California 90045310.571.3399 [email protected] [email protected]
For further information about this publication, or about Beacon Economics, please contact:
Victoria Pike BondDirector of CommunicationsBeacon [email protected]
Or visit our website at www.BeaconEcon.com.
Reproduction of this document or any portion therein is prohibited without the expressed written permission of Beacon Economics.
Copyright ©2014 by Beacon Economics LLC.

School of Business Administration and The A. Gary Anderson Graduate School of Management
Anderson Hall
Riverside, CA 92521
Greetings,
The UC Riverside School of Business Administration is proud to partner with Beacon Economics
to bring you the fifth-annual economic forecast conference for the Riverside/San Bernardino
region. This important community event provides a platform for Inland Southern California’s top
business leaders to discuss and provide insight on the economy.
For the Sake of Growth: Building Entrepreneurs and Companies in the Inland Empire will be the
topic of this year’s expert panel. This insightful discussion will examine ways in which the public
and private sectors can work collaboratively to foster an environment that allows for greater
economic growth.
In fact, “Leading Thinkers Leading Growth” is our motto at the School of Business
Administration. It reflects our commitment to Inland Southern California’s economic
development—and to providing leadership as we navigate through the region’s continued
economic recovery. Toward this end, we are pleased to share that we have made significant
strides in the development of a UCR-housed Forecasting Research Center and look forward to
partnering with many of you on this initiative.
Additionally, we are proud to report that our school, accredited by the Association to Advance
Collegiate Schools of Business, was again named one of Princeton Review’s best 296 business
schools in the nation and one of the best in the west in 2013. In addition to the largest
undergraduate business program in the UC-system, we offer MBA, Ph.D., Master of Professional
Accountancy, Flex MBA and Master of Finance programs.
We are growing and, much like the region, are on the upward path to sustained excellence.
Thank you for your support of this year’s conference. I hope you enjoy the program.
Yunzeng Wang, Ph.D.
Dean
UCR School of Business Administration
Tel 951.827.6329 ͻ Fax 951.827.3970 ͻ www.soba.ucr.edu


SponsorsBeacon Economics would like to extend our deepest gratitude to our partners and sponsors, without whom thispublication would not have been possible.
Gold
Media
Silver
Bronze
Exhibit Booth


• Accredited by the Association to Advance Collegiate Schools of Business (AACSB). Less than 5% of business schools in the world have earned AACSB accreditation. • Listed by The Princeton Review among the top 296 “Best Business Schools” in the nation.• Ranked in the top 100 “Best Graduate Schools” of 2013 by U.S. News & World Report (97th out of 441 schools)
Contact Us:AGSM Graduate Business Programs Phone: (951) 827-6200Email: [email protected]
Earn your Master’s Now
MBAFlex MBA
Master of Professional AccountancyMaster of Finance
LEADING THINKERS LEADING GROWTH
agsm.ucr.edu
Qualified applicants may receive tuition assistance
Join our upcoming events athttp://agsm.ucr.edu/calendar/

Alzheimer’s ResearchCancer PreventionCalifornia’s newest public School of MedicineCharter Member: University Innovation Alliance www.universityinnovationalliance.org
Explore more health impactspromise.ucr.edu
Health Sustainability Policy Technology
By studying how the human immune system is
affected over a lifetime by diet and aging,
UCR immunologist Ilhem Messaoudi can develop
more effective vaccines for older populations.
LIVING THE PROMISE
Real World SolutionsO U R P R O M I S E :

The A. Gary Anderson Family Foundationis proud to support Children’s Fund and their mission
to provide for at-risk and abused children at their:
23rd AnnualA. GARY ANDERSONMemorial Golf Classic
June 8, 2015Red Hill Country Club
Rancho Cucamonga, CA
For more information about Children’s Fund,please visit their website at:
www.childrensfundonline.org
f a m i l y f o u n d a t i o nA. GARY ANDERSON


Is proud to support the 2014 Riverside/San Bernardino
Economic Forecast Conference and UC Riverside’s
School of Business Administration


Bank of America is honored to support UCR and the Beacon Economic Forecast Conference
Thank you for all that you do in the Inland Empire. Your presence here creates connections that enrich our entire community, and we are honored to support the great work you are doing.
Visit us at bankofamerica.com/local Life’s better when we’re connected®
©2014 Bank of America Corporation | ARH46WCM
Delivering Superior Engineering, Architecture & CM results in:
CLEAN ENERGYBuilding, utility and energy infrastructure designs that lower
your total cost.
COMPREHENSIVE BUILDING DESIGNComplex and mission critical structures.
877.725.2755 www.salasobrien.com


Contents
U.S. Forecast 1
California Forecast 9
Inland Empire Forecast 19
Employment 27
Business Activity 35
Residential Real Estate 47
Commercial Real Estate 57
Demographics and Quality of Life 75

Inland EmpireMetropolitan Statistical Area
Riverside
San Bernardino
California
Temecula
Wildomar
Murrieta
BlytheCoachella
La Quinta
Indian WellsLake Elsinore
Hemet
Indio
Idyllwild-Pine CovePalm Desert
Rancho MirageSan JacintoPerrisAnaheim
Cathedral CityCorona
Yorba Linda
Palm Springs
Beaumont
NorcoMoreno Valley
Desert Hot SpringsCalimesa
RiversideChino Hills
BanningDiamond BarChino Yucaipa
Ontario ColtonRedlands
Pomona
Highlandd
ClaremontRancho Cucamonga
RialtoFontana
Yucca Valley Twentynine PalmsSan
Bernardino
Lake Arrowhead
Hesperia
Victorville
Apple Valley
Adelanto
NeedlesBarstow
n
Searles Valley
Lake Havasu City
Canyon LakeSun City
Winchester
Nuevo
WoodcrestMarch AFB
Pedley Cherry ValleyMira Loma Rubidoux
Glen AvonLoma Linda Mentone Morongo Valley
Joshua Tree
Big River
CrestlineParker Strip
Big Bear Lake

BEACONECONOMICS
U.S. Forecastby Christopher Thornberg
ContentsZero To Hero 2Curb Your Enthusiasm 2The Bounce In Our Step 3On Policy and Prices... 7

U.S. Forecast
Zero To Hero
In 2008 the U.S. economy sunk into the deepest down-turn since the Great Depression. By the end of thatyear most of the globe had followed the United Statesinto recession and in 2009 global output shrank byover 2%, the first time that has happened since WorldWar II ended. TheUnited Stateswas not the only coun-try with a large housing bubble, nor were U.S. banksthe only to indulge in over-leveraging even as they in-vested in highly risky assets. Nevertheless, it was clearthat the United States was at the heart of the problem.
Today, the global economy is weak again. Europe hasyet to fully pull out of the recession, led by sovereigndebt crisis, that it experienced last year. The BRICS(an acronym for an association of five major emerg-ing national economies: Brazil, Russia, India, China,and South Africa) are also showing signs of trouble.China, while still growing, has slowed and its realestate markets are showing signs of distress. Brazilhas slipped into a mild recession due to sagging com-modity prices. Sanctions on Russia are clearly havingan impact on that nation and India has also slowedsharply. The World Bank and the IMF have both hadto scale back their growth outlook numerous times inthe last few months.
But this time the United States is no longer at thecore of the problem; quite the opposite, the U.S. econ-omy will be an important source of strength glob-ally as these nations work to reverse course and getback onto a growth trajectory. Nearly every part ofthe U.S. economy is showing real signs of slow butsteady improvement, fromhousing to public spendingto credit. The only portion of the economy that is act-ing as a drain on the nation is the export sector—for allthe aforementioned global reasons. That said, the U.S.economy will keep growing this year, but at slightlybelow 3%, a bit slower than last year. Next year, ex-pect the U.S. economy to grow at a pacemodestly over3%,with the following year improving evenmore—the
growing momentum will be driven by improving fun-damentals.
As for major risks, they remain largely external – al-though there is nothing on the international frontthat could seriously derail the nation’s economy. Theglobal economy remains the swing item. If there is abetter recovery than expected, then next year will bebetter than Beacon Economics’ current forecast. If itis significantly worse, then growth will likely dip intothe low 2% range. Regardless, the U.S. economy willcontinue to expand for the foreseeable future.
Curb Your Enthusiasm
The U.S. economy’s 4.6% growth rate in the secondquarter of 2014 came as a relief to many policymak-ers after the -2% hit taken during the first quarter ofthe year. Data from the third quarter have simply con-firmed Beacon Economics’ interpretation of the firstquarter as a blip. Beacon’s monthly GDP estimate sug-gests that growth in the third quarter will come inat 3.6%. Combine this with better labor market num-bers—on average 220,000 jobs were added per monthover the last year and the official unemployment ratehas dropped to below 6% for the first time since 2007—and suddenly the economy looks like a talking pointfor the Democrats rather the Republicans. Althoughthis does not seem to be having any impact on the out-look for the midterm elections.
Still, while there is little doubt the mid-year num-bers look good, these big numbers are really just abounce from the weak first quarter – a quarter thatwas largely an artifact of the extreme weather expe-rienced in many parts of the nation and of a big runoff in inventories (likely also related to weather). Thesecond and third quarters were largely mirror imagesof the first, as growing inventories and a bounce inconsumer spendingmade up for ground lost earlier inthe year. Average the three quarters out and growthis running at about 2%.
2 2014 Riverside/San Bernardino Economic Forecast

U.S. Forecast
One small part of the slowing is in the estimates ofconsumer health care expenditures. This seems odd,given that other numbers on consumer spending, in-cluding retail sales, auto sales, and other more eas-ily measured forms of spending, are rising. Addition-ally, by all accounts, approximately 7 to 8millionmoreAmericans have health insurance today compared toone or two years ago. If anything, health care expen-ditures would be expected to increase. And healthcareemployment continues to grow at a steady 2% annualpace. Add it up and it seems this is more likely a glitchin the U.S. Bureau of Economic Analysis’ (BEA) esti-mates rather than a real phenomena.
The real reason for the deceleration is the nation’sexternal accounts, with a sudden widening of thetrade deficit. Beacon Economics’ initial outlook forGDP growth in the 3% range in 2014 was based largelyon the assumption that the trade deficit would con-tinue to close. But this didn’t happen. Instead, a weakglobal economy slowed export growth sharply, evenas stronger demand in the United States caused im-port growth to accelerate.
Contributions to Real GDP GrowthComponent Q1-14 Q2-14 Q3-14 Avg. Diff.
Real GDP -2.1 4.60 3.60 −1.09
Consumption 0.83 1.75 1.50 −0.54
Durable goods 0.23 0.99 0.79 0.24
Nondurable goods 0.00 0.34 0.26 −0.19
Services 0.60 0.42 0.46 −0.59
Private Domestic Inv. -1.13 2.87 1.21 −0.33
Structures 0.08 0.35 0.17 0.08
Equipment -0.06 0.63 0.51 0.01
IP products 0.18 0.21 0.26 0.11
Residential -0.17 0.27 0.27 −0.08
Change in Inventories -1.16 1.42 0.00 −0.45
Net Exports -1.66 -0.34 0.78 −0.67
Exports -1.30 1.43 0.89 −0.33
Imports -0.36 -1.77 -0.11 −0.34
Government -0.15 0.31 0.13 0.44
Federal -0.01 -0.06 0.06 0.48
State/Local -0.14 0.38 0.07 −0.03
Source: U.S. Bureau of Economic Analysis
Right now the United States still doesn’t have the‘umph’ to close the output gap that opened during thecourse of the downturn. And while the labor marketsaremodestly stronger, the operative word is ‘modest’.Participation rates are still under 63%, far below the66% level prior to the recession.Wage growth remainstepid—even if other sorts of income are doing better.And none of this suggests that there will be a dramaticshift in Federal Reserve policy any time in the near fu-ture.
The Bounce In Our Step
The current trends do seem to be a frustrating re-peat of the last few years—three steps ahead, two stepsback. But in reality there are plenty of indications thatthe United States is shifting towards being in a highergrowth regime, with many economic indicators pick-ing up steam on many fronts. Indeed there is enoughmomentum in the nation’s economy to push us pastthe problems in the broader global economy. Follow-ing is an overview of some of the brighter spots in theU.S. economy—consumer spending, construction andbusiness investment—followed by a look at trade andpublic spending, two areas that are preventing evenbetter growth rates.
Consumer Spending
Consumer spending, outside of healthcare, has beengrowing at a steady pace since the start of 2014. Autosales have hit a 17 million annual pace in recentmonths—the best showing since before the recession.Retail sales have been growing at a nominal 4.5% an-nualized pace in recent months. And there are plentyof indications that the pace of growth will at least bemaintained over the next year.
The labor market is showing some of the strongestgrowth since the end of the recession, expanding at apace of 200,000 plus jobs per month over the last year.Moreover, the nation’s headline unemployment has
2014 Riverside/San Bernardino Economic Forecast 3

U.S. Forecast
dropped below 6%. And while there are still a higherthan normal number of distressed workers (long termunemployed, discouraged, or under employed) thetrend in unemployment is clearly on a downward tra-jectory. The labor markets may start to look ‘normal’againwithin two years. Also encouraging, personal in-comegrowthhas been expanding at a better pace. Realaggregate disposable personal income is growing at a2.7% pace, after running flat for most of 2013.
-4.0
-2.0
0.0
2.0
4.0
Y-o-
Y G
row
th (%
)
0
5,000
10,00
015
,000
20,00
0
Wor
kers
(000
s)
Jan-04 Jan-06 Jan-08 Jan-10 Jan-12 Jan-14year
LT Unemployed PT EconomicMarginal DiscouragedDisposable Income Growth
Source: Bureau of Labor Statistics
United States, Jan-04 to Sep-14Distressed Workers and Real Disposable Income Growth
Another bit of good news comes from consumercredit. Outside of student debt, consumer creditgrowth has been very subdued in recent years. Butin 2014 things have started to shift. Consumers havebecome more comfortable with borrowing as their fi-nancial confidence and net worth has expanded, andthe banking systemhas beenmorewilling to add loansto their balance sheets. The pace of expansion is nowover 6% per year. And with the savings rate remain-ing at a sufficient level, there is little sign of Americansover-extending themselves like they did in themiddleof last decade.
-10
-5
0
5
Year
-Ove
r-Yea
r Gro
wth
(%)
1,600
1,700
1,800
1,900
2,000
$ Bi
llions
Q1-07 Q1-08 Q1-09 Q1-10 Q1-11 Q1-12 Q1-13 Q1-14
Total Y-o-Y Growth
Source: Federal Reserve
Q1-07 to Q2-14Non-Education Consumer Credit
Construction
Construction is one of the big shortfalls in the U.S.economy (as noted in past years’ reports). Prior to thedownturn, close to 8% of U.S. GDP went to residentialand nonresidential investments. Today, that figure is6%, and with multiplier effects, explains close to halfthe output gap in the U.S. economy. Housing permitsremain stuck at one million units, with disappointingsales of new homes constraining construction of newsingle-family structures. Existing home sales have alsosoftened this year, leading some to predict anotherslump in the market. There are, however, other sig-nals that housing is not in a slump—but rather at thefront end of a solid expansion.
While sales of existing homes have slowed, this ap-pears to be largely due to a decline in the number offoreclosures rather than a pull back in what mightbest be termed ‘retail’ demand—move-up owner-occupants shifting to new properties. Indeed, otherindicators continue to suggest the market is not ‘soft’by any traditional measure. Inventories of units forsale remain tight and prices are still rising, albeit ata slower rate than earlier in the year. Rather, the pullback by investors has not yet beenmade up for by bet-ter retail buyer demand.
But that increased retail demand looks to be on thehorizon. The recent growth in home prices has addedsubstantially to home equity—which is now close to
4 2014 Riverside/San Bernardino Economic Forecast

U.S. Forecast
$14 trillion, up from $8 trillion at the bottom of theslump. Credit has also been a problem, but again, con-ditions are easing. Recent Fannie Mae data shows adecline in the average FICO score for new borrowers.Data from the Federal Reserve’s Senior Loan OfficerSurvey indicates that banks are starting to ease creditconditions for primemortgage loans. And data on out-standing mortgage debt held directly by the bankingsystem is beginning to grow slowly for the first time inyears. The coming increase in retail demand impliesmore need for new product—which should give newhome construction a nice lift in 2015.
Beacon Economics expects the second half of 2014to show distinct improvement in terms of sales andbuilding permits over the first half. Preliminary statis-tics for the first two months of the third quarterappear to back this up—existing home sales havestarted to increase again, and new home sales havealso jumped somewhat.
3,000
4,000
5,000
6,000
7,000
8,000
Sale
s (0
00s,
SAA
R)
Q1-04 Q3-06 Q1-09 Q3-11 Q1-14Source:
United States, Q1-04 to Q2-14Traditional Sales
Non-residential spending has also started to rampup in recent months. Much of the growth contin-ues to be in ‘alternative’ projects such as private in-frastructure and manufacturing. But traditional com-mercial projects—retail, office, hotel, and industrialspace—are also starting to expand rapidly, despitethe relatively high vacancy rate in these markets. Al-though overall vacancy rates are higher, there arepockets of high-demand and specialty type productsthat are in short supply. Demand in these areas has
pushed rent prices towards pre-recession levels andthe net result has been a new wave of construc-tion—either of new structures or to repurpose exist-ing ones into more high-demand products. With busi-ness activity continuing to grow, this trend will verylikely continue for the next few years.
Business Investment
Corporate profits and proprietor incomes havebounced back faster than almost any other part ofthe economy since the recession came to an end.They are now 35% higher than before the downturnbegan. Low interest rates, benign wage growth, and aweak dollar have all contributed. Still, recent reportshave suggested that businesses have not used thepositive environment to expand real investment.Rather, the story goes, they are only interested invarious financial maneuvers, from buying back stockto purchasing other firms to finding interesting waysto avoid paying taxes.
Actually the idea of declining investment by businessisn’t true—it is an illusion caused by the declining costof various sorts of investment, particularly informa-tion technology. Real (price adjusted) investments inequipment or intellectual property as a share of U.S.GDP are currently at record high levels. And there isplenty of reason to believe the level of investmentwill continue to grow. In the short term, orders andshipments of durable capital goods have risen sharplyand the third quarter will likely show solid growthdriven by spending. Capacity utilization has contin-ued to rise, a good leading indicator of more busi-ness investment for the near term. And the ISM in-dexes for manufacturing and non-manufacturing ac-tivity are also strongly in the black.
2014 Riverside/San Bernardino Economic Forecast 5
U.S. Forecast
2.5
3.0
3.5
4.0
4.5
5.0
Publ
ic In
vest
men
ts (%
of G
DP)
10
12
14
16
18
20
Priv
ate
Inve
stm
ents
(% o
f GD
P)
Q1-05 Q1-07 Q1-09 Q1-11 Q1-13
Private Investment Public Investment
Source: Bureau of Economic Analysis
Private and Public Investments as Shares of GDP
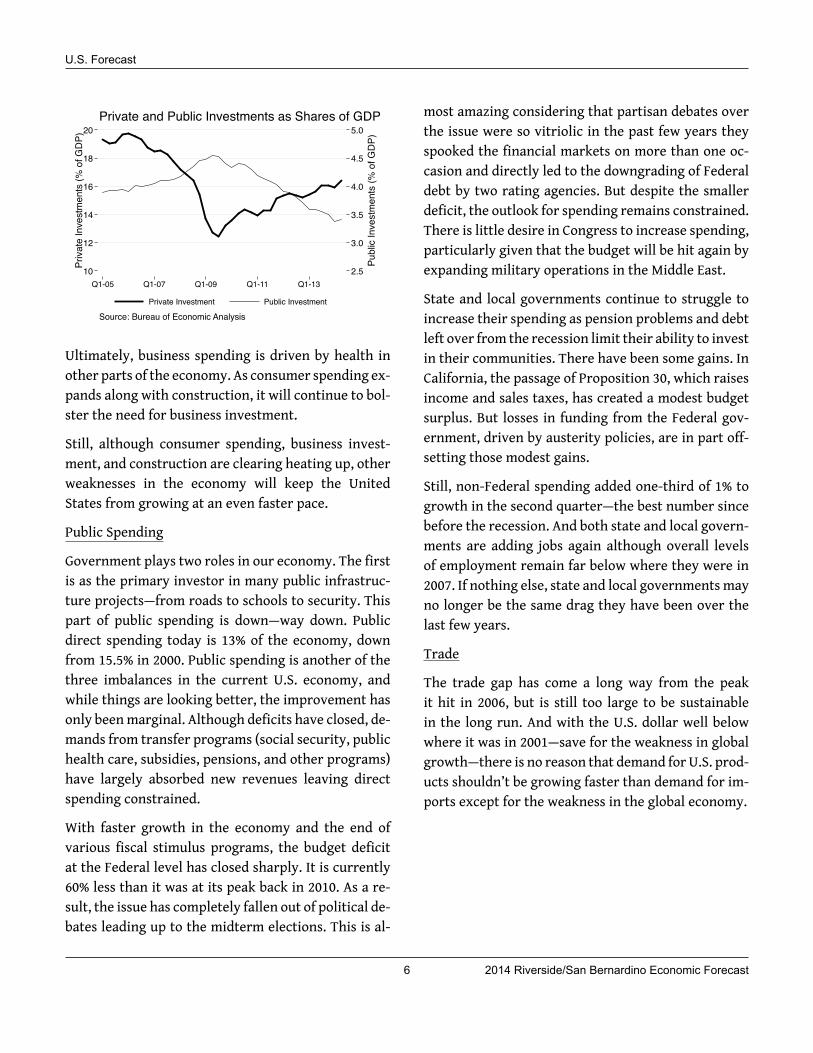
Ultimately, business spending is driven by health inother parts of the economy. As consumer spending ex-pands along with construction, it will continue to bol-ster the need for business investment.
Still, although consumer spending, business invest-ment, and construction are clearing heating up, otherweaknesses in the economy will keep the UnitedStates from growing at an even faster pace.
Public Spending
Government plays two roles in our economy. The firstis as the primary investor in many public infrastruc-ture projects—from roads to schools to security. Thispart of public spending is down—way down. Publicdirect spending today is 13% of the economy, downfrom 15.5% in 2000. Public spending is another of thethree imbalances in the current U.S. economy, andwhile things are looking better, the improvement hasonly beenmarginal. Although deficits have closed, de-mands from transfer programs (social security, publichealth care, subsidies, pensions, and other programs)have largely absorbed new revenues leaving directspending constrained.
With faster growth in the economy and the end ofvarious fiscal stimulus programs, the budget deficitat the Federal level has closed sharply. It is currently60% less than it was at its peak back in 2010. As a re-sult, the issue has completely fallen out of political de-bates leading up to the midterm elections. This is al-
most amazing considering that partisan debates overthe issue were so vitriolic in the past few years theyspooked the financial markets on more than one oc-casion and directly led to the downgrading of Federaldebt by two rating agencies. But despite the smallerdeficit, the outlook for spending remains constrained.There is little desire in Congress to increase spending,particularly given that the budget will be hit again byexpanding military operations in the Middle East.
State and local governments continue to struggle toincrease their spending as pension problems and debtleft over from the recession limit their ability to investin their communities. There have been some gains. InCalifornia, the passage of Proposition 30, which raisesincome and sales taxes, has created a modest budgetsurplus. But losses in funding from the Federal gov-ernment, driven by austerity policies, are in part off-setting those modest gains.
Still, non-Federal spending added one-third of 1% togrowth in the second quarter—the best number sincebefore the recession. And both state and local govern-ments are adding jobs again although overall levelsof employment remain far below where they were in2007. If nothing else, state and local governments mayno longer be the same drag they have been over thelast few years.
Trade
The trade gap has come a long way from the peakit hit in 2006, but is still too large to be sustainablein the long run. And with the U.S. dollar well belowwhere it was in 2001—save for the weakness in globalgrowth—there is no reason that demand for U.S. prod-ucts shouldn’t be growing faster than demand for im-ports except for the weakness in the global economy.
6 2014 Riverside/San Bernardino Economic Forecast
U.S. Forecast
80
90
100
110
120
Inde
x M
ar-7
3 =
100
(NSA
)
Jan-02 Jan-04 Jan-06 Jan-08 Jan-10 Jan-12 Jan-14Source: Federal Reserve
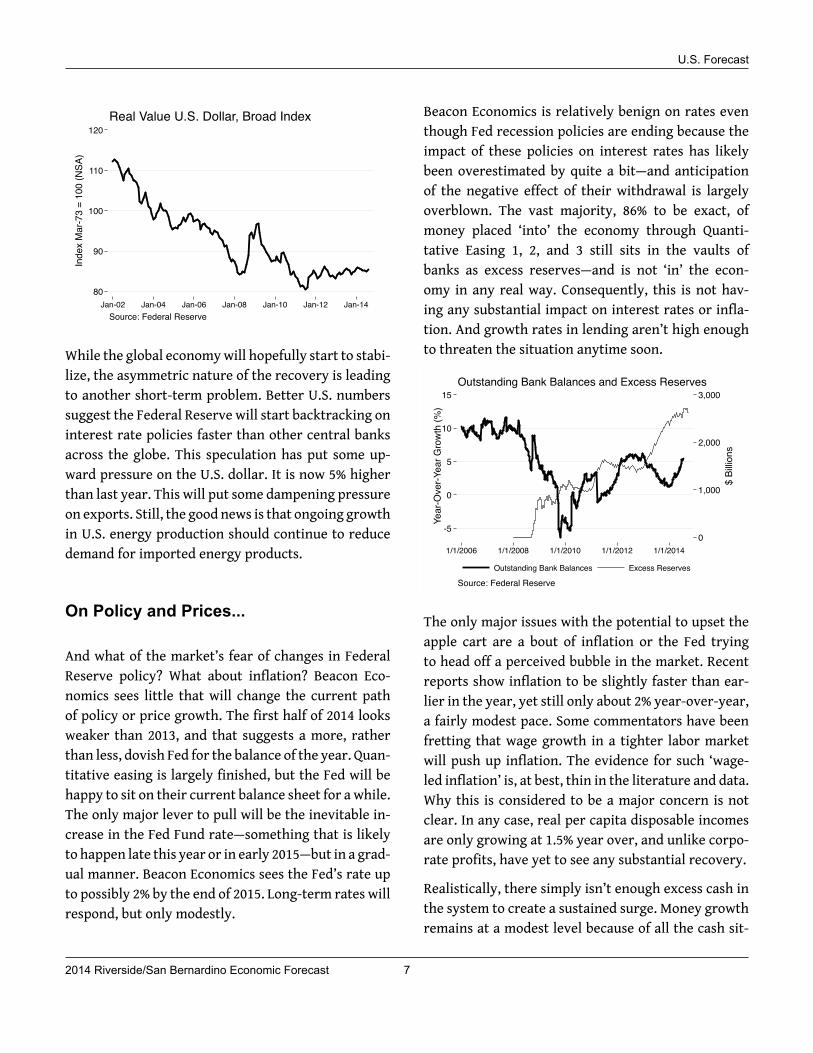
Real Value U.S. Dollar, Broad Index
While the global economywill hopefully start to stabi-lize, the asymmetric nature of the recovery is leadingto another short-term problem. Better U.S. numberssuggest the Federal Reserve will start backtracking oninterest rate policies faster than other central banksacross the globe. This speculation has put some up-ward pressure on the U.S. dollar. It is now 5% higherthan last year. This will put some dampening pressureon exports. Still, the good news is that ongoing growthin U.S. energy production should continue to reducedemand for imported energy products.
On Policy and Prices...
And what of the market’s fear of changes in FederalReserve policy? What about inflation? Beacon Eco-nomics sees little that will change the current pathof policy or price growth. The first half of 2014 looksweaker than 2013, and that suggests a more, ratherthan less, dovish Fed for the balance of the year. Quan-titative easing is largely finished, but the Fed will behappy to sit on their current balance sheet for a while.The only major lever to pull will be the inevitable in-crease in the Fed Fund rate—something that is likelyto happen late this year or in early 2015—but in a grad-ual manner. Beacon Economics sees the Fed’s rate upto possibly 2% by the end of 2015. Long-term rates willrespond, but only modestly.
Beacon Economics is relatively benign on rates eventhough Fed recession policies are ending because theimpact of these policies on interest rates has likelybeen overestimated by quite a bit—and anticipationof the negative effect of their withdrawal is largelyoverblown. The vast majority, 86% to be exact, ofmoney placed ‘into’ the economy through Quanti-tative Easing 1, 2, and 3 still sits in the vaults ofbanks as excess reserves—and is not ‘in’ the econ-omy in any real way. Consequently, this is not hav-ing any substantial impact on interest rates or infla-tion. And growth rates in lending aren’t high enoughto threaten the situation anytime soon.
0
1,000
2,000
3,000
$ Bi
llions
-5
0
5
10
15
Year
-Ove
r-Yea
r Gro
wth
(%)
1/1/2006 1/1/2008 1/1/2010 1/1/2012 1/1/2014
Outstanding Bank Balances Excess Reserves
Source: Federal Reserve
Outstanding Bank Balances and Excess Reserves
The only major issues with the potential to upset theapple cart are a bout of inflation or the Fed tryingto head off a perceived bubble in the market. Recentreports show inflation to be slightly faster than ear-lier in the year, yet still only about 2% year-over-year,a fairly modest pace. Some commentators have beenfretting that wage growth in a tighter labor marketwill push up inflation. The evidence for such ‘wage-led inflation’ is, at best, thin in the literature and data.Why this is considered to be a major concern is notclear. In any case, real per capita disposable incomesare only growing at 1.5% year over, and unlike corpo-rate profits, have yet to see any substantial recovery.
Realistically, there simply isn’t enough excess cash inthe system to create a sustained surge. Money growthremains at a modest level because of all the cash sit-
2014 Riverside/San Bernardino Economic Forecast 7

U.S. Forecast
ting in excess reserves. And the Federal Reserve cansee the situation forming long before it becomes aproblem. Beacon Economics doesn’t see inflation as aproblem.
-4
0
4
8
12
Year
-Ove
r-Yea
r Gro
wth
(%, S
moo
thed
)
Q1-80 Q1-85 Q1-90 Q1-95 Q1-00 Q1-05 Q1-10Source: Federal Reserve
Money Supply (M2)
The only real fear is that the Federal Reserve startpushing rates up sharply in response to a perceivedfinancial bubble—the way it did between 2004 and2006—with little impact on the bubble it should benoted. Beacon Economics doesn’t believe the marketsare too high at this point, so it is too early tomake sucha forecast. But, one bit of irony is that Wall Street’sown irrational fear of the Federal Reserve may well bethe thing that prevents the Fed from having to act.
8 2014 Riverside/San Bernardino Economic Forecast
California Forecastby Jordan G. Levine
ContentsCalifornia Overview 10What’s Right Cyclically? 10What’s Wrong Cyclically? 13What’s Right Structurally? 14What’s Wrong Structurally? 15The Forecast 16

California Forecast
California Overview
With the Great Recession firmly in the rear-view mir-ror, and California’s economy well into its recovery,it’s a good time to assess both what is working in thestate, and the greatest challenges that still lay ahead.The following forecast focuses on what’s right in to-day’s California, which areas need improvement, andwhere the state’s economy is headed over the next fiveyears.
What’s Right Cyclically?
Froma cyclical standpoint,many things are goingwellin California’s economy.
Labor Markets: Employment in the state is growingconsistently. In June 2014, California finally surpassedits pre-recession employment peak, recovering all ofthe 1.35 million jobs lost during the downturn andreaching the state’s highest level of nonfarm jobs onrecord. Through August 2014, California added an ad-ditional 75,700 jobs and now has nearly 90,000 morejobs than it did at the height of the previous bubble.
4.55.56.57.58.59.510.511.512.5
Une
mpl
oym
ent R
ate
(%, S
A)
12.012.513.013.514.014.515.015.516.0
Non
farm
Em
p. (M
illion
s, S
A)
Jan-90 Jan-95 Jan-00 Jan-05 Jan-10 Jan-15
Nonfarm Employment Unemployment Rate
Source: California Employment Development Department
Nonfarm Employment Reaches Record HighCalifornia Labor Markets, Jan-90 to Aug-14
Every major metropolitan area in California has ex-perienced a return to job growth, although some re-gions continue to do better than others. Similarly, ev-ery job sector, with the exception of Government and
Finance, has seen an uptick over the past four years,since the recession ended.
Moreover, as of August 2014, California had outpacedjob growth in the nation overall for 30 consecutivemonths. In August, California dipped from the 9thfastest growing state in the nation (June 2014) to the13th fastest. However, the number of jobs created wassecond only to Texas (314,000 vs. 395,000). In fact, oneout of every eight jobs created nationwide over thelast 12 months was created in California.
0.0
1.0
2.0
3.0
4.0
Gro
wth
(% Y
ear-o
ver-Y
ear,
SA)
Jan-1
3
Feb-13
Mar-13Apr-
13
May-13Ju
n-13Ju
l-13
Aug-13
Sep-13Oct-
13
Nov-13
Dec-13Ja
n-14
Feb-14
Mar-14Apr-
14
May-14Ju
n-14Ju
l-14
Aug-14
Source: U.S. Bureau of Labor Statistics
California Outpaces U.S. AverageNonfarm Employment Growth, 2013 to Current
California United States
Broader Economic Conditions: Virtually every keyeconomic indicator in California ismoving in the rightdirection: GDP is expanding in real terms, incomes arerising in the aggregate, consumer and business spend-ing is approaching its fifth year of consecutive growth,and the state’s unemployment rate has fallen from apeak of 12.4%, to 7.4% (August 2014) despite the factthat the labor force has expanded since the end of thedownturn.
California Economic IndicatorsIndicator 2012 2013
Real GSP Growth (%) 2.7 2.0Personal Income Growth (%) 5.0 2.8Taxable Sales Growth (%) 7.3 6.8Unemployment Rate (%) 10.4 8.9Labor Force (Millions) 18.52 18.60Source: Various
10 2014 Riverside/San Bernardino Economic Forecast

California Forecast
Fiscal Situation:California’s budget continues to healwith Governor Jerry Brown earning some nationalpraise for balancing the books.1 Although the budgetsituation is more nuanced than the headlines suggest,revenues have improved tremendously. With the pas-sage of Proposition 30, which raised income and salestaxes, General Fund receipts are up by more than 18%since hitting bottom in 2011-2012 when the previoustemporary sales tax increase expired. And, for the pasttwo years, receipts have actually outstripped expendi-tures, resulting in a $1.9 billion positive balance in thestate’s General Fund as of the end of fiscal year 2013-2014. This improvement is being felt at the local levelas both sales taxes and property taxes rise across Cal-ifornia.
60
70
80
90
100
110
Billio
ns
1998 2000 2002 2004 2006 2008 2010 2012 2014Fiscal Year Ending
Total Receipts Total Expenditures
Source: California State Controller's Office
Receipts Exceed Expenditures AgainCalifornia General Fund
Residential Real Estate: After precipitating many ofthe issues that drove the state and nation into reces-sion in the first place, California’s real estate marketsare also on a robust growth path. The median priceof an existing single-family home has been growingby double-digit percentages all across the state sinceJune 2012. The growth is due in part to limited inven-tory, which the California Association of Realtors esti-mate was at just 4.0 months of supply in August 2014.The numbers of distressed units coming onto themar-ket has also fallen as defaults and foreclosures haveplummeted in the wake of the recovery.
1Thomas Del Beccaro, "Jerry Brown Stands Atop California'sCollapsing House Of Cards", Forbes.com, July 8, 2014.
200
250
300
350
400
450
500
Med
ian
Pric
es ($
000s
, SA)
0
5
10
15
20
Mon
ths
of S
uppl
y (S
A)
Jun-05 Dec-06 Jun-08 Dec-09 Jun-11 Dec-12 Jun-14
Inventory Prices
Source: California Association of Realtors and DataQuick
Prices Rise Amidst Low InventoriesCalifornia Housing Market, 2005 to 2014
Home sales in California have been lackluster andlargely viewed as a disappointment by the marketsand in the media. Sales have indeed been weak on thesurface. However, the reason for the lackluster totalsales figures is due to the reduction in new foreclo-sures across California. When foreclosures are omit-ted from the equation, California home sales havebeen on the uptick in 2014. Although the headline fig-ures have disappointed some, they are the result ofvery positive trends.
40,000
60,000
80,000
100,000
120,000
Sale
s (S
A)
Q1-09 Q1-10 Q1-11 Q1-12 Q1-13 Q1-14
Sales Sales Less Foreclosures
Source: DataQuick
Sales Lag Due to Fewer ForeclosuresCalifornia Home Sales, 2005 to 2014
Residential Permits: New construction activity con-tinues to grow as builders are enticed by rising pricesand limited inventories.Multi-family propertiesmakeup the majority of new residential units being builtin the state, driven by demand, as the renter popula-tion has increased significantly since the foreclosure
2014 Riverside/San Bernardino Economic Forecast 11
California Forecast
crisis. And unlike many other states, the vacancy ratefor both ownership (1.2%) and rental properties (5.2%)is very low, which should continue to drive new con-struction permits for both single- and multi-familyproperties into the future.
California Residential Permitting
Indicator Aug-13 Aug-14 ChangeYTD YTD (%)
CaliforniaMulti-Family 27,179 26,730 -1.7Single-Family 24,867 25,768 3.6
52,046 52,498 0.9
United StatesMulti-Family 219,274 256,523 17.0Single-Family 428,989 426,681 -0.5
Total 648,263 683,204 5.4Source: U.S. Census Bureau
Commercial Real Estate: The commercial side of thereal estate market was much slower out of the 're-covery' gate than were residential properties. How-ever, California’s nonresidential market is experienc-ing progress. Vacancies for office space in particular,while remaining high, have begun to decline. Indus-trial properties in California stand out as the healthi-est part of the commercial market with vacancy ratesnow in the low single-digits in most major metropoli-tan areas.
Nonresidential Permits: Improvements in the com-mercial real estate market have spawned new com-mercial development projects. Through August 2014,nonresidential permit values were up 17.7%, withgains spread between the development of new office,hotel, and retail space, and alterations/additions toexisting structures. The increased activity, coupledwith improving residential market conditions, shouldhelp drive additional job growth in Construction overthe next few years.
California Nonresidential Permitting
Indicator Aug-14 YTD Change($Mill.) (%)
New Commercial 4,632 49.9Office 1,183 48.4Retail 1,835 29.2Hotel 548 204.4
Industrial 522 -16.2Other Nonres. 2,386 -18.4Nonres. Alts./Adds. 7,940 21.9
Total Nonres. 15,479 17.7Source: California Homebuilding Foundation
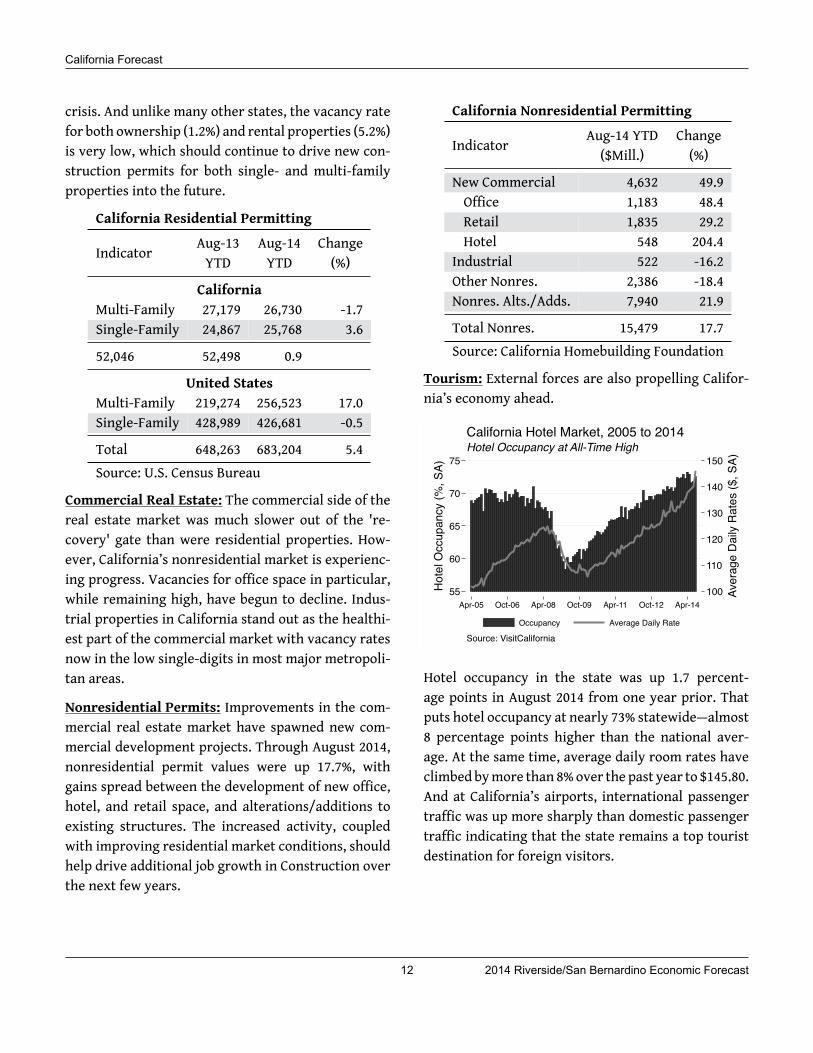
Tourism: External forces are also propelling Califor-nia’s economy ahead.
100
110
120
130
140
150
Aver
age
Daily
Rat
es ($
, SA)
55
60
65
70
75
Hote
l Occ
upan
cy (%
, SA)
Apr-05 Oct-06 Apr-08 Oct-09 Apr-11 Oct-12 Apr-14
Occupancy Average Daily Rate
Source: VisitCalifornia
Hotel Occupancy at All-Time HighCalifornia Hotel Market, 2005 to 2014
Hotel occupancy in the state was up 1.7 percent-age points in August 2014 from one year prior. Thatputs hotel occupancy at nearly 73% statewide—almost8 percentage points higher than the national aver-age. At the same time, average daily room rates haveclimbed bymore than 8%over the past year to $145.80.And at California’s airports, international passengertraffic was up more sharply than domestic passengertraffic indicating that the state remains a top touristdestination for foreign visitors.
12 2014 Riverside/San Bernardino Economic Forecast

California Forecast
What’s Wrong Cyclically?
Although the cyclical effects of the recent recessioncontinue to fade, that progress has not been spreadevenly across the population base. Some Californiansare doing much better in the current economic envi-ronment than others.
Workers Left Behind: California recently returned toits pre-recession peak employment level. However,the sectors that experienced the most growth dur-ing the recovery are not the same sectors that lostthe most jobs during the recession, and many work-ers continue to face difficulty finding work. For exam-ple, the Healthcare, Professional/Scientific/Technicalsector has at least 100,000 more jobs now than at thepeak of the bubble.
California Employment Levels
Industry Jul-07 Aug-14 Diff.Peak (Current) (000s)
Education/Health 1,919.6 2,405.3 485.7Leisure/Hospitality 1,562.6 1,721.7 159.1Prof/Sci/Tech 1,062.9 1,190.6 127.7Admin Support 999.7 1,025.9 26.2Management 207.2 226.0 18.9Other Services 514.2 524.6 10.4NR/Mining 26.7 31.5 4.8Logistics 511.7 512.1 0.4Information 471.4 471.7 0.3
Wholesale Trade 717.3 709.0 -8.3Real Estate 284.2 264.2 -20.0Retail Trade 1,691.6 1,626.9 -64.7Finance/Insurance 614.2 514.3 -99.9Government 2,498.0 2,389.3 -108.7Manufacturing 1,468.8 1,250.6 -218.2Construction 899.4 676.4 -223.0
Total Private 12,951.8 13,150.3 198.5
Total Nonfarm 15,449.8 15,539.6 89.8Source: California EDD
On the other hand, collectively, there are still 500,000fewer jobs in the Retail, Construction, and Manufac-turing sectors. Many former Retail and Constructionworkers are not in a position in terms of skill sets totap into the faster growing and higher wage Profes-sional job sector. As such, at least 25% of the state’sunemployed workers have been unemployed for oversix months—a point at which their skill levels and em-ployability begin to erode.
Rising Inequality: Given the uneven growth acrosshigher and lower wage job sectors, income inequalityin California has increased in the wake of the reces-sion.
0102030405060708090
100
Perc
ent o
f Tot
al In
com
e
0 10 20 30 40 50 60 70 80 90 100Income Percentile
Perfect Equality 20002012
Source: U.S. Census Bureau
Income Distributed More UnevenlyCalifornia Income Inequality
In 2012, the top 20% of income earners in the state ac-counted for 52.6% of all income earned. In 2000, thetop 20% of income earners accounted for just 50.1%of all income earned. Income has become increasinglyconcentrated and inequality has risen over the pastdecade as high-income earners have done better andmiddle-income earners have been more prone to mi-grate out of California in search of more affordablehousing.
Lackluster Wage Growth: Although nominal wageshave been rising over the past 15 years, so too hasthe cost of housing, goods, and services. Adjusting an-nual averagewages into real termswith the ConsumerPrice Index for the western region, and wage growthhas been lackluster at best.
2014 Riverside/San Bernardino Economic Forecast 13

California Forecast
-10
-5
0
5
10
YoY
Gro
wth
(%, S
A)
28,000
29,000
30,000
31,000
32,000
Rea
l Wag
es ($
, SA)
Q1-00 Q1-02 Q1-04 Q1-06 Q1-08 Q1-10 Q1-12 Q1-14
Real Wages GrowthAvg. Growth No Growth
Source: VisitCalifornia
Wage Growth Marginally Positive over Long TermCalifornia Real Wages
In fact, wage growth has only been slightly more pos-itive on a year-over-year basis than it has been nega-tive with growth dropping below zero in 23 of the past56 quarters. On average, real wages in California havegrown by 0.66% since 2000, and at the end of 2013, realwages are almost identical to what they were at theturn of the century, meaning that the quality of lifefor the average Californian has not improved much.
What’s Right Structurally?
In addition to itsmore recent recovery from the reces-sion, California’s many structural assets and advan-tages will also help stimulate economic growth overthe next five years.
Strategic Infrastructure: California is home to in-frastructure that will help generate jobs and eco-nomic activity as the state moves ahead. When com-bined, the Ports of Los Angeles and Long Beach are thesecond largest exporting ports in the nation, behindonly Houston. Add exports from Los Angeles Interna-tional Airport and more goods are shipped throughthe Southern California economy than from any otherport in the nation. While there have been concernsover the competitive threats associated with the ex-pansion of the Panama Canal, those fears are largelyoverblown. Although some firms may find it advan-tageous to circumvent West Coast ports in favor of
ports along the Gulf of Mexico, California will still re-main competitive for time-sensitive deliveries as wellas for the next generation of super-ships that will betoo large for even the widened Panama Canal to ac-commodate.
Educated Workers: California has long been home toa highly educated workforce.
0 10 20 30 40% of Pop. with a Degree or Higher
CaliforniaRhode Island
IllinoisWashington
MinnesotaNew York
New HampshireVirginia
VermontNew Jersey
MarylandConnecticut
ColoradoMassachusetts
Source: U.S. Census Bureau
California Still Relatively EducatedU.S. Educational Attainment, 2012
According to data from the U.S. Census Bureau, over30% of California residents hold at least a bachelor’sdegree. That ranks 15th nationwide, and represents asolid contingent of skilled workers who feed the high-tech industries synonymous with the state. Indeed,California has been ranked amongst the most innova-tive states in the entire union.2
Venture Capital: Perhaps as a result of the skill andeducational levels of California residents, the statecontinues to be a center for technology-based growthand new inventions. Venture capital funding has seenstrong, though bumpy, growth since hitting bottom in2009. Total venture capital funding in California ex-ceeded its pre-recession peak during the first quar-ter of 2014—nearly doubling over the first quarter of2013. Indeed, in 2013 California received more thanhalf of all venture capital investment in several high-tech categories including Semiconductors, Computers
2CNN Money, "10 most inventive states", October 24, 2012,http://money.cnn.com/gallery/smallbusiness/2012/10/24/states-patent-invention/.
14 2014 Riverside/San Bernardino Economic Forecast
California Forecast
and Peripherals, Telecommunications, Media and En-tertainment, Software, and IT Services.3
Venture Capital Investment in 2013
Industry California United CaliforniaStates Share (%)
Semiconductors 395 601 65.7Computers/Periphs. 327 517 63.2Telecomms. 390 644 60.7Media/Entertain. 1,753 2,963 59.2Software 6,206 11,074 56.0IT Services 1,017 1,965 51.8Retailing/Distribution 122 237 51.5Medical Devices/Equip. 980 2,102 46.6Healthcare Services 81 193 41.9Bus. Products/Svcs. 91 218 41.8Biotechnology 1,919 4,655 41.2Industrial Energy 601 1,491 40.3Consumer Prods./Svcs. 423 1,259 33.6Networking/Equipment 212 672 31.6Electronics Instrs. 95 326 29.1Financial Services 160 566 28.2Other 23 98 24.0
Total 14,793 29,580 50.0Source: PWC MoneyTree
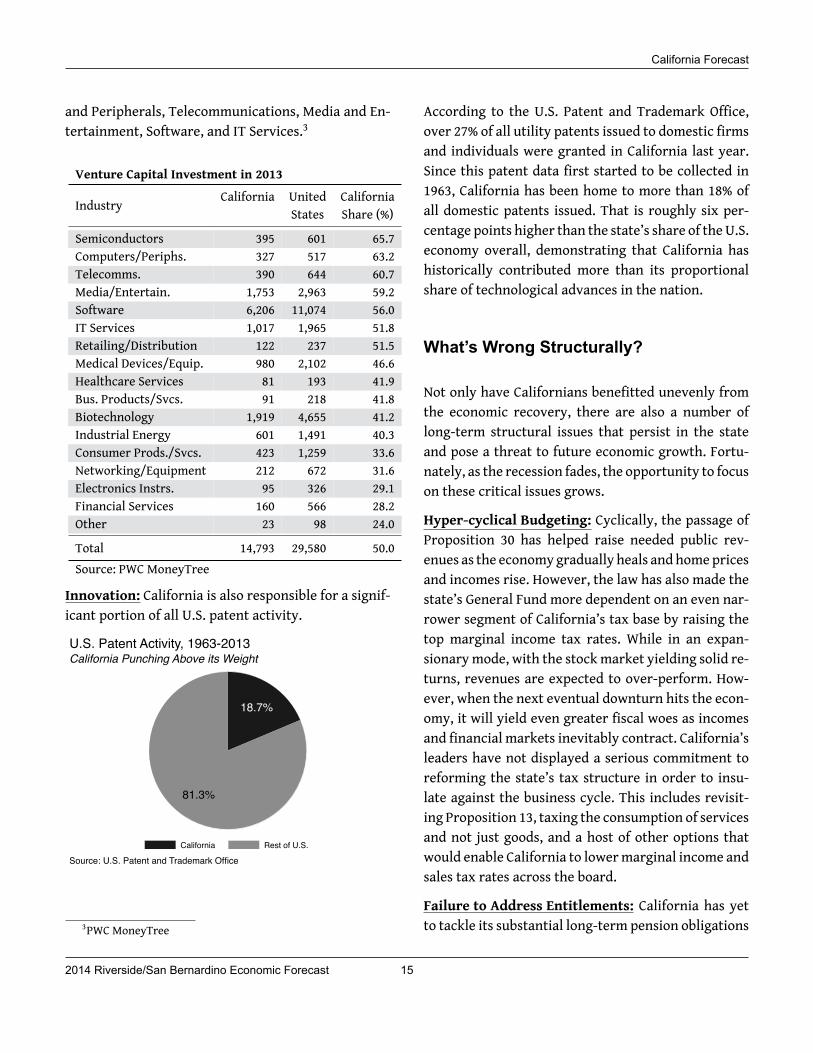
Innovation: California is also responsible for a signif-icant portion of all U.S. patent activity.
18.7%
81.3%
California Rest of U.S.
Source: U.S. Patent and Trademark Office
California Punching Above its WeightU.S. Patent Activity, 1963-2013
3PWC MoneyTree
According to the U.S. Patent and Trademark Office,over 27% of all utility patents issued to domestic firmsand individuals were granted in California last year.Since this patent data first started to be collected in1963, California has been home to more than 18% ofall domestic patents issued. That is roughly six per-centage points higher than the state’s share of the U.S.economy overall, demonstrating that California hashistorically contributed more than its proportionalshare of technological advances in the nation.
What’s Wrong Structurally?
Not only have Californians benefitted unevenly fromthe economic recovery, there are also a number oflong-term structural issues that persist in the stateand pose a threat to future economic growth. Fortu-nately, as the recession fades, the opportunity to focuson these critical issues grows.
Hyper-cyclical Budgeting: Cyclically, the passage ofProposition 30 has helped raise needed public rev-enues as the economygradually heals andhomepricesand incomes rise. However, the law has also made thestate’s General Fund more dependent on an even nar-rower segment of California’s tax base by raising thetop marginal income tax rates. While in an expan-sionarymode, with the stockmarket yielding solid re-turns, revenues are expected to over-perform. How-ever, when the next eventual downturn hits the econ-omy, it will yield even greater fiscal woes as incomesand financial markets inevitably contract. California’sleaders have not displayed a serious commitment toreforming the state’s tax structure in order to insu-late against the business cycle. This includes revisit-ing Proposition 13, taxing the consumption of servicesand not just goods, and a host of other options thatwould enable California to lowermarginal income andsales tax rates across the board.
Failure to Address Entitlements: California has yetto tackle its substantial long-term pension obligations
2014 Riverside/San Bernardino Economic Forecast 15

California Forecast
at the state and local level. Together, CalPERS andCalSTRS represent nearly $140 billion in unfunded li-abilities—even after accounting for the recent stockmarket surge—and are still 24% and 33% unfunded,respectively. Some form of compromise between re-tirees and state and local governments is badly neededas these unfunded obligations represent more thanone full year of General Fund receipts.
CEQA and Housing Costs: One of California’s biggestchallenges is the state’s high cost of housing. Theabuse of the well-intentioned California Environmen-tal Quality Act (CEQA) plays a large role in drivingup building costs by limiting and delaying construc-tion projects. And with the recent surge in the real es-tate market, California has grown even more expen-sive relative to other states. California’s most inex-pensive metro areas are on par with the most expen-sive metro areas in places like Texas, while Califor-nia’s most expensive markets are quickly approach-ing median prices of $1 million. That is well beyondthe reach of the average Californian, and as a result,the state has experienced more out-migration amonglower- and mid-income workers than among high-income workers. This worrisome trend deprives busi-nesses of a strong mid-skilled workforce and makes itdifficult to recruit talent because businesses can’t af-ford to pay wages that would offer a desired quality oflife (such as the ability to buy a home). Containing theexcessive cost of housing should be a top policy goal,and reforming CEQA should be at the heart of that pro-cess.
Education Gap Closing: California has historicallybeen a “barbell” statewithmany high- and low-skilledworkers, and a shrinking population of mid-skilledworkers. It has always, however, had a strong con-tingent of residents on the highly educated end ofthe scale. And while California remains a state witha relatively educated population base, over the pastdecade or so, that education gap has slowly been clos-ing as other states raise their levels of educational at-tainment more and faster. Striving to build and re-
tain the most skilled workforce is critical to Califor-nia maintaining its advantage in the high-tech sectorsthat drive so much of the state’s economic growth.
Educational Attainment LevelsPopulation with a Bachelor's or HigherLocation 2000 2012 Diff. (%)
California 26.6 30.9 4.3Rest of US 24.1 28.9 4.8
Education Gap (%) 2.5 2.0 -0.5Source: U.S. Census Bureau
Effects of Technological Change: Gauging and re-sponding to technological change will remain a long-term challenge for California and for all states. Com-mercial real estate provides a strong example. Withthe ubiquitous nature of the Internet, wireless tech-nology, laptops, smartphones, and tablets in today’sworld, traditional relationships between employmentand commercial absorption are breaking down asmore workers telecommute, work remotely, or workon-site for their clients. As such, the job growth thatused to propel new commercial construction activi-ties, is expected to have a smaller and smaller effecton commercial markets in California in the future.
The Forecast
Beacon Economics is forecasting ongoing improve-ment in California’s economy through the life of theforecast in 2019.
Employment growth will settle in at 2.5% by 2016and the unemployment rate is expected to dip be-low 6% by mid-2017.
Home prices will continue to grow over the nexttwo years, although growth will cool to a 4% to 6%pace that is more consistent with income growth.
16 2014 Riverside/San Bernardino Economic Forecast
California Forecast
As home equity rises and bank lending increases,home sales are also expected to turn around in2015, rising by double-digit percentages next year.
As the economy continues to heal, new construc-tion activity will be stimulated in the residen-tial market (190,000 new units forecast over thenext two years) and the nonresidential market (4%growth forecast this year).
Consumer spending is also forecasted to continueits upward trajectory, growing by roughly 4% overthe next two years.
Cyclically, things are improving. Whether focusingon employment, incomes, GDP, home prices, buildingpermits, or taxable sales (among many other indica-tors), California’s economy is in growth mode. In fact,despite the state’s many challenges, California contin-ues to lead the nation in many key ways.
California also faces critical challenges including edu-cation, infrastructure, housing costs, and the need toinvigoratemanufacturing. Tackled appropriately, Cal-ifornia could climb even higher in the state rankingsand become an even greater economic success.
2014 Riverside/San Bernardino Economic Forecast 17

California ForecastStateHistorical
Table
California
Q1-2012
Q2-2012
Q3-2012
Q4-2012
Q1-2013
Q2-2013
Q3-2013
Q4-2013
Q1-2014
Q2-2014
TotalN
onfarm
Empl.(Mill,SA)
14.56
14.64
14.73
14.90
15.01
15.10
15.21
15.29
15.34
15.45
Grow
th(%
,SAAR
)3.35
2.10
2.55
4.77
2.94
2.53
2.85
2.21
1.19
2.89
Unem
ploy
men
tRate(
%,SA
)10.83
10.67
10.37
9.83
9.37
9.03
8.90
8.43
8.10
7.60
Person
alIncome(
$Bill)
1,760.98
1,780.94
1,795.42
1,883.43
1,816.45
1,848.27
1,871.83
1,889.91
1,909.09
1,937.41
Grow
th(%
,SAAR
)15.68
4.61
3.29
21.10
-13.49
7.19
5.20
3.92
4.12
6.07
TaxableS
ales
($Bill,
SA)
136.50
137.55
139.69
143.93
147.04
149.36
148.88
151.51
152.31
155.27
Grow
th(%
,SAAR
)9.02
3.09
6.39
12.70
8.93
6.46
-1.29
7.27
2.14
7.99
Sing
le-Fam
ilyHo
meP
rices
($000s,SA)
251.18
263.10
274.87
296.50
308.59
336.76
350.23
361.20
368.06
373.57
Grow
th(%
,SAAR
)18.42
20.38
19.13
35.40
17.34
41.82
16.99
13.13
7.81
6.13
Sing
le-Fam
ilyHo
meS
ales
(000s,SA
)87.79
86.64
85.43
89.89
86.75
86.96
87.45
79.04
73.58
78.65
Grow
th(%
,SAAR
)32.62
-5.15
-5.43
22.55
-13.25
0.95
2.27
-33.26
-24.91
30.60
Sing
le-Fam
ilyPe
rmits
(000s,SA
)6.21
6.76
7.26
7.76
8.28
8.68
8.98
9.15
9.12
9.24
Grow
th(%
,SAAR
)25.61
39.69
33.12
30.65
29.77
20.94
14.23
8.19
-1.51
5.43
Multi-Family
Perm
its(000s,SA
)7.48
8.30
8.98
9.40
10.14
10.46
11.00
11.48
11.32
11.31
Grow
th(%
,SAAR
)24.63
51.83
37.03
20.06
35.51
13.15
22.36
18.67
-5.59
-0.05
Nonresiden
tialP
ermits
($Bill,
SA)
3.42
3.77
3.89
4.10
4.48
4.73
5.10
5.32
5.25
5.51
Grow
th(%
,SAAR
)14.51
47.66
13.32
22.96
42.48
24.33
35.63
18.38
-5.08
20.78
Popu
latio
n(M
ill)
37.79
37.87
37.95
38.04
38.12
38.20
38.29
38.38
38.47
38.56
Grow
th(%
,SAAR
)0.82
0.84
0.86
0.87
0.89
0.90
0.91
0.92
0.94
0.96
NetM
igratio
n(000s)
11.07
13.14
14.86
16.24
17.26
17.93
19.14
19.79
21.42
22.76
NaturalInc
rease(
000s)
65.72
65.70
65.84
66.15
66.62
67.26
67.72
68.28
68.82
69.58
StateForecastTa
ble
California
Q3-2014
Q4-2014
Q1-2015
Q2-2015
Q3-2015
Q4-2015
Q1-2016
Q2-2016
Q3-2016
Q4-2016
TotalN
onfarm
Empl.(Mill,SA)
15.52
15.60
15.70
15.79
15.88
15.98
16.08
16.18
16.28
16.39
Grow
th(%
,SAAR
)1.83
2.24
2.37
2.42
2.44
2.45
2.51
2.52
2.53
2.56
Unem
ploy
men
tRate(
%,SA
)7.40
7.26
7.10
6.96
6.82
6.69
6.55
6.42
6.30
6.18
Person
alIncome(
$Bill)
1,947.71
1,973.43
1,997.80
2,021.99
2,047.54
2,070.85
2,098.08
2,124.32
2,152.03
2,180.80
Grow
th(%
,SAAR
)2.14
5.39
5.03
4.93
5.15
4.63
5.36
5.10
5.32
5.46
TaxableS
ales
($Bill,
SA)
156.99
157.14
158.70
160.74
162.09
163.12
165.62
168.06
170.14
172.59
Grow
th(%
,SAAR
)4.51
0.39
4.04
5.23
3.41
2.57
6.28
6.01
5.04
5.89
Sing
le-Fam
ilyHo
meP
rices
($000s,SA)
378.31
383.44
388.75
394.15
399.67
405.08
410.62
416.17
421.77
427.46
Grow
th(%
,SAAR
)5.17
5.53
5.66
5.67
5.72
5.52
5.59
5.51
5.50
5.51
Sing
le-Fam
ilyHo
meS
ales
(000s,SA
)82.35
85.08
87.11
88.84
90.41
91.82
93.10
94.23
95.25
96.19
Grow
th(%
,SAAR
)20.19
13.93
9.87
8.19
7.27
6.37
5.69
4.95
4.42
4.00
Sing
le-Fam
ilyPe
rmits
(000s,SA
)9.86
10.55
11.24
12.17
13.15
14.14
15.14
16.11
17.08
18.01
Grow
th(%
,SAAR
)29.64
31.02
28.62
37.49
36.32
34.00
31.40
27.99
26.36
23.80
Multi-Family
Perm
its(000s,SA
)11.48
11.85
12.50
13.44
14.61
15.93
17.34
18.72
20.00
21.16
Grow
th(%
,SAAR
)6.05
13.62
23.50
33.81
39.74
41.37
40.11
35.87
30.47
25.13
Nonresiden
tialP
ermits
($Bill,
SA)
5.66
5.77
5.91
6.03
6.16
6.29
6.40
6.52
6.64
6.75
Grow
th(%
,SAAR
)11.28
8.17
9.83
8.82
8.60
8.46
7.76
7.50
7.26
6.93
Popu
latio
n(M
ill)
38.66
38.75
38.85
38.95
39.05
39.15
39.26
39.36
39.46
39.57
Grow
th(%
,SAAR
)0.99
1.00
1.02
1.03
1.04
1.04
1.05
1.06
1.06
1.06
NetM
igratio
n(000s)
24.76
25.95
26.92
27.61
28.13
28.49
28.73
28.91
29.02
29.06
NaturalInc
rease(
000s)
70.29
70.73
71.27
71.69
72.31
72.96
73.60
74.23
74.85
75.45
Forecastsb
yBe
acon
Econ
omics
18 2014 Riverside/San Bernardino Economic Forecast
Inland Empire Forecast
by Rafael De Anda
ContentsKey Chapter Findings 20The Third Recovery in 25 Years 20Population 22Employment 23Business Activity 24Real Estate 25
Inland Empire Forecast
Key Chapter Findings
In comparison with the last economic recovery, from 2001 to 2005, the current economic recovery haslacked support from the Construction and Retail Trade industries. However, both industries are startingto heat up, a good omen for the economy at large.
Population growth, one of the underlying components of long-term economic growth, is projected tobounce back over the next five years.
Employment growthwas strong in 2013, and 2014 is shaping up to be a good year as well. Yet a fair numberof skilled and educated workers are still looking for work.
Auto sales and tourism are supporting local economic growth.
Although home prices have improved, there is plenty of room for growth.
The Third Recovery in 25 Years
With the economy experiencing its third recovery in25 years, many Inland Empire businesses and resi-dents are starting to feel at ease as the aftereffectsof the dreadful Great Recession fade. As has beenwell documented, the economic recovery has beenpainfully slow by historical standards and more slug-gish than the upturns in neighboring coastal commu-nities. However, other inland regions throughout thestate were equally bullied by the downturn and haverecovered at a similarly slow pace—with the excep-tion of the energy-rich Bakersfield metropolitan area,which has seen robust economic growth.
There are key differences between the Inland Empire’scurrent economic recovery and the recovery in theearly 2000s. First, in this recovery, the Governmentsector has not contributed to economic growth, owingto forces outside local leaders’ control. The Govern-ment sector’s contribution to growth in economic out-put, as measured by the region’s gross metropolitanproduct (GMP), was 2.4 percentage points of the total24.9% GMP growth from 2001 to 2005. In comparison,the Government contribution to economic growth ineconomic output from 2009 to 2013 was a negative 0.7percentage points. In dollar value, that equates to a
$3.6 billion difference, which is augmented by the in-direct and induced impacts that affect other indus-tries to a varying degree.
Through 2013, the current economic recovery alsolacked a lift from the Construction industry, a strongcontributor to the recovery in 2001 to 2005. BeaconEconomics has long held the position that housingthroughout the state is undersupplied, yet with homeprices slashed in half over the course of two years andwith commercial vacancy rates shooting upward inthe aftermath of the recession,many investors and de-velopers were discouraged from building newhousingand commercial structures. The Construction indus-try contributed 0.1 percentage points to GMP growthfrom 2009 to 2013. In comparison, Construction added3.9 percentage points to GMP growth from 2001 to2005. Yet with investment now starting to pick up,particularly for massive warehouses and large-scaleresidential developments, we expect Construction tobe one of the largest contributors to economic growthmoving forward.
The current economic recovery has also lacked a sig-nificant contribution from the Retail Trade industry.From 2009 to 2013, Retail Trade accounted for 0.4 per-centage points of GMP growth, compared with the 3.5percentage point contribution to GMP growth from
20 2014 Riverside/San Bernardino Economic Forecast
Inland Empire Forecast
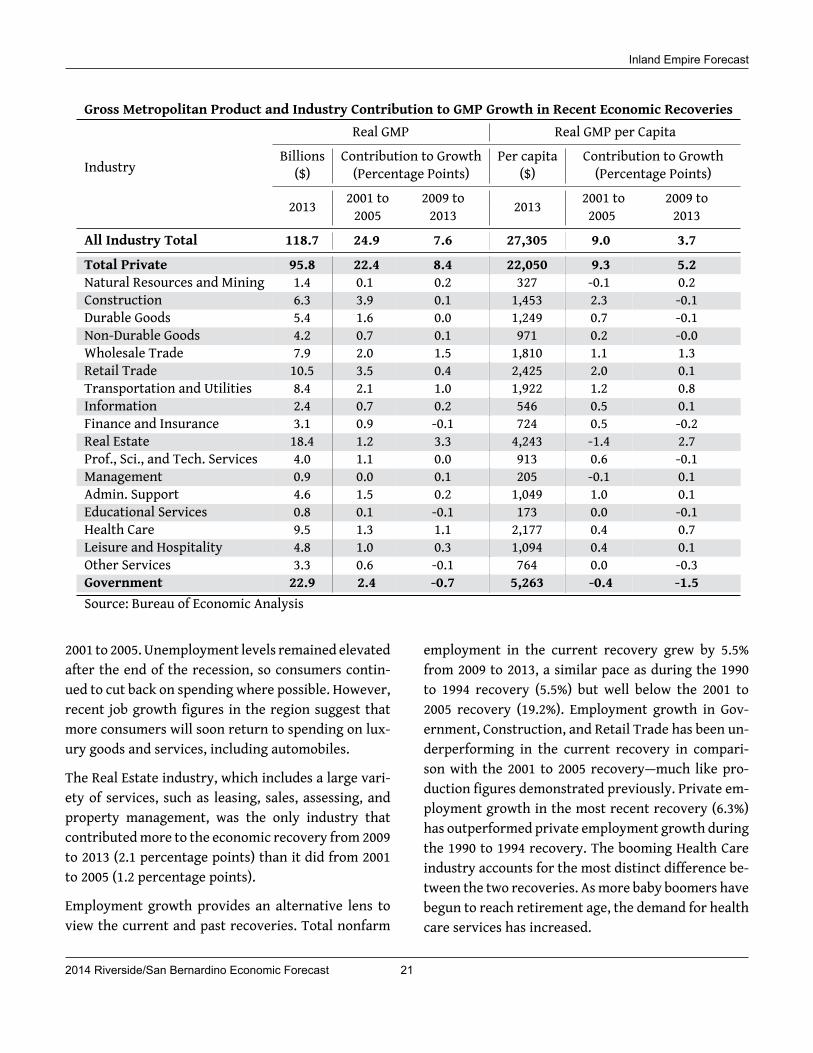
Gross Metropolitan Product and Industry Contribution to GMP Growth in Recent Economic Recoveries
Industry
Real GMP Real GMP per CapitaBillions Contribution to Growth Per capita Contribution to Growth
($) (Percentage Points) ($) (Percentage Points)
2013 2001 to 2009 to 2013 2001 to 2009 to2005 2013 2005 2013
All Industry Total 118.7 24.9 7.6 27,305 9.0 3.7Total Private 95.8 22.4 8.4 22,050 9.3 5.2Natural Resources and Mining 1.4 0.1 0.2 327 -0.1 0.2Construction 6.3 3.9 0.1 1,453 2.3 -0.1Durable Goods 5.4 1.6 0.0 1,249 0.7 -0.1Non-Durable Goods 4.2 0.7 0.1 971 0.2 -0.0Wholesale Trade 7.9 2.0 1.5 1,810 1.1 1.3Retail Trade 10.5 3.5 0.4 2,425 2.0 0.1Transportation and Utilities 8.4 2.1 1.0 1,922 1.2 0.8Information 2.4 0.7 0.2 546 0.5 0.1Finance and Insurance 3.1 0.9 -0.1 724 0.5 -0.2Real Estate 18.4 1.2 3.3 4,243 -1.4 2.7Prof., Sci., and Tech. Services 4.0 1.1 0.0 913 0.6 -0.1Management 0.9 0.0 0.1 205 -0.1 0.1Admin. Support 4.6 1.5 0.2 1,049 1.0 0.1Educational Services 0.8 0.1 -0.1 173 0.0 -0.1Health Care 9.5 1.3 1.1 2,177 0.4 0.7Leisure and Hospitality 4.8 1.0 0.3 1,094 0.4 0.1Other Services 3.3 0.6 -0.1 764 0.0 -0.3Government 22.9 2.4 -0.7 5,263 -0.4 -1.5Source: Bureau of Economic Analysis
2001 to 2005. Unemployment levels remained elevatedafter the end of the recession, so consumers contin-ued to cut back on spending where possible. However,recent job growth figures in the region suggest thatmore consumers will soon return to spending on lux-ury goods and services, including automobiles.
The Real Estate industry, which includes a large vari-ety of services, such as leasing, sales, assessing, andproperty management, was the only industry thatcontributedmore to the economic recovery from 2009to 2013 (2.1 percentage points) than it did from 2001to 2005 (1.2 percentage points).
Employment growth provides an alternative lens toview the current and past recoveries. Total nonfarm
employment in the current recovery grew by 5.5%from 2009 to 2013, a similar pace as during the 1990to 1994 recovery (5.5%) but well below the 2001 to2005 recovery (19.2%). Employment growth in Gov-ernment, Construction, and Retail Trade has been un-derperforming in the current recovery in compari-son with the 2001 to 2005 recovery—much like pro-duction figures demonstrated previously. Private em-ployment growth in the most recent recovery (6.3%)has outperformed private employment growth duringthe 1990 to 1994 recovery. The booming Health Careindustry accounts for the most distinct difference be-tween the two recoveries. Asmore baby boomers havebegun to reach retirement age, the demand for healthcare services has increased.
2014 Riverside/San Bernardino Economic Forecast 21
Inland Empire Forecast
The economy is poised to accelerate in the com-ing years. The industries that provided the largestcontributions to the economic recovery in 2001 to2005—Construction and Retail Trade—have picked upthe pace of hiring through 2014. The recovery willalso be supported by logistics firms that are appear-ing throughout the region and by health care facilitiesthat are expanding.
Employment and Industry Employment Growth inRecent Economic Recoveries
Industry
Emp. Contribution to Growth(000s) (Percentage Points)
2013 1990 to 2001 to 2009 to1994 2005 2013
Total Nonfarm 1,226 5.5 19.2 5.5
Total Private 1,001 4.5 17.2 6.3NR/Mining 1 0.0 0.0 0.0Construction 69 -2.5 3.3 0.1Non-Durable Goods 30 0.4 0.0 -0.1Durable Goods 57 0.5 0.2 -0.1Wholesale Trade 56 0.3 0.8 0.6Retail Trade 165 0.8 3.1 0.7Transport 79 1.2 1.5 1.0Information 11 -0.1 0.0 -0.2Financial Activities 42 0.2 1.1 0.0Prof., Sci., and Tech. Svc. 38 -0.6 1.0 0.0Management 9 0.2 0.1 0.0Admin Support 86 1.2 1.9 0.6Health Care 165 1.9 1.8 2.3Leisure and Hospitality 136 0.7 1.7 1.1Other Services 41 0.4 0.3 0.3Government 225 1.1 1.9 -0.9Source: California Employment Development Dept.
Population
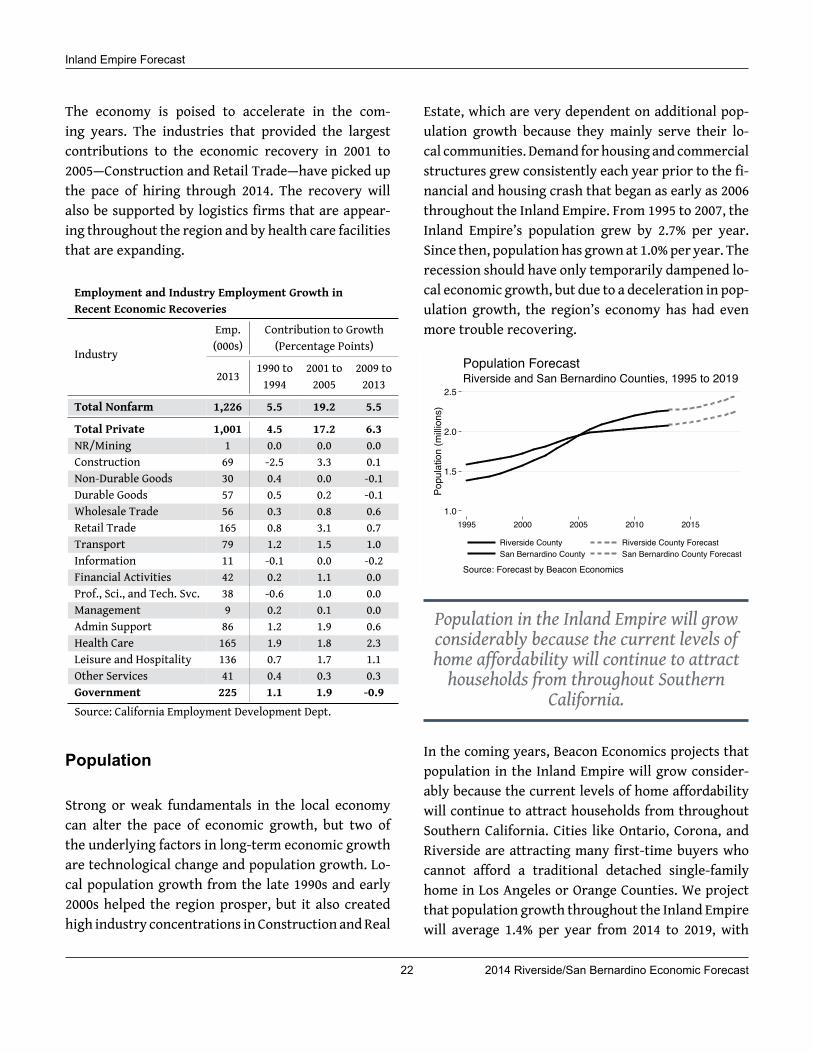
Strong or weak fundamentals in the local economycan alter the pace of economic growth, but two ofthe underlying factors in long-term economic growthare technological change and population growth. Lo-cal population growth from the late 1990s and early2000s helped the region prosper, but it also createdhigh industry concentrations in Construction andReal
Estate, which are very dependent on additional pop-ulation growth because they mainly serve their lo-cal communities. Demand for housing and commercialstructures grew consistently each year prior to the fi-nancial and housing crash that began as early as 2006throughout the Inland Empire. From 1995 to 2007, theInland Empire’s population grew by 2.7% per year.Since then, population has grown at 1.0%per year. Therecession should have only temporarily dampened lo-cal economic growth, but due to a deceleration in pop-ulation growth, the region’s economy has had evenmore trouble recovering.
1.0
1.5
2.0
2.5
Popu
latio
n (m
illion
s)
1995 2000 2005 2010 2015
Riverside County Riverside County ForecastSan Bernardino County San Bernardino County Forecast
Source: Forecast by Beacon Economics
Riverside and San Bernardino Counties, 1995 to 2019Population Forecast
Population in the Inland Empire will growconsiderably because the current levels ofhome affordability will continue to attracthouseholds from throughout Southern
California.
In the coming years, Beacon Economics projects thatpopulation in the Inland Empire will grow consider-ably because the current levels of home affordabilitywill continue to attract households from throughoutSouthern California. Cities like Ontario, Corona, andRiverside are attracting many first-time buyers whocannot afford a traditional detached single-familyhome in Los Angeles or Orange Counties. We projectthat population growth throughout the Inland Empirewill average 1.4% per year from 2014 to 2019, with
22 2014 Riverside/San Bernardino Economic Forecast

Inland Empire Forecast
a strong return in domestic migration to the region.Furthermore, we project that both Riverside Countyand San Bernardino County will grow equally, eventhough recent population growth has favored River-side County (1.1% in 2014) more than San BernardinoCounty (0.8% in 2014).
As a result, a strong return in population growth willlead to output growth that more closely resemblespre-recession levels.
-7.5
-5.0
-2.5
0.0
2.5
5.0
7.5
Annu
al G
rowt
h (%
)
2002
2003
2004
2005
2006
2007
2008
2009
2010
2011
2012
2013
Source: Bureau of Economic Analysis
California and Inland Empire, 2002 to 2013Annual Economic Output Growth
California GSP Inland Empire GMP
Employment
Our headline from a year ago noted that employ-ment was “slowly” moving forward. As we ex-pected, the California Employment Development De-partment produced revised employment numbersthat showed even better job growth than previouslyreported—upwards of 4% from August 2012 to Au-gust 2013. Employment growth in the Inland Empirethrough 2014 has continued to flourish, helping bringdown the region’s unemployment rate from 10.0% inAugust 2013 to 8.7% in August 2014.
Over the next five years, Beacon Economics projectsemployment growth to continue to remain elevated.One reason our projection remains optimistic is thatthere are plenty of unemployed workers available tobusinesses that are now looking to expand. The un-
employment rates in the Cities of San Bernardino andMoreno Valley were estimated at 16.6% and 13.9%, re-spectively, in 2013. And many of these workers arewell qualified and well educated. In the City of SanBernardino, 3,370 unemployed workers (35%) look-ing for work had attended college or received an as-sociate’s degree or higher, while 2,760 unemployedworkers (30%) in the City of Moreno Valley had thesame qualifications.
The Logistics industry is particularly likely to expand.Widespread developments of warehouses and distri-bution centers have been appearing over the last fewyears, and more are coming online over the course ofthe next year. Jobs at logistics centers require skillsand training, and thus pay livable wages. In 2013, theaverage wage at Transportation and Warehousing es-tablishments was 9.7% higher than in all private in-dustries ($41,340 per year).
0
5
10
15
Une
mpl
oym
ent R
ate
(%, S
A)
600
900
1,200
1,500
Non
farm
Em
ploy
men
t (00
0s, S
A)
Q1-01 Q1-04 Q1-07 Q1-10 Q1-13 Q1-16 Q1-19
Nonfarm Employment Nonfarm Employment ForecastUnemployment Rate Unemployment Rate Forecast
Source: Forecast by Beacon Economics
Inland Empire, Q1-01 to Q4-19Employment and Unemployment Rate Forecast
Jobs in the Health Care industry are also projected tocontinue to grow over the next five years, though notall of these jobs require advanced degrees. For exam-ple, 15.3% of jobs in the Health Care industry are inoffice and administrative support occupations, 3.5% ofjobs are in management occupations, 3.0% of jobs arein food preparation or serving-related jobs, and 2.5%of jobs are in building and grounds cleaning andmain-tenance occupations, according to national statisticspublished by the U.S. Bureau of Labor Statistics.
2014 Riverside/San Bernardino Economic Forecast 23

Inland Empire Forecast
Beacon Economics projects that totalnonfarm employment will grow by 3.2% from
the second quarter of 2014 to the secondquarter of 2015.
With major contributions from these key industries,Beacon Economics projects that total nonfarm em-ployment will grow by 3.2% from the second quarterof 2014 to the second quarter of 2015. In the followingyears, we expect that employment growth will followat about the same clip butmore likely average 3.4% an-nual growth through 2019. By these projections, non-farm employment will surpass the 1.5 millionmark bythe end of 2019, adding more than 250,000 jobs overthe course of five years.
Business Activity
Many businesses in the Inland Empire have been ex-panding their workforce and production levels overthe last few years, helping taxable sales in the two-county region rebound from the recession. Yet com-pared to the 2001 to 2005 recovery, when taxable salesgrew by 39% after inflation adjustments, taxable salesonly grew by 23% from 2009 to 2013.4
Through the second quarter of 2014, taxable salesgrowth appears to be decelerating. During the 2014fiscal year, total taxable sales grew by 5.7%, a slowerpace than in the 2013 fiscal year (8.3%) and the 2012fiscal year (9.8%).5 A large portion of the previousgrowth is in part attributable to major constructionprojects, such as the Genesis Solar Energy Project byNextEra Energy Resources. These types of projectsprovided a boost to the local economy when it neededit most, but they are now near completion.
4Prior to adjustments for inflation, taxable sales from 2001 to2005 grew by 53%, while taxable sales from 2009 to 2013 grew by34%.
5These figures are not adjusted for inflation.
Moving forward, more traditional means of consumeractivity will help the Inland Empire continue to ex-pand its taxable sales base. Auto sales, in particular,have been providing the local economy with an addedlayer of support, as pent-up demand for automobileshas helped tax receipts from autos and transportationgrow by 11.2% in Riverside County and 6.5% in SanBernardino County from the second quarter of 2013to the second quarter of 2014. San Bernardino Countyhas seven new automobile dealers that opened theirdoors between the first quarter of 2013 and the firstquarter of 2014, according to the California Employ-ment Development Department.
Hotel occupancy rates throughout the InlandEmpire picked up by 3.5 percentage points
from the first five months of 2013 to the sameperiod in 2014.
Tourism has also been strong throughout the region,helping bring in money from outside of the area. Andthe number of tourists who stayed in local hotels con-tinued to grow. Hotel occupancy rates throughoutthe Inland Empire picked up by 3.5 percentage pointsfrom the first fivemonths of 2013 to the sameperiod in2014, reaching a healthy 71.2%, according to PKF Con-sulting. Gross receipts from restaurants and hotels,which include local spending as well, grew by 5.5% inRiverside County and 7.2% in San Bernardino Countyfrom the second quarter of 2013 to the second quarterof 2014. In addition, the number of passengers flyingthrough Ontario International Airport finally grew af-ter years of decline.
Overall, economic activity indicators are heading inthe right direction for the Inland Empire, and theeconomy is poised for further growth. Beacon Eco-nomics projects taxable sales in the region to grow by5.1% from the second quarter of 2014 to the secondquarter of 2015. Afterwards, with help from under-lying growth in population counts throughout River-side and San Bernardino Counties, taxable sales are
24 2014 Riverside/San Bernardino Economic Forecast

Inland Empire Forecast
expected to grow from 6.5% to 7.5% annually through2018.
0
5
10
15
20
25
Taxa
ble
Sale
s ($
Milli
ons,
SA)
Q1-01 Q1-04 Q1-07 Q1-10 Q1-13 Q1-16 Q1-19
Actual Forecast
Source: Forecast by Beacon Economics
Inland Empire, Q1-01 to Q4-19Taxable Sales Forecast
Real Estate
Home appreciation through the first half of 2014 con-tinued to grow at a double-digit pace. The pace de-celerated from a year ago, when home prices were upover 20% on a year-over-year basis. However, much ofthe growth in 2013 was due to a change in the salesmix—there was a large increase in the number of dis-tressed properties on the market. More recently, theshare of distressed properties in the salesmix has pre-cipitously declined.
At the median sales price for an existingsingle-family home, a homebuyer in SanBernardino County would pay $1,172 permonth for housing costs, and a homebuyerin Riverside County would pay $1,445 per
month.
A deceleration in price growth is usually a cause ofconcern for investors, but that should not be the casefor current homeowners in the Inland Empire. Afford-ability remains low by historical standards, and homeprices are low when compared with prices in coastalcommunities. Beacon Economics projects home prices
to further appreciate in the coming years. At the me-dian sales price for an existing single-family home,a homebuyer in San Bernardino County would pay$1,172 per month for housing costs, and a homebuyerin Riverside County would pay $1,445 per month.6In comparison, a homebuyer in Los Angeles Countywould pay $2,347 per month for housing, and a home-buyer in Orange County would pay $3,088 per month.Relative to the median household income of non-homeowners (households living in renter-occupiedunits), a homebuyer in San Bernardino County couldexpect 39% of their household income to go towardhousing costs, and a homebuyer in Riverside Countycould expect 47% of their household income to go to-ward housing costs. In contrast, homebuyers in LosAngeles and Orange counties could expect to spend74% and 76%, respectively, of their household incomeon housing.
0
100,000
200,000
300,000
400,000
Med
ian
Pric
es ($
, SA)
0
5,000
10,000
15,000
20,000
Sale
s (S
A)
Q1-01 Q1-04 Q1-07 Q1-10 Q1-13 Q1-16 Q1-19
Sales Sales ForecastMedian Prices Median Price Forecast
Source: Forecast by Beacon Economics
Inland Empire, Q1-01 to Q4-19Existing Home Prices and Sales Forecast
Home sales declined over the year. During the firsthalf of 2014, there were 25,100 existing single-familyhome sales, compared with 28,700 in the first halfof 2013. There were also 3,160 condominium sales inthe first half of 2014, slightly below the 3,390 condo-minium sales in the first half of 2013. But the numberof traditional sales (estimated by the number of exist-
6Taxes, insurance, and maintenance are estimated at 1.5% ofthe home sales price per year. Interest rates are estimated abovethe current 4.4% average, and a down payment of 20% is takeninto account.
2014 Riverside/San Bernardino Economic Forecast 25

Inland Empire Forecast
ing home sales less the number of foreclosures) showsthat sales activity is actually fairly normal, reflectingthe decline in available distressed properties—whichis a great sign for the stability of the housing market.
The tight housing supply remains one of the funda-mental components underlying the improvement inthe local housing market. The Inland Empire has beenexperiencing a shortage of homes available for sale forsome time, which has driven prices up. Fortunately,this lack of supply is beginning to incentivize buildersin the Inland Empire to become more active in the lo-cal market. According to the California HomebuildingFoundation, 4,300 residential permits have been is-sued in the Inland Empire through the first sixmonthsof 2014, a 8.1% year-to-date increase over the sameperiod last year. However, this is a far cry from thepre-recession peak back in the fourth quarter of 2004,when 13,300 units were permitted in a single three-month period. Nevertheless, it does represent a no-table increase in permitting activity since the reces-sionary lows.
0
5
10
15
Num
ber o
f Uni
ts (0
00s,
SA)
Q1-01 Q1-04 Q1-07 Q1-10 Q1-13 Q1-16 Q1-19
Actual Forecast
Source: Forecast by Beacon Economics
Inland Empire, Q1-01 to Q4-19Residential Permit Forecast
Overall, Beacon Economics projects the median pricefor a single-family home in the Inland Empire to growby a healthy 7.9% from the second quarter of 2014 tothe second quarter of 2015. In the course of the nextfive years, we project that home prices will grow ata rate of 6.5% to 7.5% per year. Home sales, too, areexpected to pick up, with future growth depending
heavily on the amount of construction permitting ob-tained for new residential units. Furthermore, slackin permitting dampens our forecasts for all economicindicators, as insufficient available housing units willdeter potential migrants. Nevertheless, by the end of2014, we expect that a total of 8,800 housing units willbe permitted, for an increase over the 8,400 units per-mitted in 2013, and we expect another 11,000 units tobe permitted in 2015.
26 2014 Riverside/San Bernardino Economic Forecast

BEACONECONOMICS
Employmentby Brian Vanderplas
ContentsKey Chapter Findings 28Overview 28Employment by Sector 29City Level Labor Markets 31Business Formation 32Wages 33
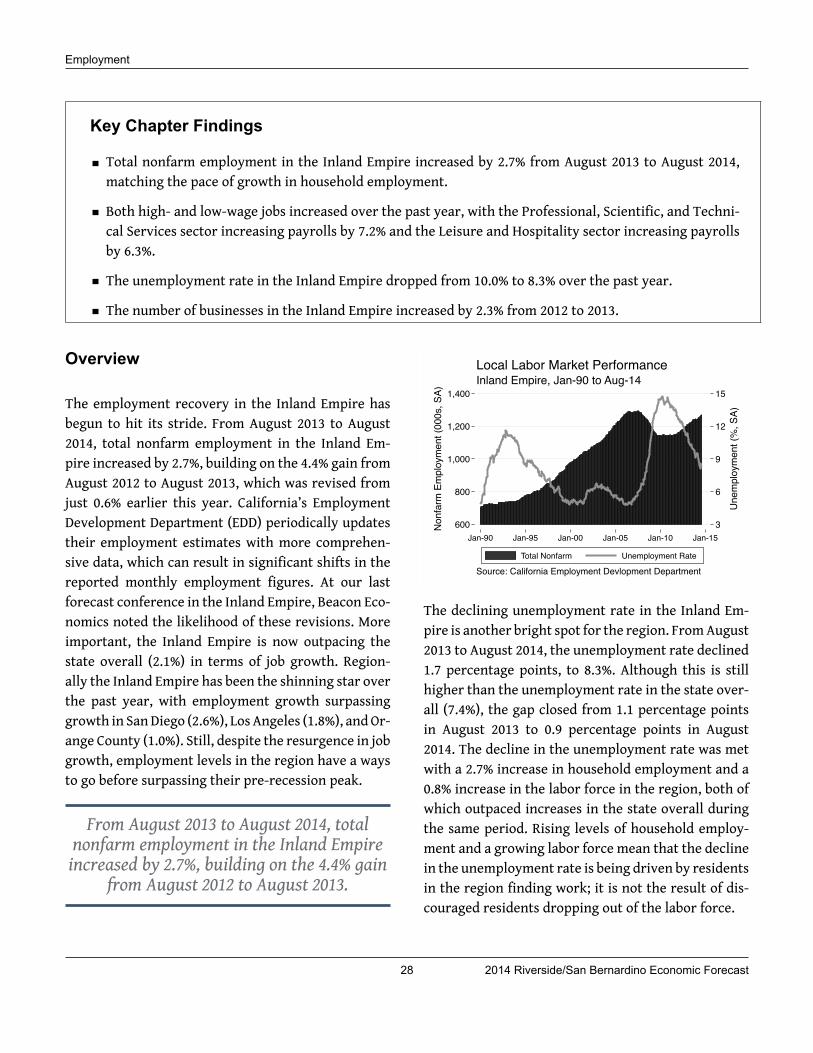
Employment
Key Chapter Findings
Total nonfarm employment in the Inland Empire increased by 2.7% from August 2013 to August 2014,matching the pace of growth in household employment.
Both high- and low-wage jobs increased over the past year, with the Professional, Scientific, and Techni-cal Services sector increasing payrolls by 7.2% and the Leisure and Hospitality sector increasing payrollsby 6.3%.
The unemployment rate in the Inland Empire dropped from 10.0% to 8.3% over the past year.
The number of businesses in the Inland Empire increased by 2.3% from 2012 to 2013.
Overview
The employment recovery in the Inland Empire hasbegun to hit its stride. From August 2013 to August2014, total nonfarm employment in the Inland Em-pire increased by 2.7%, building on the 4.4% gain fromAugust 2012 to August 2013, which was revised fromjust 0.6% earlier this year. California’s EmploymentDevelopment Department (EDD) periodically updatestheir employment estimates with more comprehen-sive data, which can result in significant shifts in thereported monthly employment figures. At our lastforecast conference in the Inland Empire, Beacon Eco-nomics noted the likelihood of these revisions. Moreimportant, the Inland Empire is now outpacing thestate overall (2.1%) in terms of job growth. Region-ally the Inland Empire has been the shinning star overthe past year, with employment growth surpassinggrowth in SanDiego (2.6%), Los Angeles (1.8%), andOr-ange County (1.0%). Still, despite the resurgence in jobgrowth, employment levels in the region have a waysto go before surpassing their pre-recession peak.
From August 2013 to August 2014, totalnonfarm employment in the Inland Empireincreased by 2.7%, building on the 4.4% gain
from August 2012 to August 2013.
3
6
9
12
15
Une
mpl
oym
ent (
%, S
A)
600
800
1,000
1,200
1,400
Non
farm
Em
ploy
men
t (00
0s, S
A)
Jan-90 Jan-95 Jan-00 Jan-05 Jan-10 Jan-15
Total Nonfarm Unemployment Rate
Source: California Employment Devlopment Department
Inland Empire, Jan-90 to Aug-14Local Labor Market Performance
The declining unemployment rate in the Inland Em-pire is another bright spot for the region. FromAugust2013 to August 2014, the unemployment rate declined1.7 percentage points, to 8.3%. Although this is stillhigher than the unemployment rate in the state over-all (7.4%), the gap closed from 1.1 percentage pointsin August 2013 to 0.9 percentage points in August2014. The decline in the unemployment rate was metwith a 2.7% increase in household employment and a0.8% increase in the labor force in the region, both ofwhich outpaced increases in the state overall duringthe same period. Rising levels of household employ-ment and a growing labor force mean that the declinein the unemployment rate is being driven by residentsin the region finding work; it is not the result of dis-couraged residents dropping out of the labor force.
28 2014 Riverside/San Bernardino Economic Forecast

Employment
Perhaps a more important takeaway from the house-hold survey is that household employment is match-ing the pace of growth in total nonfarm employmentin the Inland Empire. This is in contrast to what wesaw throughout most of the post-recession recov-ery, when growth in household employment outpacedgrowth in total nonfarm employment. When growthin household employment exceeds the pace of growthin total nonfarm employment, it can mean that resi-dents are being forced to look for jobs outside of thearea or that more residents are self-employed. Thatthis gap has begun to close suggests that more localresidents are beginning to find work closer to home.
96
100
104
108
112
Inde
xed
Empl
oym
ent (
Jan-
10 =
100
, SA)
Jan-10 Jan-11 Jan-12 Jan-13 Jan-14
Total Nonfarm Total Private
Source: California Employment Devlopment Department
Inland Empire, Jan-10 to Aug-14Total Nonfarm and Household Employment
To get a better understanding of the commuting dy-namics in the Inland Empire, we can look at the Cen-sus Bureau’s American Community Survey. Accordingto data compiled in 2013, more than 29.9% of area res-idents commuted to neighboring job centers, a slightdrop from the 30.3% of area residents who commutedto neighboring job centers in 2012. While still rela-tively high, the drop in the number of outbound com-muters echoes the resurgence in local employmentthat is occurring in the Inland Empire for area resi-dents.
To help sustain these trends, the region needs to con-tinue to focus on improving educational outcomes. In-deed, the unemployment rate for Inland Empire resi-dents with a bachelor’s degree or higher was just 5.5%
in 2013, only slightly higher than the rate observedin the state overall (5.2%). However, the unemploy-ment rate for Inland Empire residents without a bach-elor’s degree remained above 10% in 2013. This gaphighlights the importance of developing an educatedworkforce. Gains in educational attainment will helplower the unemployment rate and drive up income inthe region.
The unemployment rate for Inland Empireresidents with a bachelor’s degree or higher
was just 5.5% in 2013.
Employment by Sector
At the industry level employment growth has beenbroad based, with the majority of the region’s sectorsexpanding their payrolls over the last year. Leadingthe way has been the Leisure and Hospitality sector,which increased payrolls by 6.3% (8,600 jobs) fromAu-gust 2013 to August 2014. The gains in the Leisure andHospitality sector can also be seen in hotel occupancyrates and average daily room rates at the region’s ho-tels, which have increased by 4.3 percentage pointsand by 4.4% from June 2013 to June 2014, respectively.What’smore, recent renovations to the Riverside Con-vention Center expanded the center’s indoor eventspace by over 30%, which should boost growth in thehospitality sector in the region in the next few years.7
The Construction sector was another shining star forthe Inland Empire. In last year’s report, Beacon Eco-nomics highlighted the lackluster performance in thissector and noted that this was likely a blip in the data,given the underlying strength in other indicators forconstruction activity. The March revisions from Cal-ifornia’s EDD confirmed our assumption, with Con-
7“Riverside Convention Center to Reopen Early Spring2014,” Riverside Convention and Visitors Bureau, available athttp://www.riversidecvb.com/sites/default/files/Riverside%20Convention%20Center%20Expansion%20Ahead%20of%20Schedule%208-1-13.pdf .
2014 Riverside/San Bernardino Economic Forecast 29

Employment
struction employment from August 2012 to August2013 being revised from an initial estimated decreaseof 5.4% to a much-improved increase of 9.2%. Thisyear, the Inland Empire built on these revised gainsfrom a year ago, increasing payrolls by another 4.1%from August 2013 to August 2014.
95
100
105
110
115
Inde
xed
Empl
oym
ent (
Jan-
10 =
100
, SA)
Jan-12 Jul-12 Jan-13 Jul-13 Jan-14 Jul-14
Inland Empire California
Source: California Employment Devlopment Department
Employment, Jan-12 to Aug-14Professional, Scientific, & Technical Services
Other sectors also posted solid gains over the last year.From August 2013 to August 2013, the EducationalServices sector increased payrolls by 8.1%, addingroughly 1,500 positions. Not far behindwas the Profes-sional, Scientific, and Technical Services sector, whichincreased payrolls by 7.2% fromAugust 2013 to August2014, marking the fastest pace of growth for this sec-tor across the state over the period. The Health Caresector also added jobs, increasing payrolls by 3.5%from August 2013 to August 2014. The strong growthin high-wage sectors like Professional, Scientific, andTechnical Services andHealth Care, alongwith growthin low-wage sectors like Leisure and Hospitality, high-lights how job growth is occurring over a broad rangeof sectors, contrary to what is often being reported.
The region’s prominent Logistics sector continuedto make contributions to local employment growth.From August 2013 to August 2014, the Transportation,Warehouse, and Utilities sector increased payrolls by2.9%, outpacing this sector’s growth in the state over-all (1.3%). A portion of the gains in the Transporta-tion, Warehouse, and Utilities sector can be attributed
to Amazon’s new fulfillment center in Moreno Valley,which shipped its first package in August this year.8
Inland Empire Employment (000s, SA)
Sector Aug-13 Aug-12 to Aug-12 toAug-13 (%) Aug-13 (#)
Total Nonfarm 1268.5 2.7% 33.0Educational Services 18.4 8.9% 1.5Prof Sci and Tech 40.7 7.2% 2.7Leisure and Hospitality 144.7 6.3% 8.6Construction 72.4 4.1% 2.8Health Care 173.8 3.5% 5.8Transport,Warehouse,Util. 81.8 2.9% 2.3Information 11.6 2.6% 0.3Retail Trade 170.2 2.6% 4.3Government 230.8 2.3% 5.1Admin Support 89.4 1.4% 1.2Wholesale Trade 57.3 1.3% 0.7Management 8.9 0.9% 0.1Financial Activities 42.5 0.8% 0.3NR/Mining 1.2 -0.1% -0.0Manufacturing 86.1 -0.7% -0.6Other Services 38.6 -5.5% -2.3Source: California Employment Development Department
What’smore, Amazon is planning to build another ful-fillment center in Redlands, which the company esti-mates will employ more than 2,500 full-time employ-ees.9 The new fulfillment center, as well as the onethat came online in Moreno Valley in August, will notonly have a positive impact on the logistics industryin the region but will also have a positive impact on abroad range of sectors in the Inland Empire.
Using IMPLAN, a software system and database devel-oped by MIG Inc. for input-output data analysis, wecan see that the 2,500 employees directly employedby Amazon will help create another 941 jobs in theregion, with 89.4% of the additional jobs supported
8Debra Gruszecki, “Curtain Lifts at Amazon Fulfillment Centerin Moreno Valley,”The Press-Enterprise, August 26, 2014, availableat http://www.pe.com/articles/-748895--.html.
9Debra Gruszecki, “Amazon Expands Its Inland Im-pact,” The Press-Enterprise, August 15, 2014, availableat http://www.pe.com/articles/amazon-698862-center-redlands.html.
30 2014 Riverside/San Bernardino Economic Forecast

Employment
in industries outside the warehousing industry.10 Thedownstream jobs are supported by Amazon’s expen-ditures in the local economy for the day-to-day op-erations of the facility and by Amazon’s employees,who will be buying goods and services in the localeconomy, an activity which in turn helps to supportjobs throughout the Inland Empire economy and inindustries outside the warehousing industry. In otherwords, growth in Logistics benefits local industriesacross the board.
Government employment also turned the corner thisyear, with themajority of growth being driven by localgovernments. From August 2013 to August 2014, LocalGovernments increased their payrolls by 2.7%, adding4,800 of the 5,100 jobs gained in the Government sec-tor over the past year. The improvement in the under-lying tax base for local municipalities has started toarrest the declines in Government employment. Thesedeclines had been offsetting private-sector employ-ment growth, as the private sector began its recoveryin the region much earlier.
Despite the overall strength in the majority of sec-tors in the region, some sectors are lagging. For exam-ple, the Manufacturing sector posted a decline in pay-rolls from a year ago, decreasing by 0.7% or roughly600 positions. Still, Manufacturing did not decreaseacross the board: Food and Beverage Manufacturingincreasedpayrolls by 1.9%, and FabricatedMetal Prod-uct Manufacturing increased payrolls by 0.8%. Otherindustries seeing declines from a year ago includeOther Services (which dropped by 5.5%) and the Fi-nance and Insurance industry (which fell by 1.3%).
City Level Labor Markets
The solid employment growth across the Inland Em-pire over the past year has led to improved levels of
10The IMPLAN software/database contains specialized regionaleconomic statistics and can be used to measure the effect on a re-gional/local economy of a given change in the economy’s activity.
employment in several key markets in the Inland Em-pire. Indeed, employment levels in the City of River-side increased by 2.1% from July 2013 to July 2014, em-ployment levels in the City of Ontario increased by1.5% from June 2013 to June 2014, and employmentlevels in the City of Corona increased by 4.0% fromApril 2013 to April 2014. The recent growth in thesecities indicates the recovery is spread throughout theInland Empire, in similar fashion to the rising employ-ment levels across the majority of industries.
The unemployment rate in Corona (5.4%)and the City of Temecula (5.5%) were well
below rates in the state overall (6.3%) in 2013.
Unemployment Rate (%)Location 2012 2013
California 11.4 10.0
Riverside County 14.7 12.9
Corona 10.6 8.4Temecula 9.0 9.0Murrieta 10.9 11.6Riverside 14.9 12.8Moreno Valley 13.6 13.9
San Bernardino County 13.7 12.1
Ontario 11.7 11.1Rancho Cucamonga 11.7 11.6Fontana 13.8 12.2Victorville 18.2 12.7San Bernardino 17.5 16.6Source: U.S. Census Bureau,American Community Survey
Moreover, the unemployment rate has dropped in themajority of cities in the Inland Empire. According tothe Census Bureau’s American Community Survey, theunemployment rate in Corona (8.4%) and the City ofTemecula (9.0%) were well below rates in the stateoverall (10.0%) in 2013. Nonetheless, some cities in the
2014 Riverside/San Bernardino Economic Forecast 31

Employment
Inland Empire are continuing to face tough times. Theunemployment rate in the City of San Bernardino re-mains stubbornly high at 16.6%; however, it’s impor-tant to note this rate has dropped over 5 percentagepoints over the past two years, so the area is still keep-ing pace with the labor market growth in the InlandEmpire in recent years.
Business Formation
Along with growing employment levels, business for-mation in the Inland Empire turned the corner lastyear. According to the Quarterly Census of Employ-ment and Wages (QCEW) produced by the Bureau ofLabor Statistics, the number of businesses in the In-land Empire increased by 2.3% from 2012 to 2013, sur-passing 100,000 as of the first quarter of 2014. Busi-ness formation in the Inland Empire significantly out-paced that in the state overall, with the number ofbusinesses in California only increasing by 0.3% from2012 to 2013. More important, the Inland Empire ac-counted for roughly two-thirds of the increase in thenumber of businesses in the state from 2012 to 2013,while being home to just 7.4% of its total establish-ments.
The number of businesses in the InlandEmpire increased by 2.3% from 2012 to 2013,surpassing 100,000 as of the first quarter of
2014.
30
45
60
75
90
105
Esta
blis
hmen
ts (0
00s)
1990 1995 2000 2005 2010 2015Source: U.S. Bureau of Labor Statistics
Inland Empire, 1990 to 2013Number of Establishments
The region also saw new establishments increaseacross a variety of firm sizes. According to the Califor-nia EDD, firms with between 10 and 249 employees ac-counted for 50% of the jobs created in the Inland Em-pire between the third quarter of 2012 and the thirdquarter of 2013. Firms with fewer than 10 employeeswere responsible for 26.2% of the new positions in theregion, whereas firms with more than 250 employeeswere responsible for the other 23.8% of new positionsadded in the Inland Empire over the same period.
At the county level, both Riverside County (3.5%) andSan Bernardino County (1.2%) increased their estab-lishment base from 2012 to 2013. Most industries in-creased their establishment base from 2012 to 2013in the Inland Empire, with Trade, Transportation, andUtilities (3.0%) and Professional and Business Services(2.7%) posting the largest gains in the number of newfirms. The establishment base for the Leisure andHos-pitality sector (2.1%) and the Financial Activities sec-tor (2.0%) also grew significantly from 2012 to 2013 inthe Inland Empire. The only declines were posted bythe Natural Resources and Mining sector (3.1%) andthe Information sector (6.2%), both ofwhichhad fewerestablishments in 2013 than they had locally in 2012.
32 2014 Riverside/San Bernardino Economic Forecast

Employment
Wages
Although not growing as rapidly as employment lev-els, wages have also been on the rise in the Inland Em-pire. Indeed, the average annual wage across all sec-tors grew by 0.6% in the Inland Empire from 2012 to2013. Wages grew at a higher rate in Riverside County(1.1%) than in SanBernardino County (0.2%); however,wages in San Bernardino County remain higher thanwages in Riverside County. Wage growth in the stateoverall (0.6%) matched growth in the Inland Empire.But growth in the Inland Empire outpaced growth inneighboring Los Angeles and Orange County, wherewages contracted last year by 1.0% and 0.4%, respec-tively. Yet average annual wages in the Inland Empire($41,314) remain lower than wages in the state overall($57,121).
Average Annual Wage by Industry
Industry 2013 ($) Year-Over-Year Chg. (%)
Utilities 88,559 5.6Wholesale Trade 52,135 4.3Prof., Sci., & Tech Svcs. 54,438 4.2Finance & Insurance 57,887 3.2Information 54,230 2.0Mining 69,390 1.8Heath Care 50,924 1.8Local Government 50,634 1.6Real Estate 39,037 1.2Agriculture 24,988 1.0Manufacturing 48,492 0.9Retail Trade 28,657 0.2Educational Services 38,458 -0.1Construction 49,908 -0.6Logistics 41,336 -1.0Arts & Entertainment 23,269 -1.1Admin. & Support Svcs. 27,394 -1.5Accomodation & Food 16,986 -1.5Management 67,439 -2.5Other Services 20,962 -4.1
All Industries 40,447 0.6
Riverside 39,529 1.1San Bernardino 41,315 0.2Source: U.S. Bureau of Labor Statistics
Workers in the Utilities industry saw the largest bumpin wages from 2012 to 2013, with average annualwages rising by 5.6%. Increases in wages in theWhole-sale Trade industry (4.3%) and the Professional, Scien-tific, and Technical Services industry (4.2%) also out-paced the rate of growth for the region overall. De-spite the overall strength in the majority of sectors inthe region, annual average wages in several sectorsdeclined from 2012 to 2013. The sectors hardest hitwere Other Services (which saw wages drop by 4.1%)and Management (which slipped by 2.5%).
Looking at the growth in employment levels from Au-gust 2013 to August 2014, we can see that some of thefastest-growing sectors in the region are among thosewith higher earnings. As noted, this means that theregion is creating high-wage jobs in addition to creat-ing jobs in predominantly lower-skilled industries likeLeisure and Hospitality. Indeed, 56% of the jobs addedfrom August 2013 to August 2014 were in industriesthat had annual average wages over $40,000 in 2013.
Overall, our outlook for the Inland Empire labor mar-ket remains bright. Themajority of industries are con-tinuing to add to their payrolls, new businesses arespringing up in the area, and wages are increasingacross a broad range of industries.
2014 Riverside/San Bernardino Economic Forecast 33

BEACONECONOMICS
Business Activityby Dustin Schrader
ContentsKey Chapter Findings 36Introduction 36Economic Output in the Inland Empire Out-
paces the State 36Consumer and Business Spending Bolstered by
Auto Sales and Energy Projects 38Economic Growth Encourages New Infrastruc-
ture Projects across the Region 40Ports of Long Beach and Los Angeles Show
Growth despite Recent Concerns 41Airport Traffic and Hotel Revenue Growth
Show the Strength of Inland Empire Tourism 42Charts and Tables 44

Business Activity
Key Chapter Findings
From 2012 to 2013, real gross domestic product in the Inland Empire increased by 2.8%, compared with1.2% in Los Angeles County and 2.0% statewide.
With employment increasing throughout the Inland Empire and with economic growth outpacing thestate average, the newly created jobs and improved business revenues are pushing the region’s consumerand business spending upward.
An increase in tax revenues has pushed local governments to consider improving infrastructure, supple-menting the work that the State of California is doing to alleviate overstressed traffic areas.
The Inland Empire hospitality sector is experiencing strong growth, with hotel revenues and occupancycontinuing to climb.
Introduction
Beacon Economics’ optimism about the Inland Em-pire economy over the past two years has come tofruition. The economy is growing, and business activ-ity is thriving. Growth in real gross domestic prod-uct for the Inland Empire outpaced that of Los An-geles County and the state overall. Consumer spend-ing increased more quickly over the past year thanin any other region in Southern California, driven byauto sales and construction. Infrastructure projectsalready underway and those being proposed are en-couraging for future growth in the region.With strongeconomic growth in the Inland Empire and other re-gions, business and leisure travel to the area is pickingup, to the benefit of the Inland Empire hotel industry.Meanwhile, port activity continues to increase, whichbodes well for the region’s logistics industry movingforward. All signs are positive for the region’s busi-nesses. The Inland Empire is well on its way to havingone of the best years of economic growth in severalyears.
Economic Output in the Inland EmpireOutpaces the State
Total economic activity, asmeasured by regional grossdomestic product (GDP), has increased more quicklyin the Inland Empire than in the Los Angeles MSAor the State of California overall. From 2012 to 2013,real gross domestic product in the Inland Empire in-creased by 2.8%, compared with 1.2% in Los Ange-les County and 2.0% statewide. Industries related tologistics show some of the strongest growth. Whole-sale Trade GDP grew more rapidly in the Inland Em-pire (12.9%) than in the state overall (3.2%). Likewise,Transportation andWarehousing GDP increased 8.1%,compared with 2.3% statewide. These sectors shouldcontinue to flourish throughout 2014 due to increasedconsumer and business spending and growing tradeactivity, as detailed below.
As shown in the real estate chapters of this book,residential and commercial construction continue toramp up. Real Estate, the largest private industry ofthe Inland Empire economy, grew by 5.8% from 2012to 2013, while construction increased 5.3% during thattime.
36 2014 Riverside/San Bernardino Economic Forecast

Business Activity
GDP by Industry
Industry Riv.-San Bernardino Riv.-San Bernardino Riv.-San Bernardino Share of State of California,GDP, 2012 ($ bil) GDP, 2013 ($ bil) 1-Year Chg (%) GDP Growth, (%) 1-Year Chg (%)
All Industries 115.5 118.7 2.8 100.0 2.0Real Estate and Rental and Leasing 17.4 18.4 5.8 31.8 2.3Retail Trade 10.5 10.5 0.1 0.2 1.0Manufacturing 9.7 9.6 -0.9 -2.8 2.6
Durable Goods 5.6 5.4 -3.8 -0.2Nondurable Goods 4.1 4.2 2.7 6.3
Health Care and Social Assistance 9.0 9.5 5.1 14.4 2.1Wholesale Trade 7.0 7.9 12.9 28.2 3.2Construction 6.0 6.3 5.3 10.0 3.4Transportation and Warehousing 5.7 6.2 8.1 14.5 2.3Administrative and Waste Management Services 4.5 4.6 0.6 0.8 1.3Professional, Scientific, and Technical Services 3.8 4.0 3.8 4.5 -1.3Accommodation and Food Services 3.8 3.8 -1.2 -1.4 2.7Other Services, Except Government 3.5 3.3 -3.9 -4.2 -0.8Finance and Insurance 3.0 3.1 5.6 5.2 1.3Information 2.1 2.4 12.2 8.1 9.4Utilities 2.1 2.2 2.4 1.6 6.3Arts, Entertainment, and Recreation 1.0 1.0 2.0 0.6 1.4Management 0.8 0.9 6.8 1.8 14.9Agriculture 0.7 0.8 6.4 1.5 15.2Educational Services 0.8 0.8 -6.9 -1.8 -1.0Mining 0.8 0.6 -22.0 -5.6 -26.6Government 23.1 22.9 -0.9 -6.5 -0.9Source: U.S. Bureau of Economic Analysis
100
110
120
130
Inde
x =
100
in 2
001
2001
2003
2005
2007
2009
2011
2013
Riverside-San Bernardino MSA Los Angeles MSACalifornia
Source: U.S. Bureau of Economic Analysis
Regional and Statewide, 2001 to 2013Gross Domestic Product
Manufacturing in the Inland Empire is one of the fewindustries where growth remains sluggish. Manufac-turing GDP statewide increased by 2.6% from 2012to 2013, but it decreased by 0.9% in the Inland Em-pire. Within the larger manufacturing industry, non-durable goods manufacturing (such as food products)increased 2.7% in that time, but durable goods man-ufacturing (such as automobiles and metals) fell by3.8%. Hoping to build a strong, lasting durable goodsmanufacturing base that will also bolster the Inland
Empire’s logistics industry, the Inland Empire Eco-nomic Partnership has been working to draw techmanufacturing to the region.11 Tech manufacturingwould likely provide a long-term boost to regionaleconomic activity because of the strength of the techsector in California, in addition to providing jobs forthe region’s large number of low-skilled workers.
Manufacturing GDP will likely show growth in 2014,but Inland Empire purchasing managers suggestgrowth could be low. The Inland Empire PurchasingManagers Index (PMI) fromCal State San Bernardino’sInstitute of Applied Research stood at 50.9 in August. APMI above 50 represents manufacturing growth, andAugust was the fifth straight month in which the PMIstayed above 50. However, growth is slowing—the PMIin July was 54.8. The Institute’s manufacturing em-ployment index decreased significantly from July to
11Neil Nisperos, “Inland Empire Logistics Sector Poised forGrowth with Cargo Increases,” Inland Valley Daily Bulletin, Septem-ber 11, 2014.
2014 Riverside/San Bernardino Economic Forecast 37

Business Activity
August, from 60.0 to 45.5, suggesting possible laborcutbacks.12
Manufacturing in the Inland Empire may be improv-ing, but it remains to be seen whether it will catch upto growth statewide. The implementation of a statesales and use tax exemption for manufacturing andresearch and development property investments willhelp. The exemption went into effect in July and willbe in place until July 2022. Its effects on the InlandEmpire manufacturing industry should begin to sur-face gradually over time, given the abundance of af-fordable industrial property, as demonstrated in theCommercial Real Estate chapter of this book, helpingto draw new manufacturing to the region.
Consumer and Business SpendingBolstered by Auto Sales and EnergyProjects
100
110
120
130
140
150
Inde
x =
100
in Q
2-09
Q2-09
Q2-10
Q2-11
Q2-12
Q2-13
Q2-14
Riverside-San Bernardino MSA Orange CountyLos Angeles County San Diego MSACalifornia
Source: California Board of Equalization
Select Counties and California, Q2-09 to Q2-14Taxable Sales Revenues
With employment increasing throughout the InlandEmpire andwith economic growth outpacing the stateaverage, the newly created jobs and improved busi-ness revenues are pushing the region’s consumer andbusiness spending upward. Taxable sales in Riversideand San Bernardino Counties increased 6.6% from the
12“IAR’s Inland Empire Report on Business,” Cal State Univer-sity San Bernardino, Institute of Applied Research, August 2014.
Taxable Sales by City
City Q2-2013 1-Year 2-Year($ bil) Chg (%) Chg (%)
Apple Valley 0.13 6.1 8.3Cathedral City 0.19 1.8 12.4Chino 0.47 5.9 18.1Chino Hills 0.17 7.9 8.7Coachella 0.09 9.3 13.9Corona 0.82 4.9 15.8Fontana 0.71 8.6 14.9Hemet 0.25 10.6 14.4Indio 0.23 9.6 21.0Moreno Valley 0.38 12.7 19.4Murrieta 0.31 7.6 18.1Ontario 1.60 6.1 12.2Palm Springs 0.28 12.6 15.4Rancho Cucamonga 0.60 7.3 3.5Rialto 0.27 15.6 23.1Riverside 1.28 11.6 20.3San Bernardino 0.69 9.2 17.2Temecula 0.70 7.3 10.3Upland 0.28 7.3 21.8Source: California Board of Equalization
second quarter of 2013 to the second quarter of 2014,a larger increase than observed in San Diego County(6.4%), Los Angeles County (4.0%), Orange County(2.8%), and the state overall (3.9%). Taxable sales in theInland Empire have climbed above their pre-recessionpeak in the second quarter of 2007 by 4.5%. The re-gion’s spending is now at a higher level than ever interms of total dollars.
Taxable sales increased significantly in a number ofmajor cities in the Inland Empire. Taxable sales in On-tario, the city with the largest total taxable spendingin the region, increased 6.1% from the second quarterof 2013 to the second quarter of 2014. Riverside, withtaxable spending not far behind that of Ontario, expe-rienced an increase of 11.6% in that time. Growth wasalso substantial in Fontana (8.6%) and San Bernardino(9.2%).
Indeed, taxable sales increased in every city in the In-land Empire by 1.8% or more from 2012 to 2013. Inonly three cities taxable sales growth was less than10% over the past two years, with just two cities facingless than 5% growth in taxable sales within the past
38 2014 Riverside/San Bernardino Economic Forecast

Business Activity
Taxable Receipts by Sector
Category Riverside Cty, Riverside Cty, San Bernardino Cty, San Bernardino Cty,Q2-2014 ($ bil) 1-Year Chg (%) Q2-2014 ($ bil) 1-Year Chg (%)
Autos and Transportation 13.2 11.2 12.7 6.6Building and Construction 8.1 9.2 6.7 10.2Business and Industry 10.0 -0.7 14.1 -2.8Food and Drugs 4.5 7.2 3.7 8.2Fuel and Service Stations 10.4 5.8 11.6 6.2General Consumer Goods 17.9 5.6 16.5 6.2Restaurants and Hotels 8.6 5.5 7.2 6.6Total 80.8 6.9 81.0 5.0Source: The HdL Companies
year. This level of growth in taxable sales is a goodsign of healthy business activity. Firms will turnmuchof this growth in spending into investments in real es-tate, renovations, expansions, or labor.
Taxable receipts data from HdL Companies show thatautomobile and transportation spending continues todrive the growth in overall spending. Across bothRiverside and San Bernardino Counties, automobileand transportation spending increased 8.8% from thesecond quarter of 2013 to the second quarter of 2014,with 11.2% growth in Riverside County alone. Build-ing and construction spending has outpaced any othercategory of spending, with 10.4% growth in River-side and San Bernardino Counties combined. The re-bound in commercial and residential real estate hasprovided a big boost to construction spending in theregion, with permitting and new construction show-ing no sign of slipping.
With the Inland Empire continuing to build its repu-tation as a hub for solar energy, large-scale projectsshould bolster commercial and industrial construc-tion in the region. San Bernardino lifted its mora-torium on solar energy projects in late 2013, takingan important step to improve the county’s economicgrowth, even as some residents continue to show con-cern regarding the aesthetic and environmental im-pact of solar energy facilities. The regulations thatcounty supervisors imposed on solar energy projectsin December, such as measures to keep the projects
separate from communities and to encourage buildingon industrial and commercial lots, as well as to con-trol the spread of dust, serve as key compromises tobalance these interests.13
BrightSource Energy plans to commence building thePalen solar energy project in Riverside County soon.In mid-September, members of the California En-ergy Commission approved construction of one of theproject’s two 250-megawatt solar towers. The projectwill use flat mirrors to focus sunlight on a centraltower that will convert thermal heat into storable en-ergy. The commission has yet to approve the project’ssecond solar tower, due to concerns primarily aboutthe project’s risks to migratory birds. However, thecommissioners lauded the project’s low net carbonemissions andnoted that itwould support hundreds ofconstruction jobs, with an average workforce of morethan 600.14 Whether the downsized, 250-megawatt,single-tower plans or the 500-megawatt, two-towerplans are implemented, the project will unquestion-ably generate a substantial amount of new construc-tion activity in the Inland Empire.
Fuel and service stations spending increased a total of6.3% in Riverside and San Bernardino Counties, sup-ported by gas prices that are expected to remain low
13Janet Zimmerman, “Solar Development Moratorium to End,”The Press-Enterprise, December 3, 2013.
14Sammy Roth, “Palen Solar Project Approval Banked on Possi-ble Storage,” The Desert Sun, September 17, 2014.
2014 Riverside/San Bernardino Economic Forecast 39
Business Activity
heading into fall 2014 and by the steady growth of au-tomobile spending in the region. Gas prices at the endof summer were at their lowest level since February,withwholesale gas prices low enough that retail pricescould decrease even more in the fall.15
Employment growth and an increase in business andtourist travel put upward pressure on spending atrestaurants and hotels (up 6.0% year over year) and ongeneral consumer goods (up 5.8% year over year). Thisshould mean even more job growth in labor-intensiveindustries like leisure and hospitality and retail goods.As economic activity continues to grow in the com-ing year, we expect to see increases in hiring, both inthese lower-wage sectors (as businesses keep up withgrowing demand) and also in high-wage sectors (as de-mand for business services increases in response tosales growth).
Economic Growth Encourages NewInfrastructure Projects across theRegion
The economy of the Inland Empire is strong andgrowing. Rising home values and healthy consumerand business spending have helped to bolster thetwo primary sources of government funding: salesand property taxes. Strong growth in assessed valu-ation—roughly 7% in Riverside County for the currentfiscal year—has led to bigger budgets in 2014. Thisincrease in revenues has pushed local governmentsto consider improving infrastructure, supplementingthe work that the State of California is doing to alle-viate overstressed traffic areas. Traffic has increased,considerably in some cases, on some stretches of high-way in the Inland Empire in recent years. From 2012to 2013, traffic on SR-210 within the Inland Empire in-creased 82.2% heading westbound and 79.0% headingeastbound. Traffic on I-10 within the Inland Empire
15“Inland Empire Gas Price Drops to Lowest Amount SinceFeb.,” City News Service, September 20, 2014.
increased 3.8% heading westbound and 3.5% headingeastbound. Traffic remained mostly unchanged alongSR-60, I-15, and I-215 within the Inland Empire.
That is not to say that expansions are not needed alongsome of these highways. Expansion of the I-15/I-215interchange along Cajon Pass should help to alleviatesevere traffic bottlenecks. The California Transporta-tion Commission has contributed $53.7 million of the$324 million final cost of the project.16 Expansion ofSR-91 between Corona and Riverside is crucial to re-lieving gridlock. By 2017, the $1.4 billion expansionproject is expected to be complete.17
A new daily passenger rail line could be aboon for household employment growth in
the region.
To keep up with traffic growth in the long term, someInland Empire community leaders are also consider-ing expanding passenger rail in the region. The River-side County Transportation Commission is seekingfederal funding for a study on the potential for dailypassenger rail service between Los Angeles and Indiowith stops in Riverside and the San Gorgonio Pass. Atpresent, Amtrak runs only three trains a week fromLos Angeles to the Coachella Valley.18 A new daily pas-senger rail line could be a boon for household employ-ment growth in the region.
The County of Riverside recently reached a deal withTemecula Valley Wine Country to allow the agricul-tural district to keep 25% of county sales tax col-lections in exchange for purchasing signs, roads androundabouts, and water and sewer lines. The districtwill retain roughly $200,000 per year for infrastruc-
16Melissa Pinion-Whitt and Ryan Carter, “$53.7 Million Will Goto Widening 15/25 Freeway Interchange in Devore,” |emphInlandValley Daily Bulletin, December 6, 2012.
17“SR-91 Project,” Riverside County Transportation Commis-sion, available at http://rctc.org/projects/state-route-91/sr-91-corridor-improvement-project.
18Jeff Horseman, “Study to Weigh Daily Rail Service LinkingL.A., Coachella Valley,” The Press-Enterprise, September 10, 2014.
40 2014 Riverside/San Bernardino Economic Forecast

Business Activity
ture upgrades. The plan is similar to a late-2013 agree-ment to allow the Cabazon factory outlets to retain25% of county sales tax on revenues generated fromthe expansion of the factory outlets in exchange forpublic safety investments in Palm Springs.19
In addition to encouraging these large-scale infras-tructure projects, the City of Riverside has been work-ing to provide web infrastructure citywide. The Cityof Riverside has invested in fiber optic and free Wi-Finetworks in different parts of the city, while support-ing tech incubators and offering free training, com-puters, and software for low-income families. The Cityof Riverside was named the Intelligent Communityof the Year in 2012. Tech and transportation infras-tructure investments are essential to help the InlandEmpire compete for business and tourism in the longterm.
Ports of Long Beach and Los AngelesShow Growth despite Recent Concerns
Activity at the ports of Long Beach and Los Angeles isgrowing, which should mean more trade traffic mov-ing through warehouses and distribution centers inthe Inland Empire. The total value of exports for 2014year to date (January to July) is 1.9% higher than inthe same period of 2013, and only slightly behind thepace of 2.7% growth observed from January–July 2012to January–July 2013. Growth was concentrated at thePort of Los Angeles (3.5%), while export values at thePort of Long Beach remained mostly flat (0.2%). Thisis a reversal from the previous year, in which exportvalues increased 11.3% at the Port of Long Beach fromJanuary–July 2012 to January–July 2013 but decreased4.5% at the Port of Los Angeles during the sameperiod.
A fire emergency impaired operations at the Port ofLos Angeles in mid-September, but it remains to be
19David Downey, “Supervisors Act on Wine Country Sales TaxPlan,” The Press-Enterprise, September 10, 2014.
seen what impact that emergency will have on tradeand logistics activity for the month.20 A brief pausein operations may do little to turn the tide of growthin port activity for the season. A five-day, 120-workertrucker strike at the ports in July does not appear tohave had a noticeable impact on port activity.21
Overall trade activity is growing, whichshould lead to more activity in the InlandEmpire logistics industry in the months
ahead.
At the same time, the possibility of a dockworkerstrike at the ports after work contracts expired on July1 is believed to have boosted cargo activity to atypi-cal levels in June.22 Data is not yet available for latesummer, so it is difficult to knowwhether port activityslowed in the following months. Year-to-date growthin August and September could be slower than datafrom January through July would predict.
Total dollar value of exports out of Ontario Interna-tional Airport (ONT) increased 3.4% from January–July2013 to January–July 2014—a promising sign for cargotraffic at the struggling airport moving forward. How-ever, that growth is slower than at Los Angeles In-ternational Airport (9.4%) during the same period.Furthermore, it follows a very difficult year for air-port cargo traffic in 2013. From 2012 to 2013 (Jan-uary–December), total dollar value of exports de-creased 12.8% at ONT, even as it increased 8.3% at LAX.Yet, although airport cargo traffic at ONT remainssomewhat sluggish, overall trade activity is growing,which should lead to more activity in the Inland Em-pire logistics industry in the months ahead.
20“Port of Los Angeles Fire: Terminals Resume Full Operations,”KPCC, September 23, 2014.
21Andrew Khouri, “Five-Day Trucker Strike at Los Angeles andLong Beach Ports Ends,” Los Angeles Times, July 12, 2014.
22Brian Watt, “Dockworkers and Shipping Companies ReachTentative Deal on Health Care,” KPCC, August 27, 2014.
2014 Riverside/San Bernardino Economic Forecast 41

Business Activity
Airport Traffic and Hotel RevenueGrowth Show the Strength of InlandEmpire Tourism
Economic growth has provided a steady boost to busi-ness and tourist travel to the Inland Empire, withsolid growth at airports and hotels in 2014. After sev-eral years of gradual decline in passenger traffic atONT, passenger traffic for January–June 2014was 5.0%higher than for January–June 2013. In comparison,passenger traffic rose by 6.3% at LAX and by 4.9% atairports statewide. At the same time, passenger traf-fic at ONT was still 3.9% lower in January–June 2014than in January–June 2012, while passenger traffic in-creased 10.6% at LAX and 7.0% at airports statewideduring that time.
80
100
120
140
Pass
enge
rs (S
A)
Jun-09 Jun-10 Jun-11 Jun-12 Jun-13 Jun-14
Ontario International Los Angeles InternationalCalifornia Totals
Source: Visit California
ONT, LAX, and California Totals, June 2009 to June 2014Total Airport Passenger Traffic
Ontario city leaders are optimistic that the city couldreach a deal by the end of 2014 to acquire control ofONT from Los Angeles World Airports. The plan hasgained the support of Los Angeles Mayor Eric Garcettiaswell as Los Angeles County andRiverside County su-pervisors.23 Those parties believe that local oversightcould increase departures out of ONT and boost lag-ging passenger traffic over time.
23Jeff Horseman, “Airport Deal Could Be Near, CouncilmanSays,” The Press-Enterprise, September 17, 2014.
Palm Springs International Airport (PSP) has showna very strong increase in activity between 2013 and2014. From January–June 2013 to January–June 2014,total passenger traffic increased 9.4%, compared with2.4% growth from January–June 2012 to January–June2013. Although PSP has a smaller base of total pas-senger traffic than ONT, the airport’s growth overthe past two years suggests that the Coachella Val-ley has become a prime destination for tourist trafficto Southern California. The growth of events such asthe Coachella Valley Music and Arts Festival no doubtplays a prominent role. New flights scheduled for thewinter season from Vancouver on Air Canada Rougewill also contribute to ongoing tourism growth.24
The Inland Empire hospitality sector is experiencingstrong growth, with hotel revenues and occupancycontinuing to climb. According to data from PKFConsulting, from January–May 2013 to January–May2014, revPAR (revenue per available hotel room) in-creased 8.7% in the Inland Empire overall, with espe-cially strong growth in the wine country in Temecula(11.5%) and in Riverside/Corona (9.9%).
40
50
60
70
80
90
100
110
Rev
PAR
($, S
A)
Apr-09 Apr-10 Apr-11 Apr-12 Apr-13 Apr-14
Riverside-San Bernardino Los AngelesSan Diego Anaheim-Santa Ana
Source: Visit California
Select Regions, April 2009 to April 2014Revenue Per Available Room
The revPARgrowth reflects the combined impact of anincrease in room occupancy and an increase in hotelroom daily rates. Occupancy increased 3.5 percentagepoints throughout the region, to 71.2%, while the av-
24Skip Descant, “Air Canada Rouge to Fly out of Palm Springs,”The Desert Sun, September 17, 2014.
42 2014 Riverside/San Bernardino Economic Forecast

Business Activity
Hotel Statistics by Subregion
Location ADR, 2013 - 2014 Occupancy, 2013 - 2014 RevPAR, 2013 - 20142014 ($) Chg (%) 2014 ($) Chg (%) 2014 ($) Chg (%)
Ontario 93.18 2.8 71.7 3.9 66.80 8.6Riverside/Corona 96.57 5.2 69.1 3.0 66.71 9.9San Bernardino 77.98 2.0 71.4 2.5 55.67 5.7Temecula 112.55 3.0 74.6 5.8 83.91 11.5Regional Average 92.41 3.4 71.2 3.5 65.76 8.7Source: PKF Consulting
erage daily hotel room rate increased 3.4%, to $92.41.Temecula led the way with a 5.8 percentage point in-crease in room occupancy, at 74.6%.
Medium-sized hotels (100–199 rooms) in the InlandEmpire showed the biggest growth. Among those ho-tels, revPAR increased 11.0% from January–May 2013to January–May 2014. Hotels of all sizes are growingin 2014: revPAR increased 6.6% at hotels with fewerthan 100 rooms and 5.3% at hotels with 200 or morerooms. Hotels with 200 or more rooms showed thelowest growth in occupancy, increasing 2.9 percent-age points to 63.8%, while hotels with 100–199 roomsshowed the strongest bump in occupancy, increasingby 4.0 percentage points to 72.9%.
The growth in tourism has led to big increases intransient occupancy taxes (TOT) for the region. Ac-cording to The Desert Sun, TOT in the Coachella Val-ley increased 9.9% from fiscal year 2013 to fiscal year2014, to $55.9 million. TOT growth was especially pro-nounced in Palm Springs, at 12.9%. As Palm SpringsMayor Steve Pougnet notes, the city TOT has been updouble-digits for several years.25 Tourism is a drivingforce for the Coachella Valley economy, generating anestimated $5.8 billion in total business sales, accordingto a report by the Greater Palm Springs Conventionand Visitors Bureau.26
25Skip Descant, “Coachella Valley Collects $55.9Million in HotelBed Taxes,” The Desert Sun, September 1, 2014.
26“2013 Report on the Economic Impact of Tourism,” GreaterPalm Springs Convention and Visitors Bureau, available athttp://www.visitgreaterpalmsprings.com/partners/2013-economic-impact-report.
Tourist demand is encouraging new, and sometimescontroversial, hotel and resort development. Seekingto build a robust new tourist destination in downtownPalm Springs, the Agua Caliente Band of Cahuilla In-dians demolished the Palm Springs Spa Resort Casino.Local preservationists criticized the move for elimi-nating a well-known example of mid-century archi-tecture. However, the tribe has plans to preserve thesite’s natural spring as it builds a new downtownhotspot in place of the resort.27 As the Inland Em-pire seeks to capitalize on growing tourist demandthrough revitalization projects such as these, devel-opers may continue to brush up against local groupsseeking to preserve the landmarks that originallydrew tourism to the region.
At the same time, local tourism authorities seek tocontinue to build the region’s reputation as a gate-way to Southern California and attractions in Los An-geles, San Diego, Orange County, and Las Vegas. Al-though the California Welcome Center struggled inSan Bernardino and was forced to close in 2013, a newCaliforniaWelcomeCenter in Ontariowill helpmarketthe region to tourists in California and elsewhere. Thevibrant growth in business activity throughout the In-land Empire will help it to meet its goals by drawingincreasing numbers of businesses and travelers to theregion in the months ahead.
27Jessica Gelt, “Desert Dust-Up over Demolition of Tribe’s SpaResort in Palm Springs,” Los Angeles Times, September 7, 2014.
2014 Riverside/San Bernardino Economic Forecast 43

Business Activity
Charts and Tables
80
100
120
140
160
Aver
age
Dai
ly R
ate
($, S
A)
Apr-09 Apr-10 Apr-11 Apr-12 Apr-13 Apr-14
Riverside-San Bernardino Los AngelesSan Diego Anaheim-Santa Ana
Source: Visit California
Selected Regions, April 2009 to April 2014Average Daily Rate
50
60
70
80
Occ
upan
cy R
ate
(%, S
A)
Apr-09 Apr-10 Apr-11 Apr-12 Apr-13 Apr-14
Riverside-San Bernardino Los AngelesSan Diego Anaheim-Santa Ana
Source: Visit California
Select Regions, April 2009 to April 2014Occupancy Rate
Airport Activity (Total Passenger Traffic)Airport Jan-Jun Jan-Jun 2013 Jan-Jun 2014 1-Yr 2-Yr
2012 2013 2014 Chg (%) Chg (%)Ontario International 2,147,849 1,965,816 2,065,042 5.0 -3.9Los Angeles International 31,822,442 33,111,516 35,204,864 6.3 10.6California Total 86,134,352 87,911,352 92,198,112 4.9 7.0Source: Visit California
Port of Los Angeles Exports
2012 ($) 2013 ($) Jan-Jul Jan-Jul YTD 2013-2013 ($) 2014 ($) YTD 2014 Chg (%)
Inloaded Containers 4,092,621 3,976,692 2,239,338 2,433,935 8.7Outloaded Containers 2,043,076 1,921,069 1,091,200 1,152,226 5.6Total Full Containers 6,135,698 5,897,761 3,330,538 3,586,161 7.7Source: WISERTrade
Port of Long Beach Exports
2012 ($) 2013 ($) Jan-Jul Jan-Jul YTD 2013-2013 ($) 2014 ($) YTD 2014 Chg (%)
Inloaded Containers 3,062,290 3,455,325 1,933,184 1,996,338 3.3Outloaded Containers 1,540,188 1,704,930 974,579 977,226 0.3Total Full Containers 6,045,662 6,730,573 3,784,623 3,835,815 1.4Source: WISERTrade
44 2014 Riverside/San Bernardino Economic Forecast

Business Activity
1,0001,1001,2001,3001,4001,5001,6001,7001,8001,9002,0002,100
Cal
iforn
ia G
DP
($ b
illion
s, S
A)
0100200300400500600700800900
1,0001,100
Reg
iona
l GD
P ($
billi
ons,
SA)
2001 2002 2003 2004 2005 2006 2007 2008 2009 2010 2011 2012 2013
Riverside-San Bern. MSA Los Angeles-Long Beach MSACalifornia
Source: U.S. Bureau of Economic Analysis
Regional and Statewide, 2001 to 2013Gross Domestic Product
50
75
100
125
150
Califo
rnia
($ b
illion
s, S
A)
10
20
30
40
Sele
ct C
ount
ies
($ b
illion
s, S
A)
Q2-09
Q2-10
Q2-11
Q2-12
Q2-13
Q2-14
Riverside-San Bernardino MSA Orange CountyLos Angeles County San Diego MSACalifornia
Source: California Board of Equalization
Select Counties and California, Q2-09 to Q2-14Taxable Sales Revenues
San Bernardino Taxable Receipts
Quarter Autos and Building and Business and Food and Fuel and General Restaurants TotalTransportation Construction Industry Drugs Service Stations Consumer Goods and HotelsQ2-13 11,952,821 6,046,456 14,537,025 3,446,645 10,914,617 15,578,456 6,748,408 77,224,219Q2-14 12,738,895 6,662,377 14,132,397 3,729,177 11,596,670 16,539,822 7,191,986 81,047,804Source: The HdL Companies
Riverside Taxable Receipts
Quarter Autos and Building and Business and Food and Fuel and General Restaurants TotalTransportation Construction Industry Drugs Service Stations Consumer Goods and HotelsQ2-13 11,839,343 7,403,024 10,042,565 4,238,344 9,791,480 16,908,268 8,188,280 75,594,602Q2-14 13,168,096 8,082,901 9,975,536 4,543,829 10,355,426 17,851,191 8,642,189 80,780,497Source: The HdL Companies
2014 Riverside/San Bernardino Economic Forecast 45
Business Activity
46 2014 Riverside/San Bernardino Economic Forecast

Residential Real Estate
by Alan Hooper
ContentsKey Chapter Findings 48Strong Demand, Tight Supply 48Single-Family Housing Market 49Distressed Properties 51New Homes and Construction 52Multifamily Housing Market 53

Residential Real Estate
Key Chapter Findings
The residential housing market in the Inland Empire is characterized by strong demand and tight supply,with steep price increases and declining sales for existing single-family homes, new homes, and condo-miniums.
The continued easing of lending standards has boosted demand for housing, but declines in distressedproperty sales have led to a tight housing supply. Foreclosures dropped 23.4% in the Inland Empire fromthe first half of 2013 to the first half of 2014.
The housing market will normalize at a faster rate in Riverside County than in San Bernardino County.Construction permits for single-family homes grew by 14.2% in Riverside year-over-year, but fell by 3.6%in San Bernardino. Additionally, the average value of the permits issued in Riverside County increased by8.6% during this time, a much slower rate than the current rate of price appreciation.
With rapidly rising prices and declining sales, themultifamily housingmarket mirrored the single-familymarket over the past year. However, the supply constraints in the multifamily market are not as perva-sive, as sales increased in a number of cities throughout the region.
Last year’s trends in the rental market have carried into 2014. Vacancy rates fell 1.1 percentage points,to 2.5%, and are among the lowest in Southern California. Meanwhile, rents continued to grow steadilyfrom the second quarter of 2013 to the second quarter of this year, increasing by 2.1%.
Strong Demand, Tight Supply
100
200
300
400
Med
ian
Pric
e ($
000s
, SA)
0
10
20
30
40
Trad
ition
al S
ales
(000
s, S
A)
Q1-96 Q1-99 Q1-02 Q1-05 Q1-08 Q1-11 Q1-14
Traditional Sales Median PriceNote: Traditional Sales are estimated by subtracting foreclosures from total sales.Source: DataQuick
Inland Empire, Q1-95 to Q2-14Res. Real Estate Prices and Traditional Sales
After five straight quarters of price appreciation inexcess of 20%, price growth, at 16% year-over-year,was relativelymoderate in the second quarter of 2014.
Nonetheless, the Inland Empire remains one of thehottest housing markets in the nation, owing to aboost in housing demand and persistent supply con-straints.
Housing demand has been aided by the continued re-laxation of lending standards over the past year. Forexample, the average FICO score accepted for FHAhome purchase loans fell 1.9%, from 699 in February2013 to 686 in February 2014, while the average FICOscore for Fannie Mae–backed loans fell 1.3%, to 744 inthe first half of 2014. As lending standards continueto ease, a greater number of prospective homebuyerswill be able to access the credit needed to completehousing purchases. Demand has also been boosted bymortgage rates, which are at historically low levels.
In a sign that the housing supply is slowly adjusting togrowing demand, traditional housing sales, which are
48 2014 Riverside/San Bernardino Economic Forecast
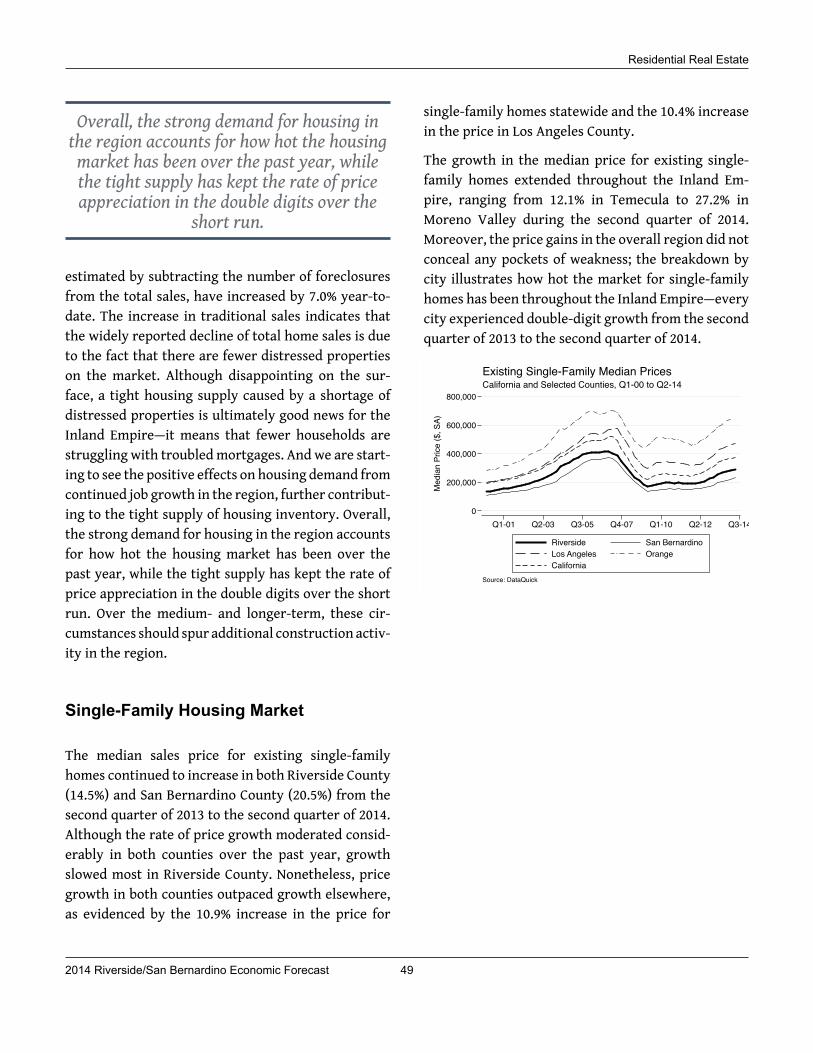
Residential Real Estate
Overall, the strong demand for housing inthe region accounts for how hot the housingmarket has been over the past year, whilethe tight supply has kept the rate of priceappreciation in the double digits over the
short run.
estimated by subtracting the number of foreclosuresfrom the total sales, have increased by 7.0% year-to-date. The increase in traditional sales indicates thatthe widely reported decline of total home sales is dueto the fact that there are fewer distressed propertieson the market. Although disappointing on the sur-face, a tight housing supply caused by a shortage ofdistressed properties is ultimately good news for theInland Empire—it means that fewer households arestruggling with troubledmortgages. And we are start-ing to see the positive effects on housing demand fromcontinued job growth in the region, further contribut-ing to the tight supply of housing inventory. Overall,the strong demand for housing in the region accountsfor how hot the housing market has been over thepast year, while the tight supply has kept the rate ofprice appreciation in the double digits over the shortrun. Over the medium- and longer-term, these cir-cumstances should spur additional construction activ-ity in the region.
Single-Family Housing Market
The median sales price for existing single-familyhomes continued to increase in both Riverside County(14.5%) and San Bernardino County (20.5%) from thesecond quarter of 2013 to the second quarter of 2014.Although the rate of price growth moderated consid-erably in both counties over the past year, growthslowed most in Riverside County. Nonetheless, pricegrowth in both counties outpaced growth elsewhere,as evidenced by the 10.9% increase in the price for
single-family homes statewide and the 10.4% increasein the price in Los Angeles County.
The growth in the median price for existing single-family homes extended throughout the Inland Em-pire, ranging from 12.1% in Temecula to 27.2% inMoreno Valley during the second quarter of 2014.Moreover, the price gains in the overall region did notconceal any pockets of weakness; the breakdown bycity illustrates how hot the market for single-familyhomes has been throughout the Inland Empire—everycity experienced double-digit growth from the secondquarter of 2013 to the second quarter of 2014.
0
200,000
400,000
600,000
800,000
Med
ian
Price
($, S
A)
Q1-01 Q2-03 Q3-05 Q4-07 Q1-10 Q2-12 Q3-14
Riverside San BernardinoLos Angeles OrangeCalifornia
Source: DataQuick
California and Selected Counties, Q1-00 to Q2-14Existing Single-Family Median Prices
2014 Riverside/San Bernardino Economic Forecast 49
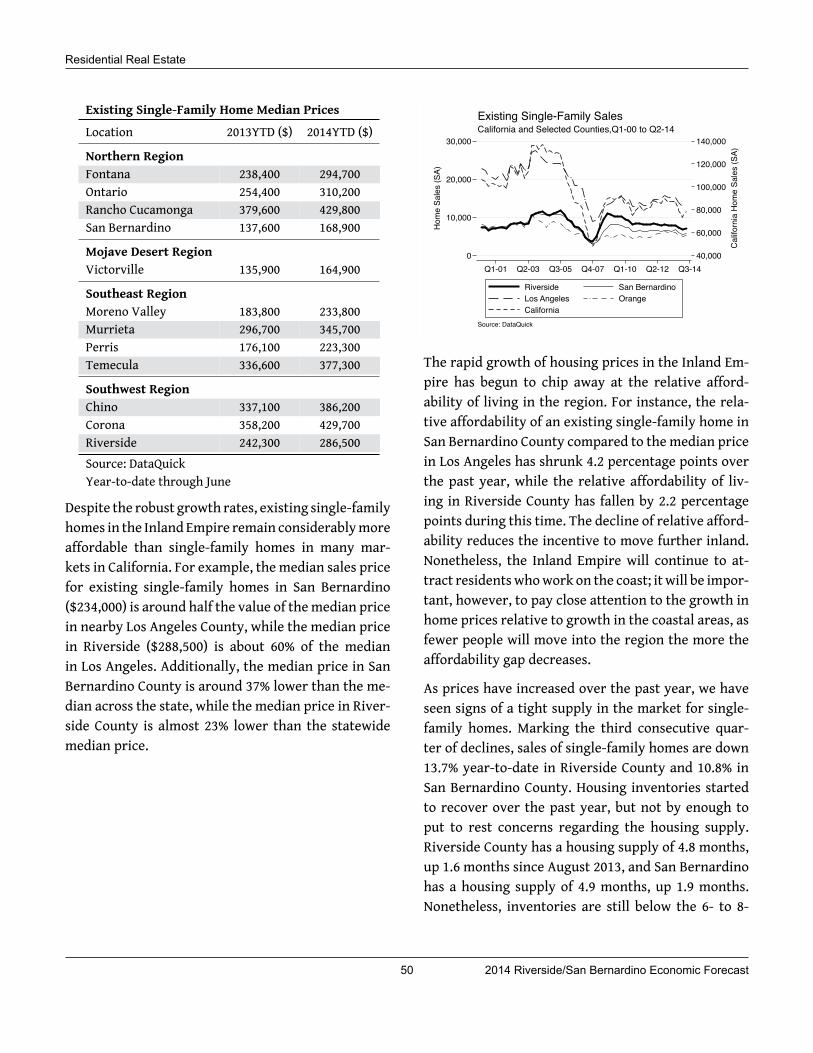
Residential Real Estate
Existing Single-Family Home Median PricesLocation 2013YTD ($) 2014YTD ($)
Northern RegionFontana 238,400 294,700Ontario 254,400 310,200Rancho Cucamonga 379,600 429,800San Bernardino 137,600 168,900
Mojave Desert RegionVictorville 135,900 164,900
Southeast RegionMoreno Valley 183,800 233,800Murrieta 296,700 345,700Perris 176,100 223,300Temecula 336,600 377,300
Southwest RegionChino 337,100 386,200Corona 358,200 429,700Riverside 242,300 286,500Source: DataQuickYear-to-date through June
Despite the robust growth rates, existing single-familyhomes in the Inland Empire remain considerablymoreaffordable than single-family homes in many mar-kets in California. For example, the median sales pricefor existing single-family homes in San Bernardino($234,000) is around half the value of themedian pricein nearby Los Angeles County, while the median pricein Riverside ($288,500) is about 60% of the medianin Los Angeles. Additionally, the median price in SanBernardino County is around 37% lower than the me-dian across the state, while the median price in River-side County is almost 23% lower than the statewidemedian price.
40,000
60,000
80,000
100,000
120,000
140,000
Califo
rnia
Hom
e Sa
les
(SA)
0
10,000
20,000
30,000
Hom
e Sa
les
(SA)
Q1-01 Q2-03 Q3-05 Q4-07 Q1-10 Q2-12 Q3-14
Riverside San BernardinoLos Angeles OrangeCalifornia
Source: DataQuick
California and Selected Counties,Q1-00 to Q2-14Existing Single-Family Sales
The rapid growth of housing prices in the Inland Em-pire has begun to chip away at the relative afford-ability of living in the region. For instance, the rela-tive affordability of an existing single-family home inSan Bernardino County compared to the median pricein Los Angeles has shrunk 4.2 percentage points overthe past year, while the relative affordability of liv-ing in Riverside County has fallen by 2.2 percentagepoints during this time. The decline of relative afford-ability reduces the incentive to move further inland.Nonetheless, the Inland Empire will continue to at-tract residentswhowork on the coast; it will be impor-tant, however, to pay close attention to the growth inhome prices relative to growth in the coastal areas, asfewer people will move into the region the more theaffordability gap decreases.
As prices have increased over the past year, we haveseen signs of a tight supply in the market for single-family homes. Marking the third consecutive quar-ter of declines, sales of single-family homes are down13.7% year-to-date in Riverside County and 10.8% inSan Bernardino County. Housing inventories startedto recover over the past year, but not by enough toput to rest concerns regarding the housing supply.Riverside County has a housing supply of 4.8 months,up 1.6 months since August 2013, and San Bernardinohas a housing supply of 4.9 months, up 1.9 months.Nonetheless, inventories are still below the 6- to 8-
50 2014 Riverside/San Bernardino Economic Forecast
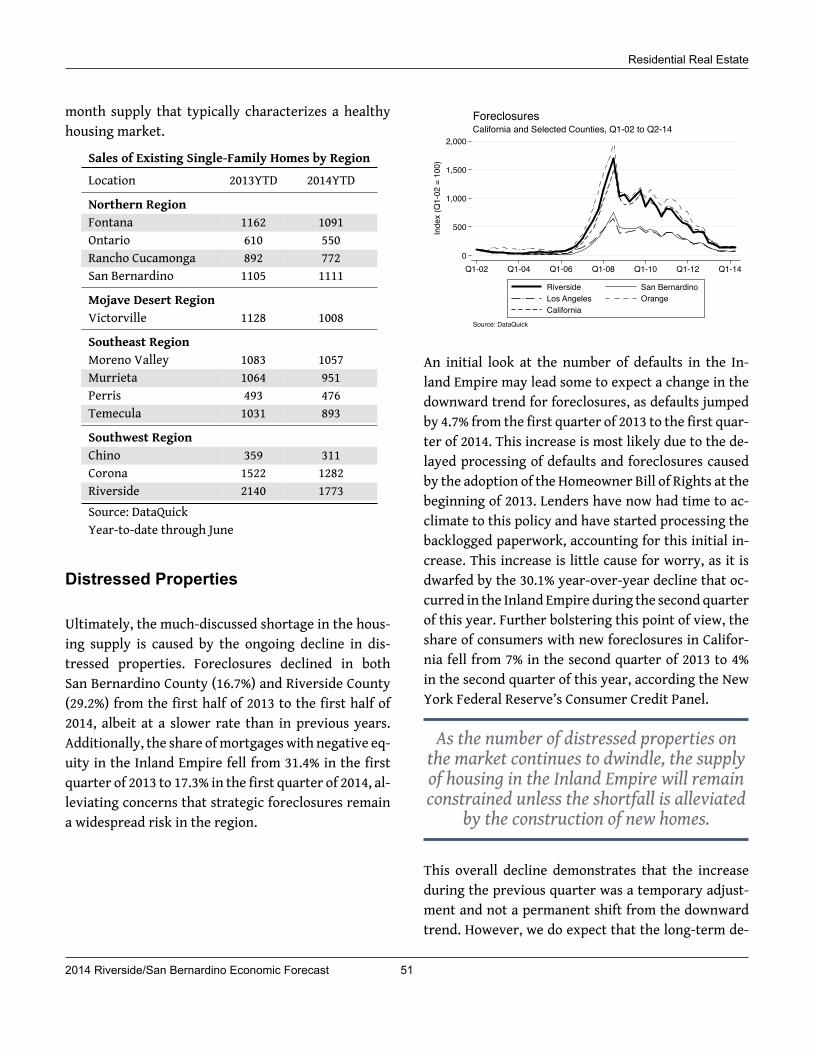
Residential Real Estate
month supply that typically characterizes a healthyhousing market.
Sales of Existing Single-Family Homes by RegionLocation 2013YTD 2014YTD
Northern RegionFontana 1162 1091Ontario 610 550Rancho Cucamonga 892 772San Bernardino 1105 1111
Mojave Desert RegionVictorville 1128 1008
Southeast RegionMoreno Valley 1083 1057Murrieta 1064 951Perris 493 476Temecula 1031 893
Southwest RegionChino 359 311Corona 1522 1282Riverside 2140 1773Source: DataQuickYear-to-date through June
Distressed Properties
Ultimately, the much-discussed shortage in the hous-ing supply is caused by the ongoing decline in dis-tressed properties. Foreclosures declined in bothSan Bernardino County (16.7%) and Riverside County(29.2%) from the first half of 2013 to the first half of2014, albeit at a slower rate than in previous years.Additionally, the share ofmortgageswith negative eq-uity in the Inland Empire fell from 31.4% in the firstquarter of 2013 to 17.3% in the first quarter of 2014, al-leviating concerns that strategic foreclosures remaina widespread risk in the region.
0
500
1,000
1,500
2,000
Inde
x (Q
1-02
= 1
00)
Q1-02 Q1-04 Q1-06 Q1-08 Q1-10 Q1-12 Q1-14
Riverside San BernardinoLos Angeles OrangeCalifornia
Source: DataQuick
California and Selected Counties, Q1-02 to Q2-14Foreclosures
An initial look at the number of defaults in the In-land Empire may lead some to expect a change in thedownward trend for foreclosures, as defaults jumpedby 4.7% from the first quarter of 2013 to the first quar-ter of 2014. This increase is most likely due to the de-layed processing of defaults and foreclosures causedby the adoption of the Homeowner Bill of Rights at thebeginning of 2013. Lenders have now had time to ac-climate to this policy and have started processing thebacklogged paperwork, accounting for this initial in-crease. This increase is little cause for worry, as it isdwarfed by the 30.1% year-over-year decline that oc-curred in the Inland Empire during the second quarterof this year. Further bolstering this point of view, theshare of consumers with new foreclosures in Califor-nia fell from 7% in the second quarter of 2013 to 4%in the second quarter of this year, according the NewYork Federal Reserve’s Consumer Credit Panel.
As the number of distressed properties onthe market continues to dwindle, the supplyof housing in the Inland Empire will remainconstrained unless the shortfall is alleviated
by the construction of new homes.
This overall decline demonstrates that the increaseduring the previous quarter was a temporary adjust-ment and not a permanent shift from the downwardtrend. However, we do expect that the long-term de-
2014 Riverside/San Bernardino Economic Forecast 51
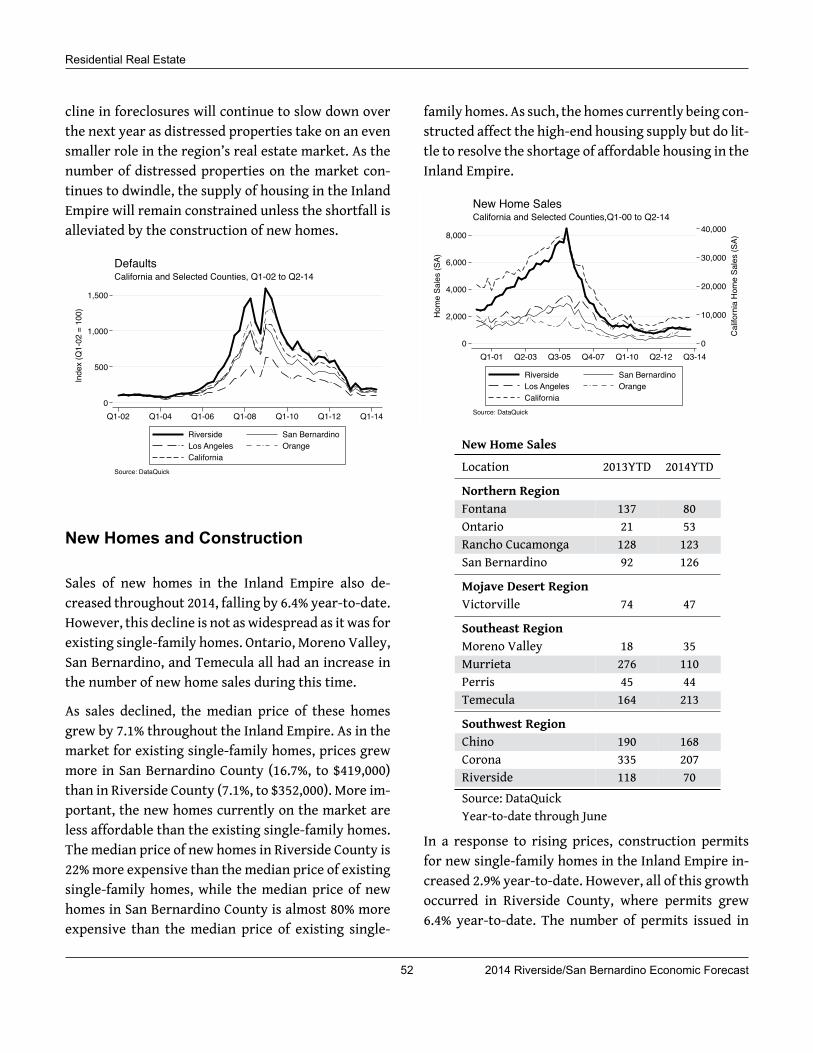
Residential Real Estate
cline in foreclosures will continue to slow down overthe next year as distressed properties take on an evensmaller role in the region’s real estate market. As thenumber of distressed properties on the market con-tinues to dwindle, the supply of housing in the InlandEmpire will remain constrained unless the shortfall isalleviated by the construction of new homes.
0
500
1,000
1,500
Inde
x (Q
1-02
= 1
00)
Q1-02 Q1-04 Q1-06 Q1-08 Q1-10 Q1-12 Q1-14
Riverside San BernardinoLos Angeles OrangeCalifornia
Source: DataQuick
California and Selected Counties, Q1-02 to Q2-14Defaults
New Homes and Construction
Sales of new homes in the Inland Empire also de-creased throughout 2014, falling by 6.4% year-to-date.However, this decline is not aswidespread as it was forexisting single-family homes. Ontario, Moreno Valley,San Bernardino, and Temecula all had an increase inthe number of new home sales during this time.
As sales declined, the median price of these homesgrew by 7.1% throughout the Inland Empire. As in themarket for existing single-family homes, prices grewmore in San Bernardino County (16.7%, to $419,000)than in Riverside County (7.1%, to $352,000). More im-portant, the new homes currently on the market areless affordable than the existing single-family homes.The median price of new homes in Riverside County is22%more expensive than themedian price of existingsingle-family homes, while the median price of newhomes in San Bernardino County is almost 80% moreexpensive than the median price of existing single-
family homes. As such, the homes currently being con-structed affect the high-end housing supply but do lit-tle to resolve the shortage of affordable housing in theInland Empire.
0
10,000
20,000
30,000
40,000
Califo
rnia
Hom
e Sa
les
(SA)
0
2,000
4,000
6,000
8,000
Hom
e Sa
les
(SA)
Q1-01 Q2-03 Q3-05 Q4-07 Q1-10 Q2-12 Q3-14
Riverside San BernardinoLos Angeles OrangeCalifornia
Source: DataQuick
California and Selected Counties,Q1-00 to Q2-14New Home Sales
New Home SalesLocation 2013YTD 2014YTD
Northern RegionFontana 137 80Ontario 21 53Rancho Cucamonga 128 123San Bernardino 92 126
Mojave Desert RegionVictorville 74 47
Southeast RegionMoreno Valley 18 35Murrieta 276 110Perris 45 44Temecula 164 213
Southwest RegionChino 190 168Corona 335 207Riverside 118 70Source: DataQuickYear-to-date through June
In a response to rising prices, construction permitsfor new single-family homes in the Inland Empire in-creased 2.9% year-to-date. However, all of this growthoccurred in Riverside County, where permits grew6.4% year-to-date. The number of permits issued in
52 2014 Riverside/San Bernardino Economic Forecast

Residential Real Estate
San Bernardino County fell by 6.1% during this time.As such, we expect to see a quicker normalization ofthe single-family housing market in Riverside Countythan in San Bernardino County.
0
50
100
150
200
250
Inde
x (Q
1-01
= 1
00, S
A)
Q1-01 Q1-03 Q1-05 Q1-07 Q1-09 Q1-11 Q1-13 Q1-15
Riverside San BernardinoLos Angeles OrangeCalifornia
Source: Construction Industry Research Board
California and Selected Counties, Q1-01 to Q2-14Single-Family Permits Issued
The bulk of permit growth occurred in the east andsoutheast regions of the Inland Empire. In particu-lar, the number of permits for single-family construc-tion issued in Menifee, Indio, and Palm Desert grewsignificantly. For example, the number of permits is-sued year-to-date increased by 189 permits (143.2%)in Menifee and by 203 permits (109.7%) in Indio.
Furthermore, the new single-family homes currentlypermitted for construction may address the short-age of affordable homes in the region. The averagevalue of the permits filed is $256,500 in Riverside and$253,800 in San Bernardino—values that are more inline with the prices of existing homes throughout theregion.
Multifamily Housing Market
With skyrocketing prices and diminishing sales, themarket for multifamily housing in the Inland Empireis beginning to mirror the fundamentals of the exist-ing home market. The median price for existing con-dominiums increased 23.1% in San Bernardino fromthe first half of 2013 to the first half of 2014, while
prices increased by 16.5% inRiverside.Moreover,mul-tifamily housing prices grewat amuch faster rate thanthey did in neighboring regions¬—prices in Los An-geles County climbed by 7.4%, while prices in OrangeCounty grew by 8.3%. This marked the seventh con-secutive quarter of double-digit price appreciation forexisting condominiums.
100,000
200,000
300,000
400,000
500,000
Med
ian
Price
($, S
A)
Q1-01 Q2-03 Q3-05 Q4-07 Q1-10 Q2-12 Q3-14
Riverside San BernardinoLos Angeles OrangeCalifornia
Source: DataQuick
California and Selected Counties, Q1-00 to Q2-14Existing Condominium Median Prices
10,000
15,000
20,000
25,000
30,000
Califo
rnia
Hom
e Sa
les
(SA)
0
2,000
4,000
6,000
8,000
Hom
e Sa
les
(SA)
Q1-01 Q2-03 Q3-05 Q4-07 Q1-10 Q2-12 Q3-14
Riverside San BernardinoLos Angeles OrangeCalifornia
Source: DataQuick
California and Selected Counties,Q1-00 to Q2-14Existing Condominium Sales
At the same time, the number of sales for existingcondominiums has fallen for two consecutive quartersin the Inland Empire. In particular, sales have fallenby 8.4%, with 1,567 units sold since the second quar-ter of 2013. The bulk of this decline occurred in fivecities—Moreno Valley, Murrieta, Rancho Cucamonga,Riverside, and San Bernardino—as the decline in con-dominium sales has not been as pervasive as it hasbeen in other markets. In fact, sales in Ontario and
2014 Riverside/San Bernardino Economic Forecast 53

Residential Real Estate
Corona, which account for almost 30% of all condo-minium sales in the region, grew by 4.0% and 8.1%,respectively, during this time.
Meanwhile, the market for apartments in the InlandEmpire has continued to tighten over the past year.The apartment vacancy rate in the region continuedits downward trend in the second quarter of 2014. De-clining by 1.1 percentage points to hit 2.5%, it is amongthe lowest rates in Southern California. Additionally,positive net absorption of rental units was spreadthroughout the Inland Empire—only Fontana/Rialtohad negative net absorption of apartments during thistime.
2
4
6
8
Perc
ent,
NSA
Q1-08 Q3-09 Q1-11 Q3-12 Q1-14
Riverside-San Bernardino MSA Los Angeles CountyOrange County San Diego County
Source: REIS
Selected Counties, Q1-08 to Q2-14Apartment Vacancy Rate
In a sign that the increase in multifamily units fromthe previous year met the overall increase in demandfor rental units, the cost of rent increased by only2.1% year-over-year in the Inland Empire. From thesecond quarter of 2013 to the second quarter of thisyear, the cost of rent grew throughout the region,most notably in Rancho Cucamonga (3.6%), the re-gion’s second-largest rental market, and in Indio Val-ley (3.9%).
1,000.0
1,200.0
1,400.0
1,600.0
$/M
onth
Q1-08 Q3-09 Q1-11 Q3-12 Q1-14
Riverside-San Bernardino MSA Los Angeles CountyOrange County San Diego County
Source: REIS
Selected Counties, Q1-08 to Q2-14Cost of Apartment Rent
Moving forward, however, the stock of multifamilyunits will not increase as much as it has in previousyears. The number of permits for multifamily con-struction decreased by 10.0% year-to-date, althoughSan Bernardino accounts for the entire decline inpermits issued. In particular, the number of multi-family permits issued in San Bernardino County fellby 20.6% during this period, while they increased by2.9% in Riverside County. As such, rents will rise at afaster rate in San Bernardino County than in RiversideCounty if current demand fundamentals hold goingforward. Regardless, the Inland Empire is still domi-nated by single-family housing. Only 26.9% of the res-idential construction permits issued year-to-date areformultifamily construction in the region. This comesas no surprise, as land is more abundant in the InlandEmpire relative to other regions in Southern Califor-nia.
0
100
200
300
400
Inde
x (Q
1-01
= 1
00, S
A)
Q1-01 Q1-03 Q1-05 Q1-07 Q1-09 Q1-11 Q1-13 Q1-15
Riverside San BernardinoLos Angeles OrangeCalifornia
Source: Construction Industry Research Board
California and Selected Counties, Q1-01 to Q2-14Multifamily Permits Issued
54 2014 Riverside/San Bernardino Economic Forecast
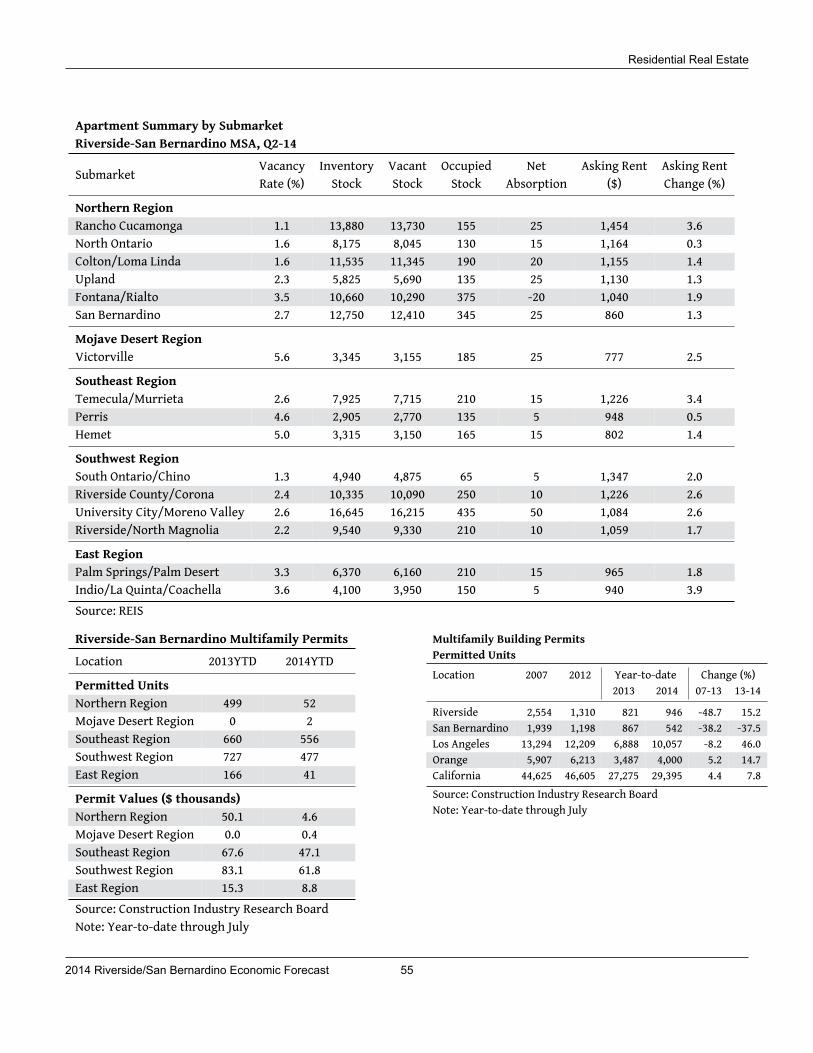
Residential Real Estate
Apartment Summary by SubmarketRiverside-San Bernardino MSA, Q2-14
Submarket Vacancy Inventory Vacant Occupied Net Asking Rent Asking RentRate (%) Stock Stock Stock Absorption ($) Change (%)
Northern RegionRancho Cucamonga 1.1 13,880 13,730 155 25 1,454 3.6North Ontario 1.6 8,175 8,045 130 15 1,164 0.3Colton/Loma Linda 1.6 11,535 11,345 190 20 1,155 1.4Upland 2.3 5,825 5,690 135 25 1,130 1.3Fontana/Rialto 3.5 10,660 10,290 375 -20 1,040 1.9San Bernardino 2.7 12,750 12,410 345 25 860 1.3
Mojave Desert RegionVictorville 5.6 3,345 3,155 185 25 777 2.5
Southeast RegionTemecula/Murrieta 2.6 7,925 7,715 210 15 1,226 3.4Perris 4.6 2,905 2,770 135 5 948 0.5Hemet 5.0 3,315 3,150 165 15 802 1.4
Southwest RegionSouth Ontario/Chino 1.3 4,940 4,875 65 5 1,347 2.0Riverside County/Corona 2.4 10,335 10,090 250 10 1,226 2.6University City/Moreno Valley 2.6 16,645 16,215 435 50 1,084 2.6Riverside/North Magnolia 2.2 9,540 9,330 210 10 1,059 1.7
East RegionPalm Springs/Palm Desert 3.3 6,370 6,160 210 15 965 1.8Indio/La Quinta/Coachella 3.6 4,100 3,950 150 5 940 3.9Source: REIS
Riverside-San Bernardino Multifamily PermitsLocation 2013YTD 2014YTD
Permitted UnitsNorthern Region 499 52Mojave Desert Region 0 2Southeast Region 660 556Southwest Region 727 477East Region 166 41
Permit Values ($ thousands)Northern Region 50.1 4.6Mojave Desert Region 0.0 0.4Southeast Region 67.6 47.1Southwest Region 83.1 61.8East Region 15.3 8.8Source: Construction Industry Research BoardNote: Year-to-date through July
Multifamily Building PermitsPermitted UnitsLocation 2007 2012 Year-to-date Change (%)
2013 2014 07-13 13-14
Riverside 2,554 1,310 821 946 -48.7 15.2San Bernardino 1,939 1,198 867 542 -38.2 -37.5Los Angeles 13,294 12,209 6,888 10,057 -8.2 46.0Orange 5,907 6,213 3,487 4,000 5.2 14.7California 44,625 46,605 27,275 29,395 4.4 7.8Source: Construction Industry Research BoardNote: Year-to-date through July
2014 Riverside/San Bernardino Economic Forecast 55

Commercial Real Estateby Maximilian Saia
ContentsKey Chapter Findings 58Overview 58The Riverside-San Bernardino Office Market 60The Riverside-San Bernardino Retail Market 63The Riverside-San Bernardino Industrial Market 66Charts and Tables 70

Commercial Real Estate
Key Chapter Findings
Demand for commercial real estate throughout the Inland Empire is continuing to grow. Despite thisdemand, vacancy rates for office properties were flat over the past year, while retail and industrial prop-erties showed slight increases in vacancy rates. The increases in vacancy rates are due primarily to newstock coming online and should not be interpreted as a sign of contraction in the market.
Industrial properties are fueling growth in the commercial real estate market. Imports and exports han-dled at the ports of Los Angeles and Long Beach are up by 7.7% and 1.4%, respectively, through July 2014from the same period last year, when measured by twenty-foot equivalent units (TEUs). Airport cargoat LAX and Ontario International Airport grew 6.2%, suggesting that Inland Empire industrial propertieswill continue to be in demand.
Nonresidential construction permits are seeing a slight slowdown in growth. Permit values have beenbasically flat, decreasing approximately 0.4% through the first two quarters of 2014, compared with thefirst two quarters of 2013.
Of all types of properties, industrial properties still represent the largest share of planned construction,accounting for 25% as of the second quarter of 2014. Major projects include a new logistics center devel-opment in Rancho Cucamonga and the Palm Distribution Center in the City of San Bernardino.
As was the case in our last report, an oversupply of offices continues to frighten potential builders. Officevacancy rates in the area remain above 20% in most regions within the Inland Empire; however, the ClassA office market is starting to show signs of improvement.
Bright spots in the retail real estate market exist in areas with vacancy rates below the average for theInland Empire, as stores look to position themselves in sub-regions with stronger labor markets.
Overview
Overall, the retail and office markets continue to seegradual improvement as companies slowly fill theheavily discounted spaces and as prospects improvewith the growth of the economy and labormarket. De-velopment remains concentrated in areas with lowervacancy rates, while builders remain cautious in ar-eas with high rates of vacancy. Industrial real estatewill continue to be a driver of growth in the com-mercial market as the Inland Empire proves to be anideal distribution location with its close proximity tothe I-215, I-15, SR-60, SR-91, and I-10 freeways, giv-ing wholesalers, distributors, freight forwarders, andimport-export firms direct access to Ontario Interna-
tional Airport and the ports of Los Angeles and LongBeach. Despite being down 21% from the same timelast year, Industrial permit issuances continue to bethe main driver of the commercial real estate mar-ket. Industrial permits accounted for 25% of all newnonresidential permit activity in the second quarterof 2014, compared with 4% for office permits and 13%for retail. Permit values in 2014 are 3.6% higher thanthis time last year. It’s also important to keep in mindthat 2013 was a blockbuster year for new planned in-dustrial permits—new industrial permit values roseby nearly 170% over 2012. This context helps to ex-plainwhyBeacon Economics remains optimistic aboutthe local industrial market despite the fact that there
58 2014 Riverside/San Bernardino Economic Forecast

Commercial Real Estate
has not been significant growth in new permits thisyear relative to 2013.
0
10
20
30
Shar
e of
Per
mits
by
Type
(%)
0
200
400
600
800
Qua
rterly
Per
mits
($ M
illion
s)
Q1-05 Q3-06 Q1-08 Q3-09 Q1-11 Q3-12 Q1-14
Total Building Permits OfficeRetail Industrial
Source: Construction Industry Research Board
Q1-2004 to Q2-2014Nonresidential Building Permits
Cap rates are continuing to trend upward for bothretail and industrial properties, as investors remainbullish and continue to look for new retail and indus-trial properties to add to their portfolios. Accordingto the National Real Estate Investor (NREI) and bro-kerage Marcus & Millichap, 61% of public and privateinvestors and developers surveyed in the first quarterof 2014 believe it is currently a good time to buy com-mercial properties and plan to increase their invest-ments in the next 12 months, while an additional 22%expect their investments to remain the same. Amongrespondents who expect their real estate investmentto increase, an average 20% increase is predicted. Thefact that investors plan to increase their commercialproperty holdings is a sign of good things to come forthe Inland Empire, which has plenty of these commer-cial properties.
Lending data from California-based banks show thatcommercial construction should continue to grow.Commercial and industrial (C&I) loans outstanding atCalifornia-based banks increased by 11.4% from thesecond quarter of 2013 to the second quarter of 2014,compared with the 4.6% increase for all banks in thenation over the same period. Commercial real estateloans also grew at a faster rate in the state than inthe nation over the same period, at 8.8% and 3.3%, re-
spectively. Construction-specific loans for non-single-family homes (data is grouped for multifamily con-struction with more than four units and nonresiden-tial construction) increased over the year for banks inthe state (up by 19.2%) as well as for banks through-out the nation (up by 7.3%). As California continues tooutpace the nation in lending in these key categories,look for growth in building permits to continue to ac-celerate in the coming years.
Vacancy rates for office, retail, and industrial proper-ties have remained flat or increased from a year ago,but vacancy rates still remain close to their lowestlevel in the last three years.28 Likewise, nonresidentialconstruction permits are seeing a slight slowdown ingrowth. Permit values decreased approximately 3% inthe second quarter of 2014 compared with the thirdquarter of 2013.29 Increases in vacancy rates, cou-pled with a slowdown in the growth of permit values,may seem concerningwhen examined in isolation, butoverall fundamentals are continuing to improve in theInland Empire, and we expect the commercial marketto expand in the coming years. Again, we remain opti-mistic about the local market despite what appears tobe tepid growth because this growth is coming on topof a blockbuster 2013.
Overall building permit figures don’t tell the wholestory for another reason: some pockets of the InlandEmpire have experienced a great deal of building per-mit growth in 2014 when compared with the sametime last year. The southeast and northern regions ofthe Inland Empire in particular have seen a significantamount of building permit growth.
28Commercial real estate data throughout this chapter wereprovided by real-estate research firm Reis Inc. unless otherwisenoted.
29Construction permit data throughout this chapter were pro-vided by the California Homebuilding Foundation, unless other-wise noted.
2014 Riverside/San Bernardino Economic Forecast 59

Commercial Real Estate
Bank Lending Summary
Loan Type California California United States2012 YTD ($) 2013 YTD ($) 2014 YTD ($) (% Change) (% Change)
Number of institutions reporting 227 212 202 -4.83 -2.98Net loans and leases 300,555,964 321,446,621 367,505,589 14.33 3.70Construction and land development 6,997,234 7,065,266 8,647,204 22.39 6.90Commercial real estate 77,363,315 83,626,129 90,986,317 8.80 3.29Multifamily residential real estate 16,464,466 18,769,932 22,372,574 19.19 12.171-4 family residential 104,764,550 106,637,443 126,768,418 18.88 -1.24Farm loans 4,941,938 5,196,320 4,793,563 -7.75 2.16Commercial and industrial loans 61,113,445 66,494,306 74,056,508 11.37 4.63Loans to individuals 15,829,270 16,625,934 17,423,655 4.80 1.27Credit cards 291,316 268,096 236,610 -11.74 -2.06Other revolving credit plans 619,098 579,968 564,044 -2.75 1.34Automobile loans 4,491,113 4,947,061 5,402,170 9.20 6.99Source: FDIC
Total NonresidentialBuilding Permit Values ($ Millions)Location 2013 YTD 2014 YTD
Northern Region 258.6 290.1Mojave Desert Region 15.7 43.2Southeast Region 108.0 193.4Southwest Region 180.7 110.9East Region 124.2 104.3Unincorporated Areas 135.1 77.9Source: Construction Industry Research BoardNote: Year to date through July.
Growth in key industries will also drive growth inthe commercial real estate market moving forward.Wholesale Trade and Transportation and Warehous-ing (two sectors that rely heavily on industrial proper-ties along the supply chain) have seen year-over-yeargross metropolitan product (GMP) growth of 12.9%and 8.1%, respectively. GMP in the Construction sectorin the Inland Empire grew 5.3% over the last year, 190basis points more than the sector for the state overall,a possible indication that the commercial real estatemarket will continue to show signs of improvement.It’s important to note that these sectors are not grow-ing in isolation. The Inland Empire has strong out-
put, employment, and population growth rates. Thesesolid fundamentals will drive business activity andencourage demand for commercial real estate in theshort term.
The Riverside-San Bernardino OfficeMarket
Over the past year the office market in the Inland Em-pire has seen negligible improvement. In fact, just bylooking at official top-level figures, 2014 looks almostidentical to 2013. Vacancy rates remained above 20%,at 23.6%, in the second quarter of 2014, unchangedfrom the same quarter a year earlier; office rents areup a mere 13 basis points, to $21.41 per square footduring the second quarter of 2013, compared with$21.29 from the same quarter in 2013; and there hasbeen only 28,000 square feet of net absorption over thepast year.
Until somenoticeable uptick in net absorptionmateri-alizes, the office market will most likely remain moresluggish than the retail or industrialmarkets. High va-cancy rates in the Inland Empire relative to neighbor-
60 2014 Riverside/San Bernardino Economic Forecast

Commercial Real Estate
ing areas are continually proving to be a strong disin-centive to would-be developers.
-2,000
-1,000
0
1,000
Thou
sand
s of
Sq.
Ft.
Q1-08 Q3-09 Q1-11 Q3-12 Q1-14
Riverside-San Bernardino MSA Los Angeles CountyOrange County San Diego County
Source: REIS
Selected Counties, Q1-08 to Q2-14Office Net Absorptions
However, top line numbers don’t always tell thewholestory, and this is certainly true for the Inland Empire’soffice market. While the overall region seems to dis-play little sign of improvement, there are parts of theregion showing signs of growth; this will be discussedin more detail later in this section.
Office rents are highly discounted in theInland Empire
Moreover, there are some variations among the dif-ferent types of office space. While this picture of theInland Empire officemarket—with high vacancy rates,muted development, and low net absorption—holdstrue in general for all office space, the Class A mar-ket has fared slightly better than the Class B and ClassC space.
24
26
28
30
32
Vaca
ncy
Rate
(%)
24
25
26
27
Rent
per
sq.
/ft. (
$)
Q1-09
Q3-09
Q1-10
Q3-10
Q1-11
Q3-11
Q1-12
Q3-12
Q1-13
Q3-13
Q1-14
Asking Price Vacancy Rate
Source: Reis, Inc.
Q1-09 to Q2-14Office - Class A
Office rents are highly discounted in the Inland Em-pire relative to other nearby areas, such as Los Ange-les, Orange, and San Diego Counties. Rather than con-verging, rents are continuing to grow faster in theseother areas relative to the local market, with rents inLos Angeles, Orange, and San Diego Counties growingbetween 3.0% and 3.8% over the past year, comparedwith 0.6% for the Inland Empire.
16
18
20
22
24
Vaca
ncy
Rate
(%)
16
17
18
19
Rent
per
sq.
/ft. (
$)
Q1-09
Q3-09
Q1-10
Q3-10
Q1-11
Q3-11
Q1-12
Q3-12
Q1-13
Q3-13
Q1-14
Asking Price Vacancy Rate
Source: Reis, Inc.
Q1-09 to Q2-14Office - Class BC
This discount has not yet translated into a broad im-provement in overall vacancy rates and net absorp-tion, but it could very well be benefiting the mar-ket for Class A office space. While higher in abso-lute terms, vacancy rates in Class A office space haveshown a much stronger downward trend when com-pared to rates in Class B and Class C office space.
2014 Riverside/San Bernardino Economic Forecast 61
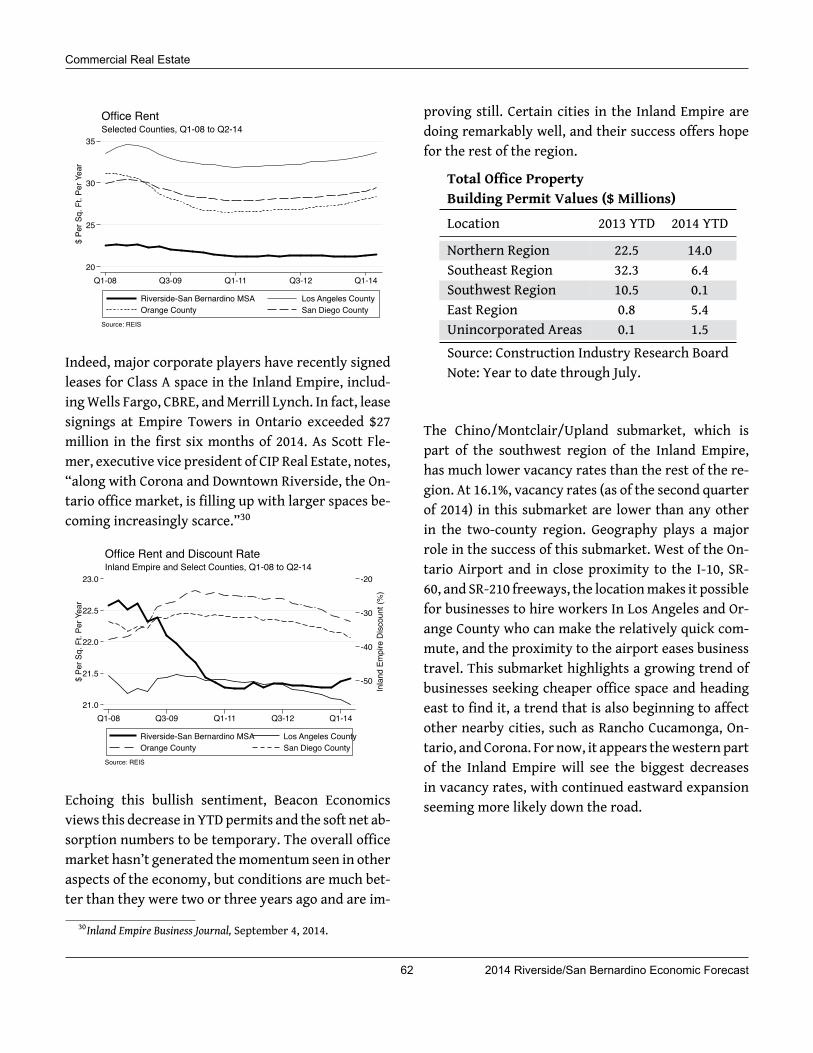
Commercial Real Estate
20
25
30
35
$ Pe
r Sq.
Ft.
Per Y
ear
Q1-08 Q3-09 Q1-11 Q3-12 Q1-14
Riverside-San Bernardino MSA Los Angeles CountyOrange County San Diego County
Source: REIS
Selected Counties, Q1-08 to Q2-14Office Rent
Indeed, major corporate players have recently signedleases for Class A space in the Inland Empire, includ-ingWells Fargo, CBRE, andMerrill Lynch. In fact, leasesignings at Empire Towers in Ontario exceeded $27million in the first six months of 2014. As Scott Fle-mer, executive vice president of CIP Real Estate, notes,“along with Corona and Downtown Riverside, the On-tario office market, is filling up with larger spaces be-coming increasingly scarce.”30
-50
-40
-30
-20
Inla
nd E
mpi
re D
iscou
nt (%
)
21.0
21.5
22.0
22.5
23.0
$ Pe
r Sq.
Ft.
Per Y
ear
Q1-08 Q3-09 Q1-11 Q3-12 Q1-14
Riverside-San Bernardino MSA Los Angeles CountyOrange County San Diego County
Source: REIS
Inland Empire and Select Counties, Q1-08 to Q2-14Office Rent and Discount Rate
Echoing this bullish sentiment, Beacon Economicsviews this decrease in YTDpermits and the soft net ab-sorption numbers to be temporary. The overall officemarket hasn’t generated themomentum seen in otheraspects of the economy, but conditions are much bet-ter than they were two or three years ago and are im-
30Inland Empire Business Journal, September 4, 2014.
proving still. Certain cities in the Inland Empire aredoing remarkably well, and their success offers hopefor the rest of the region.
Total Office PropertyBuilding Permit Values ($ Millions)Location 2013 YTD 2014 YTD
Northern Region 22.5 14.0Southeast Region 32.3 6.4Southwest Region 10.5 0.1East Region 0.8 5.4Unincorporated Areas 0.1 1.5Source: Construction Industry Research BoardNote: Year to date through July.
The Chino/Montclair/Upland submarket, which ispart of the southwest region of the Inland Empire,has much lower vacancy rates than the rest of the re-gion. At 16.1%, vacancy rates (as of the second quarterof 2014) in this submarket are lower than any otherin the two-county region. Geography plays a majorrole in the success of this submarket. West of the On-tario Airport and in close proximity to the I-10, SR-60, and SR-210 freeways, the locationmakes it possiblefor businesses to hire workers In Los Angeles and Or-ange County who can make the relatively quick com-mute, and the proximity to the airport eases businesstravel. This submarket highlights a growing trend ofbusinesses seeking cheaper office space and headingeast to find it, a trend that is also beginning to affectother nearby cities, such as Rancho Cucamonga, On-tario, and Corona. For now, it appears thewestern partof the Inland Empire will see the biggest decreasesin vacancy rates, with continued eastward expansionseeming more likely down the road.
62 2014 Riverside/San Bernardino Economic Forecast
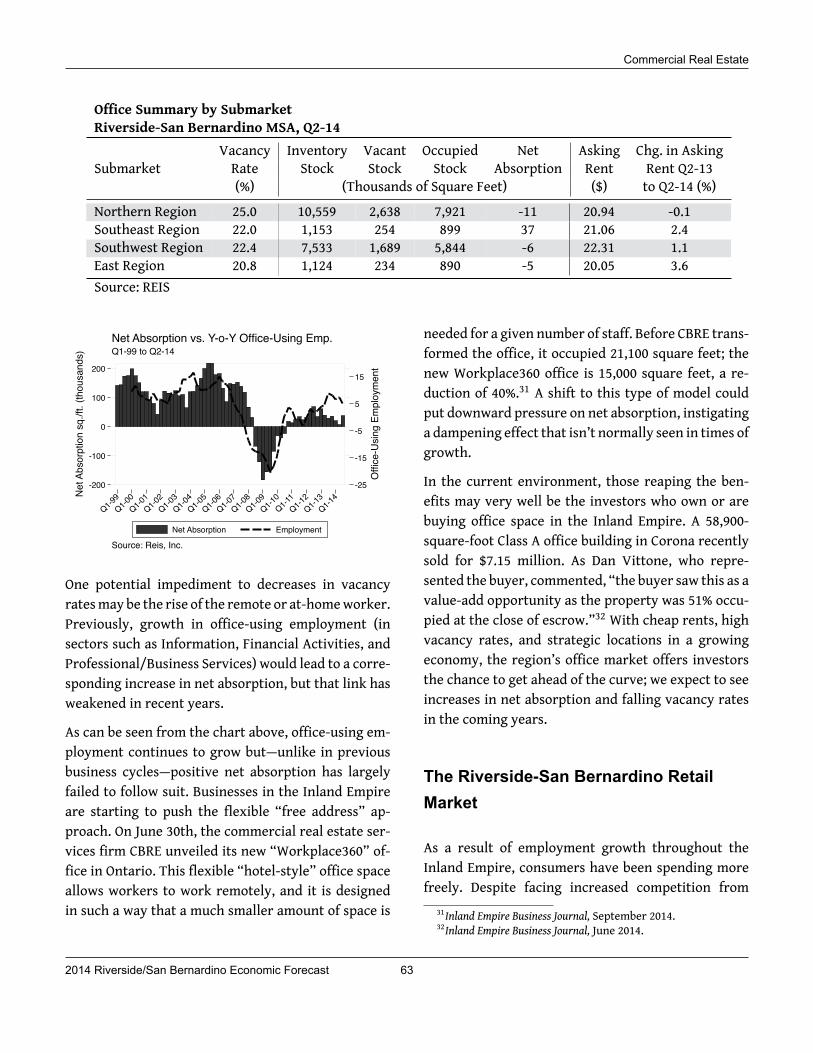
Commercial Real Estate
Office Summary by SubmarketRiverside-San Bernardino MSA, Q2-14
SubmarketVacancy Inventory Vacant Occupied Net Asking Chg. in AskingRate Stock Stock Stock Absorption Rent Rent Q2-13(%) (Thousands of Square Feet) ($) to Q2-14 (%)
Northern Region 25.0 10,559 2,638 7,921 -11 20.94 -0.1Southeast Region 22.0 1,153 254 899 37 21.06 2.4Southwest Region 22.4 7,533 1,689 5,844 -6 22.31 1.1East Region 20.8 1,124 234 890 -5 20.05 3.6Source: REIS
-25
-15
-5
5
15O
ffice
-Usin
g Em
ploy
men
t
-200
-100
0
100
200
Net A
bsor
ptio
n sq
./ft.
(thou
sand
s)
Q1-99Q1-0
0Q1-0
1Q1-0
2Q1-0
3Q1-0
4Q1-0
5Q1-0
6Q1-0
7Q1-0
8Q1-0
9Q1-1
0Q1-1
1Q1-1
2Q1-1
3Q1-1
4
Net Absorption Employment
Source: Reis, Inc.
Q1-99 to Q2-14Net Absorption vs. Y-o-Y Office-Using Emp.
One potential impediment to decreases in vacancyratesmay be the rise of the remote or at-homeworker.Previously, growth in office-using employment (insectors such as Information, Financial Activities, andProfessional/Business Services) would lead to a corre-sponding increase in net absorption, but that link hasweakened in recent years.
As can be seen from the chart above, office-using em-ployment continues to grow but—unlike in previousbusiness cycles—positive net absorption has largelyfailed to follow suit. Businesses in the Inland Empireare starting to push the flexible “free address” ap-proach. On June 30th, the commercial real estate ser-vices firm CBRE unveiled its new “Workplace360” of-fice in Ontario. This flexible “hotel-style” office spaceallows workers to work remotely, and it is designedin such a way that a much smaller amount of space is
needed for a given number of staff. Before CBRE trans-formed the office, it occupied 21,100 square feet; thenew Workplace360 office is 15,000 square feet, a re-duction of 40%.31 A shift to this type of model couldput downward pressure on net absorption, instigatinga dampening effect that isn’t normally seen in times ofgrowth.
In the current environment, those reaping the ben-efits may very well be the investors who own or arebuying office space in the Inland Empire. A 58,900-square-foot Class A office building in Corona recentlysold for $7.15 million. As Dan Vittone, who repre-sented the buyer, commented, “the buyer saw this as avalue-add opportunity as the property was 51% occu-pied at the close of escrow.”32 With cheap rents, highvacancy rates, and strategic locations in a growingeconomy, the region’s office market offers investorsthe chance to get ahead of the curve; we expect to seeincreases in net absorption and falling vacancy ratesin the coming years.
The Riverside-San Bernardino RetailMarket
As a result of employment growth throughout theInland Empire, consumers have been spending morefreely. Despite facing increased competition from
31Inland Empire Business Journal, September 2014.32Inland Empire Business Journal, June 2014.
2014 Riverside/San Bernardino Economic Forecast 63

Commercial Real Estate
e-commerce companies, brick-and-mortar retailershave seen a fair amount of recent success. In fact, justthis month, both Kohl’s and Walmart promised bigstaff increases for the holidays. Walmart in particu-lar expects to hire 10%more holidayworkers this yearthan last year.33 During the first half of 2014, retailpermits have grown in both Southern California andthe state as a whole.
Over the course of the past few years, the retailmarketin the Inland Empire has improved at amoderate pace.This trend has continued so far in 2014; year-to-datebuilding permits for the Inland Empire have increasedby 41.3% over the same period a year ago. The Countyof San Bernardino is driving this growth, with permitsin the county growing 88% when compared with thefirst two quarters of 2013. Retail permit values haveincreased 37.0% in California, compared with 138.5%and 52.3% for Orange County and Los Angeles County,respectively.
Year-to-date building permits for the InlandEmpire have increased by 41.3% over the
same period a year ago.
Total Retail PropertyBuilding Permit Values ($ Millions)Location 2013 YTD 2014 YTD
Northern Region 28.6 104.3Mojave Desert Region 2.0 2.2Southeast Region 2.9 23.5Southwest Region 29.6 9.9East Region 11.5 7.8Unincorporated Areas 40.3 14.4Source: Construction Industry Research BoardNote: Year to date through July.
33Debra Gruszecki, ”Kohl’s, Wal-Mart Promise Big Staff-Up forHoliday,” The Press-Enterprise, September 18, 2014, available athttp://www.pe.com/articles/holiday-750233-season-hire.html.
Over the course of the past few years, theretail market in the Inland Empire has
improved at a moderate pace.
The northern region, comprising Rancho Cucamonga,Ontario, Fontana, Redlands, and several other sur-rounding areas, has grown the most year to date,increasing 264.7% versus the same period in 2013.The strong uptick in retail permits for both SanBernardino County and the northern region of the In-land Empire can in large part be traced to retail per-mits in Rancho Cucamonga. During the first half of2013, Rancho Cucamonga had no retail building per-mit development, but so far this year retail permit val-ues in the city have totaled $69.2 million.
Two retail projects approved in July for Rancho Cu-camonga comprise the $69.2 million in permits. Sincethese projects are so new, little is known about them.One of the Rancho Cucamonga retail projects is val-ued at $42 million, while the other project is val-ued at $27.2 million.34 The southwest region has seenthe largest year-to-date decline, owing primarily toslowdowns in retail permits in the Cities of River-side and Chino. During the first half of last year, bothcities had a combined $ 29.1 million in permits, com-pared with only $5.4 million this year. Nevertheless,both Riverside and Chino are cities with improving re-tail markets and should continue to foster growth inthe southwest region in the future—2013 was a greatyear for retail permits and the continueddevelopmentgives us reason to remain optimistic.
2013 was a great year for retail permits andthe continued development gives us reason
to remain optimistic.
34 See the July 2014 California Construction Review producedby the California Homebuilding Foundation.
64 2014 Riverside/San Bernardino Economic Forecast

Commercial Real Estate
Retail Summary by SubmarketRiverside-San Bernardino MSA, Q2-14
SubmarketVacancy Inventory Vacant Occupied Net Asking Chg. in AskingRate Stock Stock Stock Absorption Rent Rent Q2-14(%) (Thousands of Square Feet) ($) to Q2-14 (%)
Northern Region 9.8 19,248 1,894 17,354 28 20.25 1.2Mojave Desert Region 9.6 4,433 424 4,009 -9 16.38 0.2Southeast Region 9.6 9,169 881 8,288 -10 20.84 1.6Southwest Region 7.2 10,241 733 9,508 -12 20.78 2.1East Region 15.3 7,761 1,188 6,573 31 25.64 3.4Source: REIS
2
4
6
8
10
Perc
ent
Q1-08 Q3-09 Q1-11 Q3-12 Q1-14
Riverside-San Bernardino MSA Los Angeles CountyOrange County San Diego County
Source: REIS
Selected Counties, Q1-08 to Q2-14Retail Vacancy Rate
Net absorption in the Inland Empire decreased for re-tail properties over the past year. Indeed, despite solidbuilding permit growth, the Inland Empire is having amuch harder time filling vacant space in comparisonwith San Diego, Los Angeles, and Orange Counties, allof which have seen positive net absorption over thepast year. Vacancy rates ticked up 20 basis points overthe last year due to the negative net absorption.Mean-while, Los Angeles and Orange County vacancy ratesfell by 20 basis points.
-400
-200
0
200
400
Thou
sand
s of
Sq.
Ft.
Q1-08 Q3-09 Q1-11 Q3-12 Q1-14
Riverside-San Bernardino MSA Los Angeles CountyOrange County San Diego County
Source: REIS
Selected Counties, Q1-08 to Q2-14Retail Net Absorption
Positive net absorption in the east region is a goodsign, as the region maintains a much higher retailvacancy rate than seen in other Inland Empire re-gions—more than double the vacancy rate in thesouthwest region. This positive absorption is due inpart to the efforts and abilities of some cities in theeast, like Palm Springs and Rancho Mirage, to betterbrand themselves as vacation destinations and betteraugment existinghotels and restaurants. For example,the lobby of the Hard Rock Hotel in Palm Springs hasbeen awarded the 2014 Gold Magellan Award for out-standing design.35
In the City of San Bernardino, a rare development op-portunity has come onto the market at a 1,900-acre
35Debra Gruszecki, “Hard Rock Hotel’s Lobby Lauded,”The Press-Enterprise, September 19, 2014, available athttp://www.pe.com/articles/hotel-750297-hard-rock.html.
2014 Riverside/San Bernardino Economic Forecast 65

Commercial Real Estate
resort. The City of San Bernardino has already ap-proved development of an additional 808,000 squarefeet of commercial space, of which 200,000 will beretail shops and restaurants, while another 200,000square feet will be for a new 300-room hotel.36 Bea-con Economics maintains that in the near term the ar-eas of the Inland Empire that will see the largest in-creases in net absorption will be the higher-incomewestern areas and the heavily tourism-oriented areaslike Cabazon, but it is encouraging to see pockets ofpositive net absorption across the Inland Empire.
20
25
30
35
$ Pe
r Sq.
Ft.
Per Y
ear
Q1-08 Q3-09 Q1-11 Q3-12 Q1-14
Riverside-San Bernardino MSA Los Angeles CountyOrange County San Diego County
Source: REIS
Selected Counties, Q1-08 to Q2-14Retail Rent
-50
-45
-40
-35
-30
Inla
nd E
mpi
re D
iscou
nt (%
)
20.5
21.0
21.5
22.0
22.5
$ Pe
r Sq.
Ft.
Per Y
ear
Q1-08 Q3-09 Q1-11 Q3-12 Q1-14
Riverside-San Bernardino MSA Los Angeles CountyOrange County San Diego County
Source: REIS
Inland Empire and Select Counties, Q1-08 to Q2-14Retail Rent and Discount Rate
Year-over-year retail rents have increased 1.8%, yetthese became further discounted relative to Los An-geles and San Diego Counties, where rents grew byevenmore. Although it has yet to fullymaterialize into
36Inland Empire Business Journal,May 2014.
strong increases in net absorption, the heavily dis-counted prices in the Inland Empire should continueto remain attractive to businesses looking to capitalizeon the region’s strong population growth and increas-ingly wealthy and educated population.
Currently it appears that overall, food and beverageretailers are driving the success in the retail sector.In downtownRiverside, 10 restaurants have opened inthe last 24 months.37 According to Bart Watson, staffeconomist for the Brewers Association, almost all ofthe breweries in Riverside and San Bernardino Coun-ties have opened in the past few years.38 This trendcan be seen all over the Inland Empire. From two newtaquerias in Hemet, to a new farm-to-table restaurantin Corona, the new restaurants indicate that as thepopulation grows and incomes increase in the InlandEmpire, success in the retail market will follow suit.39
The Riverside-San Bernardino IndustrialMarket
The commercial real estatemarket has been bolsteredby the industrial sector, which often grows in tandemwith an increase in trade flows. Industrial propertiesthat support nearby seaports and airports have seenincreased demand in recent years. The San Pedro Baytwin ports have experienced a 2.4% increase in TEUshandled year to date through July 2013 from a yearago, but a much bigger factor has been the sustainedtrade growth since 1995—the number of TEUs handled
37Laurie Lucas, “City Relishing a Restaurant Boom,”The Press-Enterprise, September 10, 2014, available athttp://www.pe.com/articles/riverside-749795-restaurant-square.html.
38David Olson, “Inland Area Experiencing a Beer Renaissance,”August 25, 2014, available at http://www.pe.com/articles/beer-748788-craft-breweries.html.
39“Two Restaurants to Check Out,” The Press-Enterprise,August 19, 2014, available at http://www.pe.com/articles/-747135--.html, and “Blackburn’s Farm to Table Opens inCorona,” The Press-Enterprise, August 19, 2014, available athttp://www.pe.com/articles/-747675--.html.
66 2014 Riverside/San Bernardino Economic Forecast

Commercial Real Estate
has jumped from 5million TEUs in 1995 to over 14mil-lion TEUs in 2012.
A surge in demand for industrial real estate in theInland Empire has occurred over the past few years.This demand has been a primary driver of growth inthe industrial market as the Inland Empire proves tobe an ideal distribution location, with its close prox-imity to the I-215, I-15, SR-60, SR-91, and I-10 free-ways and with direct access to Ontario InternationalAirport and the ports of Los Angeles and Long Beach.According to Colliers Senior Executive Vice PresidentKevin Mckenna, demand for industrial buildings hassurged for e-commerce companies and retailers whohave witnessed unprecedented growth in online pur-chasing.40 Companies that have recently located orexpanded their operations to the Inland Empire in-clude Amazon, Home Depot, Kohl’s, Unilever, FedEx,and Pepsi.41
Large distribution buildings in the InlandEmpire continue to be in strong demand.
-4,000
-2,000
0
2,000
4,000
Thou
sand
s of
Sq.
Ft.
Q1-10 Q1-11 Q1-12 Q1-13 Q1-14
Riverside-San Bernardino MSA Los Angeles CountyOrange County San Diego County
Source: REIS
Selected Counties, Q1-10 to Q2-14Industrial Net Absorptions: Warehouse & Dist. Ctr.
Despite a large increase in net absorption of 7.8 mil-lion square feet over the past year, the vacancy ratefor industrial property actually increased ever soslightly, to 10.6% in the second quarter of 2014 from
40Inland Empire Business Journal, July 2014.41Inland Empire Business Journal, July 2014.
10.5% in the second quarter of 2013. Part of this uptickin vacancy is due to new stock coming online after thelarge increase in new industrial permits in 2013. An-other explanation of this dynamic considers the cur-rent makeup of the industrial properties in the InlandEmpire compared to the type of property that fits theneeds of the companies moving into the area.
6
8
10
12
14
16
Perc
ent
Q1-10 Q1-11 Q1-12 Q1-13 Q1-14
Riverside-San Bernardino MSA Los Angeles CountyOrange County San Diego County
Source: REIS
Selected Counties, Q1-10 to Q2-14Warehouse & Distribution Ctr. Vacancy Rate
Much of the vacant industrial property in the InlandEmpire is vacant simply because it isn’t large enoughto meet the needs of the businesses operating in thearea; most of the new stock coming online is for prop-erties that are 500,000 square feet and larger. So,as large industrial properties flourish, smaller onesare left unused, explaining the relatively constant va-cancy rates in the market over the past year. Indeed,according to Jay Dick, CBRE’s senior vice president,“Large distribution buildings in the Inland Empirecontinue to be in strong demand. The vacancy rate forbuildings over 500k square feet in the Western InlandEmpire at the end of the first quarter of 2014 was just1.8%.”42
Demand for industrial buildings has surgedfor e-commerce companies and retailers whohave witnessed unprecedented growth in
online purchasing.
42Inland Empire Business Journal, June 2014.
2014 Riverside/San Bernardino Economic Forecast 67
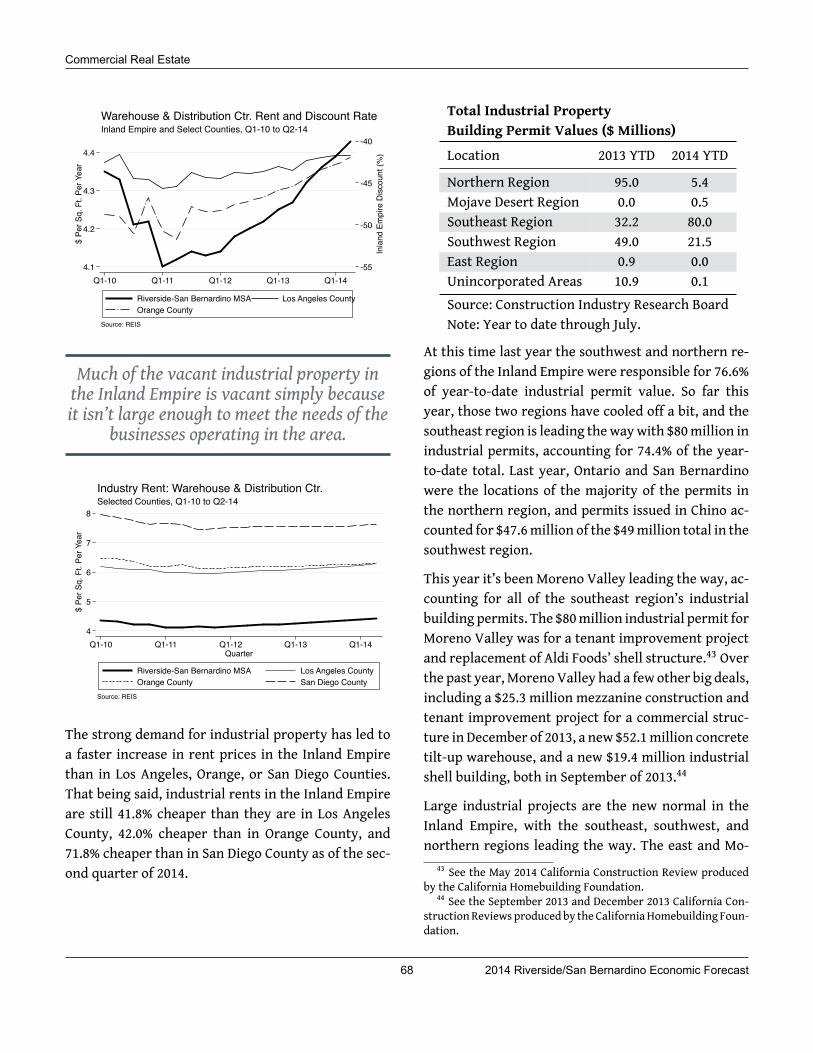
Commercial Real Estate
-55
-50
-45
-40
Inla
nd E
mpi
re D
iscou
nt (%
)
4.1
4.2
4.3
4.4
$ Pe
r Sq.
Ft.
Per Y
ear
Q1-10 Q1-11 Q1-12 Q1-13 Q1-14
Riverside-San Bernardino MSA Los Angeles CountyOrange County
Source: REIS
Inland Empire and Select Counties, Q1-10 to Q2-14Warehouse & Distribution Ctr. Rent and Discount Rate
Much of the vacant industrial property inthe Inland Empire is vacant simply becauseit isn’t large enough to meet the needs of the
businesses operating in the area.
4
5
6
7
8
$ Pe
r Sq.
Ft.
Per Y
ear
Q1-10 Q1-11 Q1-12 Q1-13 Q1-14Quarter
Riverside-San Bernardino MSA Los Angeles CountyOrange County San Diego County
Source: REIS
Selected Counties, Q1-10 to Q2-14Industry Rent: Warehouse & Distribution Ctr.
The strong demand for industrial property has led toa faster increase in rent prices in the Inland Empirethan in Los Angeles, Orange, or San Diego Counties.That being said, industrial rents in the Inland Empireare still 41.8% cheaper than they are in Los AngelesCounty, 42.0% cheaper than in Orange County, and71.8% cheaper than in San Diego County as of the sec-ond quarter of 2014.
Total Industrial PropertyBuilding Permit Values ($ Millions)Location 2013 YTD 2014 YTD
Northern Region 95.0 5.4Mojave Desert Region 0.0 0.5Southeast Region 32.2 80.0Southwest Region 49.0 21.5East Region 0.9 0.0Unincorporated Areas 10.9 0.1Source: Construction Industry Research BoardNote: Year to date through July.
At this time last year the southwest and northern re-gions of the Inland Empire were responsible for 76.6%of year-to-date industrial permit value. So far thisyear, those two regions have cooled off a bit, and thesoutheast region is leading thewaywith $80million inindustrial permits, accounting for 74.4% of the year-to-date total. Last year, Ontario and San Bernardinowere the locations of the majority of the permits inthe northern region, and permits issued in Chino ac-counted for $47.6million of the $49million total in thesouthwest region.
This year it’s been Moreno Valley leading the way, ac-counting for all of the southeast region’s industrialbuilding permits. The $80million industrial permit forMoreno Valley was for a tenant improvement projectand replacement of Aldi Foods’ shell structure.43 Overthe past year,MorenoValley had a few other big deals,including a $25.3 million mezzanine construction andtenant improvement project for a commercial struc-ture in December of 2013, a new $52.1million concretetilt-up warehouse, and a new $19.4 million industrialshell building, both in September of 2013.44
Large industrial projects are the new normal in theInland Empire, with the southeast, southwest, andnorthern regions leading the way. The east and Mo-
43 See the May 2014 California Construction Review producedby the California Homebuilding Foundation.
44 See the September 2013 and December 2013 California Con-structionReviews produced by the CaliforniaHomebuilding Foun-dation.
68 2014 Riverside/San Bernardino Economic Forecast

Commercial Real Estate
Industrial Summary by SubmarketRiverside-San Bernardino MSA, Q2-14
SubmarketVacancy Inventory Vacant Occupied Net Asking Chg. in AskingRate Stock Stock Stock Absorption Rent Rent Q2-13(%) (Thousands of Square Feet) ($) to Q2-14 (%)
Warehouses and Distribution CentersNorthern Region 9.2 210,194 19,409 190,785 940 4.15 2.5Mojave Desert Region 16.3 9,361 1,529 7,832 -33 3.98 0.3Southeast Region 15.8 19,724 3,123 16,601 342 4.53 1.7Southwest Region 10.9 47,665 5,176 42,489 343 5.16 1.6East Region 9.3 3,701 346 3,355 47 4.75 0.8
Flex/Research and DevelopmentNorthern Region 9.1 12,204 1,105 11,099 -71 7.64 -0.2Mojave Desert Region 34.2 319 109 210 -3 8.57 -0.1Southeast Region 19.7 3,646 717 2,929 -5 6.99 0.2Southwest Region 26.8 3,628 972 2,656 14 6.87 0.3East Region 19.1 2,444 467 1,977 22 7.75 0.3Source: REIS
jave Desert regions are continuing to struggle, ac-counting for just $900,000 in industrial permits in thefirst half of last year and $500,000 so far this year.
For all the recent industrial development in the south-east and southwest regions, it may come as a surprisethat vacancy rates in those regions are higher thanin the east region, where industrial development hasbeen scarce. This circles back to the analysis madeearlier in this section—the need for large industrialstructures is driving permit growth in these areas;vacancy rates are remaining high because businessesdon’t have use for the smaller industrial properties inthose regions. Overall, the high demand for large in-dustrial properties looks to remain intact in the shortterm as companies continue to take advantage of thegeographic and cost advantages the Inland Empiremarket offers.
2014 Riverside/San Bernardino Economic Forecast 69

Commercial Real Estate
Charts and Tables
Nonresidential ConstructionBuilding Permit Values ($ Millions)Location 2008 2009 2010 2011 2012 2013 2013YTD 2014YTD
TotalRiverside 1,022.4 391.0 544.4 588.2 574.3 767.0 424.7 413.9San Bernardino 763.4 337.3 255.4 364.3 556.2 691.8 375.6 363.7Los Angeles 4,564.7 2,695.4 2,721.3 3,079.8 3,518.8 3,851.0 2,166.8 3,541.1Orange 1,424.6 982.1 1,138.5 1,279.9 1,191.4 1,375.6 795.6 1,128.6California 19,211.6 10,866.3 11,199.8 13,061.1 13,878.0 20,782.0 11,353.3 13,234.6
OfficeRiverside 174.8 69.4 144.8 16.5 232.7 232.6 113.8 274.2San Bernardino 33.2 8.2 7.0 1.2 16.4 26.8 23.1 15.5Los Angeles 446.9 184.8 102.9 181.9 176.7 277.1 157.0 177.1Orange 127.6 6.5 101.9 74.7 611.2 414.7 394.4 49.8California 2,014.4 511.1 626.6 672.1 1,451.1 1,455.9 659.0 1,117.9
RetailRiverside 335.6 54.4 146.5 208.0 85.5 108.6 56.5 75.1San Bernardino 243.4 33.9 26.7 57.6 102.3 128.4 60.1 113.1Los Angeles 480.0 205.9 274.1 235.6 146.3 384.1 188.6 315.9Orange 164.0 68.2 52.7 77.6 32.3 329.4 240.3 268.8California 2,811.5 936.0 895.9 956.0 915.9 2,064.1 1,091.2 1,494.9Industrial
Riverside 138.1 32.1 0.9 6.4 77.7 671.9 349.4 307.9San Bernardino 129.9 40.5 16.3 32.6 218.7 444.8 254.0 42.5Los Angeles 145.6 62.6 78.9 111.6 169.8 302.6 215.9 65.1Orange 14.2 0.0 23.0 10.3 102.6 47.4 10.5 66.6California 938.1 359.9 358.3 478.9 1,407.9 1,044.9 499.1 442.1Alterations
Riverside 277.6 171.0 248.1 287.0 186.4 401.5 214.7 230.7San Bernardino 223.3 157.5 139.3 197.3 222.5 214.3 115.8 127.0Los Angeles 2,191.5 1,690.4 1,651.6 1,768.5 2,164.8 2,151.9 1,253.8 1,664.2Orange 796.4 667.4 732.3 884.5 750.9 894.7 524.6 588.4California 8,776.3 6,602.1 6,913.9 8,144.5 7,799.2 9,408.2 5,739.6 6,866.8Source: Construction Industry Research BoardNote: Year to date through July.
70 2014 Riverside/San Bernardino Economic Forecast

Commercial Real Estate
Total NonresidentialBuilding Permit Values ($ Millions)Location 2013 YTD 2014 YTD
Northern Region 258.6 290.1Big Bear Lake 0.0 0.0Colton 5.5 1.5Fontana 26.8 20.4Grand Terrace 0.1 4.3Highland 4.2 0.4Loma Linda 1.5 89.9Montclair 5.1 11.3Ontario 72.3 40.1Rancho Cucamonga 24.1 77.1Redlands 10.4 25.3Rialto 0.0 0.0San Bernardino 102.4 13.2Upland 0.4 0.6Yucaipa 5.8 5.8
Mojave Desert Region 15.7 43.2Adelanto 0.2 5.6Apple Valley 2.5 4.3Barstow 1.7 11.8Hesperia 2.5 1.6Needles 1.0 2.7Victorville 7.8 17.2
Southeast Region 108.0 193.4Banning 0.4 1.8Beaumont 19.1 4.6Calimesa 0.0 0.1Canyon Lake 1.8 0.1Hemet 0.4 3.0Lake Elsinore 1.2 2.2Menifee 0.4 7.3Moreno Valley 4.4 132.0Murrieta 11.6 16.9Perris 47.2 0.7San Jacinto 2.9 2.3Temecula 14.4 19.2Wildomar 4.3 3.2
Southwest Region 180.7 110.9Chino 72.1 8.6Chino Hills 1.5 5.4Corona 22.0 29.0Eastvale 7.7 8.0Jurupa Valley 0.3 18.7Norco 0.9 6.8Riverside 76.2 34.5
East Region 124.2 104.3Blythe 5.0 2.1Cathedral City 5.3 3.2Coachella 3.9 1.0Desert Hot Springs 1.2 10.2Indian Wells 21.3 9.7Indio 9.4 22.2La Quinta 2.6 6.6Palm Desert 32.8 15.6Palm Springs 11.0 16.6Rancho Mirage 28.5 10.8Twentynine Palms 0.8 1.0Yucca Valley 2.5 5.2
Unincorporated Areas 135.1 77.9Riverside County 94.8 45.2San Bernardino County 40.3 32.8Source: Construction Industry Research BoardNote: Year to date through July.
Total Alterations and RenovationsBuilding Permit Values ($ Millions)Location 2013 YTD 2014 YTD
Northern Region 100.9 91.9Big Bear Lake 0.0 0.0Colton 0.0 1.3Fontana 20.4 13.2Grand Terrace 0.1 3.4Highland 0.5 0.4Loma Linda 0.5 6.0Montclair 5.1 11.3Ontario 14.6 32.2Rancho Cucamonga 12.6 5.3Redlands 1.9 1.6Rialto 0.0 0.0San Bernardino 41.2 11.5Upland 0.4 0.5Yucaipa 3.6 5.1
Mojave Desert Region 12.6 29.3Adelanto 0.1 4.8Apple Valley 1.4 3.8Barstow 1.5 11.2Hesperia 2.3 1.4Needles 0.9 2.5Victorville 6.4 5.6
Southeast Region 34.3 55.8Banning 0.4 1.8Beaumont 1.9 3.9Calimesa 0.0 0.1Canyon Lake 1.7 0.0Hemet 0.4 2.9Lake Elsinore 0.8 1.8Menifee 0.4 5.0Moreno Valley 3.3 14.3Murrieta 11.0 12.0Perris 0.0 0.7San Jacinto 2.0 2.2Temecula 8.1 8.1Wildomar 4.2 3.1
Southwest Region 74.8 74.3Chino 7.8 6.7Chino Hills 1.5 3.4Corona 22.0 20.7Eastvale 7.0 6.1Jurupa Valley 0.2 2.6Norco 0.9 6.8Riverside 35.4 28.0
East Region 85.7 81.9Blythe 0.8 2.0Cathedral City 2.0 2.0Coachella 0.7 0.8Desert Hot Springs 1.1 9.2Indian Wells 3.0 8.5Indio 4.6 12.4La Quinta 2.6 2.3Palm Desert 29.7 14.3Palm Springs 11.0 16.6Rancho Mirage 27.9 9.4Twentynine Palms 0.7 1.0Yucca Valley 1.5 3.5
Unincorporated Areas 77.3 38.0Riverside County 67.5 31.0San Bernardino County 9.8 7.1Source: Construction Industry Research BoardNote: Year to date through July.
2014 Riverside/San Bernardino Economic Forecast 71

Commercial Real Estate
Total Office PropertyBuilding Permit Values ($ Millions)Location 2013 YTD 2014 YTD
Northern Region 22.5 14.0Fontana 0.2 0.9Highland 3.1 0.0Loma Linda 0.0 11.5Montclair 0.0 0.0Ontario 4.0 0.0Rancho Cucamonga 7.9 0.7Redlands 5.6 0.0San Bernardino 0.0 0.9Yucaipa 1.7 0.0
Southeast Region 32.3 6.4Beaumont 17.0 0.0Perris 14.7 0.0Temecula 0.6 6.4
Southwest Region 10.5 0.1Chino 0.5 0.0Eastvale 0.0 0.1Riverside 10.0 0.0
East Region 0.8 5.4Cathedral City 0.7 0.0Coachella 0.0 0.0Indio 0.0 5.4
Unincorporated Areas 0.1 1.5San Bernardino County 0.1 1.5Source: Construction Industry Research BoardNote: Year to date through July.
Total Retail PropertyBuilding Permit Values ($ Millions)Location 2013 YTD 2014 YTD
Northern Region 28.6 104.3Colton 0.0 0.2Fontana 0.0 5.9Grand Terrace 0.0 0.9Highland 0.6 0.0Loma Linda 0.9 0.0Ontario 19.4 3.5Rancho Cucamonga 0.0 69.2Redlands 2.9 23.7San Bernardino 4.3 0.7Yucaipa 0.4 0.4
Mojave Desert Region 2.0 2.2Adelanto 0.0 0.8Apple Valley 0.6 0.0Barstow 0.1 0.6Victorville 1.3 0.9
Southeast Region 2.9 23.5Beaumont 0.0 0.3Lake Elsinore 0.4 0.0Menifee 0.0 2.2Moreno Valley 0.7 19.8Murrieta 0.4 1.2Perris 0.2 0.0San Jacinto 0.6 0.1Temecula 0.5 0.0
Southwest Region 29.6 9.9Chino 14.0 0.0Chino Hills 0.0 0.8Corona 0.0 3.3Eastvale 0.5 0.5Riverside 15.1 5.4
East Region 11.5 7.8Blythe 3.7 0.0Cathedral City 2.6 1.2Coachella 0.8 0.0Indio 0.4 1.0La Quinta 0.0 2.8Palm Desert 3.1 1.3Yucca Valley 0.9 1.5
Unincorporated Areas 40.3 14.4Riverside County 25.7 10.2San Bernardino County 14.6 4.2Source: Construction Industry Research BoardNote: Year to date through July.
72 2014 Riverside/San Bernardino Economic Forecast

Commercial Real Estate
Total Industrial PropertyBuilding Permit Values ($ Millions)Location 2013 YTD 2014 YTD
Northern Region 95.0 5.4Colton 5.5 0.0Ontario 31.2 4.4Rancho Cucamonga 2.6 1.0San Bernardino 55.8 0.0
Mojave Desert Region 0.0 0.5Apple Valley 0.0 0.5
Southeast Region 32.2 80.0Beaumont 0.0 0.0Moreno Valley 0.0 80.0Murrieta 0.0 0.0Perris 32.2 0.0
Southwest Region 49.0 21.5Chino 47.6 0.2Corona 0.0 4.9Jurupa Valley 0.0 15.8Riverside 1.4 0.5
East Region 0.9 0.0Indio 0.6 0.0Rancho Mirage 0.3 0.0
Unincorporated Areas 10.9 0.1Riverside County 1.5 0.0San Bernardino County 9.3 0.1Source: Construction Industry Research BoardNote: Year to date through July.
2014 Riverside/San Bernardino Economic Forecast 73

BEACONECONOMICS
Demographics andQuality of Lifeby Christian Cruz
ContentsKey Chapter Findings 76Population 76Personal and Household Income 78Education 80Poverty 82Crime 83Appendix: Charts and Tables 84

Demographics and Quality of Life
Key Chapter Findings
The Inland Empire is the fastest growing region in all of Southern California, expanding its population by1.0% over the past year and 18.3% over the past ten years.
From 2012 to 2013, median household income throughout the Inland Empire grew approximately 3.0%.
While educational attainment in the Inland Empire still lags behind the rest of Southern California, theInland Empire is experiencing noticeable improvement, with the proportion of residents holding a bach-elor’s degree or higher increasing to 20.1% in 2013, compared to only 18.8% in 2008.
As a result of a healthier regional economy, the Inland Empire is experiencing a continued decrease inthe proportion of residents living in poverty.
From 2004 to 2012, Riverside and San Bernardino counties experienced the largest decline in both violentand property crime in Southern California.
Population
The Inland Empire is the fastest-growing region inSouthern California. As of January 2014, the Califor-nia Department of Finance reports that the Inland Em-pire is home to some 4.4 million residents, a 1.0% in-crease from January of 2013. Over the last 10 years,the population throughout the Inland Empire grewby 18.3%, surpassing the statewide average of only7.8%. Riverside County’s population grew by 1.1%,to reach 2.3 million over the past year, while SanBernardino County’s population grew by 0.8%, to 2.1million. Both counties have experienced significantpopulation increases over the past 10 years, with the10-year growth rate in Riverside County (25.7%) ex-ceeding the growth rate in San Bernardino County(11.2%).
The City of Riverside (314,034 residents), the City ofSan Bernardino (212,721), and the City of Fontana(202,177) continue to be the largest cities in the InlandEmpire. Together, these cities comprise nearly 17% ofthe total population in the region and provide signifi-cant economic activity. In our last forecast for the In-land Empire, we noted that the City of Beaumont expe-rienced the fastest 10-year population growth in the
area. Once again, Beaumont led the way (134.5%), fol-lowed by Coachella (60.3%) and Lake Elsinore (57.6%).Overall, from 2004 to 2014, the median population inInland Empire cities has grown 16.3%, to 52,625.
1.0
1.1
1.1
1.1
1.2
1.2
Inde
xed
(200
4 =
1.00
)
2004 2006 2008 2010 2012 2014
Riverside San BernardinoLos Angeles OrangeSan Diego California
Source: California Department of Finance
Select Counties and California, 2004 to 2014Population (Indexed)
The Inland Empire is the fastest growingregion in Southern California.
For themost part, the continued population growth inthe Inland Empire is being driven by natural increase(the difference between births and deaths). But thishas not always been the case. Prior to the recession,positive net migration was the primary catalyst for
76 2014 Riverside/San Bernardino Economic Forecast
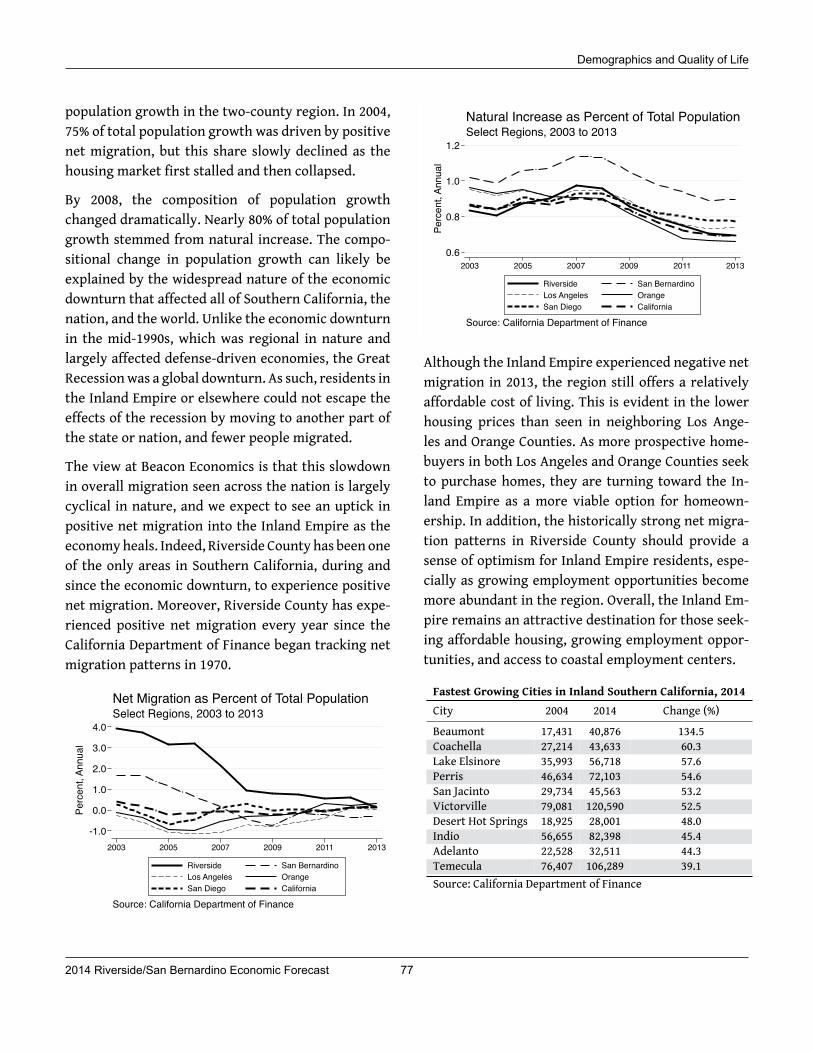
Demographics and Quality of Life
population growth in the two-county region. In 2004,75% of total population growth was driven by positivenet migration, but this share slowly declined as thehousing market first stalled and then collapsed.
By 2008, the composition of population growthchanged dramatically. Nearly 80% of total populationgrowth stemmed from natural increase. The compo-sitional change in population growth can likely beexplained by the widespread nature of the economicdownturn that affected all of Southern California, thenation, and the world. Unlike the economic downturnin the mid-1990s, which was regional in nature andlargely affected defense-driven economies, the GreatRecessionwas a global downturn. As such, residents inthe Inland Empire or elsewhere could not escape theeffects of the recession by moving to another part ofthe state or nation, and fewer people migrated.
The view at Beacon Economics is that this slowdownin overall migration seen across the nation is largelycyclical in nature, and we expect to see an uptick inpositive net migration into the Inland Empire as theeconomyheals. Indeed, Riverside County has been oneof the only areas in Southern California, during andsince the economic downturn, to experience positivenet migration. Moreover, Riverside County has expe-rienced positive net migration every year since theCalifornia Department of Finance began tracking netmigration patterns in 1970.
-1.0
0.0
1.0
2.0
3.0
4.0
Perc
ent,
Annu
al
2003 2005 2007 2009 2011 2013
Riverside San BernardinoLos Angeles OrangeSan Diego California
Source: California Department of Finance
Select Regions, 2003 to 2013Net Migration as Percent of Total Population
0.6
0.8
1.0
1.2
Perc
ent,
Annu
al
2003 2005 2007 2009 2011 2013
Riverside San BernardinoLos Angeles OrangeSan Diego California
Source: California Department of Finance
Select Regions, 2003 to 2013Natural Increase as Percent of Total Population
Although the Inland Empire experienced negative netmigration in 2013, the region still offers a relativelyaffordable cost of living. This is evident in the lowerhousing prices than seen in neighboring Los Ange-les and Orange Counties. As more prospective home-buyers in both Los Angeles and Orange Counties seekto purchase homes, they are turning toward the In-land Empire as a more viable option for homeown-ership. In addition, the historically strong net migra-tion patterns in Riverside County should provide asense of optimism for Inland Empire residents, espe-cially as growing employment opportunities becomemore abundant in the region. Overall, the Inland Em-pire remains an attractive destination for those seek-ing affordable housing, growing employment oppor-tunities, and access to coastal employment centers.
Fastest Growing Cities in Inland Southern California, 2014City 2004 2014 Change (%)Beaumont 17,431 40,876 134.5Coachella 27,214 43,633 60.3Lake Elsinore 35,993 56,718 57.6Perris 46,634 72,103 54.6San Jacinto 29,734 45,563 53.2Victorville 79,081 120,590 52.5Desert Hot Springs 18,925 28,001 48.0Indio 56,655 82,398 45.4Adelanto 22,528 32,511 44.3Temecula 76,407 106,289 39.1Source: California Department of Finance
2014 Riverside/San Bernardino Economic Forecast 77

Demographics and Quality of Life
Despite the slowdown in recent years, the past decadehas seen widespread growth in cities across InlandSouthern California. The City of Beaumont continuesto lead the way, where the population surged by over134% from 2004 to 2014. The City of Coachella has alsoexperienced substantial growth over the last decadeaswell, growing by 60.3%.Not far behind in growth areLake Elsinore (57.6%), Perris (54.6%), and San Jacinto(53.2%). Only three cities in the region have seen de-clines in their populations over the last decade: Blythe(-2,755), Big Bear Lake (-435) and Needles (-116).
Largest Cities in Inland Southern California, 2014City 2004 2014 Change (%)Riverside 279,829 314,034 12.2San Bernardino 198,227 212,721 7.3Fontana 156,781 202,177 29.0Moreno Valley 158,634 199,258 25.6Rancho Cucamonga 151,873 172,299 13.4Ontario 163,956 167,382 2.1Corona 144,084 159,132 10.4Victorville 79,081 120,590 52.5Murrieta 79,185 106,425 34.4Temecula 76,407 106,289 39.1Source: California Department of Finance
The City of Riverside remains Inland Southern Cal-ifornia’s largest city with a population of 314,034.Next is the City of San Bernardino (212,721), followedby Fontana (202,177), Moreno Valley (199,258), andRancho Cucamonga (172,299). The region now boaststhree cities with populations greater than 200,000, in2003 only the City of Riverside held this distinction.Similarly, in 2003 Inland Southern California only hadseven citieswith populations over 100,000. Today, thatnumber stands at eleven, with cities like Jurupa Valley(97,246) poised to join the group in the coming years.
A region’s economy is only as strong as its labor force.Throughout the country, the aging baby boomer pop-ulation and their imminent departure from the la-bor force can spell disaster for regions whose laborforce typically consists of a larger proportion of babyboomers and residents planning to retire. Luckily,the Inland Empire’s population comprises a substan-
tial proportion of younger residents. The populationstructure in the region is such that approximately47.5% of residents are between the ages of 20 and 54,and only 23.6% are 55 years or older. Thus, the InlandEmpire has an adequate supply of younger workers toreplace the aging baby boomer population.
Inland Empire Population by Age, 2013 (%)County Under 5 5-19 20-34 35-54 55-64 65 and Over
Riverside 6.9 23.0 20.9 25.9 10.5 12.8San Bernardino 6.8 20.4 22.2 26.5 11.7 12.4Los Angeles 6.4 19.6 23.2 27.8 11.1 11.9Orange 6.1 20.0 21.4 28.3 11.5 12.8
San Diego 7.4 23.4 22.7 26.0 10.5 10.0
California 6.5 20.3 22.2 27.0 11.5 12.5Source: U.S. Census, 2013 American Community Survey
While the relative youth of residents in the Inland Em-pire can be advantageous in many respects, the largeproportion of school-age children throughout the re-gion can be of concern with respect to the local bud-get, primarily for education. Recently, much of the re-gion’s population growth has been driven primarilythrough natural increase, which means that the pro-portion of school-age children is likely to grow.
Personal and Household Income
Growth in total personal income in the Inland Em-pire has been among the best in the State of Califor-nia. From 2011 to 2012, total personal income climbedin both Riverside County (3.6%) and San BernardinoCounty (3.9%). Over the past 10 years, total personalincome in Riverside and San Bernardino Countiesgrew by 64.1% and 50.4%, respectively—the highestgrowth rates in Southern California.
78 2014 Riverside/San Bernardino Economic Forecast
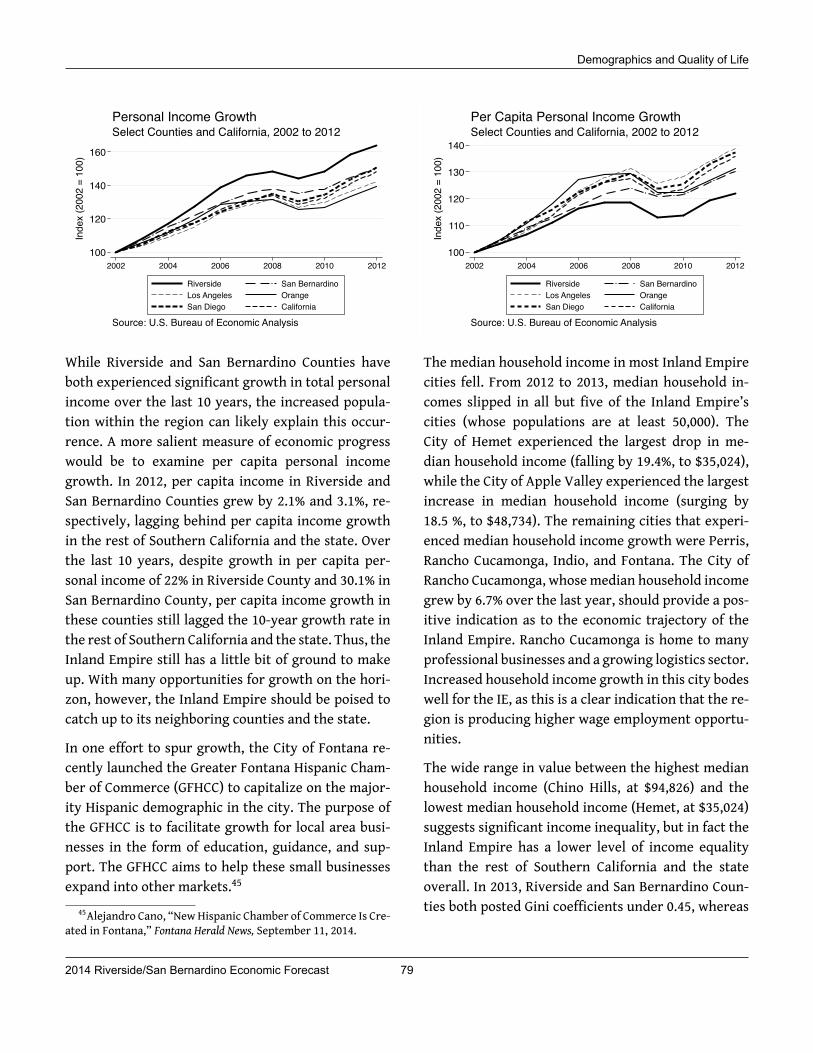
Demographics and Quality of Life
100
120
140
160
Inde
x (2
002
= 10
0)
2002 2004 2006 2008 2010 2012
Riverside San BernardinoLos Angeles OrangeSan Diego California
Source: U.S. Bureau of Economic Analysis
Select Counties and California, 2002 to 2012Personal Income Growth
While Riverside and San Bernardino Counties haveboth experienced significant growth in total personalincome over the last 10 years, the increased popula-tion within the region can likely explain this occur-rence. A more salient measure of economic progresswould be to examine per capita personal incomegrowth. In 2012, per capita income in Riverside andSan Bernardino Counties grew by 2.1% and 3.1%, re-spectively, lagging behind per capita income growthin the rest of Southern California and the state. Overthe last 10 years, despite growth in per capita per-sonal income of 22% in Riverside County and 30.1% inSan Bernardino County, per capita income growth inthese counties still lagged the 10-year growth rate inthe rest of Southern California and the state. Thus, theInland Empire still has a little bit of ground to makeup. With many opportunities for growth on the hori-zon, however, the Inland Empire should be poised tocatch up to its neighboring counties and the state.
In one effort to spur growth, the City of Fontana re-cently launched the Greater Fontana Hispanic Cham-ber of Commerce (GFHCC) to capitalize on the major-ity Hispanic demographic in the city. The purpose ofthe GFHCC is to facilitate growth for local area busi-nesses in the form of education, guidance, and sup-port. The GFHCC aims to help these small businessesexpand into other markets.45
45Alejandro Cano, “NewHispanic Chamber of Commerce Is Cre-ated in Fontana,” Fontana Herald News, September 11, 2014.
100
110
120
130
140
Inde
x (2
002
= 10
0)
2002 2004 2006 2008 2010 2012
Riverside San BernardinoLos Angeles OrangeSan Diego California
Source: U.S. Bureau of Economic Analysis
Select Counties and California, 2002 to 2012Per Capita Personal Income Growth
The median household income in most Inland Empirecities fell. From 2012 to 2013, median household in-comes slipped in all but five of the Inland Empire’scities (whose populations are at least 50,000). TheCity of Hemet experienced the largest drop in me-dian household income (falling by 19.4%, to $35,024),while the City of Apple Valley experienced the largestincrease in median household income (surging by18.5 %, to $48,734). The remaining cities that experi-enced median household income growth were Perris,Rancho Cucamonga, Indio, and Fontana. The City ofRancho Cucamonga, whosemedian household incomegrew by 6.7% over the last year, should provide a pos-itive indication as to the economic trajectory of theInland Empire. Rancho Cucamonga is home to manyprofessional businesses and a growing logistics sector.Increased household income growth in this city bodeswell for the IE, as this is a clear indication that the re-gion is producing higher wage employment opportu-nities.
The wide range in value between the highest medianhousehold income (Chino Hills, at $94,826) and thelowest median household income (Hemet, at $35,024)suggests significant income inequality, but in fact theInland Empire has a lower level of income equalitythan the rest of Southern California and the stateoverall. In 2013, Riverside and San Bernardino Coun-ties both posted Gini coefficients under 0.45, whereas
2014 Riverside/San Bernardino Economic Forecast 79

Demographics and Quality of Life
the remaining Southern California counties and thestate had Gini coefficients above 0.47.46Gini Index of Income Inequality, Select Regions
Year Riverside San Bern. Los Angeles Orange San Diego CaliforniaCounty County County County County
2013 0.450 0.446 0.505 0.472 0.479 0.4902012 0.440 0.439 0.497 0.464 0.467 0.4822008 0.434 0.431 0.498 0.460 0.455 0.473Source: U.S. Census, 2008/2012/2013 Amer. Community Survey
The relatively low Gini coefficient in both Riversideand San Bernardino can likely be explained by the factthat the Inland Empire has a significantly higher pro-portion of low-skilled workers whose incomes do notvarywidely.We do, however, notice that the Gini coef-ficient has steadily increased since 2008, which is con-sistent with the growth in income inequality acrossSouthern California.
Looking at household income by ethnicity, we see thathousehold incomes for Hispanics and African Amer-icans significantly lag behind those of whites andAsians. In 2013, themedian household income for His-panics in Riverside and San Bernardino Counties was$47,389 and $47,029, respectively; this is, on average,21.3% lower than incomes for whites and 27.0% lowerthan incomes for Asians.
The Inland Empire has a lower level ofincome equality than the rest of Southern
California and the state overall.
Over the last year, Hispanics and African Americansin the Inland Empire did experience an increase inhousehold income. From 2012 to 2013, the medianhousehold income for Hispanics and African Ameri-cans grew by 3.0% and 0.7%, respectively. However,household income growth for both whites and Asiansduring the same time period was near 5%. These in-comegaps are critical for overall income growth in theregion, since Hispanics make up a large proportion of
46The Gini coefficient is a measure of income inequality for agiven region. A Gini coefficient of 1.00 represents perfect incomeinequality, and a coefficient of 0.00 represents perfect equality.
the Inland Empire’s population.Whilemany economicfactors can explain the origin of this gap, educationseems to play a key role in determining income levels.
Personal Income by City, 2012 & 2013
City Yearly Earnings ($)
2013 2012 Chg (%)
Apple Valley 48,734 41,113 18.5Chino 71,457 71,671 -0.3
Chino Hills 94,826 97,065 -2.3Fontana 64,679 64,195 0.8Hemet 35,024 43,443 -19.4Hesperia 42,990 46,027 -6.6Indio 51,202 50,528 1.3
Moreno Valley 52,625 55,872 -5.8Murrieta city 72,385 75,485 -4.1
Ontario 51,230 54,994 -6.8Perris 50,035 46,435 7.8
Rancho Cucamonga 82,489 77,329 6.7Redlands 61,972 66,901 -7.4Rialto 49,269 49,428 -0.3
Riverside 54,300 56,403 -3.7San Bernardino 37,440 39,097 -4.2
Temecula 78,165 78,668 -0.6Upland 56,782 64,797 -12.4
Victorville 42,765 52,165 -18.0Source: U.S. Census, 2012/2013 Amer. Com'ty Survey
Education
The occupational landscape has changed over the lastdecade, and education is more important than everas a means of alleviating poverty and spurring in-come growth. According to the California Departmentof Education (CDE), public school enrollment growthin Riverside and San Bernardino Counties is the high-est in all of Southern California and the state. Theincrease in enrollment stems in part from increasedmigration to these counties, mainly by lower-incomefamilies, over the last decade. While the growth inpublic school enrollment is a positive sign, there isclearly more to be done to boost educational out-comes. While CDE graduation rate statistics show that
80 2014 Riverside/San Bernardino Economic Forecast

Demographics and Quality of Life
Riverside and San Bernardino Counties are on parwith the rest of Southern California, even surpassingthe state average, Riverside and San Bernardino Coun-ties rank at or near the bottom in the remainingmajorstatistics used to measure educational performance(e.g., SAT scores, and math/ELA proficiency scores).
100
110
120
130
140
Inde
x (2
003
= 10
0)
2003 2005 2007 2009 2011 2013
Riverside San BernardinoLos Angeles OrangeSan Diego California
Source: California Department of Education
Selected Counties and California, 2003-2013Public High School Enrollment
Historically, the Inland Empire has suffered fromachievement gaps amongst its schools relative toother regions of Southern California. This is an alarm-ing trend, as these statistics serve as indicators as towhether or not high school students are adequatelyprepared for college. However, from 2003 to 2013,both Riverside and SanBernardino Counties have seena larger share of students proficient in both mathe-matics and English Language Arts. In addition, grad-uation rates in the Inland Empire are increasing ata slow, yet steady pace and are on par with the restof Southern California—even surpassing the averagegraduation rate for state overall. While this is promis-ing, Riverside and San Bernardino still lag behind therest of the region and the state in key measures. Assuch, the proficiency gap between the Inland Empireand the rest of Southern California is of concern andshould be a primary focus as a means of poverty alle-viation and fostering future income growth.
Overall, Census Bureau statistics show that just underhalf of the residents of Riverside County (46%) and SanBernardino County (47%) have a high school diploma
or less. These proportions far exceed the state averageof 39%. This has important implications—those withonly a high school diploma or less will earn, on av-erage, between $20,000 to $30,000 annually in the In-land Empire. However, it is encouraging that educa-tional attainment has improved over time. Althoughthe counties of Riverside and San Bernardino main-tain roughly the same education gap with the statein relative terms, the proportion of local residentswith a bachelor’s degree or higher has increased,from just 18.8% (average between Riverside and SanBernardino) of the population in 2005 to 20.1% in 2013.
The proportion of Inland Empire residentswith a bachelor's degree or higher hasincreased from 18.8% in 2005 to 20.1% in
2013.
% of Pop. with a Bachelor's Degree or HigherCounty 2013 2005 % Change
Riverside 21.0 20.2 4.0San Bernardino 19.0 17.4 9.2Los Angeles 30.1 27.6 9.1Orange 37.1 34.9 6.3San Diego 34.6 36.3 -4.7California 31.0 29.5 5.1Source: U.S. Census, 2013 American Community Survey
The advantage of a college degree is evident inthe “wage premium” associated with higher educa-tion—thewage premium is the annual earnings differ-ence between thosewith a bachelor’s degree and thosewith only a high school diploma. Those who have abachelor’s degree inRiverside and SanBernardinowillearn, on average, approximately $20,000 more annu-ally than those who have only a high school diploma.
A region’s economy is driven by its workforce, and themore educated the workforce is, the higher their an-nual earningswill be. These earnings in turn tend to becorrelatedwith increased spending activity. Thus, it isimportant to continue to focus on improving educa-tion for primary and secondary students, giving them
2014 Riverside/San Bernardino Economic Forecast 81
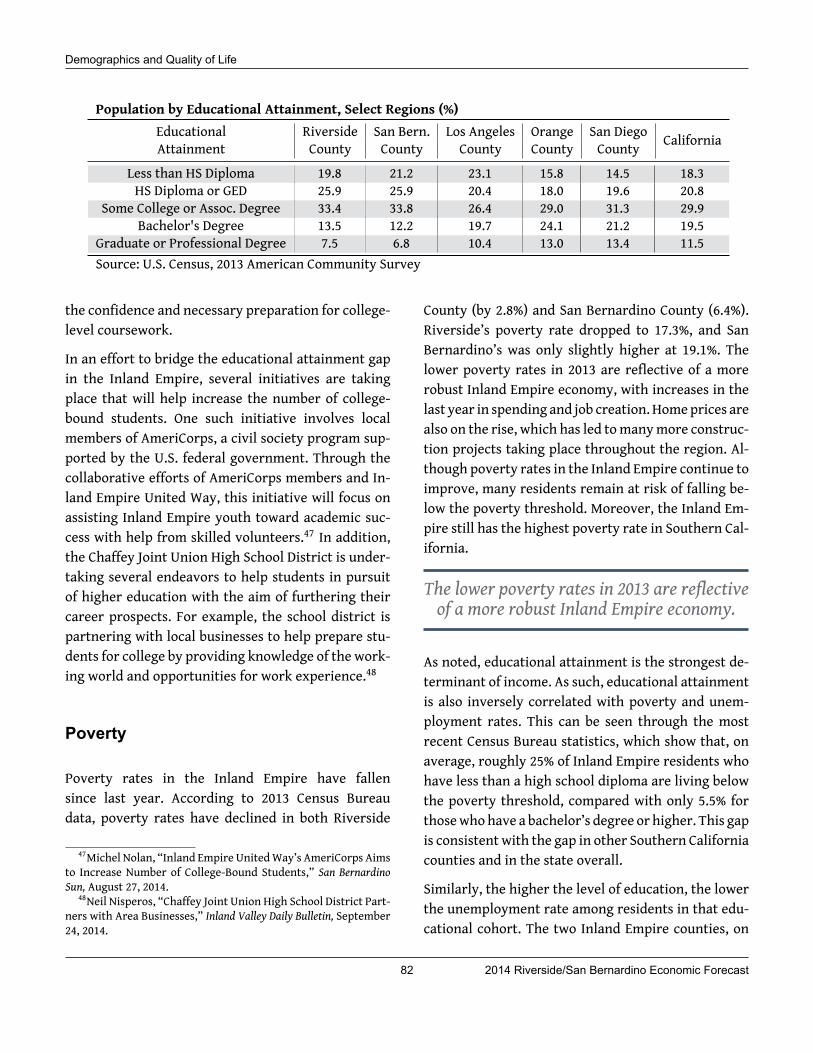
Demographics and Quality of Life
Population by Educational Attainment, Select Regions (%)Educational Riverside San Bern. Los Angeles Orange San Diego CaliforniaAttainment County County County County County
Less than HS Diploma 19.8 21.2 23.1 15.8 14.5 18.3HS Diploma or GED 25.9 25.9 20.4 18.0 19.6 20.8
Some College or Assoc. Degree 33.4 33.8 26.4 29.0 31.3 29.9Bachelor's Degree 13.5 12.2 19.7 24.1 21.2 19.5
Graduate or Professional Degree 7.5 6.8 10.4 13.0 13.4 11.5Source: U.S. Census, 2013 American Community Survey
the confidence and necessary preparation for college-level coursework.
In an effort to bridge the educational attainment gapin the Inland Empire, several initiatives are takingplace that will help increase the number of college-bound students. One such initiative involves localmembers of AmeriCorps, a civil society program sup-ported by the U.S. federal government. Through thecollaborative efforts of AmeriCorps members and In-land Empire United Way, this initiative will focus onassisting Inland Empire youth toward academic suc-cess with help from skilled volunteers.47 In addition,the Chaffey Joint Union High School District is under-taking several endeavors to help students in pursuitof higher education with the aim of furthering theircareer prospects. For example, the school district ispartnering with local businesses to help prepare stu-dents for college by providing knowledge of the work-ing world and opportunities for work experience.48
Poverty
Poverty rates in the Inland Empire have fallensince last year. According to 2013 Census Bureaudata, poverty rates have declined in both Riverside
47Michel Nolan, “Inland Empire UnitedWay’s AmeriCorps Aimsto Increase Number of College-Bound Students,” San BernardinoSun, August 27, 2014.
48Neil Nisperos, “Chaffey Joint Union High School District Part-ners with Area Businesses,” Inland Valley Daily Bulletin, September24, 2014.
County (by 2.8%) and San Bernardino County (6.4%).Riverside’s poverty rate dropped to 17.3%, and SanBernardino’s was only slightly higher at 19.1%. Thelower poverty rates in 2013 are reflective of a morerobust Inland Empire economy, with increases in thelast year in spending and job creation. Homeprices arealso on the rise, which has led tomanymore construc-tion projects taking place throughout the region. Al-though poverty rates in the Inland Empire continue toimprove, many residents remain at risk of falling be-low the poverty threshold. Moreover, the Inland Em-pire still has the highest poverty rate in Southern Cal-ifornia.
The lower poverty rates in 2013 are reflectiveof a more robust Inland Empire economy.
As noted, educational attainment is the strongest de-terminant of income. As such, educational attainmentis also inversely correlated with poverty and unem-ployment rates. This can be seen through the mostrecent Census Bureau statistics, which show that, onaverage, roughly 25% of Inland Empire residents whohave less than a high school diploma are living belowthe poverty threshold, compared with only 5.5% forthosewhohave a bachelor’s degree or higher. This gapis consistent with the gap in other Southern Californiacounties and in the state overall.
Similarly, the higher the level of education, the lowerthe unemployment rate among residents in that edu-cational cohort. The two Inland Empire counties, on
82 2014 Riverside/San Bernardino Economic Forecast

Demographics and Quality of Life
average, show an unemployment rate of 5.5% for res-idents who hold a bachelor’s degree or higher, com-pared with an unemployment rate of 13.5% for thosewith less than a high school diploma. Unfortunately,having a high school diploma is no longer enough toassure a decent standard of living. The most effec-tive way for residents to climb out of poverty andavoid joining the ranks of the unemployed is throughincreased levels of educational attainment. Thus, itis important to stress the importance of higher ed-ucation, especially as we see increased hiring in theProfessional Services sector, a sector that tradition-ally supports high-wage positions that often requirea bachelor’s degree or higher.
Crime
The quality of life in the Inland Empire has improvedby another measure: crime has been falling in the re-gion. From2004 to 2012, violent crimedeclined in bothRiverside and San Bernardino Counties. Indeed, River-side County experienced the largest decline in violentcrime in Southern California. This is significant, giventhe relatively high poverty rate in Riverside Countycompared to the rest of Southern California. It is gen-erally the case that poverty and crime go hand-in-hand. Given that the Inland Empire was one of thehardest hit regions during the recession, it is encour-aging to see such a dramatic drop in violent crime overthis period.
Regarding property crime, Riverside County likewiseexperienced a larger drop than other counties inSouthern California. From 2004 to 2012, propertycrime in Riverside County fell by 42.2%, whereas SanBernardino County experienced a smaller drop of15.6%. The downturn in overall crime in the InlandEmpire has much to do with the strengthening econ-omy, since better employment prospects reduce thefinancial incentive to commit crimes.
At the city level, the number of violent and prop-erty crimes per 100,000 residents varies, but most
From 2004 to 2012, violent crime declined inboth Riverside and San Bernardino Counties.
cites are showing a downward trend in the numberof crimes committed. Even in cities with large popu-lations, like Riverside and San Bernardino, both vio-lent crime and property crime have dramatically im-proved since 2008. Despite this improvement, thereare still significant disparities between high-crime ar-eas and low-crime areas. In the City of Indian Wells,for instance, there were only 39.1 violent crimes per100,000 residents, compared with 1,231.7 in the Cityof Desert Hot Springs. But the overall trend indicatesthat the Inland Empire is continuing to bolster its rep-utation as a region of economic opportunity with ahigh quality of life for all of its residents.
0.40
0.60
0.80
1.00
1.20
Viol
ent C
rime
(200
4 =
1.00
)
2004 2006 2008 2010 2012
Riverside San BernardinoLos Angeles OrangeSan Diego
Source: U.S. Federal Bureau of Investigation
Select Counties, 2004 to 2012Violent Crime (Indexed)
0.60
0.70
0.80
0.90
1.00
1.10
Prop
erty
Crim
e (2
004
= 1.
00)
2004 2006 2008 2010 2012
Riverside San BernardinoLos Angeles OrangeSan Diego
Source: U.S. Federal Bureau of Investigation
Select Counties, 2004 to 2012Property Crime (Indexed)
2014 Riverside/San Bernardino Economic Forecast 83
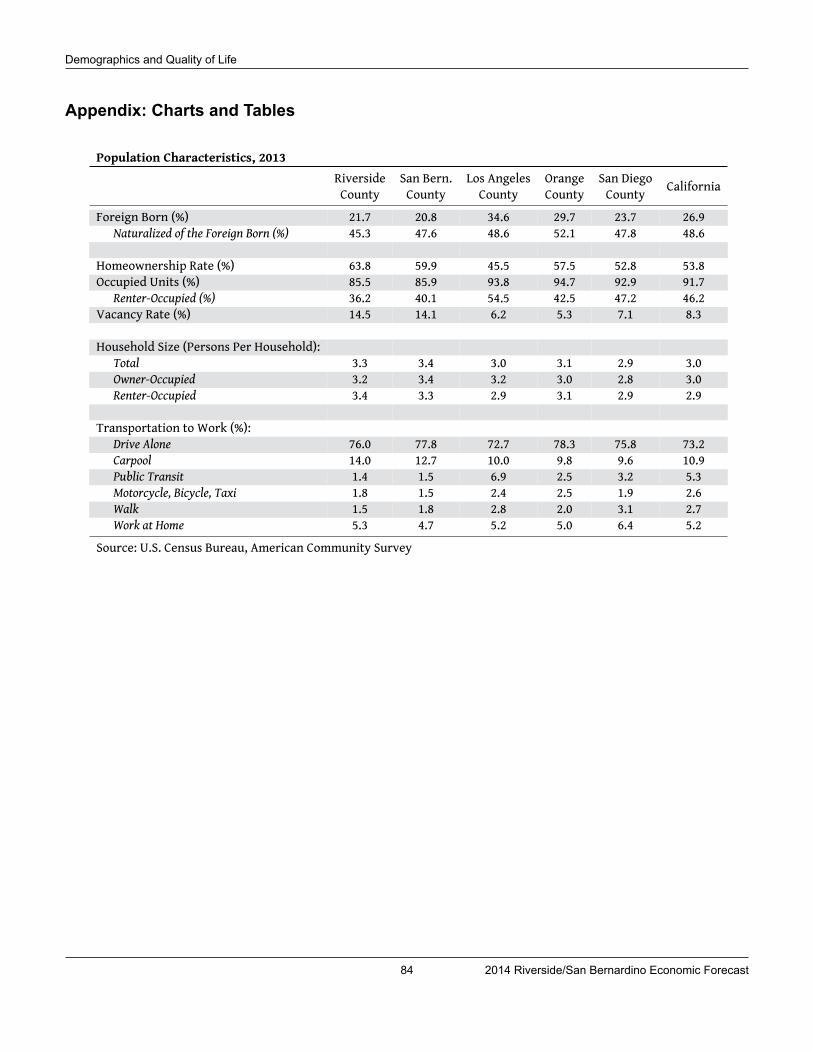
Demographics and Quality of Life
Appendix: Charts and Tables
Population Characteristics, 2013Riverside San Bern. Los Angeles Orange San Diego CaliforniaCounty County County County County
Foreign Born (%) 21.7 20.8 34.6 29.7 23.7 26.9Naturalized of the Foreign Born (%) 45.3 47.6 48.6 52.1 47.8 48.6
Homeownership Rate (%) 63.8 59.9 45.5 57.5 52.8 53.8Occupied Units (%) 85.5 85.9 93.8 94.7 92.9 91.7
Renter-Occupied (%) 36.2 40.1 54.5 42.5 47.2 46.2Vacancy Rate (%) 14.5 14.1 6.2 5.3 7.1 8.3
Household Size (Persons Per Household):Total 3.3 3.4 3.0 3.1 2.9 3.0Owner-Occupied 3.2 3.4 3.2 3.0 2.8 3.0Renter-Occupied 3.4 3.3 2.9 3.1 2.9 2.9
Transportation to Work (%):Drive Alone 76.0 77.8 72.7 78.3 75.8 73.2Carpool 14.0 12.7 10.0 9.8 9.6 10.9Public Transit 1.4 1.5 6.9 2.5 3.2 5.3Motorcycle, Bicycle, Taxi 1.8 1.5 2.4 2.5 1.9 2.6Walk 1.5 1.8 2.8 2.0 3.1 2.7Work at Home 5.3 4.7 5.2 5.0 6.4 5.2
Source: U.S. Census Bureau, American Community Survey
84 2014 Riverside/San Bernardino Economic Forecast

Demographics and Quality of Life
Income Levels and Poverty, 2013Riverside San Bern. Los Angeles Orange San Diego CaliforniaCounty County County County County
Median Household Income ($) 54,095 52,323 54,529 74,163 61,426 60,190Number of Households 693,585 604,090 3,247,705 1,003,790 1,093,386 12,650,592Under $25,000 (%) 22.0 23.1 24.0 16.1 19.5 21.2$25,000-$49,999 (%) 24.0 24.7 22.1 18.2 21.7 21.4$50,000-$74,999 (%) 18.7 18.8 16.7 16.1 17.2 16.8$75,000-$99,999 (%) 12.0 12.4 11.6 13.0 12.3 11.9$100,000-$149,999 (%) 14.1 13.2 13.2 17.4 15.3 14.5$150,000-$199,999 (%) 5.2 4.4 5.6 8.6 6.9 6.6Over $200,000 (%) 4.1 3.5 6.8 10.5 7.2 7.7Gini Index (0-1) 0.4497 0.4461 0.5047 0.4717 0.4789 0.4903Poverty Rate (%) 17.3 19.1 18.9 13.5 11.3 16.8Source: U.S. Census Bureau, 2013 American Community Survey
Percentage of Population in Poverty by Educational Attainment, 2013 (%)Educational Riverside San Bern. Los Angeles Orange San Diego CaliforniaAttainment County County County County County
Less than HS Diploma 23.5 27.2 27.3 24.9 24.8 26.2HS Diploma or GED 16.3 16.4 17.6 12.6 15.3 16.0
Some College or Assoc. Degree 10.5 12.6 12.2 9.0 12.7 11.5Bachelor's Degree or Higher 5.3 6.0 7.1 5.1 6.0 5.7Source: U.S. Census, 2013 American Community Survey
Population by Ethnicity, 2013 (%)
% of Population Riverside San Bern. Los Angeles Orange San Diego CaliforniaCounty County County County CountyHispanic/Latino 46.5 50.5 48.2 34.1 32.7 38.2White 38.4 31.9 27.1 42.8 47.5 39.2Black/Afr. American 5.9 8.4 8.0 1.4 4.8 5.7Asian 5.7 6.4 13.7 18.5 11.2 13.3Two or More Races 2.5 1.8 2.2 2.4 2.8 2.7Amer. Indian/Alaska Native 0.5 0.5 0.2 0.2 0.4 0.4Native Hawaiian/Pac. Islander 0.3 0.3 0.2 0.3 0.5 0.4Some Other Race 0.1 0.2 0.3 0.2 0.1 0.2Source: U.S. Census Bureau, 2013 American Community Survey
2014 Riverside/San Bernardino Economic Forecast 85

Demographics and Quality of Life
Yearly Household Income by Race/Ethnicity, 2013 ($)
Race/Ethnicity Riverside San Bern. Los Angeles Orange San Diego CaliforniaCounty County County County CountyHispanic or Latino 47,389 47,029 43,352 52,765 46,875 45,800White 61,081 58,936 73,081 85,769 70,302 70,786Asian 70,379 74,892 64,932 76,158 76,321 76,535Black/Afr. American 47,195 41,495 40,042 65,506 46,650 40,856Two or More Races 55,076 60,748 60,427 67,435 55,025 57,836Some Other Race 45,125 45,763 40,036 49,651 45,877 43,390Nat. Hawaiian/Pac. Islander 59,145 39,982 61,235 76,277 53,084 58,293Am. Indian/Alaska Native 39,755 43,483 45,144 46,719 53,750 44,879Source: U.S. Census, 2013 American Community Survey
Yearly Personal Income by Educational Attainment, 2013 ($)Educational Riverside San Bern. Los Angeles Orange San Diego CaliforniaAttainment County County County County County
Less than HS Diploma 20,822 20,342 17,768 19,105 21,303 19,057HS Diploma or GED 27,398 29,099 25,452 28,974 29,425 27,262
Some College or Assoc. Degree 35,761 35,850 34,358 39,729 35,477 35,888Bachelor's Degree 49,830 48,411 50,492 59,552 53,348 54,931
Graduate or Prof. Degree 69,708 64,754 71,521 84,420 74,512 77,093Source: U.S. Census, 2013 American Community Survey
Unemployment Rate by Educational Attainment, 2013 (%)Educational Riverside San Bern. Los Angeles Orange San Diego CaliforniaAttainment County County County County County
Less than HS Diploma 13.1 14.1 10.1 8.0 10.7 11.9HS Diploma or GED 13.8 11.4 10.8 8.4 9.7 11.0
Some College or Assoc. Degree 10.2 10.4 9.2 7.4 8.0 8.9Bachelor's Degree or Higher 5.2 5.8 5.9 4.6 5.6 5.2Source: U.S. Census, 2013 American Community Survey
86 2014 Riverside/San Bernardino Economic Forecast

Demographics and Quality of Life
20,000
30,000
40,000
50,000
Dolla
rs
2002 2004 2006 2008 2010 2012
Riverside San BernardinoLos Angeles OrangeSan Diego California
Source: U.S. Bureau of Economic Analysis
Select Counties and California, 2002 to 2012Per Capita Personal Income
30
40
50
60
70
Perc
enta
ge o
f Stu
dent
s EL
A-Pr
oficie
nt
2003 2005 2007 2009 2011 2013
Riverside San BernardinoLos Angeles OrangeSan Diego California
Source: California Department of Education
Selected Counties and California, 2003 to 2013English-Language Arts Proficient Students
460
480
500
520
540
Aver
age
Verb
al S
core
2003 2005 2007 2009 2011 2013
Riverside San BernardinoLos Angeles OrangeSan Diego California
Source: California Department of Education
Selected Counties and California, 2003-2013SAT Verbal Scores
70
75
80
85
90
Gra
duat
ion
Rate
(%)
2009 2010 2011 2012 2013
Riverside San BernardinoLos Angeles OrangeSan Diego California
Source: California Department of Education
Selected Counties and California, 2009 to 2013High School Graduation Rates
30
40
50
60
70
Perc
enta
ge o
f Stu
dent
s M
ath-
Profi
cient
2003 2005 2007 2009 2011 2013
Riverside San BernardinoLos Angeles OrangeSan Diego California
Source: California Department of Education
Selected Counties and California, 2003 to 2013Math Proficient Students
460
480
500
520
540
560
Aver
age
Mat
h Sc
ore
2003 2005 2007 2009 2011 2013
Riverside San BernardinoLos Angeles OrangeSan Diego California
Source: California Department of Education
Selected Counties in California, 2003-2013SAT Math Scores
2014 Riverside/San Bernardino Economic Forecast 87

Demographics and Quality of Life
1.0
2.0
3.0
4.0
5.0
6.0
Appl
icatio
ns (Q
2-04
= 1
.00)
Q1-04 Q3-06 Q1-09 Q3-11 Q1-14
Riverside County San Bernardino CountyLos Angeles County Orange CountySan Diego County California
Source: CA Department of Social Services
Select Regions, Q2-04 to Q2-14CalFresh Applications Approved (Indexed)
0.5
1.0
1.5
2.0
2.5
Appl
icatio
ns (Q
2-04
= 1
.00)
, Sm
ooth
ed
Q1-04 Q3-06 Q1-09 Q3-11 Q1-14
Riverside County San Bernardino CountyLos Angeles County Orange CountySan Diego County California
Source: CA Department of Social Services
Select Regions, Q2-04 to Q2-14CalWorks Applications Approved (Indexed)
Highest- and Lowest-Crime Cities, Inland Empire, 2012
City Violent Crimes Property CrimesPer 100K Residents Per 100K Residents
Indian Wells 39.1 3,964.8Murrieta 65.5 1,605.2Chino Hills 83.5 1,247.5Temecula 93.8 2,359.4Canyon Lake 100.9 1,916.6
Palm Springs 656.6 4,852.6Big Bear Lake 817.0 6,088.3Barstow 892.7 3,635.5San Bernardino 940.5 4,888.7Desert Hot Springs 1,231.7 4,142.6Source: U.S. Federal Bureau of Investigation
City Population Growth in the Inland EmpireCity 2004 2014 Change (%)Riverside 279,829 314,034 12.2San Bernardino 198,227 212,721 7.3Fontana 156,781 202,177 29.0Moreno Valley 158,634 199,258 25.6Rancho Cucamonga 151,873 172,299 13.4Ontario 163,956 167,382 2.1Corona 144,084 159,132 10.4Victorville 79,081 120,590 52.5Murrieta 79,185 106,425 34.4Temecula 76,407 106,289 39.1Rialto 97,704 101,429 3.8Jurupa Valley N/A 97,774 N/AHesperia 70,956 91,506 29.0Menifee N/A 83,716 N/AIndio 56,655 82,398 45.4Chino 73,163 81,747 11.7Hemet 66,751 81,537 22.2Chino Hills 74,809 76,131 1.8Upland 71,831 75,147 4.6Perris 46,634 72,103 54.6Apple Valley 61,005 70,755 16.0Redlands 67,641 69,882 3.3Eastvale N/A 59,185 N/ALake Elsinore 35,993 56,718 57.6Highland 49,483 54,033 9.2Colton 50,908 53,057 4.2Yucaipa 46,789 52,654 12.5Cathedral City 48,529 52,595 8.4Palm Desert 43,899 50,417 14.8Palm Springs 43,441 46,135 6.2San Jacinto 29,734 45,563 53.2Coachella 27,214 43,633 60.3Beaumont 17,431 40,876 134.5La Quinta 30,110 39,032 29.6Montclair 34,398 37,374 8.7Wildomar N/A 33,718 N/AAdelanto 22,528 32,511 44.3Banning 27,813 30,325 9.0Desert Hot Springs 18,925 28,001 48.0Norco 25,624 26,582 3.7Twentynine Palms 24,083 26,576 10.4Loma Linda 21,139 23,614 11.7Barstow 22,554 23,292 3.3Yucca Valley 18,504 21,053 13.8Blythe 21,747 18,992 -12.7Rancho Mirage 15,653 17,745 13.4Grand Terrace 11,976 12,285 2.6Canyon Lake 10,532 10,826 2.8Calimesa 7,579 8,231 8.6Indian Wells 4,413 5,137 16.4Big Bear Lake 5,556 5,121 -7.8Needles 5,024 4,908 -2.3Source: California Department of Finance
88 2014 Riverside/San Bernardino Economic Forecast

Demographics and Quality of Life
Violent and Property Crime by City, Inland Empire
City Violent Crimes Per 100,000 Residents Property Crimes Per 100,000 Residents2012 2011 2010 2009 2008 2012 2011 2010 2009 2008
Adelanto 611.9 510.3 814.9 905.3 633.3 2,841.3 2,753.7 2,444.7 2,652.7 2,813.7Apple Valley 312.0 224.5 261.7 368.4 465.6 2,646.0 2,790.6 2,629.7 2,443.2 2,467.2Banning 484.6 530.9 524.3 544.5 556.7 2,318.2 2,370.5 1,846.9 1,927.8 2,488.6Barstow 892.7 807.7 769.1 999.1 1,359.2 3,635.5 3,588.7 3,145.2 3,637.9 5,344.4Beaumont 270.5 238.5 232.6 231.0 210.5 3,524.9 2,626.6 2,088.3 2,437.5 2,370.8Big Bear Lake 817.0 531.7 451.0 660.2 659.0 6,088.3 5,218.6 4,074.7 6,006.4 4,725.2Blythe 342.4 327.6 360.4 315.9 269.1 3,559.5 3,299.8 2,831.7 2,884.5 2,547.5Calimesa 159.8 125.4 237.0 320.1 187.6 2,482.8 1,994.5 2,185.9 2,254.2 2,559.6Canyon Lake 100.9 196.5 88.2 105.4 52.6 1,916.6 2,105.8 1,967.4 1,159.2 1,463.1Cathedral City 385.9 436.3 465.9 381.3 449.6 2,981.1 3,442.0 2,815.8 2,293.6 3,046.6Chino 364.7 313.1 313.7 199.7 235.2 2,651.9 2,626.1 2,386.8 2,507.5 2,738.9Chino Hills 83.5 89.9 107.4 135.3 89.0 1,247.5 1,292.3 1,312.4 1,488.3 1,597.7Coachella 630.4 670.2 454.3 609.1 514.7 3,680.4 4,120.6 3,820.6 3,234.4 3,989.7Colton 353.7 358.2 335.3 437.0 525.6 3,569.1 2,952.6 3,114.0 3,350.2 3,566.1Corona 133.5 129.7 129.8 140.4 184.7 2,633.1 2,175.6 2,306.4 2,499.4 2,671.8Desert Hot Springs 1,231.7 1,272.7 1,477.7 1,274.6 1,236.7 4,142.6 5,574.8 5,452.6 5,907.7 6,163.9Fontana 423.2 363.0 394.1 451.4 458.6 2,237.2 2,134.9 1,911.3 2,307.4 2,362.4Grand Terrace 235.1 139.6 163.5 195.7 226.9 2,310.9 1,953.7 2,272.5 1,875.1 2,139.6Hemet 499.9 453.6 504.7 516.5 594.8 4,292.4 4,362.8 3,948.8 3,923.1 4,674.8Hesperia 435.1 343.1 322.9 326.2 318.5 2,708.3 2,465.1 2,159.2 1,881.8 2,339.8Highland 544.1 439.2 468.8 501.5 452.3 2,970.4 2,711.8 2,890.2 2,445.7 2,527.9Indian Wells 39.1 — 75.0 56.4 19.0 3,964.8 3,010.4 3,320.2 3,193.7 4,022.8Indio 573.2 558.9 505.5 478.4 435.8 3,555.4 3,392.7 3,045.0 3,153.4 3,159.2La Quinta 387.7 496.0 288.8 262.8 436.2 4,313.8 3,767.1 2,715.0 3,360.8 3,375.4Lake Elsinore 241.1 232.7 199.9 252.6 320.3 3,583.6 3,072.7 2,908.3 3,047.8 3,297.0Loma Linda 180.5 225.2 127.9 214.8 195.2 2,628.2 2,269.1 2,530.1 2,861.3 2,683.4Montclair 524.6 514.9 473.9 554.1 614.0 4,534.6 4,566.7 4,798.9 5,730.7 6,096.7Moreno Valley 353.6 374.2 367.0 467.2 553.0 3,190.7 2,945.2 2,646.8 3,022.6 3,201.7Murrieta 65.5 100.3 94.9 112.1 84.2 1,605.2 1,428.1 1,348.4 1,433.9 1,430.0Needles 463.4 265.3 355.9 699.6 411.7 4,291.8 4,040.0 4,739.6 4,499.9 3,836.1Norco 201.1 124.2 153.6 200.5 212.8 2,082.6 2,370.3 2,505.7 2,547.1 2,803.3Ontario 318.0 297.3 364.6 422.6 511.2 3,010.7 2,929.1 2,845.8 2,970.9 3,167.9Palm Desert 207.9 155.1 91.2 85.2 124.1 4,642.1 4,380.3 3,631.4 3,732.3 5,085.7Palm Springs 656.6 567.9 579.1 611.9 749.6 4,852.6 5,111.4 4,051.7 4,864.3 5,502.7Perris 339.9 241.4 272.9 322.1 456.6 2,946.9 3,069.8 2,959.6 3,226.4 3,405.9Rancho Cucamonga 189.6 175.2 192.4 193.6 224.0 2,576.9 2,341.3 2,095.8 2,131.0 2,158.7Rancho Mirage 129.4 109.1 99.0 99.2 81.3 4,083.7 4,150.4 3,231.4 3,524.5 5,214.9Redlands 313.9 283.2 344.4 331.2 357.7 4,250.1 3,768.2 3,594.5 3,514.8 3,917.7Rialto 501.0 478.4 500.8 545.3 560.9 3,514.9 2,968.0 2,584.9 2,879.7 2,244.6Riverside 443.0 426.1 479.7 511.9 642.0 3,450.4 3,132.6 3,300.5 3,198.0 3,693.9San Bernardino 940.5 876.2 815.2 955.5 1,033.8 4,888.7 3,983.7 4,501.2 4,629.8 4,704.5San Jacinto 300.2 263.9 272.0 404.0 409.1 3,240.8 3,269.3 3,453.1 3,468.2 3,834.0Temecula 93.8 93.8 72.2 124.8 153.0 2,359.4 2,375.7 2,294.2 2,348.3 2,465.0Twentynine Palms 316.3 311.7 348.3 334.5 340.8 1,807.7 2,063.8 1,513.2 1,678.3 1,879.2Upland 195.9 245.3 283.6 — 345.5 3,082.2 2,967.9 3,215.1 — 3,639.2Victorville 569.6 585.0 581.8 668.4 597.5 3,762.0 3,352.2 3,138.6 3,362.4 3,663.9Yucaipa 226.1 227.0 272.9 252.1 162.1 1,793.9 1,731.7 1,580.3 2,028.3 1,832.0Yucca Valley 424.4 434.5 501.3 399.1 336.3 2,641.0 2,716.9 2,545.1 2,740.6 3,127.7Source: U.S. Federal Bureau of InvestigationCity of Desert Hot Springs data skewed by small population
2014 Riverside/San Bernardino Economic Forecast 89

Data Sources
Data Sources
The creation of this report would not have been possible without numerous public and private sources of data.We would like to acknowledge those sources here.
Bureau of Transportation Statistics
California Air Resource Board
California Association of Realtors
California Board of Equalization
California Dept. of Education
California Dept. of Finance
California Dept. of Justice
California Employment Development Dept.
California New Car Dealers Association
California State Controller
California State Franchise Tax Board
California State Legislative Analyst's Office
CalTax.org
CB Richard Ellis
Construction Industry Research Board
CoStarr/The London Group
DataQuick Information Systems
Environmental Protection Agency
Federal Reseserve Economic Database (FRED)
Grubb & Ellis
Hanley Wood Market Intelligence
HousingTracker.net
Marcus & Millichap
Mortgage Bankers Association
National Science Foundation
NOAA National Weather Service
Pricewaterhouse Coopers
Property & Portfolio Research
RealFacts
Research and Development (RAND)
S&P Case Shiller
U.S. Census Bureau, American Community Survey
U.S. Census Bureau, Longitudinal Employment - Hous-ing Dynamics
U.S. Dept. of Commerce, Bureau of Economic Analysis
U.S. Dept. of Labor, Bureau of Labor Statistics
U.S. Dept. of Transp., Research and Innovative Tech-nology Administration
WISERTrade.org
90 2014 Riverside/San Bernardino Economic Forecast

Acknowledgments
Acknowledgments
Research Staff/Chapter Authors
Christoper Thornberg, Founding Partner (Beacon Economics)
Jordan Levine, Economist and Director of Economic Research (Beacon Economics)
Dustin Schrader, Public Policy Manager (Beacon Economics)
Rafael De Anda, Research Project Manager (Beacon Economics)
Brian Vanderplas, Senior Research Associate (Beacon Economics)
Christian Cruz, Research Associate (Beacon Economics)
Maximilian Saia, Research Associate (Beacon Economics)
Alan Hooper, Research Associate (Beacon Economics)
Document Format and Editing
Bettina Nicely Johnson, Copy Editor
Cover Design
Christopher Canlas, Beacon Economics
Print Production
Copyland Printers, Inc.
Conference Coordination/Management
Simone Horng, Beacon Economics
Marsha Fowles, University of California at Riverside
2014 Riverside/San Bernardino Economic Forecast 91
About Beacon Economics
About Beacon EconomicsBeacon Economics, LLC is one of California’s leading economic research and consulting firms, specializing ineconomic and revenue forecasting, economic impact analysis, economic policy analysis, regional economicanalysis, real estate market and industry analysis, and EB-5 Visa analysis. Known for delivering independent andrigorous analysis, we strive to give our clients an understanding of economic trends and data that helpstrengthen strategic decision making about investment, revenue, and policy.
Services Contact
Economic & Revenue ForecastingBusiness, Industry, & Market AnalysisEconomic Development AnalysisPorts & Infrastructure AnalysisPublic SpeakingExpert TestimonyFeasibility Studies
Sherif HannaManaging Partner(424) [email protected] Pike BondDirector of Communications(415) [email protected]
92 2014 Riverside/San Bernardino Economic Forecast