bayesian optimization for improved landslide risk mapping
TRANSCRIPT
Bayesian optimization for improved landslide risk mappingSylvain Robert, 25 March 2021, Swiss Rejoint work with Michael Ewald, Thomas Phillips and Claudius Brüniger

Sylvain Robert | 25 March 2021 | Swiss Re
•Business context
•Methodology
•Results
•Conclusions
Outline

Business context

Sylvain Robert | 25 March 2021 | Swiss Re
IndiaWeather insurance
for farmers
CaribbeanHurricane,
earthquake and excess rainfall risk
Pacific Islands Earthquake and
tropical cyclone risk
VietnamAgriculture yield cover
TurkeyEarthquake pool
BangladeshFlood insurance
African Risk CapacityGovernment drought
insurance pool
FloridaHurricane risk
United KingdomFlood risk
Guangdong Typhoon/rainfall
ThailandCrop insurance
MexicoEarthquake/hurricane
and livestock risk
Louisiana Hurricane risk
Heilongjiang Multiperil disaster
risk
California/UtahEarthquake risk
GuatemalaNat cat business interruption risk
United StatesFlood risk
PhilippinesEarthquake and
tropical cyclone risk
Pacific Alliance(CHL, COL, MEX,
PER)Earthquake risk
Swiss Re is a major reinsurer of natural catastrophe events
Sylvain Robert | 25 March 2021 | Swiss Re 5
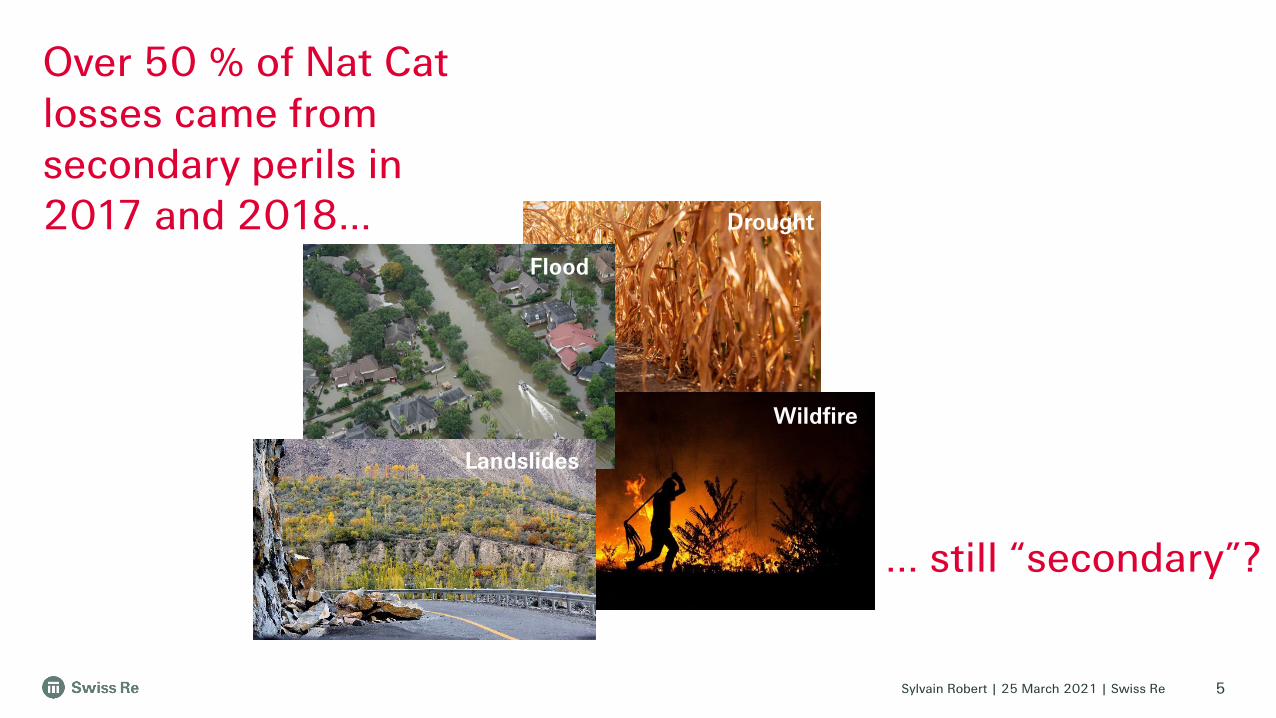
Drought
Wildfire
Flood
Over 50 % of Nat Cat losses came from secondary perils in 2017 and 2018…
Landslides
… still “secondary”?

Sylvain Robert | 25 March 2021 | Swiss Re
Landslide risks mapping in CatNet®
Every year, globally, landslides cause multiple billions of losses (of which only a fraction is insured) and thousands of deaths and injurieshttps://yubanet.com/life/hazard-a-guess-how-much-do-landslides-cost-the-nation-per-year-usgs-pop-quiz/
Use cases:• An insurance company evaluates the risk of NatCat at a given site before
offering a home insurance policy• An organisation such as the Red Cross uses our NatCat risk maps to plan
its operations on the ground: where to build infrastructures, deploy help, etc.

Methodology

Sylvain Robert | 25 March 2021 | Swiss Re
Landslide risk mapping for insurance
8
We make a distinction between two types of landslide risks:
• The susceptibility risk is the risk of a landslide starting at a given location
• The runout risk is the risk of a location to be hit by a landslide
For insurance (and risk management) purpose, the runout risk is the most important! Usually houses are not built on slopes, but at the bottom…
La Conchita – 1995 – CaliforniaSource: R.L. Schuster/U.S. Geological Survey
High susceptibility risk
High runout risk

Sylvain Robert | 25 March 2021 | Swiss Re
Susceptibility risk mapping(previous work done by Emanuel Bueechi)
9
Susceptibility = f(slope, geology, earthquake risk, rainfall risk)
From landslide susceptibility to landslide runout
Runout risk mappingnew approach based on a simplified dynamical model of runout flow
Sylvain Robert | 25 March 2021 | Swiss Re 10
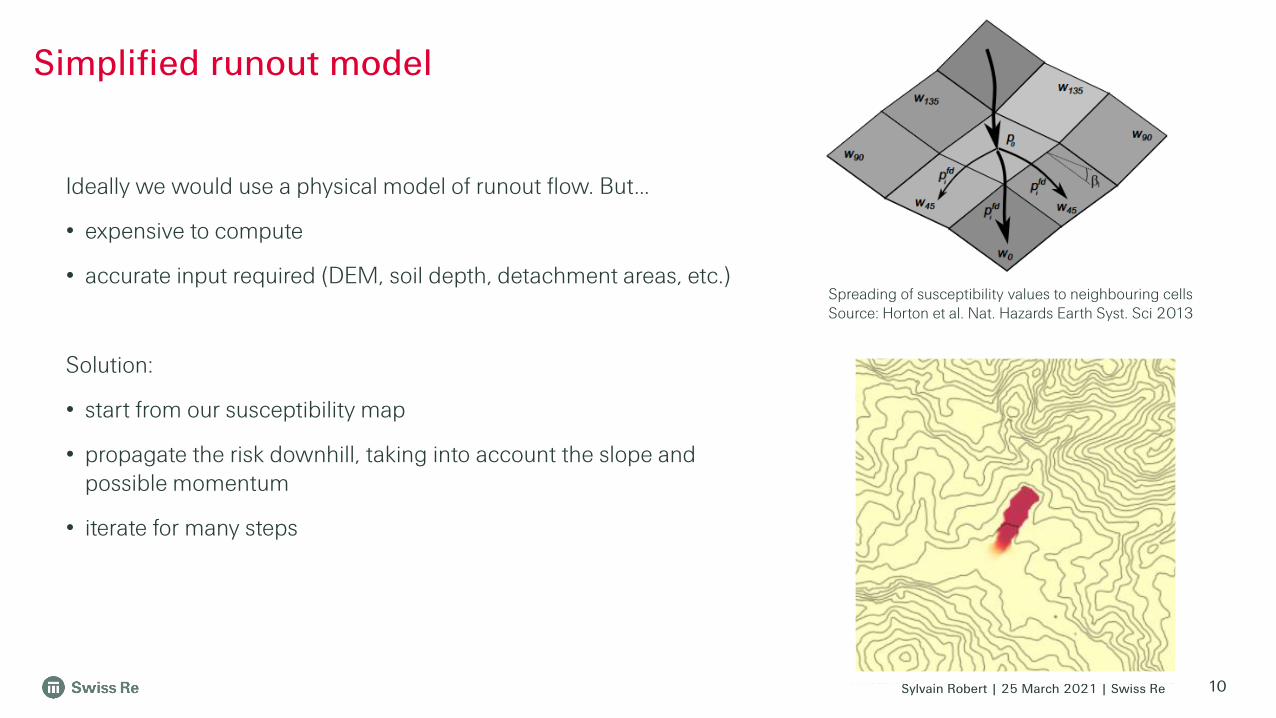
Simplified runout model
Spreading of susceptibility values to neighbouring cellsSource: Horton et al. Nat. Hazards Earth Syst. Sci 2013
Ideally we would use a physical model of runout flow. But…
• expensive to compute
• accurate input required (DEM, soil depth, detachment areas, etc.)
Solution:
• start from our susceptibility map
• propagate the risk downhill, taking into account the slope and possible momentum
• iterate for many steps

Sylvain Robert | 25 March 2021 | Swiss Re 11
Runout model
Parameters θ
Data x
Score = f(θ, x)
find θopt = argmax f(θ, x)
Optimization problem
Model training: an optimization problem
amount of flow, dispersion rate, momentum strength, overflow threshold, slope factor, etc.
• expensive to compute (e.g. simulate runout on all target points)
• non-differentiable• relatively “smooth” as a function of θ
Assumptions about f(θ, x)

Sylvain Robert | 25 March 2021 | Swiss Re
1. Place a Gaussian process prior on f(θ)
2. Observe f(θ) at a set of initial points θ: typical experimental design, grid search or random.
3. for n < N:
i. update the posterior distribution of f(θ) given all observations so far
ii. pick a new θn that maximizes the acquisition function over the posterior distribution
iii. evaluate objective function at candidate point: f(θn)
4. Return the optimal θn
Gaussian process: distribution over a space of function (defined by a mean function and a kernel)
Posterior distribution: specified by new mean function and covariance after having observed data
Acquisition function: controls the trade-off between exploration and exploitation. Examples are “expected improvements” or “upper confidence bound” (based on confidence intervals and optimism).
12
Bayesian optimization in a nutshell

Sylvain Robert | 25 March 2021 | Swiss Re 13
Source: Shahriari et al. IEEE 2016
Dotted black: objective function (truth)
Solid black: posterior mean of f(θ)
Purple: posterior confidence bands of f(θ)
Green: acquisition function,
We see that the acquisition function is high either due to a high mean (exploitation) or to a high uncertainty (exploration). The algorithm explore possibly interesting regions (optimism) and focuses more and more on the region of highest score with iterations.
Bayesian optimization in a nutshell
Sylvain Robert | 25 March 2021 | Swiss Re
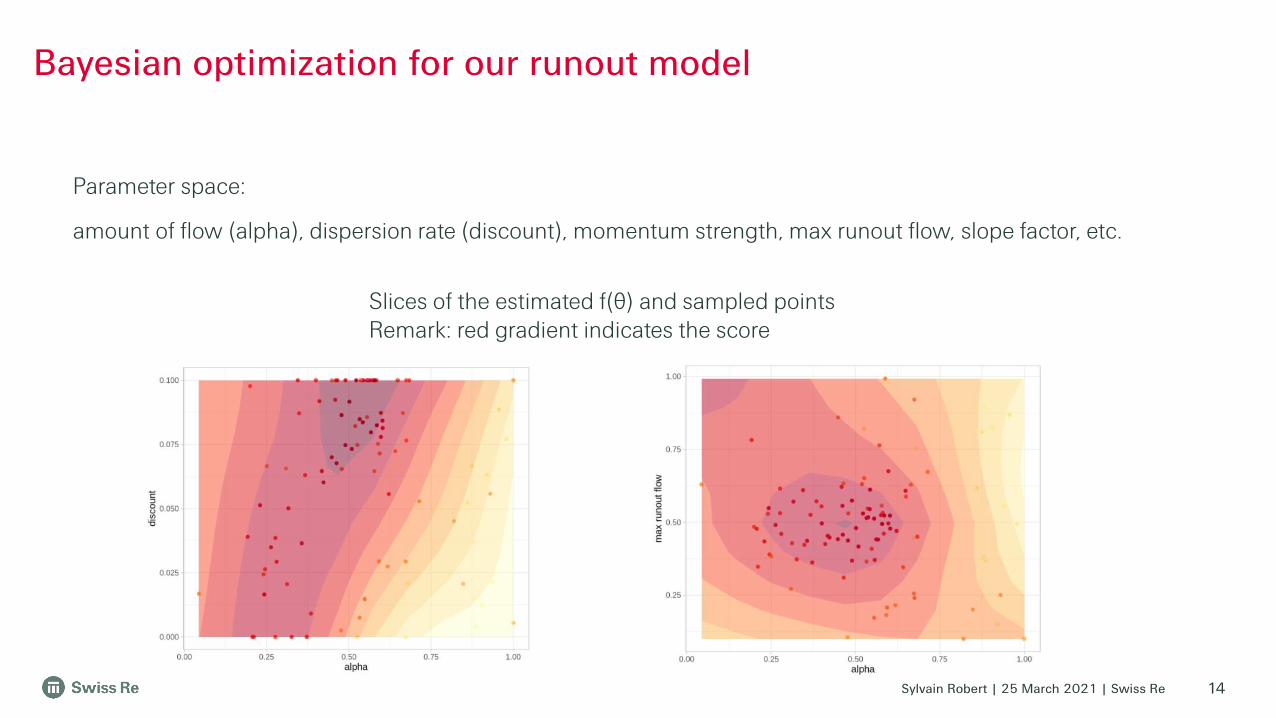
Parameter space:
amount of flow (alpha), dispersion rate (discount), momentum strength, max runout flow, slope factor, etc.
14
Slices of the estimated f(θ) and sampled pointsRemark: red gradient indicates the score
Bayesian optimization for our runout model

Results
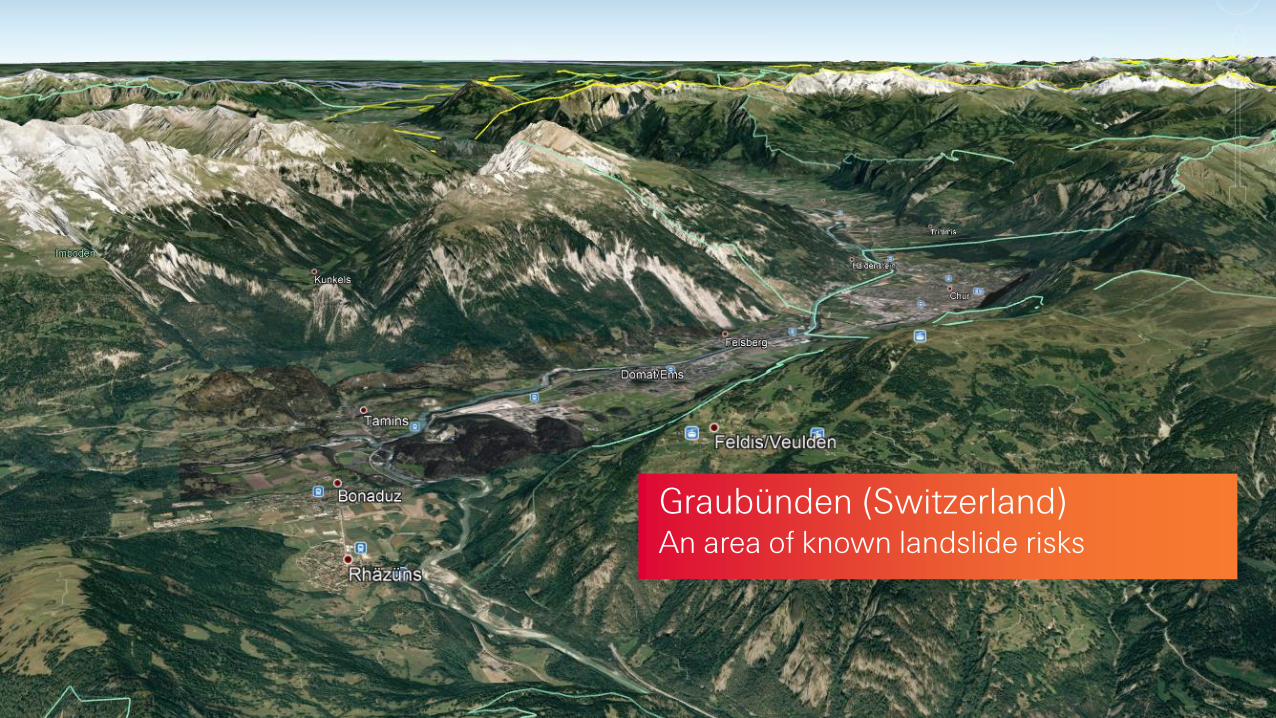
Graubünden (Switzerland)An area of known landslide risks

Sylvain Robert | 25 March 2021 | Swiss Re
Susceptibility

Sylvain Robert | 25 March 2021 | Swiss Re
Runout
Sylvain Robert | 25 March 2021 | Swiss Re 19
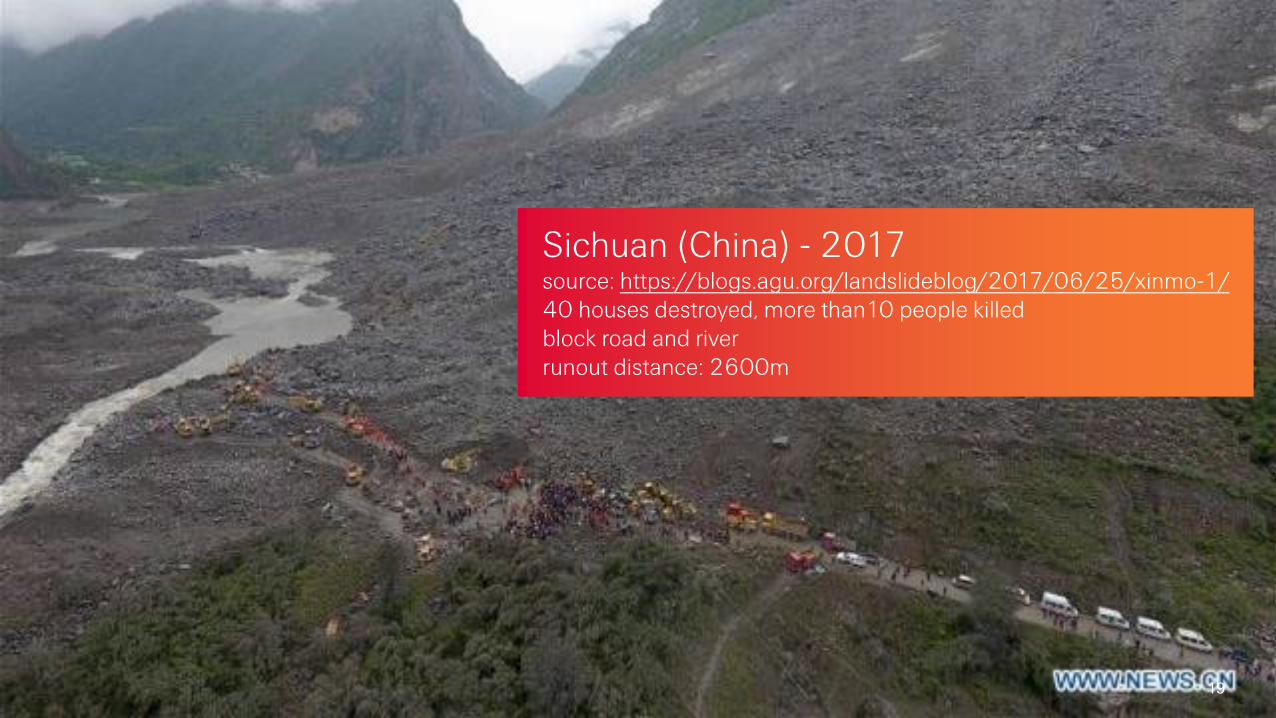
Sichuan (China) - 2017source: https://blogs.agu.org/landslideblog/2017/06/25/xinmo-1/40 houses destroyed, more than10 people killedblock road and riverrunout distance: 2600m
Sylvain Robert | 25 March 2021 | Swiss Re 20
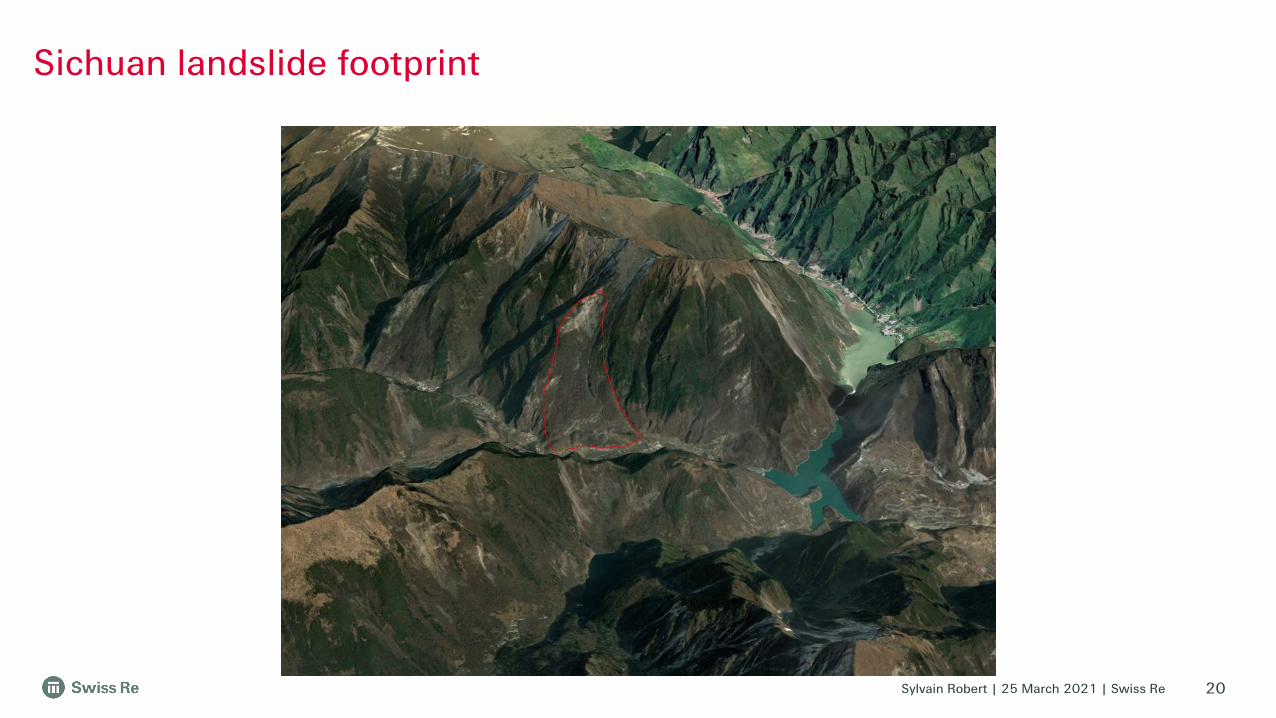
Sichuan landslide footprint
Sylvain Robert | 25 March 2021 | Swiss Re 21
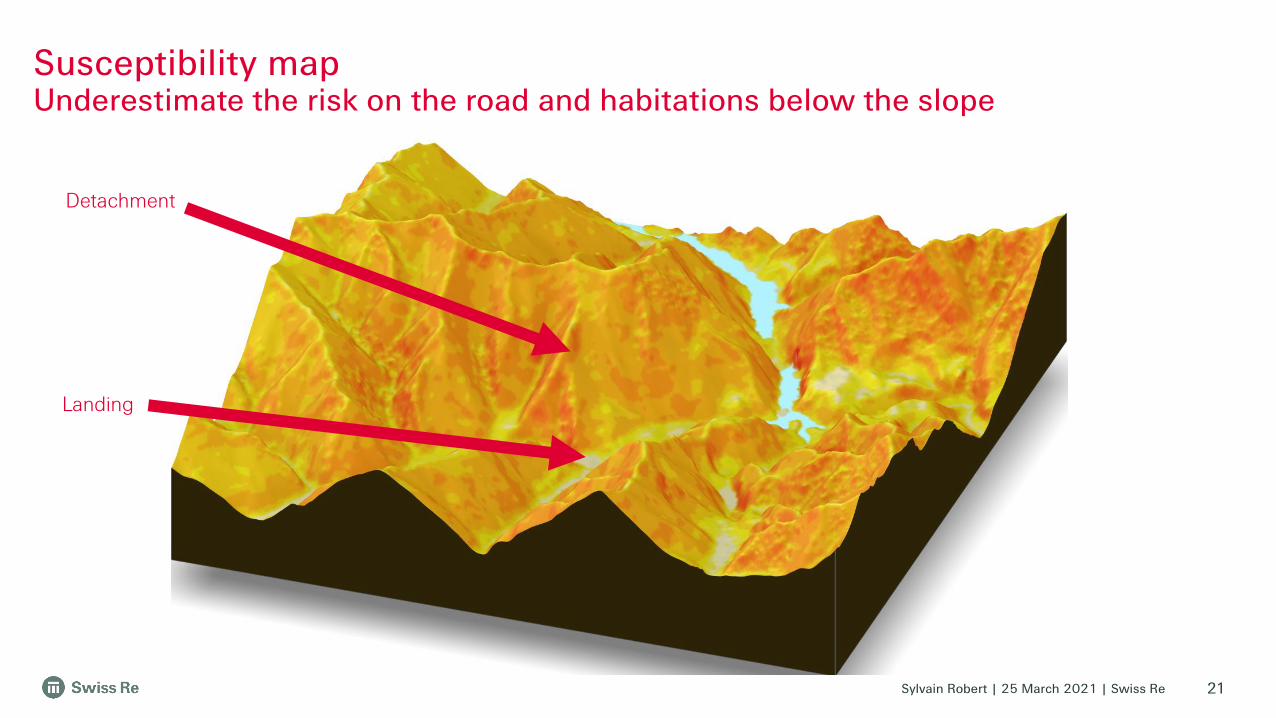
Detachment
Landing
Susceptibility mapUnderestimate the risk on the road and habitations below the slope

Sylvain Robert | 25 March 2021 | Swiss Re 22
Detachment
Landing
Runout mapMuch better risk estimation at the bottom of the slope
Sylvain Robert | 25 March 2021 | Swiss Re 23
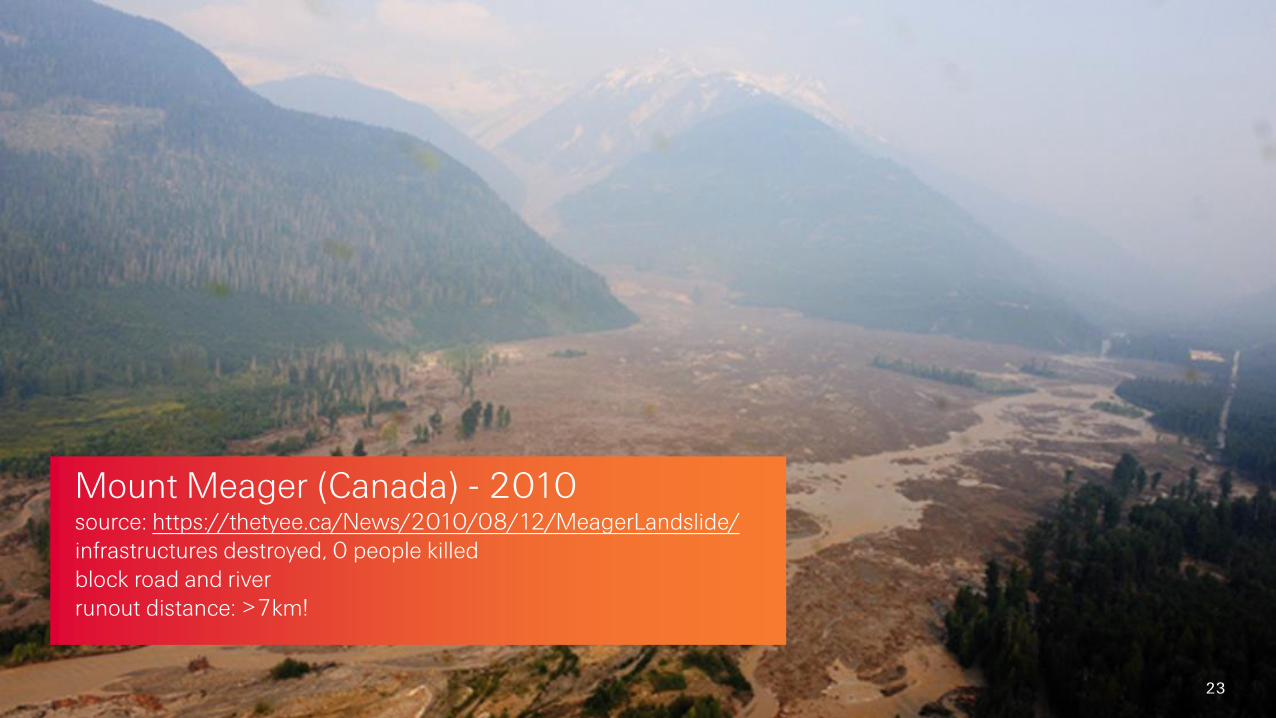
Mount Meager (Canada) - 2010source: https://thetyee.ca/News/2010/08/12/MeagerLandslide/infrastructures destroyed, 0 people killedblock road and riverrunout distance: >7km!

Sylvain Robert | 25 March 2021 | Swiss Re 24
Meager (Canada) landslide footprint

Sylvain Robert | 25 March 2021 | Swiss Re 25
Detachment
Landing
Susceptibility mapUnderestimate the risk in the valley below

Sylvain Robert | 25 March 2021 | Swiss Re 26
Detachment
Landing
wrongly estimated as “safe”but very catastrophic event
Runout mapBetter estimation of risk downhill, but doesn’t go as far as the actual landslide

Conclusions

Sylvain Robert | 25 March 2021 | Swiss Re
Summary
New runout model
• landslide susceptibility risk is not enough for insurance
• new runout model with simplified landslide dynamics
Bayesian Optimization
• map the problem as an optimization (derivative-free)
• learn model parameters using data
Landslide risks mapping
• global coverage• susceptibility and runout risks• resolution 30m x 30m

Sylvain Robert | 25 March 2021 | Swiss Re 29
Sylvain Robert | 25 March 2021 | Swiss Re 30
Legal notice
©2021 Swiss Re. All rights reserved. You may use this presentation for private or internal purposes but note that any copyright or other proprietary notices must not be removed. You are not permitted to create any modifications or derivative works of this presentation, or to use it for commercial or other public purposes, without the prior written permission of Swiss Re.
The information and opinions contained in the presentation are provided as at the date of the presentation and may change. Although the information used was taken from reliable sources, Swiss Re does not accept any responsibility for its accuracy or comprehensiveness or its updating. All liability for the accuracy and completeness of the information or for any damage or loss resulting from its use is expressly excluded.