bayesian analysis of savings from retrofit projects
TRANSCRIPT
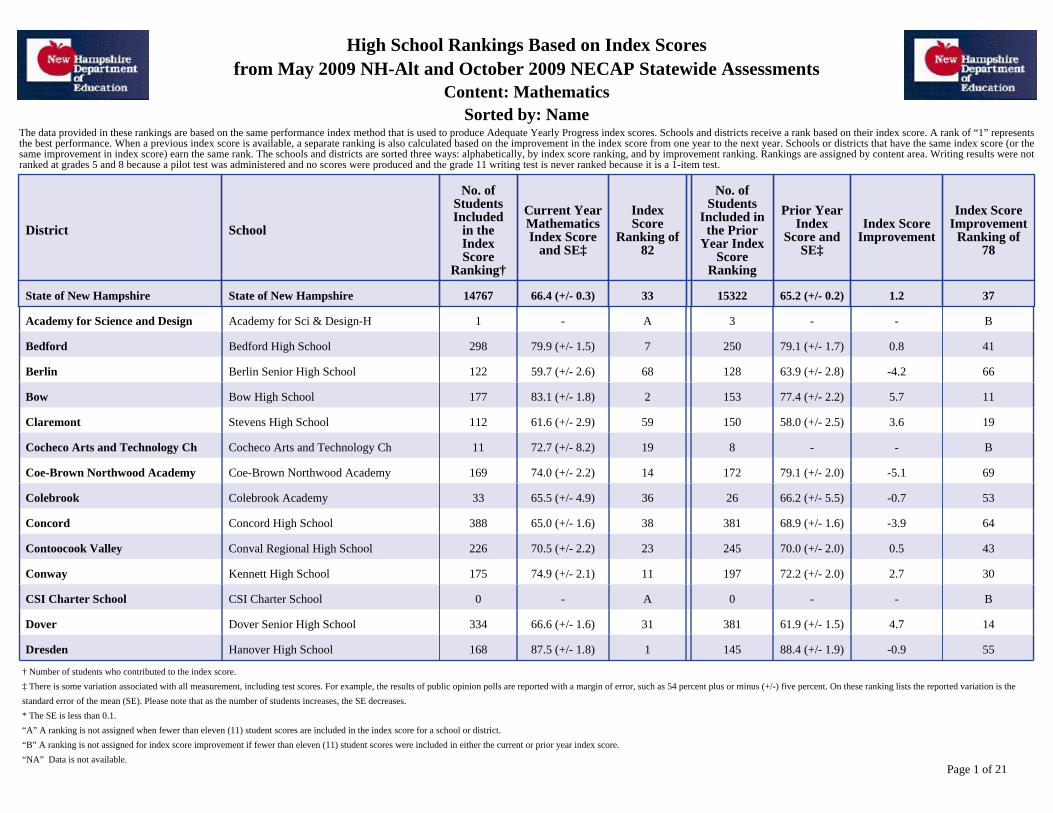
High School Rankings Based on Index Scoresfrom May 2009 NH-Alt and October 2009 NECAP Statewide Assessments
Content: MathematicsSorted by: Name
The data provided in these rankings are based on the same performance index method that is used to produce Adequate Yearly Progress index scores. Schools and districts receive a rank based on their index score. A rank of “1” representsthe best performance. When a previous index score is available, a separate ranking is also calculated based on the improvement in the index score from one year to the next year. Schools or districts that have the same index score (or thesame improvement in index score) earn the same rank. The schools and districts are sorted three ways: alphabetically, by index score ranking, and by improvement ranking. Rankings are assigned by content area. Writing results were notranked at grades 5 and 8 because a pilot test was administered and no scores were produced and the grade 11 writing test is never ranked because it is a 1-item test.
District School
No. ofStudentsIncluded
in theIndexScore
Ranking†
Current YearMathematicsIndex Score
and SE‡
IndexScore
Ranking of82
No. ofStudents
Included inthe Prior
Year IndexScore
Ranking
Prior YearIndex
Score andSE‡
Index ScoreImprovement
Index ScoreImprovement
Ranking of78
State of New Hampshire State of New Hampshire 14767 66.4 (+/- 0.3) 33 15322 65.2 (+/- 0.2) 1.2 37
Academy for Science and Design Academy for Sci & Design-H 1 - A 3 - - B
Bedford Bedford High School 298 79.9 (+/- 1.5) 7 250 79.1 (+/- 1.7) 0.8 41
Berlin Berlin Senior High School 122 59.7 (+/- 2.6) 68 128 63.9 (+/- 2.8) -4.2 66
Bow Bow High School 177 83.1 (+/- 1.8) 2 153 77.4 (+/- 2.2) 5.7 11
Claremont Stevens High School 112 61.6 (+/- 2.9) 59 150 58.0 (+/- 2.5) 3.6 19
Cocheco Arts and Technology Ch Cocheco Arts and Technology Ch 11 72.7 (+/- 8.2) 19 8 - - B
Coe-Brown Northwood Academy Coe-Brown Northwood Academy 169 74.0 (+/- 2.2) 14 172 79.1 (+/- 2.0) -5.1 69
Colebrook Colebrook Academy 33 65.5 (+/- 4.9) 36 26 66.2 (+/- 5.5) -0.7 53
Concord Concord High School 388 65.0 (+/- 1.6) 38 381 68.9 (+/- 1.6) -3.9 64
Contoocook Valley Conval Regional High School 226 70.5 (+/- 2.2) 23 245 70.0 (+/- 2.0) 0.5 43
Conway Kennett High School 175 74.9 (+/- 2.1) 11 197 72.2 (+/- 2.0) 2.7 30
CSI Charter School CSI Charter School 0 - A 0 - - B
Dover Dover Senior High School 334 66.6 (+/- 1.6) 31 381 61.9 (+/- 1.5) 4.7 14
Dresden Hanover High School 168 87.5 (+/- 1.8) 1 145 88.4 (+/- 1.9) -0.9 55
† Number of students who contributed to the index score.
‡ There is some variation associated with all measurement, including test scores. For example, the results of public opinion polls are reported with a margin of error, such as 54 percent plus or minus (+/-) five percent. On these ranking lists the reported variation is the
standard error of the mean (SE). Please note that as the number of students increases, the SE decreases.
* The SE is less than 0.1.
“A” A ranking is not assigned when fewer than eleven (11) student scores are included in the index score for a school or district.
“B” A ranking is not assigned for index score improvement if fewer than eleven (11) student scores were included in either the current or prior year index score.
“NA” Data is not available.Page 1 of 21

High School Rankings Based on Index Scoresfrom May 2009 NH-Alt and October 2009 NECAP Statewide Assessments
Content: MathematicsSorted by: Name
The data provided in these rankings are based on the same performance index method that is used to produce Adequate Yearly Progress index scores. Schools and districts receive a rank based on their index score. A rank of “1” representsthe best performance. When a previous index score is available, a separate ranking is also calculated based on the improvement in the index score from one year to the next year. Schools or districts that have the same index score (or thesame improvement in index score) earn the same rank. The schools and districts are sorted three ways: alphabetically, by index score ranking, and by improvement ranking. Rankings are assigned by content area. Writing results were notranked at grades 5 and 8 because a pilot test was administered and no scores were produced and the grade 11 writing test is never ranked because it is a 1-item test.
District School
No. ofStudentsIncluded
in theIndexScore
Ranking†
Current YearMathematicsIndex Score
and SE‡
IndexScore
Ranking of82
No. ofStudents
Included inthe Prior
Year IndexScore
Ranking
Prior YearIndex
Score andSE‡
Index ScoreImprovement
Index ScoreImprovement
Ranking of78
State of New Hampshire State of New Hampshire 14767 66.4 (+/- 0.3) 33 15322 65.2 (+/- 0.2) 1.2 37
Epping Epping High School 66 64.2 (+/- 3.4) 44 76 52.4 (+/- 3.4) 11.8 3
Exeter Region Cooperative Exeter High School 355 75.9 (+/- 1.5) 9 414 72.9 (+/- 1.4) 3.0 27
Fall Mountain Regional Fall Mountain Regional High Sc 153 65.5 (+/- 2.4) 36 142 65.5 (+/- 2.6) 0.0 48
Farmington Farmington Senior High School 94 53.6 (+/- 3.1) 77 93 52.3 (+/- 3.3) 1.3 36
Franklin Franklin High School 78 53.1 (+/- 3.2) 78 89 49.9 (+/- 3.1) 3.2 26
Gilford Gilford High School 128 67.8 (+/- 2.7) 28 149 68.6 (+/- 2.2) -0.8 54
Goffstown Goffstown High School 270 77.0 (+/- 1.7) 8 273 63.4 (+/- 1.8) 13.6 1
Gorham Randolph Shelburne Coop Gorham High School 43 62.8 (+/- 4.5) 52 38 71.1 (+/- 4.9) -8.3 76
Governor Wentworth Regional Kingswood Regional High School 208 62.3 (+/- 2.1) 56 208 62.0 (+/- 2.2) 0.3 47
Great Bay eLearning Charter Sc Great Bay eLearning Charter Sc 30 46.7 (+/- 4.7) 80 9 - - B
Haverhill Cooperative Woodsville High School 52 60.0 (+/- 3.9) 66 47 58.3 (+/- 3.9) 1.7 34
Hillsboro-Deering Cooperative Hillsboro-Deering High School 107 49.3 (+/- 2.8) 79 128 54.4 (+/- 2.6) -5.1 69
Hinsdale Hinsdale High School 45 61.3 (+/- 3.9) 60 60 68.3 (+/- 3.6) -7.0 75
Hollis-Brookline Cooperative Hollis-Brookline High School 223 82.6 (+/- 1.7) 3 227 77.8 (+/- 1.9) 4.8 13
† Number of students who contributed to the index score.
‡ There is some variation associated with all measurement, including test scores. For example, the results of public opinion polls are reported with a margin of error, such as 54 percent plus or minus (+/-) five percent. On these ranking lists the reported variation is the
standard error of the mean (SE). Please note that as the number of students increases, the SE decreases.
* The SE is less than 0.1.
“A” A ranking is not assigned when fewer than eleven (11) student scores are included in the index score for a school or district.
“B” A ranking is not assigned for index score improvement if fewer than eleven (11) student scores were included in either the current or prior year index score.
“NA” Data is not available.Page 2 of 21

High School Rankings Based on Index Scoresfrom May 2009 NH-Alt and October 2009 NECAP Statewide Assessments
Content: MathematicsSorted by: Name
The data provided in these rankings are based on the same performance index method that is used to produce Adequate Yearly Progress index scores. Schools and districts receive a rank based on their index score. A rank of “1” representsthe best performance. When a previous index score is available, a separate ranking is also calculated based on the improvement in the index score from one year to the next year. Schools or districts that have the same index score (or thesame improvement in index score) earn the same rank. The schools and districts are sorted three ways: alphabetically, by index score ranking, and by improvement ranking. Rankings are assigned by content area. Writing results were notranked at grades 5 and 8 because a pilot test was administered and no scores were produced and the grade 11 writing test is never ranked because it is a 1-item test.
District School
No. ofStudentsIncluded
in theIndexScore
Ranking†
Current YearMathematicsIndex Score
and SE‡
IndexScore
Ranking of82
No. ofStudents
Included inthe Prior
Year IndexScore
Ranking
Prior YearIndex
Score andSE‡
Index ScoreImprovement
Index ScoreImprovement
Ranking of78
State of New Hampshire State of New Hampshire 14767 66.4 (+/- 0.3) 33 15322 65.2 (+/- 0.2) 1.2 37
Hopkinton Hopkinton High School 73 74.5 (+/- 3.2) 12 88 70.9 (+/- 2.9) 3.6 19
Hudson Alvirne High School 321 63.9 (+/- 1.7) 46 346 66.8 (+/- 1.5) -2.9 61
Inter-Lakes Cooperative Inter-Lakes High School 88 63.4 (+/- 2.9) 49 99 56.8 (+/- 2.9) 6.6 8
Jaffrey-Rindge Cooperative Conant High School 131 56.5 (+/- 2.7) 73 105 62.5 (+/- 3.1) -6.0 72
John Stark Regional John Stark Regional High Sch 183 66.4 (+/- 2.1) 33 201 69.8 (+/- 2.0) -3.4 62
Kearsarge Regional Kearsarge Regional High School 160 72.0 (+/- 2.2) 22 142 71.1 (+/- 2.4) 0.9 40
Keene Keene High School 360 67.8 (+/- 1.6) 28 415 65.8 (+/- 1.5) 2.0 32
Laconia Laconia High School 196 57.0 (+/- 2.2) 72 185 57.6 (+/- 2.1) -0.6 51
Lebanon Lebanon High School 165 69.3 (+/- 2.3) 26 159 74.2 (+/- 2.2) -4.9 67
Ledyard Charter Academy Ledyard Charter Academy 0 - A NA - - B
Lincoln-Woodstock Cooperative Lin-Wood Public School (High) 24 62.5 (+/- 5.3) 55 33 73.9 (+/- 3.9) -11.4 77
Lisbon Regional Lisbon Regional School (High) 24 73.3 (+/- 5.2) 16 23 77.4 (+/- 5.5) -4.1 65
Litchfield Campbell High School 135 64.6 (+/- 2.6) 42 135 61.8 (+/- 2.7) 2.8 29
Littleton Littleton High School 50 61.2 (+/- 4.2) 61 65 53.8 (+/- 3.9) 7.4 6
† Number of students who contributed to the index score.
‡ There is some variation associated with all measurement, including test scores. For example, the results of public opinion polls are reported with a margin of error, such as 54 percent plus or minus (+/-) five percent. On these ranking lists the reported variation is the
standard error of the mean (SE). Please note that as the number of students increases, the SE decreases.
* The SE is less than 0.1.
“A” A ranking is not assigned when fewer than eleven (11) student scores are included in the index score for a school or district.
“B” A ranking is not assigned for index score improvement if fewer than eleven (11) student scores were included in either the current or prior year index score.
“NA” Data is not available.Page 3 of 21

High School Rankings Based on Index Scoresfrom May 2009 NH-Alt and October 2009 NECAP Statewide Assessments
Content: MathematicsSorted by: Name
The data provided in these rankings are based on the same performance index method that is used to produce Adequate Yearly Progress index scores. Schools and districts receive a rank based on their index score. A rank of “1” representsthe best performance. When a previous index score is available, a separate ranking is also calculated based on the improvement in the index score from one year to the next year. Schools or districts that have the same index score (or thesame improvement in index score) earn the same rank. The schools and districts are sorted three ways: alphabetically, by index score ranking, and by improvement ranking. Rankings are assigned by content area. Writing results were notranked at grades 5 and 8 because a pilot test was administered and no scores were produced and the grade 11 writing test is never ranked because it is a 1-item test.
District School
No. ofStudentsIncluded
in theIndexScore
Ranking†
Current YearMathematicsIndex Score
and SE‡
IndexScore
Ranking of82
No. ofStudents
Included inthe Prior
Year IndexScore
Ranking
Prior YearIndex
Score andSE‡
Index ScoreImprovement
Index ScoreImprovement
Ranking of78
State of New Hampshire State of New Hampshire 14767 66.4 (+/- 0.3) 33 15322 65.2 (+/- 0.2) 1.2 37
Londonderry Londonderry Senior High School 404 74.1 (+/- 1.4) 13 454 73.5 (+/- 1.4) 0.6 42
Manchester Manchester Central High School 431 64.3 (+/- 1.5) 43 422 63.8 (+/- 1.4) 0.5 43
Manchester Manchester Memorial High Sch 396 60.0 (+/- 1.6) 66 465 59.6 (+/- 1.4) 0.4 46
Manchester Manchester West High School 247 54.4 (+/- 1.9) 76 254 52.0 (+/- 1.9) 2.4 31
Mascenic Regional Mascenic Regional High School 117 61.0 (+/- 2.8) 62 77 57.7 (+/- 3.6) 3.3 25
Mascoma Valley Regional Mascoma Valley Regional High S 110 62.9 (+/- 2.9) 51 82 62.9 (+/- 3.2) 0.0 48
Merrimack Merrimack High School 353 66.6 (+/- 1.6) 31 368 62.3 (+/- 1.6) 4.3 16
Merrimack Valley Merrimack Valley High School 195 72.2 (+/- 1.9) 20 199 68.7 (+/- 1.9) 3.5 22
Milford Milford High School 209 69.7 (+/- 2.1) 24 199 65.9 (+/- 2.2) 3.8 17
Milton Nute High School 45 46.2 (+/- 3.2) 81 39 45.1 (+/- 5.0) 1.1 39
Monadnock Regional Monadnock Regional High School 133 62.6 (+/- 2.7) 54 155 63.0 (+/- 2.4) -0.4 50
Moultonborough Moultonborough Academy 60 58.7 (+/- 3.9) 71 58 72.1 (+/- 4.0) -13.4 78
Nashua Nashua High School North 448 63.9 (+/- 1.5) 46 449 60.4 (+/- 1.5) 3.5 22
Nashua Nashua High School South 495 60.1 (+/- 1.4) 64 523 62.9 (+/- 1.4) -2.8 60
† Number of students who contributed to the index score.
‡ There is some variation associated with all measurement, including test scores. For example, the results of public opinion polls are reported with a margin of error, such as 54 percent plus or minus (+/-) five percent. On these ranking lists the reported variation is the
standard error of the mean (SE). Please note that as the number of students increases, the SE decreases.
* The SE is less than 0.1.
“A” A ranking is not assigned when fewer than eleven (11) student scores are included in the index score for a school or district.
“B” A ranking is not assigned for index score improvement if fewer than eleven (11) student scores were included in either the current or prior year index score.
“NA” Data is not available.Page 4 of 21

High School Rankings Based on Index Scoresfrom May 2009 NH-Alt and October 2009 NECAP Statewide Assessments
Content: MathematicsSorted by: Name
The data provided in these rankings are based on the same performance index method that is used to produce Adequate Yearly Progress index scores. Schools and districts receive a rank based on their index score. A rank of “1” representsthe best performance. When a previous index score is available, a separate ranking is also calculated based on the improvement in the index score from one year to the next year. Schools or districts that have the same index score (or thesame improvement in index score) earn the same rank. The schools and districts are sorted three ways: alphabetically, by index score ranking, and by improvement ranking. Rankings are assigned by content area. Writing results were notranked at grades 5 and 8 because a pilot test was administered and no scores were produced and the grade 11 writing test is never ranked because it is a 1-item test.
District School
No. ofStudentsIncluded
in theIndexScore
Ranking†
Current YearMathematicsIndex Score
and SE‡
IndexScore
Ranking of82
No. ofStudents
Included inthe Prior
Year IndexScore
Ranking
Prior YearIndex
Score andSE‡
Index ScoreImprovement
Index ScoreImprovement
Ranking of78
State of New Hampshire State of New Hampshire 14767 66.4 (+/- 0.3) 33 15322 65.2 (+/- 0.2) 1.2 37
Nashua The Phoenix Program (H) 7 - A 0 - - B
New Hampshire Charter Equestri Academy for Equine Sciences Ch 7 - A 4 - - B
Newfound Area Newfound Regional High School 97 61.9 (+/- 2.9) 58 96 58.3 (+/- 2.9) 3.6 19
Newmarket Newmarket Jr.-Sr. High School 76 60.5 (+/- 3.4) 63 70 65.4 (+/- 4.0) -4.9 67
Newport Newport Middle High School (Hi 91 59.3 (+/- 3.1) 70 86 58.8 (+/- 3.2) 0.5 43
North Country Charter Academy North Country Charter Academy 0 - A 2 - - B
Northumberland Groveton High School 29 64.1 (+/- 6.4) 45 31 60.6 (+/- 5.8) 3.5 22
Oyster River Coop Oyster River High School 165 80.2 (+/- 2.1) 4 177 79.0 (+/- 2.0) 1.2 37
Pelham Pelham High School 147 60.1 (+/- 2.3) 64 171 66.1 (+/- 2.3) -6.0 72
Pembroke Pembroke Academy 209 68.5 (+/- 1.9) 27 227 70.5 (+/- 1.9) -2.0 58
Pemi-Baker Regional Plymouth Regional High School 184 63.2 (+/- 2.1) 50 186 65.2 (+/- 2.2) -2.0 58
Pinkerton Academy Pinkerton Academy 673 73.8 (+/- 1.1) 15 793 70.0 (+/- 1.0) 3.8 17
Pittsburg Pittsburg School (High) 15 80.0 (+/- 7.3) 5 9 - - B
Pittsfield Pittsfield High School 41 55.6 (+/- 5.4) 75 40 56.5 (+/- 4.7) -0.9 55
† Number of students who contributed to the index score.
‡ There is some variation associated with all measurement, including test scores. For example, the results of public opinion polls are reported with a margin of error, such as 54 percent plus or minus (+/-) five percent. On these ranking lists the reported variation is the
standard error of the mean (SE). Please note that as the number of students increases, the SE decreases.
* The SE is less than 0.1.
“A” A ranking is not assigned when fewer than eleven (11) student scores are included in the index score for a school or district.
“B” A ranking is not assigned for index score improvement if fewer than eleven (11) student scores were included in either the current or prior year index score.
“NA” Data is not available.Page 5 of 21

High School Rankings Based on Index Scoresfrom May 2009 NH-Alt and October 2009 NECAP Statewide Assessments
Content: MathematicsSorted by: Name
The data provided in these rankings are based on the same performance index method that is used to produce Adequate Yearly Progress index scores. Schools and districts receive a rank based on their index score. A rank of “1” representsthe best performance. When a previous index score is available, a separate ranking is also calculated based on the improvement in the index score from one year to the next year. Schools or districts that have the same index score (or thesame improvement in index score) earn the same rank. The schools and districts are sorted three ways: alphabetically, by index score ranking, and by improvement ranking. Rankings are assigned by content area. Writing results were notranked at grades 5 and 8 because a pilot test was administered and no scores were produced and the grade 11 writing test is never ranked because it is a 1-item test.
District School
No. ofStudentsIncluded
in theIndexScore
Ranking†
Current YearMathematicsIndex Score
and SE‡
IndexScore
Ranking of82
No. ofStudents
Included inthe Prior
Year IndexScore
Ranking
Prior YearIndex
Score andSE‡
Index ScoreImprovement
Index ScoreImprovement
Ranking of78
State of New Hampshire State of New Hampshire 14767 66.4 (+/- 0.3) 33 15322 65.2 (+/- 0.2) 1.2 37
Portsmouth Portsmouth High School 248 73.2 (+/- 1.9) 17 252 78.7 (+/- 1.7) -5.5 71
Profile Profile Senior High School 36 67.8 (+/- 5.4) 28 50 68.4 (+/- 4.1) -0.6 51
Prospect Mountain JMA Prospect Mountain High School 126 59.7 (+/- 2.8) 68 122 63.4 (+/- 2.8) -3.7 63
Raymond Raymond High School 97 69.7 (+/- 2.8) 24 95 59.2 (+/- 3.2) 10.5 4
Rochester Bud Carlson Academy 18 15.6 (+/- 2.6) 82 0 - - B
Rochester Spaulding High School 322 65.7 (+/- 1.7) 35 325 59.9 (+/- 1.7) 5.8 9
Salem Salem High School 497 72.8 (+/- 1.3) 18 492 68.1 (+/- 1.3) 4.7 14
Sanborn Regional Sanborn Regional High School 159 64.8 (+/- 2.5) 41 191 57.8 (+/- 2.2) 7.0 7
Shaker Regional Belmont High School 86 72.1 (+/- 2.8) 21 119 64.5 (+/- 2.9) 7.6 5
Somersworth Somersworth High School 138 62.3 (+/- 2.6) 56 110 57.1 (+/- 2.7) 5.2 12
Souhegan Cooperative Souhegan Coop High School 221 75.7 (+/- 1.9) 10 206 74.0 (+/- 2.1) 1.7 34
Stratford Stratford Public School (High) 1 - A 15 64.0 (+/- 8.3) - B
Sunapee Sunapee Sr. High School 26 80.0 (+/- 5.0) 5 51 67.8 (+/- 4.3) 12.2 2
Timberlane Regional Timberlane Regional High Sch 354 65.0 (+/- 1.6) 38 356 63.1 (+/- 1.6) 1.9 33
† Number of students who contributed to the index score.
‡ There is some variation associated with all measurement, including test scores. For example, the results of public opinion polls are reported with a margin of error, such as 54 percent plus or minus (+/-) five percent. On these ranking lists the reported variation is the
standard error of the mean (SE). Please note that as the number of students increases, the SE decreases.
* The SE is less than 0.1.
“A” A ranking is not assigned when fewer than eleven (11) student scores are included in the index score for a school or district.
“B” A ranking is not assigned for index score improvement if fewer than eleven (11) student scores were included in either the current or prior year index score.
“NA” Data is not available.Page 6 of 21
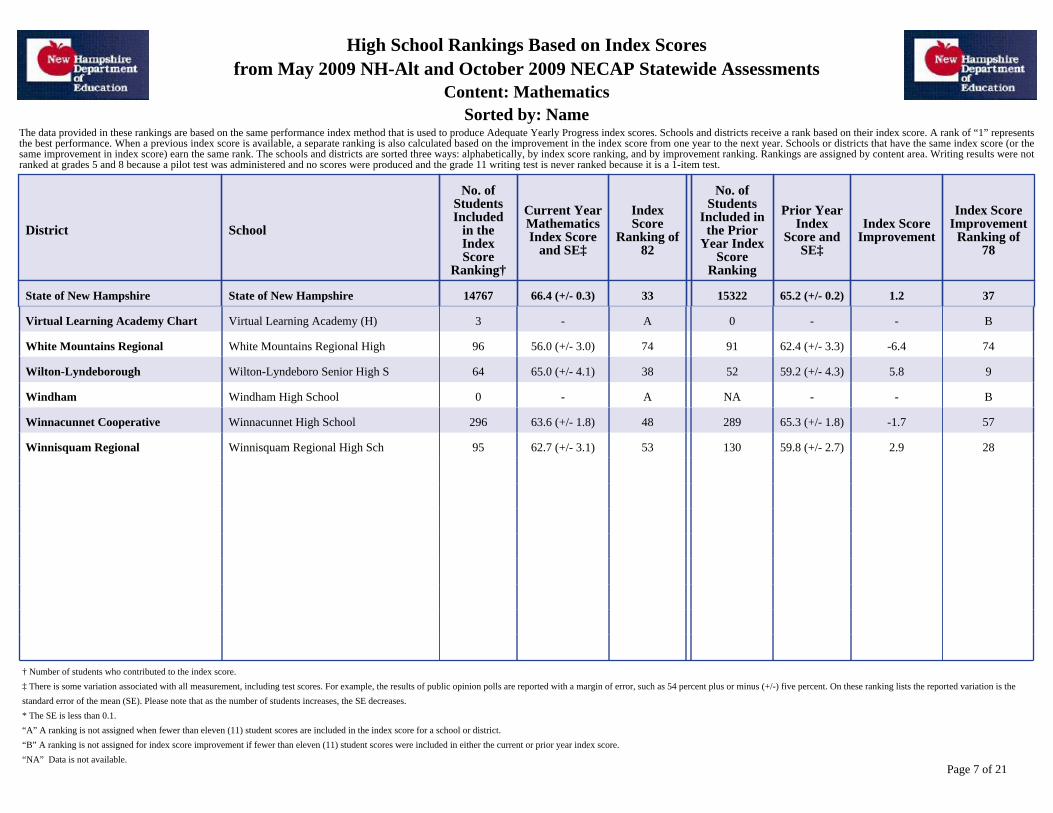
High School Rankings Based on Index Scoresfrom May 2009 NH-Alt and October 2009 NECAP Statewide Assessments
Content: MathematicsSorted by: Name
The data provided in these rankings are based on the same performance index method that is used to produce Adequate Yearly Progress index scores. Schools and districts receive a rank based on their index score. A rank of “1” representsthe best performance. When a previous index score is available, a separate ranking is also calculated based on the improvement in the index score from one year to the next year. Schools or districts that have the same index score (or thesame improvement in index score) earn the same rank. The schools and districts are sorted three ways: alphabetically, by index score ranking, and by improvement ranking. Rankings are assigned by content area. Writing results were notranked at grades 5 and 8 because a pilot test was administered and no scores were produced and the grade 11 writing test is never ranked because it is a 1-item test.
District School
No. ofStudentsIncluded
in theIndexScore
Ranking†
Current YearMathematicsIndex Score
and SE‡
IndexScore
Ranking of82
No. ofStudents
Included inthe Prior
Year IndexScore
Ranking
Prior YearIndex
Score andSE‡
Index ScoreImprovement
Index ScoreImprovement
Ranking of78
State of New Hampshire State of New Hampshire 14767 66.4 (+/- 0.3) 33 15322 65.2 (+/- 0.2) 1.2 37
Virtual Learning Academy Chart Virtual Learning Academy (H) 3 - A 0 - - B
White Mountains Regional White Mountains Regional High 96 56.0 (+/- 3.0) 74 91 62.4 (+/- 3.3) -6.4 74
Wilton-Lyndeborough Wilton-Lyndeboro Senior High S 64 65.0 (+/- 4.1) 38 52 59.2 (+/- 4.3) 5.8 9
Windham Windham High School 0 - A NA - - B
Winnacunnet Cooperative Winnacunnet High School 296 63.6 (+/- 1.8) 48 289 65.3 (+/- 1.8) -1.7 57
Winnisquam Regional Winnisquam Regional High Sch 95 62.7 (+/- 3.1) 53 130 59.8 (+/- 2.7) 2.9 28
.
.
.
.
.
.
.
.
† Number of students who contributed to the index score.
‡ There is some variation associated with all measurement, including test scores. For example, the results of public opinion polls are reported with a margin of error, such as 54 percent plus or minus (+/-) five percent. On these ranking lists the reported variation is the
standard error of the mean (SE). Please note that as the number of students increases, the SE decreases.
* The SE is less than 0.1.
“A” A ranking is not assigned when fewer than eleven (11) student scores are included in the index score for a school or district.
“B” A ranking is not assigned for index score improvement if fewer than eleven (11) student scores were included in either the current or prior year index score.
“NA” Data is not available.Page 7 of 21

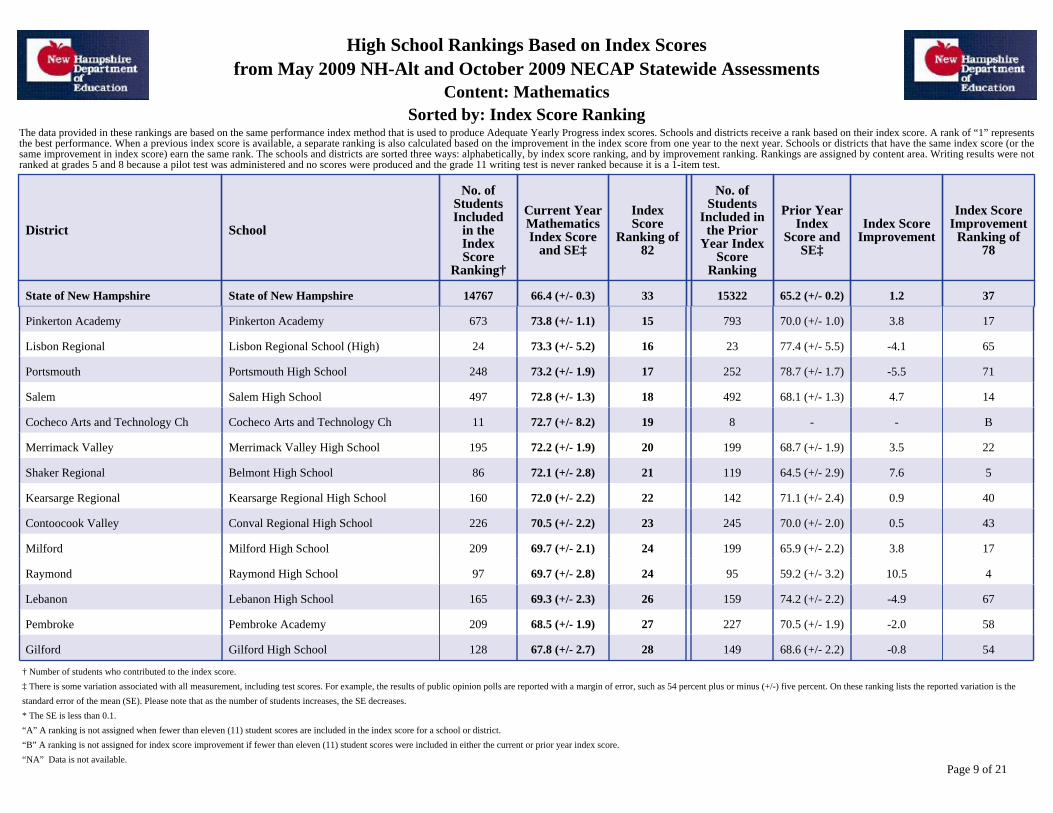
High School Rankings Based on Index Scoresfrom May 2009 NH-Alt and October 2009 NECAP Statewide Assessments
Content: MathematicsSorted by: Index Score Ranking
The data provided in these rankings are based on the same performance index method that is used to produce Adequate Yearly Progress index scores. Schools and districts receive a rank based on their index score. A rank of “1” representsthe best performance. When a previous index score is available, a separate ranking is also calculated based on the improvement in the index score from one year to the next year. Schools or districts that have the same index score (or thesame improvement in index score) earn the same rank. The schools and districts are sorted three ways: alphabetically, by index score ranking, and by improvement ranking. Rankings are assigned by content area. Writing results were notranked at grades 5 and 8 because a pilot test was administered and no scores were produced and the grade 11 writing test is never ranked because it is a 1-item test.
District School
No. ofStudentsIncluded
in theIndexScore
Ranking†
Current YearMathematicsIndex Score
and SE‡
IndexScore
Ranking of82
No. ofStudents
Included inthe Prior
Year IndexScore
Ranking
Prior YearIndex
Score andSE‡
Index ScoreImprovement
Index ScoreImprovement
Ranking of78
State of New Hampshire State of New Hampshire 14767 66.4 (+/- 0.3) 33 15322 65.2 (+/- 0.2) 1.2 37
Dresden Hanover High School 168 87.5 (+/- 1.8) 1 145 88.4 (+/- 1.9) -0.9 55
Bow Bow High School 177 83.1 (+/- 1.8) 2 153 77.4 (+/- 2.2) 5.7 11
Hollis-Brookline Cooperative Hollis-Brookline High School 223 82.6 (+/- 1.7) 3 227 77.8 (+/- 1.9) 4.8 13
Oyster River Coop Oyster River High School 165 80.2 (+/- 2.1) 4 177 79.0 (+/- 2.0) 1.2 37
Pittsburg Pittsburg School (High) 15 80.0 (+/- 7.3) 5 9 - - B
Sunapee Sunapee Sr. High School 26 80.0 (+/- 5.0) 5 51 67.8 (+/- 4.3) 12.2 2
Bedford Bedford High School 298 79.9 (+/- 1.5) 7 250 79.1 (+/- 1.7) 0.8 41
Goffstown Goffstown High School 270 77.0 (+/- 1.7) 8 273 63.4 (+/- 1.8) 13.6 1
Exeter Region Cooperative Exeter High School 355 75.9 (+/- 1.5) 9 414 72.9 (+/- 1.4) 3.0 27
Souhegan Cooperative Souhegan Coop High School 221 75.7 (+/- 1.9) 10 206 74.0 (+/- 2.1) 1.7 34
Conway Kennett High School 175 74.9 (+/- 2.1) 11 197 72.2 (+/- 2.0) 2.7 30
Hopkinton Hopkinton High School 73 74.5 (+/- 3.2) 12 88 70.9 (+/- 2.9) 3.6 19
Londonderry Londonderry Senior High School 404 74.1 (+/- 1.4) 13 454 73.5 (+/- 1.4) 0.6 42
Coe-Brown Northwood Academy Coe-Brown Northwood Academy 169 74.0 (+/- 2.2) 14 172 79.1 (+/- 2.0) -5.1 69
† Number of students who contributed to the index score.
‡ There is some variation associated with all measurement, including test scores. For example, the results of public opinion polls are reported with a margin of error, such as 54 percent plus or minus (+/-) five percent. On these ranking lists the reported variation is the
standard error of the mean (SE). Please note that as the number of students increases, the SE decreases.
* The SE is less than 0.1.
“A” A ranking is not assigned when fewer than eleven (11) student scores are included in the index score for a school or district.
“B” A ranking is not assigned for index score improvement if fewer than eleven (11) student scores were included in either the current or prior year index score.
“NA” Data is not available.Page 8 of 21
High School Rankings Based on Index Scoresfrom May 2009 NH-Alt and October 2009 NECAP Statewide Assessments
Content: MathematicsSorted by: Index Score Ranking
The data provided in these rankings are based on the same performance index method that is used to produce Adequate Yearly Progress index scores. Schools and districts receive a rank based on their index score. A rank of “1” representsthe best performance. When a previous index score is available, a separate ranking is also calculated based on the improvement in the index score from one year to the next year. Schools or districts that have the same index score (or thesame improvement in index score) earn the same rank. The schools and districts are sorted three ways: alphabetically, by index score ranking, and by improvement ranking. Rankings are assigned by content area. Writing results were notranked at grades 5 and 8 because a pilot test was administered and no scores were produced and the grade 11 writing test is never ranked because it is a 1-item test.
District School
No. ofStudentsIncluded
in theIndexScore
Ranking†
Current YearMathematicsIndex Score
and SE‡
IndexScore
Ranking of82
No. ofStudents
Included inthe Prior
Year IndexScore
Ranking
Prior YearIndex
Score andSE‡
Index ScoreImprovement
Index ScoreImprovement
Ranking of78
State of New Hampshire State of New Hampshire 14767 66.4 (+/- 0.3) 33 15322 65.2 (+/- 0.2) 1.2 37
Pinkerton Academy Pinkerton Academy 673 73.8 (+/- 1.1) 15 793 70.0 (+/- 1.0) 3.8 17
Lisbon Regional Lisbon Regional School (High) 24 73.3 (+/- 5.2) 16 23 77.4 (+/- 5.5) -4.1 65
Portsmouth Portsmouth High School 248 73.2 (+/- 1.9) 17 252 78.7 (+/- 1.7) -5.5 71
Salem Salem High School 497 72.8 (+/- 1.3) 18 492 68.1 (+/- 1.3) 4.7 14
Cocheco Arts and Technology Ch Cocheco Arts and Technology Ch 11 72.7 (+/- 8.2) 19 8 - - B
Merrimack Valley Merrimack Valley High School 195 72.2 (+/- 1.9) 20 199 68.7 (+/- 1.9) 3.5 22
Shaker Regional Belmont High School 86 72.1 (+/- 2.8) 21 119 64.5 (+/- 2.9) 7.6 5
Kearsarge Regional Kearsarge Regional High School 160 72.0 (+/- 2.2) 22 142 71.1 (+/- 2.4) 0.9 40
Contoocook Valley Conval Regional High School 226 70.5 (+/- 2.2) 23 245 70.0 (+/- 2.0) 0.5 43
Milford Milford High School 209 69.7 (+/- 2.1) 24 199 65.9 (+/- 2.2) 3.8 17
Raymond Raymond High School 97 69.7 (+/- 2.8) 24 95 59.2 (+/- 3.2) 10.5 4
Lebanon Lebanon High School 165 69.3 (+/- 2.3) 26 159 74.2 (+/- 2.2) -4.9 67
Pembroke Pembroke Academy 209 68.5 (+/- 1.9) 27 227 70.5 (+/- 1.9) -2.0 58
Gilford Gilford High School 128 67.8 (+/- 2.7) 28 149 68.6 (+/- 2.2) -0.8 54
† Number of students who contributed to the index score.
‡ There is some variation associated with all measurement, including test scores. For example, the results of public opinion polls are reported with a margin of error, such as 54 percent plus or minus (+/-) five percent. On these ranking lists the reported variation is the
standard error of the mean (SE). Please note that as the number of students increases, the SE decreases.
* The SE is less than 0.1.
“A” A ranking is not assigned when fewer than eleven (11) student scores are included in the index score for a school or district.
“B” A ranking is not assigned for index score improvement if fewer than eleven (11) student scores were included in either the current or prior year index score.
“NA” Data is not available.Page 9 of 21

High School Rankings Based on Index Scoresfrom May 2009 NH-Alt and October 2009 NECAP Statewide Assessments
Content: MathematicsSorted by: Index Score Ranking
The data provided in these rankings are based on the same performance index method that is used to produce Adequate Yearly Progress index scores. Schools and districts receive a rank based on their index score. A rank of “1” representsthe best performance. When a previous index score is available, a separate ranking is also calculated based on the improvement in the index score from one year to the next year. Schools or districts that have the same index score (or thesame improvement in index score) earn the same rank. The schools and districts are sorted three ways: alphabetically, by index score ranking, and by improvement ranking. Rankings are assigned by content area. Writing results were notranked at grades 5 and 8 because a pilot test was administered and no scores were produced and the grade 11 writing test is never ranked because it is a 1-item test.
District School
No. ofStudentsIncluded
in theIndexScore
Ranking†
Current YearMathematicsIndex Score
and SE‡
IndexScore
Ranking of82
No. ofStudents
Included inthe Prior
Year IndexScore
Ranking
Prior YearIndex
Score andSE‡
Index ScoreImprovement
Index ScoreImprovement
Ranking of78
State of New Hampshire State of New Hampshire 14767 66.4 (+/- 0.3) 33 15322 65.2 (+/- 0.2) 1.2 37
Keene Keene High School 360 67.8 (+/- 1.6) 28 415 65.8 (+/- 1.5) 2.0 32
Profile Profile Senior High School 36 67.8 (+/- 5.4) 28 50 68.4 (+/- 4.1) -0.6 51
Dover Dover Senior High School 334 66.6 (+/- 1.6) 31 381 61.9 (+/- 1.5) 4.7 14
Merrimack Merrimack High School 353 66.6 (+/- 1.6) 31 368 62.3 (+/- 1.6) 4.3 16
John Stark Regional John Stark Regional High Sch 183 66.4 (+/- 2.1) 33 201 69.8 (+/- 2.0) -3.4 62
Rochester Spaulding High School 322 65.7 (+/- 1.7) 35 325 59.9 (+/- 1.7) 5.8 9
Colebrook Colebrook Academy 33 65.5 (+/- 4.9) 36 26 66.2 (+/- 5.5) -0.7 53
Fall Mountain Regional Fall Mountain Regional High Sc 153 65.5 (+/- 2.4) 36 142 65.5 (+/- 2.6) 0.0 48
Concord Concord High School 388 65.0 (+/- 1.6) 38 381 68.9 (+/- 1.6) -3.9 64
Timberlane Regional Timberlane Regional High Sch 354 65.0 (+/- 1.6) 38 356 63.1 (+/- 1.6) 1.9 33
Wilton-Lyndeborough Wilton-Lyndeboro Senior High S 64 65.0 (+/- 4.1) 38 52 59.2 (+/- 4.3) 5.8 9
Sanborn Regional Sanborn Regional High School 159 64.8 (+/- 2.5) 41 191 57.8 (+/- 2.2) 7.0 7
Litchfield Campbell High School 135 64.6 (+/- 2.6) 42 135 61.8 (+/- 2.7) 2.8 29
Manchester Manchester Central High School 431 64.3 (+/- 1.5) 43 422 63.8 (+/- 1.4) 0.5 43
† Number of students who contributed to the index score.
‡ There is some variation associated with all measurement, including test scores. For example, the results of public opinion polls are reported with a margin of error, such as 54 percent plus or minus (+/-) five percent. On these ranking lists the reported variation is the
standard error of the mean (SE). Please note that as the number of students increases, the SE decreases.
* The SE is less than 0.1.
“A” A ranking is not assigned when fewer than eleven (11) student scores are included in the index score for a school or district.
“B” A ranking is not assigned for index score improvement if fewer than eleven (11) student scores were included in either the current or prior year index score.
“NA” Data is not available.Page 10 of 21

High School Rankings Based on Index Scoresfrom May 2009 NH-Alt and October 2009 NECAP Statewide Assessments
Content: MathematicsSorted by: Index Score Ranking
The data provided in these rankings are based on the same performance index method that is used to produce Adequate Yearly Progress index scores. Schools and districts receive a rank based on their index score. A rank of “1” representsthe best performance. When a previous index score is available, a separate ranking is also calculated based on the improvement in the index score from one year to the next year. Schools or districts that have the same index score (or thesame improvement in index score) earn the same rank. The schools and districts are sorted three ways: alphabetically, by index score ranking, and by improvement ranking. Rankings are assigned by content area. Writing results were notranked at grades 5 and 8 because a pilot test was administered and no scores were produced and the grade 11 writing test is never ranked because it is a 1-item test.
District School
No. ofStudentsIncluded
in theIndexScore
Ranking†
Current YearMathematicsIndex Score
and SE‡
IndexScore
Ranking of82
No. ofStudents
Included inthe Prior
Year IndexScore
Ranking
Prior YearIndex
Score andSE‡
Index ScoreImprovement
Index ScoreImprovement
Ranking of78
State of New Hampshire State of New Hampshire 14767 66.4 (+/- 0.3) 33 15322 65.2 (+/- 0.2) 1.2 37
Epping Epping High School 66 64.2 (+/- 3.4) 44 76 52.4 (+/- 3.4) 11.8 3
Northumberland Groveton High School 29 64.1 (+/- 6.4) 45 31 60.6 (+/- 5.8) 3.5 22
Hudson Alvirne High School 321 63.9 (+/- 1.7) 46 346 66.8 (+/- 1.5) -2.9 61
Nashua Nashua High School North 448 63.9 (+/- 1.5) 46 449 60.4 (+/- 1.5) 3.5 22
Winnacunnet Cooperative Winnacunnet High School 296 63.6 (+/- 1.8) 48 289 65.3 (+/- 1.8) -1.7 57
Inter-Lakes Cooperative Inter-Lakes High School 88 63.4 (+/- 2.9) 49 99 56.8 (+/- 2.9) 6.6 8
Pemi-Baker Regional Plymouth Regional High School 184 63.2 (+/- 2.1) 50 186 65.2 (+/- 2.2) -2.0 58
Mascoma Valley Regional Mascoma Valley Regional High S 110 62.9 (+/- 2.9) 51 82 62.9 (+/- 3.2) 0.0 48
Gorham Randolph Shelburne Coop Gorham High School 43 62.8 (+/- 4.5) 52 38 71.1 (+/- 4.9) -8.3 76
Winnisquam Regional Winnisquam Regional High Sch 95 62.7 (+/- 3.1) 53 130 59.8 (+/- 2.7) 2.9 28
Monadnock Regional Monadnock Regional High School 133 62.6 (+/- 2.7) 54 155 63.0 (+/- 2.4) -0.4 50
Lincoln-Woodstock Cooperative Lin-Wood Public School (High) 24 62.5 (+/- 5.3) 55 33 73.9 (+/- 3.9) -11.4 77
Governor Wentworth Regional Kingswood Regional High School 208 62.3 (+/- 2.1) 56 208 62.0 (+/- 2.2) 0.3 47
Somersworth Somersworth High School 138 62.3 (+/- 2.6) 56 110 57.1 (+/- 2.7) 5.2 12
† Number of students who contributed to the index score.
‡ There is some variation associated with all measurement, including test scores. For example, the results of public opinion polls are reported with a margin of error, such as 54 percent plus or minus (+/-) five percent. On these ranking lists the reported variation is the
standard error of the mean (SE). Please note that as the number of students increases, the SE decreases.
* The SE is less than 0.1.
“A” A ranking is not assigned when fewer than eleven (11) student scores are included in the index score for a school or district.
“B” A ranking is not assigned for index score improvement if fewer than eleven (11) student scores were included in either the current or prior year index score.
“NA” Data is not available.Page 11 of 21

High School Rankings Based on Index Scoresfrom May 2009 NH-Alt and October 2009 NECAP Statewide Assessments
Content: MathematicsSorted by: Index Score Ranking
The data provided in these rankings are based on the same performance index method that is used to produce Adequate Yearly Progress index scores. Schools and districts receive a rank based on their index score. A rank of “1” representsthe best performance. When a previous index score is available, a separate ranking is also calculated based on the improvement in the index score from one year to the next year. Schools or districts that have the same index score (or thesame improvement in index score) earn the same rank. The schools and districts are sorted three ways: alphabetically, by index score ranking, and by improvement ranking. Rankings are assigned by content area. Writing results were notranked at grades 5 and 8 because a pilot test was administered and no scores were produced and the grade 11 writing test is never ranked because it is a 1-item test.
District School
No. ofStudentsIncluded
in theIndexScore
Ranking†
Current YearMathematicsIndex Score
and SE‡
IndexScore
Ranking of82
No. ofStudents
Included inthe Prior
Year IndexScore
Ranking
Prior YearIndex
Score andSE‡
Index ScoreImprovement
Index ScoreImprovement
Ranking of78
State of New Hampshire State of New Hampshire 14767 66.4 (+/- 0.3) 33 15322 65.2 (+/- 0.2) 1.2 37
Newfound Area Newfound Regional High School 97 61.9 (+/- 2.9) 58 96 58.3 (+/- 2.9) 3.6 19
Claremont Stevens High School 112 61.6 (+/- 2.9) 59 150 58.0 (+/- 2.5) 3.6 19
Hinsdale Hinsdale High School 45 61.3 (+/- 3.9) 60 60 68.3 (+/- 3.6) -7.0 75
Littleton Littleton High School 50 61.2 (+/- 4.2) 61 65 53.8 (+/- 3.9) 7.4 6
Mascenic Regional Mascenic Regional High School 117 61.0 (+/- 2.8) 62 77 57.7 (+/- 3.6) 3.3 25
Newmarket Newmarket Jr.-Sr. High School 76 60.5 (+/- 3.4) 63 70 65.4 (+/- 4.0) -4.9 67
Nashua Nashua High School South 495 60.1 (+/- 1.4) 64 523 62.9 (+/- 1.4) -2.8 60
Pelham Pelham High School 147 60.1 (+/- 2.3) 64 171 66.1 (+/- 2.3) -6.0 72
Manchester Manchester Memorial High Sch 396 60.0 (+/- 1.6) 66 465 59.6 (+/- 1.4) 0.4 46
Haverhill Cooperative Woodsville High School 52 60.0 (+/- 3.9) 66 47 58.3 (+/- 3.9) 1.7 34
Berlin Berlin Senior High School 122 59.7 (+/- 2.6) 68 128 63.9 (+/- 2.8) -4.2 66
Prospect Mountain JMA Prospect Mountain High School 126 59.7 (+/- 2.8) 68 122 63.4 (+/- 2.8) -3.7 63
Newport Newport Middle High School (Hi 91 59.3 (+/- 3.1) 70 86 58.8 (+/- 3.2) 0.5 43
Moultonborough Moultonborough Academy 60 58.7 (+/- 3.9) 71 58 72.1 (+/- 4.0) -13.4 78
† Number of students who contributed to the index score.
‡ There is some variation associated with all measurement, including test scores. For example, the results of public opinion polls are reported with a margin of error, such as 54 percent plus or minus (+/-) five percent. On these ranking lists the reported variation is the
standard error of the mean (SE). Please note that as the number of students increases, the SE decreases.
* The SE is less than 0.1.
“A” A ranking is not assigned when fewer than eleven (11) student scores are included in the index score for a school or district.
“B” A ranking is not assigned for index score improvement if fewer than eleven (11) student scores were included in either the current or prior year index score.
“NA” Data is not available.Page 12 of 21

High School Rankings Based on Index Scoresfrom May 2009 NH-Alt and October 2009 NECAP Statewide Assessments
Content: MathematicsSorted by: Index Score Ranking
The data provided in these rankings are based on the same performance index method that is used to produce Adequate Yearly Progress index scores. Schools and districts receive a rank based on their index score. A rank of “1” representsthe best performance. When a previous index score is available, a separate ranking is also calculated based on the improvement in the index score from one year to the next year. Schools or districts that have the same index score (or thesame improvement in index score) earn the same rank. The schools and districts are sorted three ways: alphabetically, by index score ranking, and by improvement ranking. Rankings are assigned by content area. Writing results were notranked at grades 5 and 8 because a pilot test was administered and no scores were produced and the grade 11 writing test is never ranked because it is a 1-item test.
District School
No. ofStudentsIncluded
in theIndexScore
Ranking†
Current YearMathematicsIndex Score
and SE‡
IndexScore
Ranking of82
No. ofStudents
Included inthe Prior
Year IndexScore
Ranking
Prior YearIndex
Score andSE‡
Index ScoreImprovement
Index ScoreImprovement
Ranking of78
State of New Hampshire State of New Hampshire 14767 66.4 (+/- 0.3) 33 15322 65.2 (+/- 0.2) 1.2 37
Laconia Laconia High School 196 57.0 (+/- 2.2) 72 185 57.6 (+/- 2.1) -0.6 51
Jaffrey-Rindge Cooperative Conant High School 131 56.5 (+/- 2.7) 73 105 62.5 (+/- 3.1) -6.0 72
White Mountains Regional White Mountains Regional High 96 56.0 (+/- 3.0) 74 91 62.4 (+/- 3.3) -6.4 74
Pittsfield Pittsfield High School 41 55.6 (+/- 5.4) 75 40 56.5 (+/- 4.7) -0.9 55
Manchester Manchester West High School 247 54.4 (+/- 1.9) 76 254 52.0 (+/- 1.9) 2.4 31
Farmington Farmington Senior High School 94 53.6 (+/- 3.1) 77 93 52.3 (+/- 3.3) 1.3 36
Franklin Franklin High School 78 53.1 (+/- 3.2) 78 89 49.9 (+/- 3.1) 3.2 26
Hillsboro-Deering Cooperative Hillsboro-Deering High School 107 49.3 (+/- 2.8) 79 128 54.4 (+/- 2.6) -5.1 69
Great Bay eLearning Charter Sc Great Bay eLearning Charter Sc 30 46.7 (+/- 4.7) 80 9 - - B
Milton Nute High School 45 46.2 (+/- 3.2) 81 39 45.1 (+/- 5.0) 1.1 39
Rochester Bud Carlson Academy 18 15.6 (+/- 2.6) 82 0 - - B
New Hampshire Charter Equestri Academy for Equine Sciences Ch 7 - A 4 - - B
Academy for Science and Design Academy for Sci & Design-H 1 - A 3 - - B
CSI Charter School CSI Charter School 0 - A 0 - - B
† Number of students who contributed to the index score.
‡ There is some variation associated with all measurement, including test scores. For example, the results of public opinion polls are reported with a margin of error, such as 54 percent plus or minus (+/-) five percent. On these ranking lists the reported variation is the
standard error of the mean (SE). Please note that as the number of students increases, the SE decreases.
* The SE is less than 0.1.
“A” A ranking is not assigned when fewer than eleven (11) student scores are included in the index score for a school or district.
“B” A ranking is not assigned for index score improvement if fewer than eleven (11) student scores were included in either the current or prior year index score.
“NA” Data is not available.Page 13 of 21

High School Rankings Based on Index Scoresfrom May 2009 NH-Alt and October 2009 NECAP Statewide Assessments
Content: MathematicsSorted by: Index Score Ranking
The data provided in these rankings are based on the same performance index method that is used to produce Adequate Yearly Progress index scores. Schools and districts receive a rank based on their index score. A rank of “1” representsthe best performance. When a previous index score is available, a separate ranking is also calculated based on the improvement in the index score from one year to the next year. Schools or districts that have the same index score (or thesame improvement in index score) earn the same rank. The schools and districts are sorted three ways: alphabetically, by index score ranking, and by improvement ranking. Rankings are assigned by content area. Writing results were notranked at grades 5 and 8 because a pilot test was administered and no scores were produced and the grade 11 writing test is never ranked because it is a 1-item test.
District School
No. ofStudentsIncluded
in theIndexScore
Ranking†
Current YearMathematicsIndex Score
and SE‡
IndexScore
Ranking of82
No. ofStudents
Included inthe Prior
Year IndexScore
Ranking
Prior YearIndex
Score andSE‡
Index ScoreImprovement
Index ScoreImprovement
Ranking of78
State of New Hampshire State of New Hampshire 14767 66.4 (+/- 0.3) 33 15322 65.2 (+/- 0.2) 1.2 37
Ledyard Charter Academy Ledyard Charter Academy 0 - A NA - - B
North Country Charter Academy North Country Charter Academy 0 - A 2 - - B
Stratford Stratford Public School (High) 1 - A 15 64.0 (+/- 8.3) - B
Nashua The Phoenix Program (H) 7 - A 0 - - B
Virtual Learning Academy Chart Virtual Learning Academy (H) 3 - A 0 - - B
Windham Windham High School 0 - A NA - - B
.
.
.
.
.
.
.
.
† Number of students who contributed to the index score.
‡ There is some variation associated with all measurement, including test scores. For example, the results of public opinion polls are reported with a margin of error, such as 54 percent plus or minus (+/-) five percent. On these ranking lists the reported variation is the
standard error of the mean (SE). Please note that as the number of students increases, the SE decreases.
* The SE is less than 0.1.
“A” A ranking is not assigned when fewer than eleven (11) student scores are included in the index score for a school or district.
“B” A ranking is not assigned for index score improvement if fewer than eleven (11) student scores were included in either the current or prior year index score.
“NA” Data is not available.Page 14 of 21

High School Rankings Based on Index Scoresfrom May 2009 NH-Alt and October 2009 NECAP Statewide Assessments
Content: MathematicsSorted by: Index Score Improvement Ranking
The data provided in these rankings are based on the same performance index method that is used to produce Adequate Yearly Progress index scores. Schools and districts receive a rank based on their index score. A rank of “1” representsthe best performance. When a previous index score is available, a separate ranking is also calculated based on the improvement in the index score from one year to the next year. Schools or districts that have the same index score (or thesame improvement in index score) earn the same rank. The schools and districts are sorted three ways: alphabetically, by index score ranking, and by improvement ranking. Rankings are assigned by content area. Writing results were notranked at grades 5 and 8 because a pilot test was administered and no scores were produced and the grade 11 writing test is never ranked because it is a 1-item test.
District School
No. ofStudentsIncluded
in theIndexScore
Ranking†
Current YearMathematicsIndex Score
and SE‡
IndexScore
Ranking of82
No. ofStudents
Included inthe Prior
Year IndexScore
Ranking
Prior YearIndex
Score andSE‡
Index ScoreImprovement
Index ScoreImprovement
Ranking of78
State of New Hampshire State of New Hampshire 14767 66.4 (+/- 0.3) 33 15322 65.2 (+/- 0.2) 1.2 37
Goffstown Goffstown High School 270 77.0 (+/- 1.7) 8 273 63.4 (+/- 1.8) 13.6 1
Sunapee Sunapee Sr. High School 26 80.0 (+/- 5.0) 5 51 67.8 (+/- 4.3) 12.2 2
Epping Epping High School 66 64.2 (+/- 3.4) 44 76 52.4 (+/- 3.4) 11.8 3
Raymond Raymond High School 97 69.7 (+/- 2.8) 24 95 59.2 (+/- 3.2) 10.5 4
Shaker Regional Belmont High School 86 72.1 (+/- 2.8) 21 119 64.5 (+/- 2.9) 7.6 5
Littleton Littleton High School 50 61.2 (+/- 4.2) 61 65 53.8 (+/- 3.9) 7.4 6
Sanborn Regional Sanborn Regional High School 159 64.8 (+/- 2.5) 41 191 57.8 (+/- 2.2) 7.0 7
Inter-Lakes Cooperative Inter-Lakes High School 88 63.4 (+/- 2.9) 49 99 56.8 (+/- 2.9) 6.6 8
Rochester Spaulding High School 322 65.7 (+/- 1.7) 35 325 59.9 (+/- 1.7) 5.8 9
Wilton-Lyndeborough Wilton-Lyndeboro Senior High S 64 65.0 (+/- 4.1) 38 52 59.2 (+/- 4.3) 5.8 9
Bow Bow High School 177 83.1 (+/- 1.8) 2 153 77.4 (+/- 2.2) 5.7 11
Somersworth Somersworth High School 138 62.3 (+/- 2.6) 56 110 57.1 (+/- 2.7) 5.2 12
Hollis-Brookline Cooperative Hollis-Brookline High School 223 82.6 (+/- 1.7) 3 227 77.8 (+/- 1.9) 4.8 13
Dover Dover Senior High School 334 66.6 (+/- 1.6) 31 381 61.9 (+/- 1.5) 4.7 14
† Number of students who contributed to the index score.
‡ There is some variation associated with all measurement, including test scores. For example, the results of public opinion polls are reported with a margin of error, such as 54 percent plus or minus (+/-) five percent. On these ranking lists the reported variation is the
standard error of the mean (SE). Please note that as the number of students increases, the SE decreases.
* The SE is less than 0.1.
“A” A ranking is not assigned when fewer than eleven (11) student scores are included in the index score for a school or district.
“B” A ranking is not assigned for index score improvement if fewer than eleven (11) student scores were included in either the current or prior year index score.
“NA” Data is not available.Page 15 of 21

High School Rankings Based on Index Scoresfrom May 2009 NH-Alt and October 2009 NECAP Statewide Assessments
Content: MathematicsSorted by: Index Score Improvement Ranking
The data provided in these rankings are based on the same performance index method that is used to produce Adequate Yearly Progress index scores. Schools and districts receive a rank based on their index score. A rank of “1” representsthe best performance. When a previous index score is available, a separate ranking is also calculated based on the improvement in the index score from one year to the next year. Schools or districts that have the same index score (or thesame improvement in index score) earn the same rank. The schools and districts are sorted three ways: alphabetically, by index score ranking, and by improvement ranking. Rankings are assigned by content area. Writing results were notranked at grades 5 and 8 because a pilot test was administered and no scores were produced and the grade 11 writing test is never ranked because it is a 1-item test.
District School
No. ofStudentsIncluded
in theIndexScore
Ranking†
Current YearMathematicsIndex Score
and SE‡
IndexScore
Ranking of82
No. ofStudents
Included inthe Prior
Year IndexScore
Ranking
Prior YearIndex
Score andSE‡
Index ScoreImprovement
Index ScoreImprovement
Ranking of78
State of New Hampshire State of New Hampshire 14767 66.4 (+/- 0.3) 33 15322 65.2 (+/- 0.2) 1.2 37
Salem Salem High School 497 72.8 (+/- 1.3) 18 492 68.1 (+/- 1.3) 4.7 14
Merrimack Merrimack High School 353 66.6 (+/- 1.6) 31 368 62.3 (+/- 1.6) 4.3 16
Milford Milford High School 209 69.7 (+/- 2.1) 24 199 65.9 (+/- 2.2) 3.8 17
Pinkerton Academy Pinkerton Academy 673 73.8 (+/- 1.1) 15 793 70.0 (+/- 1.0) 3.8 17
Hopkinton Hopkinton High School 73 74.5 (+/- 3.2) 12 88 70.9 (+/- 2.9) 3.6 19
Newfound Area Newfound Regional High School 97 61.9 (+/- 2.9) 58 96 58.3 (+/- 2.9) 3.6 19
Claremont Stevens High School 112 61.6 (+/- 2.9) 59 150 58.0 (+/- 2.5) 3.6 19
Northumberland Groveton High School 29 64.1 (+/- 6.4) 45 31 60.6 (+/- 5.8) 3.5 22
Merrimack Valley Merrimack Valley High School 195 72.2 (+/- 1.9) 20 199 68.7 (+/- 1.9) 3.5 22
Nashua Nashua High School North 448 63.9 (+/- 1.5) 46 449 60.4 (+/- 1.5) 3.5 22
Mascenic Regional Mascenic Regional High School 117 61.0 (+/- 2.8) 62 77 57.7 (+/- 3.6) 3.3 25
Franklin Franklin High School 78 53.1 (+/- 3.2) 78 89 49.9 (+/- 3.1) 3.2 26
Exeter Region Cooperative Exeter High School 355 75.9 (+/- 1.5) 9 414 72.9 (+/- 1.4) 3.0 27
Winnisquam Regional Winnisquam Regional High Sch 95 62.7 (+/- 3.1) 53 130 59.8 (+/- 2.7) 2.9 28
† Number of students who contributed to the index score.
‡ There is some variation associated with all measurement, including test scores. For example, the results of public opinion polls are reported with a margin of error, such as 54 percent plus or minus (+/-) five percent. On these ranking lists the reported variation is the
standard error of the mean (SE). Please note that as the number of students increases, the SE decreases.
* The SE is less than 0.1.
“A” A ranking is not assigned when fewer than eleven (11) student scores are included in the index score for a school or district.
“B” A ranking is not assigned for index score improvement if fewer than eleven (11) student scores were included in either the current or prior year index score.
“NA” Data is not available.Page 16 of 21

High School Rankings Based on Index Scoresfrom May 2009 NH-Alt and October 2009 NECAP Statewide Assessments
Content: MathematicsSorted by: Index Score Improvement Ranking
The data provided in these rankings are based on the same performance index method that is used to produce Adequate Yearly Progress index scores. Schools and districts receive a rank based on their index score. A rank of “1” representsthe best performance. When a previous index score is available, a separate ranking is also calculated based on the improvement in the index score from one year to the next year. Schools or districts that have the same index score (or thesame improvement in index score) earn the same rank. The schools and districts are sorted three ways: alphabetically, by index score ranking, and by improvement ranking. Rankings are assigned by content area. Writing results were notranked at grades 5 and 8 because a pilot test was administered and no scores were produced and the grade 11 writing test is never ranked because it is a 1-item test.
District School
No. ofStudentsIncluded
in theIndexScore
Ranking†
Current YearMathematicsIndex Score
and SE‡
IndexScore
Ranking of82
No. ofStudents
Included inthe Prior
Year IndexScore
Ranking
Prior YearIndex
Score andSE‡
Index ScoreImprovement
Index ScoreImprovement
Ranking of78
State of New Hampshire State of New Hampshire 14767 66.4 (+/- 0.3) 33 15322 65.2 (+/- 0.2) 1.2 37
Litchfield Campbell High School 135 64.6 (+/- 2.6) 42 135 61.8 (+/- 2.7) 2.8 29
Conway Kennett High School 175 74.9 (+/- 2.1) 11 197 72.2 (+/- 2.0) 2.7 30
Manchester Manchester West High School 247 54.4 (+/- 1.9) 76 254 52.0 (+/- 1.9) 2.4 31
Keene Keene High School 360 67.8 (+/- 1.6) 28 415 65.8 (+/- 1.5) 2.0 32
Timberlane Regional Timberlane Regional High Sch 354 65.0 (+/- 1.6) 38 356 63.1 (+/- 1.6) 1.9 33
Souhegan Cooperative Souhegan Coop High School 221 75.7 (+/- 1.9) 10 206 74.0 (+/- 2.1) 1.7 34
Haverhill Cooperative Woodsville High School 52 60.0 (+/- 3.9) 66 47 58.3 (+/- 3.9) 1.7 34
Farmington Farmington Senior High School 94 53.6 (+/- 3.1) 77 93 52.3 (+/- 3.3) 1.3 36
Oyster River Coop Oyster River High School 165 80.2 (+/- 2.1) 4 177 79.0 (+/- 2.0) 1.2 37
Milton Nute High School 45 46.2 (+/- 3.2) 81 39 45.1 (+/- 5.0) 1.1 39
Kearsarge Regional Kearsarge Regional High School 160 72.0 (+/- 2.2) 22 142 71.1 (+/- 2.4) 0.9 40
Bedford Bedford High School 298 79.9 (+/- 1.5) 7 250 79.1 (+/- 1.7) 0.8 41
Londonderry Londonderry Senior High School 404 74.1 (+/- 1.4) 13 454 73.5 (+/- 1.4) 0.6 42
Contoocook Valley Conval Regional High School 226 70.5 (+/- 2.2) 23 245 70.0 (+/- 2.0) 0.5 43
† Number of students who contributed to the index score.
‡ There is some variation associated with all measurement, including test scores. For example, the results of public opinion polls are reported with a margin of error, such as 54 percent plus or minus (+/-) five percent. On these ranking lists the reported variation is the
standard error of the mean (SE). Please note that as the number of students increases, the SE decreases.
* The SE is less than 0.1.
“A” A ranking is not assigned when fewer than eleven (11) student scores are included in the index score for a school or district.
“B” A ranking is not assigned for index score improvement if fewer than eleven (11) student scores were included in either the current or prior year index score.
“NA” Data is not available.Page 17 of 21

High School Rankings Based on Index Scoresfrom May 2009 NH-Alt and October 2009 NECAP Statewide Assessments
Content: MathematicsSorted by: Index Score Improvement Ranking
The data provided in these rankings are based on the same performance index method that is used to produce Adequate Yearly Progress index scores. Schools and districts receive a rank based on their index score. A rank of “1” representsthe best performance. When a previous index score is available, a separate ranking is also calculated based on the improvement in the index score from one year to the next year. Schools or districts that have the same index score (or thesame improvement in index score) earn the same rank. The schools and districts are sorted three ways: alphabetically, by index score ranking, and by improvement ranking. Rankings are assigned by content area. Writing results were notranked at grades 5 and 8 because a pilot test was administered and no scores were produced and the grade 11 writing test is never ranked because it is a 1-item test.
District School
No. ofStudentsIncluded
in theIndexScore
Ranking†
Current YearMathematicsIndex Score
and SE‡
IndexScore
Ranking of82
No. ofStudents
Included inthe Prior
Year IndexScore
Ranking
Prior YearIndex
Score andSE‡
Index ScoreImprovement
Index ScoreImprovement
Ranking of78
State of New Hampshire State of New Hampshire 14767 66.4 (+/- 0.3) 33 15322 65.2 (+/- 0.2) 1.2 37
Manchester Manchester Central High School 431 64.3 (+/- 1.5) 43 422 63.8 (+/- 1.4) 0.5 43
Newport Newport Middle High School (Hi 91 59.3 (+/- 3.1) 70 86 58.8 (+/- 3.2) 0.5 43
Manchester Manchester Memorial High Sch 396 60.0 (+/- 1.6) 66 465 59.6 (+/- 1.4) 0.4 46
Governor Wentworth Regional Kingswood Regional High School 208 62.3 (+/- 2.1) 56 208 62.0 (+/- 2.2) 0.3 47
Fall Mountain Regional Fall Mountain Regional High Sc 153 65.5 (+/- 2.4) 36 142 65.5 (+/- 2.6) 0.0 48
Mascoma Valley Regional Mascoma Valley Regional High S 110 62.9 (+/- 2.9) 51 82 62.9 (+/- 3.2) 0.0 48
Monadnock Regional Monadnock Regional High School 133 62.6 (+/- 2.7) 54 155 63.0 (+/- 2.4) -0.4 50
Laconia Laconia High School 196 57.0 (+/- 2.2) 72 185 57.6 (+/- 2.1) -0.6 51
Profile Profile Senior High School 36 67.8 (+/- 5.4) 28 50 68.4 (+/- 4.1) -0.6 51
Colebrook Colebrook Academy 33 65.5 (+/- 4.9) 36 26 66.2 (+/- 5.5) -0.7 53
Gilford Gilford High School 128 67.8 (+/- 2.7) 28 149 68.6 (+/- 2.2) -0.8 54
Dresden Hanover High School 168 87.5 (+/- 1.8) 1 145 88.4 (+/- 1.9) -0.9 55
Pittsfield Pittsfield High School 41 55.6 (+/- 5.4) 75 40 56.5 (+/- 4.7) -0.9 55
Winnacunnet Cooperative Winnacunnet High School 296 63.6 (+/- 1.8) 48 289 65.3 (+/- 1.8) -1.7 57
† Number of students who contributed to the index score.
‡ There is some variation associated with all measurement, including test scores. For example, the results of public opinion polls are reported with a margin of error, such as 54 percent plus or minus (+/-) five percent. On these ranking lists the reported variation is the
standard error of the mean (SE). Please note that as the number of students increases, the SE decreases.
* The SE is less than 0.1.
“A” A ranking is not assigned when fewer than eleven (11) student scores are included in the index score for a school or district.
“B” A ranking is not assigned for index score improvement if fewer than eleven (11) student scores were included in either the current or prior year index score.
“NA” Data is not available.Page 18 of 21

High School Rankings Based on Index Scoresfrom May 2009 NH-Alt and October 2009 NECAP Statewide Assessments
Content: MathematicsSorted by: Index Score Improvement Ranking
The data provided in these rankings are based on the same performance index method that is used to produce Adequate Yearly Progress index scores. Schools and districts receive a rank based on their index score. A rank of “1” representsthe best performance. When a previous index score is available, a separate ranking is also calculated based on the improvement in the index score from one year to the next year. Schools or districts that have the same index score (or thesame improvement in index score) earn the same rank. The schools and districts are sorted three ways: alphabetically, by index score ranking, and by improvement ranking. Rankings are assigned by content area. Writing results were notranked at grades 5 and 8 because a pilot test was administered and no scores were produced and the grade 11 writing test is never ranked because it is a 1-item test.
District School
No. ofStudentsIncluded
in theIndexScore
Ranking†
Current YearMathematicsIndex Score
and SE‡
IndexScore
Ranking of82
No. ofStudents
Included inthe Prior
Year IndexScore
Ranking
Prior YearIndex
Score andSE‡
Index ScoreImprovement
Index ScoreImprovement
Ranking of78
State of New Hampshire State of New Hampshire 14767 66.4 (+/- 0.3) 33 15322 65.2 (+/- 0.2) 1.2 37
Pembroke Pembroke Academy 209 68.5 (+/- 1.9) 27 227 70.5 (+/- 1.9) -2.0 58
Pemi-Baker Regional Plymouth Regional High School 184 63.2 (+/- 2.1) 50 186 65.2 (+/- 2.2) -2.0 58
Nashua Nashua High School South 495 60.1 (+/- 1.4) 64 523 62.9 (+/- 1.4) -2.8 60
Hudson Alvirne High School 321 63.9 (+/- 1.7) 46 346 66.8 (+/- 1.5) -2.9 61
John Stark Regional John Stark Regional High Sch 183 66.4 (+/- 2.1) 33 201 69.8 (+/- 2.0) -3.4 62
Prospect Mountain JMA Prospect Mountain High School 126 59.7 (+/- 2.8) 68 122 63.4 (+/- 2.8) -3.7 63
Concord Concord High School 388 65.0 (+/- 1.6) 38 381 68.9 (+/- 1.6) -3.9 64
Lisbon Regional Lisbon Regional School (High) 24 73.3 (+/- 5.2) 16 23 77.4 (+/- 5.5) -4.1 65
Berlin Berlin Senior High School 122 59.7 (+/- 2.6) 68 128 63.9 (+/- 2.8) -4.2 66
Lebanon Lebanon High School 165 69.3 (+/- 2.3) 26 159 74.2 (+/- 2.2) -4.9 67
Newmarket Newmarket Jr.-Sr. High School 76 60.5 (+/- 3.4) 63 70 65.4 (+/- 4.0) -4.9 67
Coe-Brown Northwood Academy Coe-Brown Northwood Academy 169 74.0 (+/- 2.2) 14 172 79.1 (+/- 2.0) -5.1 69
Hillsboro-Deering Cooperative Hillsboro-Deering High School 107 49.3 (+/- 2.8) 79 128 54.4 (+/- 2.6) -5.1 69
Portsmouth Portsmouth High School 248 73.2 (+/- 1.9) 17 252 78.7 (+/- 1.7) -5.5 71
† Number of students who contributed to the index score.
‡ There is some variation associated with all measurement, including test scores. For example, the results of public opinion polls are reported with a margin of error, such as 54 percent plus or minus (+/-) five percent. On these ranking lists the reported variation is the
standard error of the mean (SE). Please note that as the number of students increases, the SE decreases.
* The SE is less than 0.1.
“A” A ranking is not assigned when fewer than eleven (11) student scores are included in the index score for a school or district.
“B” A ranking is not assigned for index score improvement if fewer than eleven (11) student scores were included in either the current or prior year index score.
“NA” Data is not available.Page 19 of 21

High School Rankings Based on Index Scoresfrom May 2009 NH-Alt and October 2009 NECAP Statewide Assessments
Content: MathematicsSorted by: Index Score Improvement Ranking
The data provided in these rankings are based on the same performance index method that is used to produce Adequate Yearly Progress index scores. Schools and districts receive a rank based on their index score. A rank of “1” representsthe best performance. When a previous index score is available, a separate ranking is also calculated based on the improvement in the index score from one year to the next year. Schools or districts that have the same index score (or thesame improvement in index score) earn the same rank. The schools and districts are sorted three ways: alphabetically, by index score ranking, and by improvement ranking. Rankings are assigned by content area. Writing results were notranked at grades 5 and 8 because a pilot test was administered and no scores were produced and the grade 11 writing test is never ranked because it is a 1-item test.
District School
No. ofStudentsIncluded
in theIndexScore
Ranking†
Current YearMathematicsIndex Score
and SE‡
IndexScore
Ranking of82
No. ofStudents
Included inthe Prior
Year IndexScore
Ranking
Prior YearIndex
Score andSE‡
Index ScoreImprovement
Index ScoreImprovement
Ranking of78
State of New Hampshire State of New Hampshire 14767 66.4 (+/- 0.3) 33 15322 65.2 (+/- 0.2) 1.2 37
Jaffrey-Rindge Cooperative Conant High School 131 56.5 (+/- 2.7) 73 105 62.5 (+/- 3.1) -6.0 72
Pelham Pelham High School 147 60.1 (+/- 2.3) 64 171 66.1 (+/- 2.3) -6.0 72
White Mountains Regional White Mountains Regional High 96 56.0 (+/- 3.0) 74 91 62.4 (+/- 3.3) -6.4 74
Hinsdale Hinsdale High School 45 61.3 (+/- 3.9) 60 60 68.3 (+/- 3.6) -7.0 75
Gorham Randolph Shelburne Coop Gorham High School 43 62.8 (+/- 4.5) 52 38 71.1 (+/- 4.9) -8.3 76
Lincoln-Woodstock Cooperative Lin-Wood Public School (High) 24 62.5 (+/- 5.3) 55 33 73.9 (+/- 3.9) -11.4 77
Moultonborough Moultonborough Academy 60 58.7 (+/- 3.9) 71 58 72.1 (+/- 4.0) -13.4 78
New Hampshire Charter Equestri Academy for Equine Sciences Ch 7 - A 4 - - B
Academy for Science and Design Academy for Sci & Design-H 1 - A 3 - - B
Rochester Bud Carlson Academy 18 15.6 (+/- 2.6) 82 0 - - B
Cocheco Arts and Technology Ch Cocheco Arts and Technology Ch 11 72.7 (+/- 8.2) 19 8 - - B
CSI Charter School CSI Charter School 0 - A 0 - - B
Great Bay eLearning Charter Sc Great Bay eLearning Charter Sc 30 46.7 (+/- 4.7) 80 9 - - B
Ledyard Charter Academy Ledyard Charter Academy 0 - A NA - - B
† Number of students who contributed to the index score.
‡ There is some variation associated with all measurement, including test scores. For example, the results of public opinion polls are reported with a margin of error, such as 54 percent plus or minus (+/-) five percent. On these ranking lists the reported variation is the
standard error of the mean (SE). Please note that as the number of students increases, the SE decreases.
* The SE is less than 0.1.
“A” A ranking is not assigned when fewer than eleven (11) student scores are included in the index score for a school or district.
“B” A ranking is not assigned for index score improvement if fewer than eleven (11) student scores were included in either the current or prior year index score.
“NA” Data is not available.Page 20 of 21
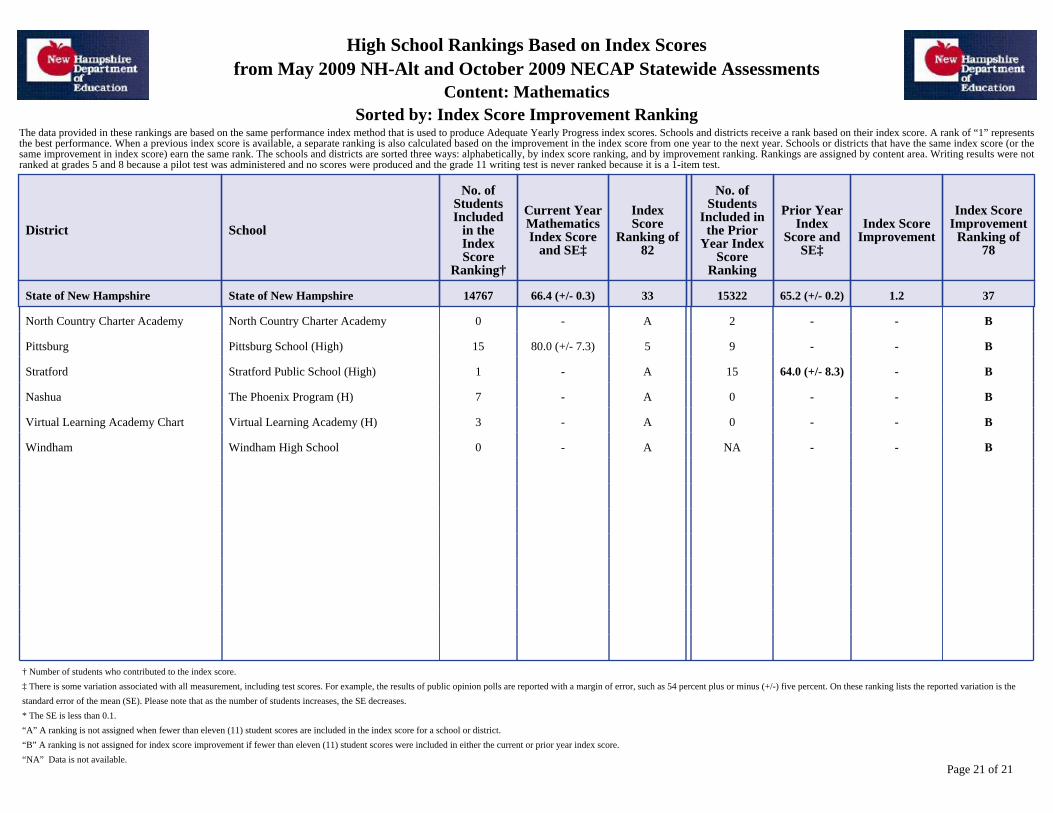
High School Rankings Based on Index Scoresfrom May 2009 NH-Alt and October 2009 NECAP Statewide Assessments
Content: MathematicsSorted by: Index Score Improvement Ranking
The data provided in these rankings are based on the same performance index method that is used to produce Adequate Yearly Progress index scores. Schools and districts receive a rank based on their index score. A rank of “1” representsthe best performance. When a previous index score is available, a separate ranking is also calculated based on the improvement in the index score from one year to the next year. Schools or districts that have the same index score (or thesame improvement in index score) earn the same rank. The schools and districts are sorted three ways: alphabetically, by index score ranking, and by improvement ranking. Rankings are assigned by content area. Writing results were notranked at grades 5 and 8 because a pilot test was administered and no scores were produced and the grade 11 writing test is never ranked because it is a 1-item test.
District School
No. ofStudentsIncluded
in theIndexScore
Ranking†
Current YearMathematicsIndex Score
and SE‡
IndexScore
Ranking of82
No. ofStudents
Included inthe Prior
Year IndexScore
Ranking
Prior YearIndex
Score andSE‡
Index ScoreImprovement
Index ScoreImprovement
Ranking of78
State of New Hampshire State of New Hampshire 14767 66.4 (+/- 0.3) 33 15322 65.2 (+/- 0.2) 1.2 37
North Country Charter Academy North Country Charter Academy 0 - A 2 - - B
Pittsburg Pittsburg School (High) 15 80.0 (+/- 7.3) 5 9 - - B
Stratford Stratford Public School (High) 1 - A 15 64.0 (+/- 8.3) - B
Nashua The Phoenix Program (H) 7 - A 0 - - B
Virtual Learning Academy Chart Virtual Learning Academy (H) 3 - A 0 - - B
Windham Windham High School 0 - A NA - - B
.
.
.
.
.
.
.
.
† Number of students who contributed to the index score.
‡ There is some variation associated with all measurement, including test scores. For example, the results of public opinion polls are reported with a margin of error, such as 54 percent plus or minus (+/-) five percent. On these ranking lists the reported variation is the
standard error of the mean (SE). Please note that as the number of students increases, the SE decreases.
* The SE is less than 0.1.
“A” A ranking is not assigned when fewer than eleven (11) student scores are included in the index score for a school or district.
“B” A ranking is not assigned for index score improvement if fewer than eleven (11) student scores were included in either the current or prior year index score.
“NA” Data is not available.Page 21 of 21