bathymetry survey field sampling plan
TRANSCRIPT

Bathymetry Survey Field Sampling Plan
Portland Harbor Pre-Remedial Design Investigation and Baseline Sampling Portland Harbor Superfund Site
AECOM Project Number: 60554349 Geosyntec Project Number: PNG0767
February 20, 2018
FINAL

Bathymetry Survey Field Sampling Plan 20 February 2018 Page ii
Prepared for:
United States Environmental Protection Agency, Region 10 1200 Sixth Avenue, Suite 900 Seattle, Washington 98101
On behalf of:
Portland Harbor Pre-RD AOC Group Portland, Oregon Prepared by:
111 SW Columbia, Suite 1500 Portland, OR 97201 USA
520 Pike Street, Suite 1375 Seattle, WA 98101 USA
Copyright © 2018 by AECOM
All rights reserved. No part of this copyrighted work may be reproduced, distributed, or transmitted in any form or by any means without the prior written permission of AECOM.

Bathymetry Survey Field Sampling Plan 20 February 2018 Page iii
CERTIFICATION
I certify under penalty of law that this document and all attachments were prepared under my direction or supervision in accordance with a system designed to assure that qualified personnel properly gather and evaluate the information submitted. Based on my inquiry of the person or persons who manage the system, or those persons directly responsible for gathering the information, the information submitted is, to the best of my knowledge and belief, true, accurate, and complete. I am aware that there are significant penalties for submitting false information, including the possibility of fine and imprisonment for knowing violations.
February 16, 2018
Kenneth M. Tyrrell PDI Project Coordinator AECOM Technical Services
Date

Bathymetry Survey Field Sampling Plan 20 February 2018 Page iv
TABLE OF CONTENTS
1. INTRODUCTION ..................................................................................................................1 1.1 Project Setting ...............................................................................................................1 1.2 Project Overview and Objectives ..................................................................................2 1.3 Project Organization .....................................................................................................3 1.4 Communication/Information Flow ...............................................................................4 1.5 Coordination with EPA .................................................................................................4
2. SCOPE OF WORK ................................................................................................................4
3. PROJECT SCHEDULE .........................................................................................................5
4. DATA MANAGEMENT AND REPORTING .......................................................................5
5. DELIVERABLES ..................................................................................................................6
6. REFERENCES .......................................................................................................................6
LIST OF TABLES
Table 1. DEA 2004 Monument Table with Control Network Coordinates
LIST OF FIGURES
Figure 1. Multibeam Bathymetric Survey Area
Figure 2. Vertical Datum Conversion Table
Figure 3. DEQ Upland Site Boundary
Figure 4. DEA 2004 Monument Map
LIST OF APPENDICES
Appendix A. David Evans & Associates, 2018 Hydrographic Survey Work and Quality Control Plan Portland Harbor PDI Studies

Bathymetry Survey Field Sampling Plan 20 February 2018 Page v
ACRONYMS AND ABBREVIATIONS
AECOM AECOM Technical Services ASAOC Administrative Settlement Agreement and Order on Consent CRD Columbia River Datum DEA David Evans & Associates, Inc. EPA United States Environmental Protection Agency FC Field Coordinator FS feasibility study FSP Field Sampling Plan Geosyntec Geosyntec Consultants, Inc. GNSS Global Navigation Satellite System HAZWOPER Hazardous Waste Operations and Emergency Response HIPS Hydrographic Image Processing System LWG Lower Willamette Group NAD83/91 North American Datum of 1983/1991 NAVD88 North American Vertical Datum of 1988 OSHA Occupational Safety and Health Administration PDI Pre-Remedial Design Investigation PHSS Portland Harbor Superfund Site Pre-RD AOC Group Pre-Remedial Design Agreement and Order on Consent Group PWC personal water craft QAPP Quality Assurance Project Plan RI remedial investigation RM river mile ROD Record of Decision SIPS Sonar Image Processing System Site Portland Harbor Superfund Site SOW Statement of Work USACE U.S. Army Corps of Engineers

Bathymetry Survey Field Sampling Plan 20 February 2018 Page 1
1. INTRODUCTION The Record of Decision (ROD) described a post-ROD sampling effort for the Portland Harbor Superfund Site (Site or PHSS; Figure 1) located in Portland, Oregon, to delineate and better refine the sediment management area footprints, refine the Conceptual Site Model, determine baseline conditions, and support remedial design (United States Environmental Protection Agency [EPA] 2017a). Geosyntec Consultants, Inc. (Geosyntec), and AECOM Technical Services (AECOM) have submitted a Work Plan for Pre-Remedial Design Investigations (PDI) on behalf of a group of industrial parties called the Pre-Remedial Design Agreement and Order on Consent Group (Pre-RD AOC Group). In winter 2017, EPA entered into an Administrative Settlement Agreement and Order on Consent (ASAOC) with the Pre-RD AOC Group to conduct the PDI studies at the Site (EPA 2017b). The Statement of Work (SOW), which is an appendix to the ASAOC, and the Work Plan (as an attachment to the SOW) generally describe the field investigation activities, data analyses, schedule, and deliverables for the PDI.
A remedial investigation (RI)/feasibility study (FS) was initiated in 2001 by a group of potentially responsible parties known as the Lower Willamette Group (LWG) and completed by EPA in 2016 (EPA 2016a, 2016b). The RI consisted of three rounds of data collection, including surface and subsurface sediment, bank soils, surface water, sediment traps, porewater, and fish tissue from 2001 through 2007.
The Work Plan (Geosyntec 2017) is a focused and foundational step in what will be a multi-phase effort to update current conditions from the collection of data over the past 15 years. It provides an overview of studies that will be prepared for the PDI at the PHSS. This Field Sampling Plan (FSP) was prepared to support the bathymetric survey efforts outlined in the Work Plan and the project Quality Assurance Project Plan (AECOM and Geosyntec 2018). The Site-wide bathymetry survey is intended to refresh and update the surface bed elevations to current conditions and fill in no-coverage areas (especially nearshore) to support the initial remedial design activities.
1.1 Project Setting
The PHSS is located in Portland, Oregon, on the lower Willamette River immediately downstream of the urban downtown. The Willamette River is a dynamic waterbody that originates within Oregon in the Cascade Mountain Range and flows approximately 187 miles north to its confluence with the Columbia River. The Site extends from river mile (RM) 1.9 near the mouth of the Willamette River upstream to RM 11.8 (Figure 1). The Downtown Reach, which includes the urbanized area of downtown Portland, is defined by EPA as extending from RM 11.8 to RM 16.6. EPA defines the Upriver Reach as extending from RM 16.6 to RM 28.4.
The Site includes a water-dependent, highly industrialized area, which contains a multitude of facilities and both private and municipal outfalls. Land use along the lower Willamette River in the Portland Harbor includes marine terminals, manufacturing and other commercial and

Bathymetry Survey Field Sampling Plan 20 February 2018 Page 2
municipal operations, and public facilities, parks, and open spaces (EPA 2016b). A federally maintained Navigation Channel, extending nearly bank-to-bank in some areas, doubles the natural depth of the river and allows transit of large ships into the active harbor; the PHSS serves as a major shipping route for containerized and bulk cargo. Common shoreline features within the harbor include constructed bulkheads, piers, wharves, buildings extending over the water, and steeply sloped banks armored with riprap or other fill materials (EPA 2016b). The State of Oregon owns certain submerged and submersible lands underlying navigable and tidally influenced waters.
1.2 Project Overview and Objectives
The scope of this FSP includes conducting a bank-to-bank1 bathymetric survey of the lower Willamette River from RM 1.9 to 11.8 and down the Multnomah Channel to the Sauvie Island Bridge; see Figure 1 for the coverage area. Vertically, the coverage area will extend up the riverbanks to an elevation of +13.0 feet North American Vertical Datum of 1988 [NAVD88] or approximately +7.8 feet Columbia River Datum (CRD) where practical (Figure 2). The vertical coverage elevation of +13.0 feet NAVD88 was selected as the target for the bathymetric survey extent based on the Final 2016 Portland Harbor RI/FS Figure 2.2-1 (Figure 3).
The bathymetric survey will document current bed elevations throughout the Site. This survey will include all accessible nearshore areas (e.g., Swan Island Lagoon), as well as the federal Navigation Channel. The data set will also assess changes in elevation/sedimentation as technically feasible using the pre-existing surveys; the most comprehensive survey of the Site was conducted in 2004 (and was used in the FS). Multi-beam sonar will be used to collect high-resolution data with maximum coverage of the riverbed where accessible. If additional coverage is needed in nearshore areas that are difficult to access, then custom personal water crafts (PWCs) or Remote-Controlled Q-boat equipped with single-beam sonar, lead-line measurements, or airborne LiDAR data may be used. Equipment used in each area will depend on the water elevation at the time of surveying. David Evans and Associates, Inc. (DEA), the preferred contractor for conducting the bathymetric survey, will utilize the highest quality equipment it has that meets the minimum survey depth capable, 2.5 feet for PWCs or 1.5 feet for the Q-boat; additional equipment specifications are provided in DEA’s 2018 Hydrographic Survey Work and Quality Control Plan (Appendix A). To maximize efficiency and extend multi-beam coverage, the survey should be conducted during high river levels that exceed 15.0 feet NAVD88. Surveying at lower river levels will increase survey time.
If needed for spatial coverage, DEA will develop a second Work Plan that will describe how LiDAR will be collected or adapted from other studies and include the technical specifications. The LiDAR Work Plan would be a post-approval addendum to this FSP if it is determined that LiDAR is necessary to collect data up to the desired +13.0 feet NAVD88. This data gap assessment will be conducted after the multi-beam and single-beam field work has been 1 For this FSP, the “bank” is defined as an elevation of +13 feet above the NAVD88 or approximately +7.8 feet above the CRD.

Bathymetry Survey Field Sampling Plan 20 February 2018 Page 3
completed. The data collection and processing methods will follow procedures outlined in DEA’s Hydrographic Survey Work and Quality Control Plan (Appendix A).
DEA has acquired five surveys of the Portland Harbor since 2002 on behalf of the LWG. DEA performed surveys for the LWG in January and July 2002, May 2003, February 2004, and February 2007 as part of the Portland Harbor RI/FS. Additionally, a June 2009 survey of the Willamette River was conducted by DEA for the National Ocean and Atmospheric Administration to update nautical charts.
The new bathymetric data, collected as part of this PDI study, will be used to:
• Update baseline maps;
• Support sediment sampling efforts;
• Refine the elevation clearances for dredging and capping;
• Help estimate shoaling and scouring areas relative to previous surveys; and
• Support confirmation of the estimated dredge volume.
Bathymetry results may serve as a line of evidence for evaluating riverbed slope conditions, recovery potential, and bed stability (e.g., erosional versus depositional areas).
1.3 Project Organization
Team organization is detailed in the PDI Work Plan and in Section 2 of the Quality Assurance Project Plan (QAPP) (AECOM and Geosyntec 2018a). As it relates to this FSP, AECOM and Geosyntec are coordinating activities including management of all subcontractors, field sampling, analysis, and reporting scoping tasks. The PDI Project Coordinator, Ken Tyrrell, and PDI Project Manager, Jennifer Pretare, (AECOM), will be responsible for overall project coordination and providing oversight on all project deliverables. Anne Fitzpatrick (Geosyntec) is the project’s senior technical lead for this task. Nicky Moody (AECOM) and Keith Kroeger (Geosyntec) will be the Project Field Coordinators (FCs) and will be generally responsible for field quality assurance/quality control oversight.
Luke Smith (Geosyntec) will be the technical lead for this FSP and responsible for communication with DEA and provide oversight during field work. Luke Smith is a licensed Professional Engineer that maintains 40-hour Occupational Safety and Health Administration (OSHA) Hazardous Waste Operations and Emergency Response (HAZWOPER) training and 8-hour OSHA HAZWOPER Supervisor training. While providing oversight, Geosyntec will ensure that DEA accurately collects critical data and will work with DEA to analyze post-survey data.
DEA will perform vessel support with Jon Dasler as the point of contact. Details of DEA boats and crew are provided in Appendix A. The hydrographic survey crew will consist of one boat with two hydrographers from DEA and one Professional Engineer from Geosyntec. The DEA survey crew has conducted numerous multi-beam and side-scan sonar surveys and has had

Bathymetry Survey Field Sampling Plan 20 February 2018 Page 4
extensive training in hydrographic surveys. DEA hydrographic staff members have attended training courses and have many years of experience in multi-beam and side-scan sonar operations. DEA’s hydrographic staff has completed a 1-week training session in the use of CARIS Hydrographic Image Processing System (HIPS) and the Sonar Image Processing System (SIPS).
1.4 Communication/Information Flow
The communication strategy is outlined in Section 2 of the QAPP (AECOM and Geosyntec 2018a). In brief, the FCs will be the points of contact for field staff during the implementation of this FSP. Luke Smith will be the point person for the team on the boat with DEA. Deviations from this FSP or the project-specific QAPP will be reported to the project’s senior technical lead and PDI Project Manager, for consultation. Significant deviations from the FSP/QAPP will be further reported to representatives of the Pre-RD AOC Group and EPA by the PDI Project Coordinator.
1.5 Coordination with EPA
The PDI Project Coordinator will notify the EPA Project Manager 1 week prior to beginning any field activities so that EPA can schedule any oversight activities required. The PDI Project Coordinator will also notify the EPA Project Manager once field activities have been completed.
2. SCOPE OF WORK This FSP will follow the technical approaches presented by DEA in Appendix A, which follows the National Geospatial Data Policy (EPA 2008) and National Geospatial Data Policy Procedure for Geospatial Metadata Management (EPA 2010). DEA’s 2018 Hydrographic Survey Work and Quality Control Plan (Appendix A) provides horizontal/vertical control methods, instrumentation, and survey methodology associated with providing hydrographic services, mapping, and data management.
The primary vessel that will be used during the multi-beam bathymetry survey is the William R. Broughton; a 24-foot survey vessel outfitted with dual Teledyne Reson SeaBat T50-P precision multi-beam sonars. Prior to deploying survey vessels, the DEA crew will perform a static position check using the check antenna; this process verifies correctors are being obtained and validates geodetic parameters. Validation of base station position and height relative to project datum will follow procedures discussed in Appendix A.
All bathymetric surveying will be consistent with prior surveys for the RI/FS and will conform to the standards established by the U.S. Army Corps of Engineers (USACE) Hydrographic Surveying (Engineer Manual 1110-2-1003) (USACE 2013), in accordance with requirements for “Navigation & Dredging Support Surveys.” DEA has developed an updated Work Plan associated with this planned survey work (Appendix A) that discusses the technical specifications that will be used in the field. Targeted vertical and horizontal accuracy for the
Bathymetry Survey Field Sampling Plan 20 February 2018 Page 5
surveying is plus or minus 0.3 feet at a 95% confidence level. All work will be supervised and final deliverables approved by a DEA Oregon-registered Professional Land Surveyor and National Society of Professional Surveyors/The Hydrographic Society of America Certified Hydrographer. The bathymetric surveying will be based on the remedial design and performance monitoring data needs and will be consistent with previous site surveys.
As a modification to the multi-beam surveys performed by DEA on behalf of the LWG, fill lines will be run by DEA with a custom PWC equipped with a survey-grade, single-beam bathymetric sonar system to supplement data gaps. The multi-beam bathymetric data will be used to create a digital terrain model of the riverbed morphology from which hillshade images will be generated. During lower times in the daily tide cycle and when there is less daylight, deeper water will be surveyed (Navigation Channel). When there is better daylight and higher water elevations, shoreline areas will be surveyed. The river will be worked in sections covering bank-to-bank to minimize vessel travel time and maximize survey time.
To check the accuracy of the positioning system and confirm that the geodetic parameters used in the real-time projection to the North American Datum of 1983/1991 (NAD83/91) Oregon North Zone coordinate system are correct, a position check on established monuments will be conducted. Figure 4 shows historical monuments that were referenced in DEA’s 2004 field survey report for the Portland Harbor RI, and Table 1 lists the coordinates, which includes their permanently operating Global Navigation Satellite System (GNSS) reference station. The GNSS station will be used for survey control. Trimble SPS-855 dual frequency GNSS receiver will be the primary equipment used for recording and processing GNSS signals.
3. PROJECT SCHEDULE The bathymetry survey is anticipated to take place in late February/early March of 2018. The survey is expected to take 7 days, with 2 days of contingency. Possible scheduling conflicts that will be considered to optimize field time are barge fleeting, vessels at berth, oil booms, structures, and restrictions around United States Navy vessels. Schedule adjustments may take place if water levels do not accommodate shallow nearshore/bank elevation goals.
4. DATA MANAGEMENT AND REPORTING Data verification and data management will be performed according to the Final Data Quality Management Plan, current draft dated January 17, 2018 (AECOM 2018b). Data management while in the field will follow protocols as put forth in Appendix A, Hydrographic Survey Work and Quality Control Plan. Following data collection, DEA will provide data processing and associated mapping consistent with prior surveys conducted by DEA for the LWG. Sounding and topographic data will be recorded to a resolution of one tenth of a foot, vertical and horizontally. Processed data will be binned to a grid size of 3 feet by 3 feet to be used for contour generation, hillshade imagery, and differencing to available prior surveys.

Bathymetry Survey Field Sampling Plan 20 February 2018 Page 6
Post-processing of multi-beam data will be conducted using CARIS Onboard and CARIS HIPS multi-beam analysis software. Patch test data will be analyzed, and any alignment corrections will be applied. The CARIS HIPS system allows for simultaneous viewing of the side-scan and multi-beam data to analyze anomalies on the riverbed during post-processing. Additional multi-beam data processing conducted by DEA is presented in Appendix A.
Processing will begin with review of each survey line using CARIS HIPS editor. Verified water surface correctors will be applied to the data set at this time. Position and sensor data will be reviewed and accepted. Sounding data will be reviewed and edited for data flyers such as returns from piling and passing vessel wakes. These data points are flagged and not used as part of the final data set. Sounding data, including sonar beams reflecting from sediment in the water column or noise due to aeration in the water column, are carefully reviewed before flagging as a data flyer. In each case, data will not be eliminated and can be unflagged during the subset editing process (Appendix A).
After swath editing, all data will be reviewed through the CARIS HIPS subset editing program to ensure no flyers remain in the data set or to re-accept data previously flagged in the swath editor. A series of subsets are made to cover multiple lines in the CARIS session. Using this method, sequential lines will be reviewed together to ensure agreement to one another (Appendix A).
5. DELIVERABLESA series of map products will be provided at a scale of 1 inch to 400 feet and will include a hard copy set and digital data (in AutoCAD or ESRI compatible files) of the following:
• Contour maps of the surveyed area at a 2-foot contour interval
• Hill-shaded relief maps color-coded by depth of the surveyed area
• ASCII x, y, z point data files for final merged data
• Metadata that conforms to the National Geospatial Data Policy
• Report in PDF format outlining survey equipment, methods, and analysis and describing any deviations from the Work Plan.
6. REFERENCESAECOM (AECOM Technical Services) and Geosyntec (Geosyntec Consultants, Inc.). 2018a.
Quality Assurance Project Plan. Draft. Portland Harbor Superfund Site, Portland, Oregon. January 2018.
AECOM and Geosyntec. 2018b. Data Quality Management Plan. Draft. Portland Harbor Superfund Site, Portland, Oregon. January 2018.
Bathymetry Survey Field Sampling Plan 20 February 2018 Page 7
EPA (United States Environmental Protection Agency). 2008. National Geospatial Data Policy. August 24.
EPA. 2010. National Geospatial Data Policy Procedure for Geospatial Metadata Management. October.
EPA. 2016a. Portland Harbor RI/FS, Final Remedial Investigation Report, Portland Oregon. United States Environmental Protection Agency Region 10, Seattle, Washington. 8 February.
EPA. 2016b. Portland Harbor RI/FS, Final Feasibility Study, Portland Oregon. United States Environmental Protection Agency Region 10, Seattle, Washington. June.
EPA. 2017a. Record of Decision Portland Harbor Superfund Site, Portland, Oregon. United States Environmental Protection Agency Region 10, Seattle, Washington. January.
EPA. 2017b. ASAOC between US EPA and the Pre-RD AOC Group for Pre-Remedial Design Investigation Studies, Portland Harbor Superfund Site, Portland Oregon. United States Environmental Protection Agency Region 10, Seattle, Washington. 18 December.
Geosyntec (Geosyntec Consultants, Inc.). 2017. Pre-Remedial Design Investigation Work Plan. Portland Harbor Superfund Site. Prepared for the Portland Harbor Pre-RD AOC Group. December.
USACE (U.S. Army Corps of Engineers). 2013. Hydrographic Surveying (Engineer Manual 1110-2-1003). November

TABLES

DEA 2004 Monument TablePortland Harbor Superfund Site
Bathymetric Survey FSP
Table
1MI/SEA February 12, 2018
Notes:-Figure taken from February 2004 Lower Willamette River MultibeamBathymetric Survey Report, Table 2
Table 1: Lower Willamette River, Control Network Coordinates

FIGURES

RM-12RM
-11
RM-1
RM-6 RM-7
RM-10RM-5
RM-4
RM-3
RM-2
RM-8
RM-9
Path: P:\Projects\Portland Pre-Design PNG0767A\900 GIS and CAD\MXDs\Bathy Survey Work Plan\Figure 1_Multibeam Bathymetric Survey Area.mxd
LegendOth e r
Rive r Mile Ma rke r
Multibeam Bathymetric Survey AreaP ortla nd Ha rb or Supe rfund SiteP DI Ba th ym e tric Surve y FSP
Fig ure1MI/SEA
Fe b rua ry 12, 2018
3,000 0 3,000Fe e t
LegendBa th ym e try Surve y Study Are a – include sSupe rfund Site Bounda ry a nd Mouth ofMultnom a h Ch a nne l to Sa uvie Isla nd Bridg eFlow Dire ctionRive r Mile Ma rke r
Study AreaSupe rfund Study Are a (RM 1.9 to 11.8)Downtown Re a ch (RM 11.8 to 16.6)Uprive r Re a ch (RM 16.6 to 28.4)
Note :1. Ae ria l Im a g e ry provide d by ESRI Ba se m a ps 2016
³
Willamette River
Multnomah Channel
Sauvie Isla nd Bridg e
Swan Island Lagoon
Site Loca tion
RM-15RM-14
RM-19RM-16
RM-13
RM-17
RM-23RM-22
RM-28
RM-18
RM-20
RM-27
RM-24
RM-12
RM-21
RM-25
RM-26 Willamette Falls
8,000 0 8,000Fe e tDowntown and Upriver Reaches
(RM 11.8 to 28.4)³Downtown a nd Uprive r
Re a ch e s

Path:
P:\Pr
ojects
\Portla
nd Pr
e-Des
ign PN
G076
7A\90
0 GIS
and C
AD\M
XDs\B
athy S
urvey
Work
Plan
\Figu
re 2_
CRD_
NAVD
88 C
onve
rsion
.mxd
Vertical Datum Conversion Table Portland Harbor Superfund SitePDI Bathymetric Survey FSP
Figure2MI/SEA
February 12, 2018
Note:1. Table taken from Figure S1, David Evans and Associates, 2014 Bathymetric Survey Report.

20
18
16
14
12
10
8
6
4
2
0
-2
22
VERTICAL DATUM: NAVD88 (Subtract 5 feet for elevation in CRD)
20
18
16
14
12
10
8
6
4
2
0
-2
22
+13 = Mean FebruaryRiver Height *
+8 = Mean SeptemberRiver Height *
* Monthly Average for 16 year periodfrom October 1987 to June 2002.
** Average of daily high water level fromJanuary 1972 through December 2005.
Ordinary High Water +20’
DEQ Upland Site Boundary +13’Mean High Water +12’ **
Round1
BeachSam
ples
Round2
BeachSam
ples
EPA “Riverbank Soils”Round 3 Data Gaps Memo (Dec 2005)
+8’
+7.4’
+11.6’
+20’
EPA’s“Riparian zone”(Feb 2006)
+13.3’
-4
-5
EPA’s“Shallows” (Feb
2006)
-4
-5
Nature and Extent Riparian Zone
*** The DEQ upland site boundary refers only to the upland state agreements; it is not a physical boundary or legal boundary that impacts EPA’s remedy decision.
***
Portland Harbor RI/FS Final Remedial Investigation Report February 8, 2016
DEQ Upland Site BoundaryPortland Harbor Superfund Site
Bathymetric Survey FSP
Figure3MI/SEA February 12, 2018
Notes:-Figure taken from Portland Harbor RI/FS Final Remedial InvestigationReport dated February 8, 2016, Figure 2.2-1-Vertical Datum is NAVD88

DEA 2004 Monument Map Portland Harbor Superfund Site
Bathymetric Survey FSP
Figure4MI/SEA February 12, 2018
Notes:-Figure taken from February 2004 Lower Willamette River MultibeamBathymetric Survey Report, Figure 1

APPENDIX A David Evans & Associates, 2018 Hydrographic Survey Work and Quality Control Plan
Portland Harbor PDI Studies

HYDROGRAPHIC SURVEY WORK AND QUALITY CONTROL PLAN PORTLAND HARBOR PDI STUDIESWILLAMETTE RIVER, OREGON
FEBRUARY 2018
Prepared by:
David Evans and Associates, Inc. 2801 SE Columbia Way, Suite 130 Vancouver, Washington 98661
Prepared for:
520 Pike Street, Suite 1375 Seattle, WA 98101
111 SW Columbia, Suite 1500 Portland, OR 97201 USA USA

HYDROGRAPHIC SURVEY WORK AND QUALITY CONTROL PLAN PORTLAND HARBOR WILLAMETTE RIVER, OREGON
FEBRUARY 2018
Prepared by:
Jon L. Dasler, PE, PLS, CH NSPS/THSOA Certified Hydrographer #107
David Evans and Associates, Inc. Senior Vice President/Director of Marine Services
Reviewed by:
Gregory P. Baird, PLS, CH NSPS/THSOA Certified Hydrographer #201
David Evans and Associates, Inc. Senior Associate/Lead Hydrographer

Portland Harbor Hydrographic Survey Work and Quality Control Plan February 12, 2018
David Evans and Associates, Inc. Page 1
I. INTRODUCTION A precision multibeam bathymetric survey of the Portland Harbor over the winter of 2018 will be conducted by David Evans and Associates, Inc. (DEA) to develop an accurate basemap of riverbed elevations. The data collection and processing methods will follow the procedures used by DEA for similar surveys of the Portland Harbor. The effort will also include an evaluation of existing lidar data for suitability for use in an overall model with optional airborne lidar surveys of the shoreline at low river levels. The results of this survey will update riverbed elevations in the Lower Willamette, develop updated map products, and conducting a terrain model difference analysis against the 2004 survey conducted for the Lower Willamette Group (LWG). This work and quality control plan covers staff, equipment, datums, methodology, and quality procedures to be employed to satisfy the bathymetric component of the site characterization. Target accuracy is plus or minus 0.3 feet at a 95% confidence level (two sigma). II. WORK PLAN GENERAL APPROACH DEA will conduct a hydrographic survey of the Portland Harbor from Willamette River Mile (RM) 1.9 to RM 11.8. and extend down the Multnomah Channel to the Sauvie Island Bridge. The extent of coverage is outlined in Figure 1.
Figure 1: Hydrographic Survey Coverage

Portland Harbor Hydrographic Survey Work and Quality Control Plan February 12, 2018
David Evans and Associates, Inc. Page 2
Although the sonar swath will extend toward shore from the vessel track, coverage in Swan Island Lagoon will be riverward of the USCG station, docks along the east bank and outboard of the drydocks. Coverage will remain outboard (river side) of marinas and floating homes in Multnomah Channel. Multibeam coverage toward shore will depend on river level at the time of survey with the intent to map to elevation 13 feet relative to the North American Vertical Datum of 1988 (NAVD88). There may be additional coverage gaps around ships or other restricted areas. All bathymetric surveying will be consistent with prior surveys for the LWG with updated instrumentation and exceed the standards established by the U.S. Army Corps of Engineers, Engineering and Design Manual for Hydrographic Surveying (EM 1110-2-1003), “Hydrographic Surveying”, in accordance with requirements for “Navigation & Dredging Support Surveys.” All work will be supervised and final deliverables approved by a DEA Oregon registered Professional Land Surveyor and National Society of Professional Surveyors (NSPS) / The Hydrographic Society of America (THSOA) Certified Hydrographer. The primary coverage will be obtained using high resolution multibeam bathymetric sonars and may be augmented with supplemental single beam sonars and/or airborne topographic lidar after assessment of coverage gaps from the multibeam bathymetric survey. To maximize efficiency and extend multibeam coverage, the survey should be conducted during high river levels that exceed 15 feet NAVD88 or 10 feet relative to Columbia River Datum (CRD). Surveying at lower river levels will increase survey time and reduce coverage. The primary vessel for this survey will be DEA’s 24-foot survey vessel William R. Broughton, based in Vancouver, WA (Figure 2). The Broughton is outfitted with dual Teledyne Reson SeaBat T50-P precision multibeam sonars with one on either side of the vessel. Each sonar logs 512 soundings with each sonar ping over a nominal swath angle of 140 degrees (70 degrees to each side of the sonar). The effective swath width will be determined through cross line analysis to determine the maximum swath angle that meets survey requirements. To maximize swath coverage and extend coverage up slope along the shoreline, the sonar heads will be tilted 15 degrees outboard.
Figure 2: DEA Survey Vessel William R. Broughton

Portland Harbor Hydrographic Survey Work and Quality Control Plan February 12, 2018
David Evans and Associates, Inc. Page 3
To extend coverage in tight areas behind wharfs, DEA’s 19-foot survey vessel River Hawk will be employed (Figure 3). The River Hawk is outfitted with a Teledyne Reson SeaBat 7101 sonar with 210 degree mapping capability. Sonar beams can be steered to map upslope from the sonar head to maximize shoreline coverage.
Figure 3: DEA’s Survey Vessel River Hawk
For consistent density mapping to 13 feet NAVD88, airborne topographic lidar would be the best method to extend coverage. Use of this method would require data acquisition at a lower water level than the water level at the time of multibeam sonar data acquisition. Supplemental soundings in shallow areas and tight areas, single beam echosounder data may be acquired with DEA’s custom outfitted Personal Watercraft (PWC). DEA has custom configured two PWC platforms that are equipped with Trimble dual frequency GNSS receivers, Submersible monitors, 12 volt acquisition computers, and Teledyne ODOM CV100 survey grade echo sounders (Figure 4). The PWCs have been used to extend mapping coverage along the Columbia River from the estuary to Bonneville Dam, used for eelgrass mapping in Coos Bay and beach profile surveys along the Oregon Coast. They are efficient, shallow draft, platforms that can extend mapping over tide flats or similar shallow gradual slopes where multibeam sonar coverage is not possible due to the low grazing angle over an extended distance. Minimum survey depth is approximately 2.5 feet.

Portland Harbor Hydrographic Survey Work and Quality Control Plan February 12, 2018
David Evans and Associates, Inc. Page 4
Figure 4: DEA’s Personal Watercraft for Single Beam Surveys Less productive but a vast improvement over lead line soundings is DEA’s remote-controlled Q-Boat (Figure 5). The Q-Boat is equipped with identical equipment as the PWC platforms other than data acquisition is transmitted via a wireless connection to a laptop near the vessel operator. Typical minimum depths acquired with this system is 1.5 feet. Q-Boat operations will be supported by one of DEA’s larger survey vessels.
Figure 5: DEA’s Remote-Controlled Q-Boat for Single Beam Surveys

Portland Harbor Hydrographic Survey Work and Quality Control Plan February 12, 2018
David Evans and Associates, Inc. Page 5
A. Specific Equipment to be Employed 1. Primary Survey Vessel:
The William R. Broughton will be used as the primary survey platform for survey operations. The Broughton is a modified Duckworth Offshore 24-foot aluminum hull vessel with twin 115 horsepower engines, owned by DEA. The vessel is designed for safe and efficient hydrographic survey operations and equipped with dual VHF radios, radar, chart plotter, emersions suites, an Emergency Position Indicator Radio Beacon (EPIRB), and emergency offshore life raft. The vessel is inspected annually by a marine Surveyor and meets all USCG requirements for a vessel of its class. For hydrographic operations the vessel is equipped with an integrated navigation and data acquisition system, mounts for an integrated GNSS (Global Navigation Satellite System that incorporate other navigational satellite systems beyond the U.S. Navstar GPS system such as the Russian system GLONASS, Galileo, Beidou and other regional systems) and inertial positioning and motion reference system, custom mounts for the Reson SeaBat sonar heads, and is ideal for operating in the Portland Harbor.
2. Secondary Survey Vessel:
The River Hawk is a purpose-built river sled for wild river single beam surveys and has been modified for multibeam data acquisition in shallow water and tight quarters. The vessel is powered by a 105 horsepower outboard with jet drive and has a 9.9 horsepower auxiliary motor. Both motors are started and controlled at the vessel helm. Additional equipment includes VHF radio, integrated GPS chart plotter/depth sounder. The vessel is inspected annually by a marine Surveyor and meets all USCG requirements for a vessel of its class. For hydrographic operations the vessel is equipped with an integrated navigation and data acquisition system, mounts for an integrated GNSS and inertial positioning and motion reference system, custom mounts for the Reson SeaBat sonar head, and is ideal for operating in the Portland Harbor.
3. Personal Watercraft: SeaDoo GTX 4-stoke personal watercraft customized by DEA with Vartech submersible monitors, ATOM personal computer, Trimble SPS 855 survey grade GNSS receiver (instrument for recording and processing GNSS signals), and Teledyne ODOM CV100 survey grade echosounder.
4. Remote Controlled Vessel: Teledyne Ocean Science Q-Boat customized by DEA with wireless data transfer of Trimble SPS 855 survey grade GNSS receiver and Teledyne ODOM CV100 survey grade echosounder.
5. Position, Heading and Motion Reference System: Applanix POS/MV-320 (Version 5 with POSPac and True Heave capabilities) with kinematic corrections from a land side GNSS base station receiver. Real-time positioning will use real-time kinematic GNSS techniques (RTK GNSS) with the POS/MV system logging raw GNSS and inertial data for post-processing kinematic (PPK) correctors to improve horizontal and vertical positioning.
Portland Harbor Hydrographic Survey Work and Quality Control Plan February 12, 2018
David Evans and Associates, Inc. Page 6
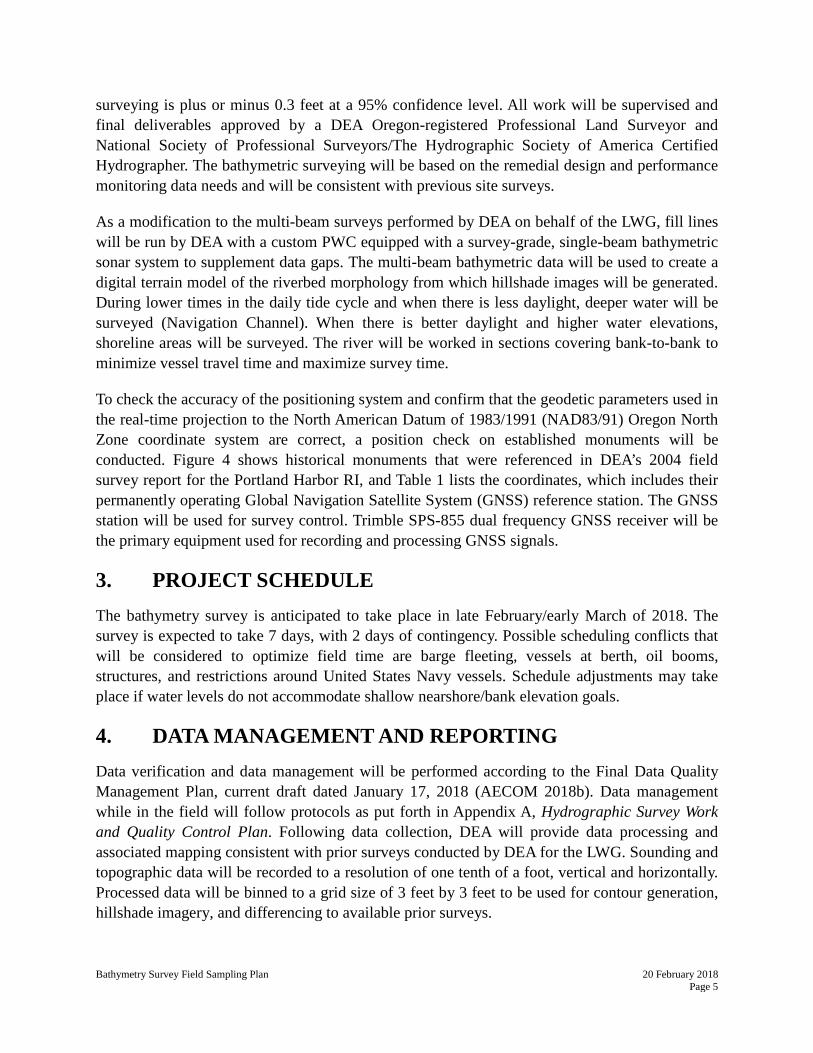
6. Sonar Systems: Teledyne Reson SeaBat T50-P dual system deployed on the Broughton. Teledyne Reson SeaBat 7101 multibeam sonar deployed on the River Hawk. Teledyne ODOM CV100 single beam echosounder deployed on PWCs and Q-Boat.
7. Sound Speed Profiler: Applied Microsystems Smart SvT&P (Sound velocity, Temperature, and Pressure) sound speed and temperature profiler. AML MicroSV sound speed probe will be located at the Reson T50-P sonar head for input directly to the sonar processor. All sound speed systems have had recent calibrations.
8. Data Acquisition System: Hypack Hysweep multibeam sonar data acquisition system (Broughton and River Hawk). CARIS Onboard data conversion and display software (Broughton). Hypack single beam data acquisition software (PWC and Q-Boat).
9. Data Processing: CARIS Onboard, CARIS Hydrographic Information Processing System (HIPS), Applanix POSPac MMS, Trimble TerraModel, and ArcGIS software.
10. GNSS Base Station: Trimble Net R9 GNSS receiver permanently deployed on DEA Marine Services office with correctors received on survey platforms via Networked Transport of RTCM via Internet Protocol (NTRIP) and Intuicom cellular modems.
11. Secondary dual frequency GNSS for real-time and post-processed kinematic positioning: Trimble SPS-855 dual frequency receiver or equivalent (Primary positioning system on PWC and Q-Boat).
B. Mobilization and Demobilization All vessels and equipment listed are based in DEA’s Marine Services office near the Marine Park in Vancouver, Washington. Equipment will be configured, tested and position checks conducted at DEA’s Marine Services office. Larger vessels will be staged at Fred’s Marina in Multnomah Channel where they can take on fuel as required and moored with shore power. After completion of the survey, vessels and crew will return to Vancouver, Washington. C. Key Personnel The hydrographic survey and associated mapping will be conducted under the direction of an Oregon Professional Land Surveyor and National Society of Professional Surveyors / The Hydrographic Society of America (NSPS/THSOA) Certified Hydrographer. The hydrographic crew will consist of two DEA staff hydrographers per survey vessel, one being a Senior Hydrographer in charge of survey operations. All of DEA Marine Services field staff are well versed in the conduct of hydrographic surveys, hold state boating licenses, and are trained in CPR, First Aid and use of our onboard AED. When running shoreline in areas of submerged piling a third crew member may be used to spot obstructions.

Portland Harbor Hydrographic Survey Work and Quality Control Plan February 12, 2018
David Evans and Associates, Inc. Page 7
Key staff includes: Jon L. Dasler, PE, PLS, Certified Hydrographer (Principal-In-Charge) Mr. Dasler is DEA’s director of Marine Services and brings more than 32 years of experience in hydrographic surveying and over 40 years of land and geodetic control surveying. Mr. Dasler has been principal-in-charge, project manager and lead hydrographer on large nautical charting surveys for NOAA and hydrographic survey contracts for the USACE. Mr. Dasler is Board Member of the NSPS/THSOA Hydrographer Certification Board, served on NOAA’s Hydrographic Services Review Panel, is a member of The Hydrographic Society of America, attends conferences and symposiums to keep abreast of changing technology, and has presented papers to advance the profession of hydrography. He was involved in the earliest applications of shallow water multibeam for the monitoring of coastal structures and has management expertise proven to be beneficial for complex hydrographic projects. He is a recognized expert on Columbia River Datum and works closely with the Columbia River Pilots to provide updated accurate information at Port terminals for their portable navigation systems to improve safety of navigation. Gregory P. Baird, PLS, Certified Hydrographer (Project Surveyor) Mr. Baird has more than 30 years of experience as a hydrographer and land surveyor, ten of those years have been with DEA. He is a Certified Hydrographer by the National Society of Professional Surveyors and The Hydrographic Society of America (NSPS/THSOA), and a professional land surveyor, registered in the State of Oregon. As Project Manager, Mr. Baird is responsible for project planning, geodetic control, coordination, and oversight of data acquisition, processing, and the preparation of final mapping and report products. His extensive hydrographic and land survey experience includes a detailed knowledge of geodesy and extensive work on navigable and non-navigable waterways, ship terminals, ports and harbors, hydroelectric dams, reservoirs, lakes, and coastal jetties for port authorities, the U.S. Army Corps of Engineers, municipalities and the private sector. David T. Moehl, PLS, Certified Hydrographer (Senior Hydrographer) Mr. Moehl is an Oregon Professional Land Surveyor, an NSPS/THSOA Certified Hydrographer, and holds a US Coast Guard 100-Ton Master License. Mr. Moehl has been with DEA Marine Services for three years and has served as a field hydrographer and data processor under DEA’s projects for NOAA, the Environmental Protection Agency, U.S. Army Corps of Engineers, and Port of Portland. Mr. Moehl’s responsibilities include data acquisition, processing, and analysis of multibeam and single-beam surveys using Hypack, CARIS HIPS and Bathy Data Base, POSPAC MMS, and ESRI ArcGIS software. Prior to joining DEA in 2015, Mr. Moehl served as a hydrographic senior survey technician aboard the NOAA ships F.R. Hassler and Fairweather. Aboard the Hassler he was the hydrographer in charge and responsible for data acquisition and processing. His responsibilities included installing, configuring, and maintaining equipment used during the acquisition and processing of multibeam and side scan sonar data; supervising rotating personnel; overseeing data prior to public archival; supervised and mentored staff on appropriate data collection and processing methods; and conduced training classes for GNSS-aided inertial navigation prost-processing.
Portland Harbor Hydrographic Survey Work and Quality Control Plan February 12, 2018
David Evans and Associates, Inc. Page 8
John M. Staly (Senior Hydrographer) Mr. Staly is a senior hydrographer for DEA and has been with DEA for 11 years. His responsibilities include the collection, processing, analysis, management and quality control of hydrographic data. He has served as Senior Hydrographer on projects for the US Army Corps of Engineers, NOAA, Port of Portland and numerous other DEA clients. Prior to joining DEA, Mr. Staly was employed as an oceanographer with the Naval Oceanographic Office where he served as a Mine Warfare (MIW) survey member and geophysics/acoustics lead on board T-AGS60 class survey vessels, and a project lead for Mine Countermeasures (MCM) fleet side scan sonar (SSS) training. He received two Survey Excellence Awards for his work at the Naval Oceanographic Office in 2005. Kathleen Schacht (Data Manager and Processing Lead) Ms. Schacht has been acquiring, processing, and providing quality review of hydrographic data with the DEA Marine Services team since 2008. She serves as a hydrographer in the field and in the office as a multibeam data analyst. She served as multibeam processing lead on DEA’s contracts with NOAA, USACE, Port of Portland and numerous other clients. Prior to joining DEA, Ms. Schacht was a survey technician with NOAA on board the ship Rainier performing multibeam surveys, processing data and preparing technical reports. She has specialized training in the use of CARIS Hydrographic Information Processing System (HIPS), Hypack/Hysweep, ESRI ArcGIS, and attended the Shallow Water Multibeam Course presented by NOAA and University of New Brunswick. Jason Dorfman (Hydrographer/Vessel Operator) Mr. Dorfman is a hydrographer in the Marine Services Division of DEA and has been with DEA for four years. His responsibilities include field data acquisition, vessel operation, data processing, and preparation of final mapping and report products. Mr. Dorfman has extensive hydrographic survey experience and is well-versed in the use of acoustic imaging technologies and precision geospatial tools. He is most familiar with multibeam, single-beam, and side scan sonar surveying methods and data processing/analysis, and has performed numerous hydrographic surveys in various environments along the Gulf Coast, the Oregon and Washington coastlines, the Willamette and Columbia Rivers, the Eastern Seaboard, Alaska, and the Bahamas. He has completed the Advanced CARIS HIPS/SIPS Training Course, attended Hypack/Hysweep training seminars, and has experience utilizing a variety of other hydrographic acquisition/processing software and geospatial analysis programs. Daniel M. Prince (Hydrographic Technician/Vessel Operator) Mr. Prince is a hydrographic technician and has been with DEA for one year. His responsibilities include field data acquisition, vessel operation, and data processing on projects for NOAA and local projects in the Pacific Northwest. Prior to joining DEA Mr. Prince was a Hydrographic Assistant Survey Technician on the NOAA ship Rainier and served as a land and hydrographic survey technician for a private survey company. At Cape Fear Community College, he received an Associate in Applied Sciences in Marine Technology and participated on several research cruises. C. Datums and Survey Control The horizontal datum used for this survey will be the North American Datum of 1983/91 (NAD83/91), State Plane Coordinate System – Oregon North, with units in International Feet. This

Portland Harbor Hydrographic Survey Work and Quality Control Plan February 12, 2018
David Evans and Associates, Inc. Page 9
is the datum used for prior survey Universal Time Coordinated (UTC) time stamps will be used for all-time records. The vertical datum for this survey will be the North American Vertical Datum of 1988 (NAVD88) using the National Geodetic Survey (NGS) separation model Geoid 2009 (GEOID09), which is one of the separation models that converts NAD83/91 ellipsoid heights obtained from GNSS receivers to NAVD88 orthometric heights. Prior surveys transitioned from a custom separation model, Geoid 2003, and Geoid 2009 to obtain NAVD88 orthometric heights. All of these models and datums have been superseded by more accurate models with the current datum being NAD83(2011) and Geoid 12b is the current separation model to determine NAVD88 orthometric heights. Lidar data and any future surveys for design efforts will be based on updated datums, which provide superior results to superseded datums. It is a relatively easy process to bring data based on old superseded datums forward to current datums, which is advisable when integrating disparate data sets to avoid conflicting data. Control for this survey will be based on DEA’s permanently operating GNSS reference station, which was one of the primary stations used for the 2009 survey of the Portland Harbor conducted for the National Oceanic and Atmospheric Administration, Office of Coast Survey by DEA with data used to update map products for the LWG. The suggested maximum distance for a single base station to any point in a survey area is 20 kilometers. The maximum distance to the Portland Harbor survey area from DEA’s permanent GNSS reference station is 14 kilometers (Figure 6). Although not advisable, the Latitude, Longitude, and Ellipsoid Height of the DEA reference station will be reverted to NAD83/91 values for this survey. The horizontal shift from NAD83/91 to NAD83(2011) is approximately 0.5 feet in northing and 0.25 feet in easting. The vertical shift between NAD83/91 using GEOID09 to NAD83(2011) using GEOID12b is less than 0.1 feet. GNSS observations will be made on a few of the remaining original monuments used in the 2004 and older surveys, such as RAINDEER and DEA Roof, to verify reverted values reference the desired results. Location of this monuments are shown in Figure 6.

Portland Harbor Hydrographic Survey Work and Quality Control Plan February 12, 2018
David Evans and Associates, Inc. Page 10
Figure 6: DEA’s GNSS base station and old control relative to the survey area
D. Data Acquisition The Broughton and River Hawk will operate 10 hours a day, as daylight and weather allow, and return to Fred’s Marine daily where data will be transferred to backup drives. Survey Operations DEA hydrographers will acquire hydrographic data, ensuring that all field data acquisition requirements and standards are met. A Reson SeaBat T50-P or 7101 multibeam sonar will be used to acquire multibeam bathymetric data over the survey area. Confidence checks will be performed to confirm that the acquisition system and survey sensors are functioning properly prior to initial survey operations, if any significant changes are made, and after completion of survey operations. They will include a bar check or lead line to multibeam comparison, a sound speed confidence check, and a position check at DEA’s Marine Services office in Vancouver. During acquisition of multibeam data, preliminary coverage displays will be generated during acquisition to monitor sonar coverage of the site.

Portland Harbor Hydrographic Survey Work and Quality Control Plan February 12, 2018
David Evans and Associates, Inc. Page 11
Cross-lines will be run for a quality analysis of the data. This will verify sonar swath angle used on a flat bottom meets survey accuracy requirements of plus or minus 0.3 feet at two sigma or 95% percent confidence level.
E. Processing, Mapping and Deliverables Production Multibeam Processing Post-processing of multibeam data will be accomplished using CARIS Onboard and CARIS Hydrographic Information Processing System (HIPS) software. CARIS Onboard will be running on the survey vessel and will automatically convert data and apply preliminary processing routines during acquisition. This workflow will allow hydrographers to evaluate data as it is being acquired. CARIS HIPS will be used in the office to apply sound speed correctors and any other post-processing correctors to improve data quality. The CARIS system will maintain a record of all processing steps and summarize information on a line-by-line basis. The information will include: line identification, data files included in each line, and corrector information. Post-processing will take place at DEA Marine Services facility in Vancouver, Washington and will consist of the following: Analysis of patch test data and applying sensor bias in the vessel configuration file; Creation and application of correction files (sound speed, tide, delayed heave); Filter data based on swath width and sounding quality; Analyze surface(s) for errors and artifacts; Removal of fliers; Analysis of cross-line data and computation of uncertainties; Export of gridded soundings at project specification resolution from the accepted data of
the seafloor to be used for bathymetric contour generation and other deliverables; and Metadata generation that meets the National Geospatial Data Policy.
Hydrographic Survey Report A Project Report documenting survey operations shall include the following: A description of the navigation system including a statement of its estimated accuracy for
the survey area; A description of survey instrumentation; A description of the survey vessel, including its size, sensor configuration, instrument
set-backs, and navigation antennae locations; A description of survey procedures; Survey Logs documenting the survey; Analysis of cross-lines and uncertainty; and Documentation that the survey meets the required accuracy and guidance as set by the
U.S. Army Corps of Engineers Manual EM 110-2-1003, November 30, 2013.

Portland Harbor Hydrographic Survey Work and Quality Control Plan February 12, 2018
David Evans and Associates, Inc. Page 12
Map Products DEA will produce a digital model from the survey in ArcGIS or other mutually agreed upon mapping platform, Drawings documenting the survey will be produced consisting of the following: Basemap of the Willamette River from existing aerial imagery; Title block, legend, notes, coordinate graticules, north arrow, and scale bar; Contours with 2-foot minor and 10-foot major intervals; and Hillshade image colored by depth; and Difference maps from the 2004 multibeam survey.
F. Specific Deliverables Specific deliverables will consist of the following:
1. A series of map products will be provided at a scale of 1”=400’and will include one hard copy set of the following: Contour maps of the surveyed area at a 2-foot contour interval; and Hill shaded relief maps color coded by depth of the surveyed area.
2. A hard copy report outlining survey equipment, methodology and analysis. 3. Digital data including:
Electronic versions of all final map products in AutoCAD or ESRI compatible files; Georeferenced TIFF images for each difference analysis; ASCII X,Y,Z point data files of final merged data model and difference data; Polygon of the spatial extent of each survey used in the difference analysis; Metadata that conforms to the National Geospatial Data Policy; and Report in PDF format.
III. QUALITY CONTROL PLAN
The quality of hydrographic data depends on precise calibration and maintenance of the accuracy through automatic calibration techniques, and periodic verification of the results through data monitoring and statistical analysis of the multibeam data set. The proposed system for this task continuously monitors data quality, checks system conditions, and allows for the delivery of quality data.
A. Survey Operations, Quality Control and Quality Assurance The accuracy of any shallow water multibeam system relies on a number of contributing factors. These factors include settlement and squat (dynamic draft); sensor biases for roll, pitch, yaw and latency; static draft; and changes in the sound velocity profile. To verify multibeam sonar optimal accuracy, a battery of tests will be conducted.
Vessel Baseline Survey A baseline survey was performed prior to survey operations. No changes to sensor mounting points have occurred since the vessel survey. The sensor offset values calculated during the baseline survey will be used for the surveys under this project. Measurement accuracies from the baseline survey will be entered into the CARIS HIPS vessel file (HVF).

Portland Harbor Hydrographic Survey Work and Quality Control Plan February 12, 2018
David Evans and Associates, Inc. Page 13
Vessel File (.hvf) TPE Values All values in the CARIS HIPS TPE sensor will be populated with sensor, offset, and tidal error estimates for the creation of an accurate uncertainty model. For sensor values, the manufacturer’s reported accuracy values will be used. DEA will calculate the uncertainty for the other values. Settlement and Squat Test (Dynamic Draft) A settlement and squat test was performed prior to survey operations using post-processed kinematic (PPK) GNSS techniques. Dynamic draft measurements were measured to a precision of 1 centimeter. No modifications have been made to the vessels that would impact dynamic draft. Settlement and squat values will be used as a quality measure to compare to other water level observations and will not be applied when using ellipsoid heights from RTK GNSS processing and application of the NOAA VDatum model. Initial System Calibration A patch test will be conducted for each survey vessel to confirm alignment of the IMU sensor with the sonar transducer and to verify delay times applied to the time-tagged sensor data. The patch test will consist of a series of lines run in a specific pattern, then used in pairs to analyze roll, pitch and heading alignment bias angles, as well as latency (time delays) in the time tagging of the sensor data. The patch test lines will be run according to NOAA and USACE specifications and evaluated in the following order: latency, pitch, roll, and heading. Pitch bias will be determined by running reciprocal lines over a smooth slope or noticeable feature, perpendicular to the depth curves. Roll alignment will be determined by running reciprocal lines over a flat bottom, in the deepest part of the survey area. Heading bias will be determined from running reciprocal lines, made on each side of a submerged feature, in relatively shallow water. Lines will be run at a speed allowing for forward overlap. For this survey the Applanix POS/MV will provide precise timing to the Reson SeaBat T50-P and 7101 sonars and all acquisition computers. A precise timing latency test will be performed by running reciprocal lines over a flat bottom in a slight to moderate sea state and evaluating a small along-track slice of data in the outer swath for motion artifacts. Two sets of lines will be run and analyzed for pitch, latency, roll and heading. If analysis of both sets does not yield similar results, then the set will be re-run until a satisfactory solution is obtained. Once final mounting angles have been determined, the values will be entered into the CARIS HVF and a confidence check will be performed to verify accuracy requirements. Patch tests will be repeated whenever changes are made to equipment hardware or software, sensor failure, replacement, or whenever assessment of the data indicates that system accuracies do not meet specified requirements.

Portland Harbor Hydrographic Survey Work and Quality Control Plan February 12, 2018
David Evans and Associates, Inc. Page 14
Draft Measurement and Bar Check Comparison (Static Draft Check) While secured to the dock, draft relative to the multibeam sonar will be recorded from port and starboard draft marks abeam of the multibeam sonar mount. A bar check will be conducted pre and post survey to document the sonar static draft. Independent Verification of Sonar Data (Lead Line or Pole Sounding Check) While secured to the dock, the survey crew will log multibeam data that is RTK GNSS corrected to the project datum. A lead line or pole sounding will be acquired at the multibeam sonar head and an RTK GNSS water line observation will be simultaneously acquired. After applying the manual sounding depth to the measured water level, the resultant bottom elevation will be compared to the corrected multibeam elevation directly below the sonar. Sound Speed Profiles Sound speed profiles are vital to multibeam data acquisition programs. Sound speed profiles shall be measured frequently enough to meet multibeam depth accuracies and to maximize daily acquisition time. A real-time comparison will be made between the sound speed profiler near surface sound speed to the sound speed measured at the sonar head and any deviation noted in the log. In addition, confidence checks will be performed by comparing cast data from the primary sound velocity profiler and a secondary system at the start of the project. Crossline Comparisons Crossline comparisons will be conducted to document that sensor biases, GNSS height data, and sound velocity profiles are accounted for in the data set. A statistical analysis of the crossline comparisons will be conducted using CARIS HIPS which provides a report, compiling statistics by beam number for each junction. In addition, a statistical analysis of the cross-line data to main scheme survey lines will be conducted and included in the survey report.
B. Positioning System Quality Control and Quality Assurance The primary positioning system for this project will be an Applanix POS/MV-320 (Version 5) integrated RTK GNSS/inertial reference system. For quality control, a secondary RTK GNSS positioning system will be simultaneously acquired in Hypack software. Both systems will be receiving RTK GNSS correctors from the project base station GNSS receiver. As the GNSS base station antenna is a permanent mount, there is no need for daily position checks to verify base station setup. The base station is monitored periodically for stability by use of NGS Continuously Operating Reference Stations (CORS) and has not moved since installation in 2009. Hypack will display the vessel track from both positioning systems in real-time for monitoring of the RTK GNSS/Inertial position relative to the RTK GNSS position. Any deviation between the two positioning systems will be apparent on the navigation display screen, which is presented at the data acquisition station and at vessel helm. Deviations will be noted in the log; lines will be re-run if deemed necessary by the Senior Hydrographer.
Validation of Base Station Position and Height Relative to Project Datums To verify the GNSS NAD83/91 position, ellipsoid height, and separation model GEOID09 to obtain NAVD88 orthometric heights, GNSS observations will be made on select monuments used for some of the original surveys of the Willamette River. These observations will be made prior to survey operations and results will be in the final report.

Portland Harbor Hydrographic Survey Work and Quality Control Plan February 12, 2018
David Evans and Associates, Inc. Page 15
Position Check For quality assurance, an independent position check will be conducted prior to the survey. A permanently mounted antenna is affixed to the rood at DEA Marine Services with a cable leading to the survey vessels in the warehouse. This is an independent antenna from the GNSS base station. Prior to deploying survey vessels, DEA crew will perform a static position check using the check antenna. This process verifies correctors are being obtained and validates geodetic parameters are entered correctly in Hypack software. DEA will use this information in the survey report for documentation of survey positioning accuracy.

AECOM 111 SW Columbia Avenue Suite 1500 Portland OR, 97217 USA aecom.com Geosyntec 520 Pike Street Suite 1375 Seattle WA, 98101 USA geosyntec.com