british columbia field sampling - pbworks
TRANSCRIPT

BRITISH COLUMBIA FIELD SAMPLING MANUAL
For Continuous Monitoring Plus the Collection of Air, Air-Emission,
Water, Wastewater, Soil, Sediment, and Biological Samples
2013 Edition
(Permittee)
Prepared and published by:
Water, Air and Climate Change Branch
Ministry of Water, Land and Air Protection
Province of British Columbia
January 2003
Her Majesty the Queen in
Right of the Province of British Columbia
2013
All Rights Reserved

Canadian Cataloguing in Publication Data Main entry under title:
British Columbia field sampling manual
ISBN 0-7726-2741-X
1. Environmental sampling - British Columbia -
Handbooks, manuals, etc. I. BC Environment.
Laboratory and Systems Management.
GE45.S25B74 1996 363.73’63’09711 C95-960489-8
Notice of Copyright in the Field Sampling Manual Infobase Package
This Field Sampling Manual is protected by copyright laws and international treaty. Copyright in
the information content of the Field Sampling Manual belongs to Her Majesty the Queen in right
of the Province of British Columbia (the “Province”).
Please Note: This manual has been officially approved by the Director, Water, Air and
Climate Change Branch, Ministry of Water, Land and Air Protection. It
may be cited in Waste Management permits, approvals and orders, as well
as legislated requirements.

Preface
Field Sampling Manual, 2013 i
PREFACE
Stakeholder Representation
This manual was prepared in cooperation with stakeholders as represented by the British Columbia
Laboratory Quality Assurance Advisory Committee (BCLQAAC) and by the BCLQAAC Technical
Subcommittee.
The British Columbia Laboratory Quality Assurance Advisory Committee
Abbey Anderson, Canadian Environment Industry Association, BC Chapter
Ralph Drew, Canadian Fishing company, representing Fisheries Council of Canada
Scott Hannam, ALS Environmental, representing the Canadian Council of Independent Laboratories
Steve Horvath, Ministry of Water, Land and Air Protection
Bob Jones, GVRD, representing BC Union of Municipalities
Richard Jornitz, CanTest Ltd., representing BCWWA
Larry Keith, Ministry of Water, Land and Air Protection
Denys Leclerc, PAPRICAN, representing Council of Forest Industries of BC
Chris Pharo, Pacific Environment Science Centre, representing Environment Canada
Bob Smart, Methanex Corp., representing both the Canadian Chemical Producers’ Association
and the BC Mining Association
The BCLQAAC Technical Subcommittee
Glyn Fox, Ministry of Water, Land and Air Protection
Scott Hannam, ALS Environmental
Leslie Hardy, Morrow Environmental Inc.
Mark Hugdahl, ALS Environmental
Steve Horvath, Ministry of Water, Land and Air Protection
Robert Hunter, CanTest Ltd.
Randy Neumann, Norwest Labs
Richard Strub, Pacific Environmental Science Centre
Tom Zhu, Philip Analytical Services
Purpose
All persons required to submit environmental monitoring data as a requirement of an order, permit,
licence, approval or certificate under an enactment administered by the Minister of Water, Land and Air
Protection should, wherever practical, only report data for samples collected and tested in accordance
with methods specified in this manual. Nonetheless, this this manual should be viewed as a general guide
to sampling. Other sources should be referenced for detailed protocols, equipment options, and insights
into the usefulness of a particular method for a given situation. Sources of further information are
tabulated with each section.
Preface
Field Sampling Manual, 2013 ii
Content
Limited resources forced this manual to be concentrated on the development of priority areas of field
sampling and monitoring for the initial editions. The second edition has been enhanced by addition of a
chapter detailing methods of effluent flow measurement. Also the Stationary Air Emissions Testing
section has been revised and updated. It is expected that additional areas will be added to future editions
of this manual.
Superseded Documents
The British Columbia Field Sampling Manual For Continuous Monitoring Plus the Collection of Air, Air-
Emission, Water, Wastewater, Soil, Sediment, and Biological Samples replaces and supersedes, in whole
or in part, the following manuals previously published or sponsored by the Ministry of Environment,
Lands and Parks:
Slezak, M.W. (Editor). 1972. Report on the Minimum Interim Guidelines for Monitoring of Receiving
Waters and Ambient Air Quality in the Zone of Influence. Projects and Research Division,
Pollution Control Branch, Dept. of Lands, Forests and Water Resources, Victoria, BC. 41 pp.
Clark, M.J.R., Drinnan, W., Gregory, L., Harcombe, A., Nordin, R., and Palmer, A. 1974. A Guide to
Some Biological Sampling Methods. Projects and Research Division, Pollution Control Branch,
Ministry of Environment, Victoria, BC. 151 pp.
Keshvani, K.A. 1982. Source Testing Code for the Measurement of Emissions of Particulates from
Stationary Sources. Air Quality Engineering Unit, Waste Management Branch, Ministry of
Environment, Victoria, BC. 60 pp.
Clark, M.J.R., Shera, W.P. (Editors). 1985. Methods of Aquatic Data Collection in British Columbia: A
Catalogue. Ministry of Environment Manual 7, Ministry of Environment, Victoria, British
Columbia, Canada. 353 pp. (Report revised 1986; preliminary version published 1984.)
Bollans, R.A., R. Crozier and N.R. McQuaker. April 1989. Field Criteria for Sampling Effluents and
Receiving Waters. Waste Management Branch, Ministry of Environment, Victoria, BC. 22 pp.
Groundwater Quality Monitoring Manual. 1990. Prepared by Piteau Associates on behalf of the
Environmental Protection Dept., Ministry of Environment, Lands and Parks. North Vancouver,
B.C. 178 pp.
Clark, M.J.R. (editor). 1996. British Columbia Field Sampling Manual. Laboratory and Systems
Management, Environmental Protection Department, Ministry of Environment, Lands and Parks,
Victoria, BC, Canada. 312 pp.
Recommended Citation Clark, M.J.R. (editor). 2002. British Columbia Field Sampling Manual. Water, Air and Climate Change
Branch, Ministry of Water, Land and Air Protection, Victoria, BC, Canada. 312 pp.

Preface
Field Sampling Manual, 2013 iii
Acknowledgments The Ministry of Water, Land and Air Protection, and the British Columbia Laboratory Quality Assurance
Advisory Committee, wish to acknowledge the generous assistance provided by all the many individuals
who gave of their time, effort, and expertise and without whose assistance this manual could not have
been produced in the time and to the level of quality realized.
Funding towards development of several chapters was provided by the Aquatic Inventory Task Force of
the Resource Inventory Committee.
Contributors*:
Stan Brynjolfson
Jack Bryden
N. Cavanagh
Grant Chow
Dr. Malcolm Clark
Rob Dalrymple
Dr. R.N. Nordin
NovaTec Consultants Inc.
L.W. Pommen
Dr. Neil Shrimpton
L.G. Swain
Graham van Aggelen
Dr. P.D. Warrington
Tony Wakelin
Reviewers* :
Kris Andrews
Barb Beyer
Stan Bertold of the Greater Vancouver Regional District
Kul Bindra
Ron Bollans
Chris Brown, Pottinger Gaherty Environmental Consultants Ltd.
Dr. Jim Bryan
Bruce Carmichael
Paul Cobban
John Deniseger
James Downie, ASL Analytical Service Laboratories Ltd.
Monique Dube
Bill Duncan
Dave Ferguson, Greater Vancouver Regional District
Garry Gawnyletz, Cominco
Glyn Fox
Gordon Ford

Preface
Field Sampling Manual, 2013 iv
Liz Freyman
Kevin Gertken, Pacifica Papers
Bob Grace
Steve Horvath
Dr. Dorothy Jeffery of Zenon Environmental Laboratories
Vic Jensen
John Jungen
Gordon Kan of Environment Canada
Paul Kluckner of Environment Canada
Henry Lee of the Capital Regional District
Hugh Liebscher
Mark Logan, Canfor
Les McDonald
Rob McLenehan
Brent Moore
Chuck Newcombe
Dr. Martin Pomeroy of Environment Canada
Don Potts, Council of Forest Industries
Henry Quon of Environment Canada
Dei Reinheimer
Guy Roberts of the Greater Vancouver Regional District
Andrea Ryan of Environment Canada
Ian Sharp
Dr. Barry Smee of Smee and Associates Consulting Ltd.
Jim Spankie, Canfor
Ken Stubbs, Greater Vancouver Regional District
Jeanne Taylor, Western Pulp
Taina Tuominen of Environment Canada
Tom Webber
Mike Wei
Susan Woodbine
Dr. Bruce Woods of the US Environmental Protection Agency
* Staff of the previous Ministry of Environment, Lands and Parks or the current Ministry of
Water, Land and Air Protection unless otherwise indicated.

Table of Contents
Field Sampling Manual, 2013
v
TABLE OF CONTENTS
TABLE OF FIGURES
PART A QUALITY CONTROL AND QUALITY ASSURANCE
1. INTRODUCTION ............................................................................................................... 4
1.1 QA Guidelines ......................................................................................................... 4
1.1.1 Study Considerations .................................................................................... 4
1.1.2 Design Considerations .................................................................................. 5
1.1.3 Field Activities ............................................................................................... 5
2. GENERAL GUIDELINES .................................................................................................. 6
2.1 QA Manual .............................................................................................................. 6
2.2 Field Sampling Record Keeping ............................................................................ 6
2.3 Sample History Requirements ............................................................................... 7
2.4 Sampling Methods Documentation ....................................................................... 7
2.5 New Sampling Methods ......................................................................................... 8
2.6 Sample Preparation and Pre-Treatment ............................................................... 8
2.7 Equipment .............................................................................................................. 8
2.8 Sampler Qualifications .......................................................................................... 9
2.9 Chemical Reagents and Preservatives ................................................................. 9
2.10 Reagent Water ..................................................................................................... 10
2.11 Gravimetric Measurement .................................................................................. 11
2.12 Volumetric Measurement .................................................................................... 11
2.13 Sample Containers .............................................................................................. 11
2.14 Contamination ..................................................................................................... 12
2.15 Calibration Practices ........................................................................................... 12
2.16 Quality Control Approaches ............................................................................... 12

Table of Contents
Field Sampling Manual, 2013
vi
2.17 Quality Control Samples ..................................................................................... 13
2.17.1 Field and Trip Blanks ................................................................................. 14
2.17.2 Field and Trip Reference Standards ........................................................... 15
2.17.3 Duplicates and Replicates .......................................................................... 15
2.17.4 Multi-Agency Same Site Replicates ........................................................... 16
2.17.5 Split Samples ............................................................................................. 16
2.17.6 Matrix Spiking ............................................................................................ 16
2.17.7 Surrogate Spikes ....................................................................................... 18
2.18 Data Quality Objectives ...................................................................................... 18
2.19 Expression of Results ......................................................................................... 18
2.20 Performance Audits ............................................................................................. 19
2.21 Interstudy Comparison Results .......................................................................... 20
3. FIELD ANALYTICAL LABORATORIES ......................................................................... 20
4. SOURCES OF FURTHER INFORMATION ..................................................................... 20
4.1 Laboratory QA/QC ................................................................................................ 20
4.2 Sampling QA/QC .................................................................................................. 21
5. REVISION HISTORY ...................................................................................................... 22
APPENDIX 1 SAMPLER EVALUATION CHECK LIST ........................................................ 23
APPENDIX 2 AUDIT TYPES, PURPOSE, AND SUGGESTED AUDIT FREQUENCY ......... 24
APPENDIX 3 QUALITY ASSURANCE GUIDELINES TO SUPPLEMENT THE
STANDARD EFFLUENT AND RECEIVING ENVIRONMENT QUALITY
ASSURANCE CLAUSE ................................................................................................... 25
PART B AIR AND AIR EMISSIONS TESTING
HIVOL SAMPLING TO ASSESS CHRONIC HAZARD OF TRACE
METALS IN AIR PARTICULATES
1. GUIDELINES FOR THE HIVOL SAMPLING PROCEDURE FOR ASSESSING
CHRONIC HAZARD ASSOCIATED WITH TRACE METALS IN PARTICULATE ........... 30
2. BACKGROUND .............................................................................................................. 30
3. QUALITY CONTROL ...................................................................................................... 31
4. ANALYSIS OF BLANK FILTERS ................................................................................... 31

Table of Contents
Field Sampling Manual, 2013
vii
5. SAMPLING ..................................................................................................................... 32
6. REVISION HISTORY ...................................................................................................... 33
STATIONARY AIR EMISSIONS TESTING 1. INTRODUCTION ............................................................................................................. 37
1.1 Acknowledgements .............................................................................................. 37
1.2 Purpose and Scope .............................................................................................. 37
1.3 Continuous Emission Monitoring ....................................................................... 38
1.4 Validation of New Methods .................................................................................. 38
1.5 Trade Names or Commercial Products ............................................................... 38
2. PRE-TEST CONDITIONS .............................................................................................. 38
3 ADDITIONAL SAMPLING REQUIREMENTS ................................................................. 40
4. CALIBRATION REQUIREMENTS .................................................................................. 42
5. GENERAL REPORTING REQUIREMENTS ................................................................... 43
6. METHOD SPECIFIC REPORTING REQUIREMENTS .................................................... 43
6.1 Method 1 - Determination of Sampling Site and Traverse Points ..................... 43
6.2 Method 2 - Determination of Stack Gas Velocity and Volumetric Flow Rate .... 44
6.3 Method 3 - Determination of Gas Composition and Molecular Weight ............ 44
6.3.1 Grab Sampling (Orsat or “Fyrite”) ................................................................ 44
6.3.2 Integrated Sampling .................................................................................... 44
6.3.3 Continuous Sampling (Non-Permanent In-Stack) ........................................ 44
6.4 Method 4 - Determination of Moisture Content of Stack Gas ........................... 45
6.5 Method 5 - Determination of Particulate Emissions .......................................... 45
6.6 Continuous Emission Monitoring Survey (Non-Permanent In-Stack) .............. 46
6.7 High Volume Particulate Sampling Methods ...................................................... 47
6.8 Determination of Gaseous Emissions from Stationary Sources ...................... 47
7. SOURCES OF FURTHER INFORMATION ..................................................................... 48
8. REVISION HISTORY ...................................................................................................... 49

Table of Contents
Field Sampling Manual, 2013
viii
APPENDIX 1 PLATFORM, ACCESS AND SAFETY REQUIREMENTS .................................. 50
Appendix 1.1 Additional Platform, Access and Safety Requirements for
Monitoring Stack Emissions ............................................................................... 51
Appendix 1.2a Sampling Facilities on Circular Stacks ........................................... 53
Appendix 1.2b Sampling Facilities on Circular Stacks ........................................... 54
Appendix 1.3 Sampling Facilities on Rectangular Stacks .................................... 55
Appendix 1.4 Dimensions of a Stack Sampling Platform ..................................... 56
APPENDIX 2 CYCLONIC FLOW CHECK & PITOT LEAK CHECK PROCEDURE ............. 57
APPENDIX 3 HIGH VOLUME PARTICULATE SAMPLING ................................................ 59
Appendix 3.1 Sample Collection Procedure .......................................................... 60
Appendix 3.2 Sample Recovery .............................................................................. 61
Appendix 3.3 Analytical Procedure ........................................................................ 61
APPENDIX 4 SAMPLE TRAIN LEAK CHECK PROCEDURES .......................................... 62
APPENDIX 5 SAMPLING UNDER ADVERSE CONDITIONS ............................................. 63
APPENDIX 6 CALIBRATION FORMS ................................................................................. 64
Appendix 6.1 General Calibration Form ................................................................ 65
Appendix 6.2 Orifice Meter Calibration Form ........................................................ 66
Appendix 6.3 Nozzle Diameter Calibration Form .................................................. 67
Appendix 6.4 Temperature Calibration Form ........................................................ 68
Appendix 6.5 S-Type Pitot Calibration Form ......................................................... 69
Appendix 6.6 Magnehelic Calibration Form .......................................................... 70
Appendix 6.7 Dry Gas Meter Calibration Form ...................................................... 71
APPENDIX 7 REGULATORY AGENCY APPROVED TEST METHODS ............................. 72
Appendix 7.1 Parameters and Approved Methods ................................................ 73
Appendix 7.2 Method Sources ............................................................................... 77
APPENDIX 8 CONTINUOUS EMISSION MONITORING (NON-PERMANENT
IN-STACK) REPORTING FORMS .................................................................................. 80
Appendix 8.1 Analysis of Calibration Gases ......................................................... 81
Appendix 8.2 Analyzer Calibration Data ................................................................ 82

Table of Contents
Field Sampling Manual, 2013
ix
APPENDIX 9 COMPLIANCE TESTING REPORT REQUIREMENTS ................................. 83
Appendix 9.1 Source Emission Survey Report Format ........................................ 84
Appendix 9.2 Compliance Testing Report Summary Table .................................. 87
Appendix 9.3 System Calibration Bias and Drift Check ....................................... 88
APPENDIX 10 PSYCHROMETRIC CHARTS AND VAPOUR PRESSURE TABLES ............ 89
Appendix 10.1 Vapour Pressures of Water in Millimeters of Mercury ................... 90
Appendix 10.2 High Temperature Psychrometric Chart for Air-Water Vapour
Mixtures at 101.3 kPa ........................................................................................... 91
APPENDIX 11 DETERMINATION OF TOTAL REDUCED SULPHUR COMPOUNDS
USING GRAB SAMPLING .............................................................................................. 92
APPENDIX 12 METHOD FOR MEASURING PARTICULATE EMISSIONS FROM
STATIONARY SOURCES WITH CYCLONIC FLOW PATTERN
(ALIGNMENT METHOD) ................................................................................................ 93
Appendix 12.1 Principle ............................................................................................ 94
Appendix 12.2 Applicability ...................................................................................... 94
Appendix 12.3 Apparatus and Reagents ................................................................. 95
Appendix 12.4 Procedures ........................................................................................ 95
Appendix 12.5 Calculations and Reporting .............................................................. 97
PART C BIOLOGICAL TESTING
BIOASSAY SAMPLE COLLECTION PLUS IN-SITU TESTS
1. INTRODUCTION ........................................................................................................... 101
2. IN-SITU SALMONID EGGS BIOASSAY ....................................................................... 101
2.1 Background ........................................................................................................ 101
2.2 Start Up .......................................................................................................... 102
2.2.1 Preparation ............................................................................................... 102
2.2.2 Procurement and Transportation of Eggs ................................................. 102
2.3 Field Deployment ............................................................................................... 103
2.4 End-Point .......................................................................................................... 104
2.5 Jordon/Scotty Incubator: ................................................................................... 105

Table of Contents
Field Sampling Manual, 2013
x
3. IN-SITU CAGED FISH BIOASSAY ............................................................................... 105
3.1 Background ........................................................................................................ 105
3.2 Start Up .......................................................................................................... 105
3.2.1 Preparation ............................................................................................... 105
3.2.2 Procurement and Transportation of Fish ................................................... 106
3.3 Field Deployment ............................................................................................... 106
3.4 End-Point .......................................................................................................... 107
4. GENERAL PROCEDURE FOR COLLECTION OF EFFLUENT AND WATER
SAMPLES FOR LABORATORY BIOASSAYS ............................................................. 108
4.1 Background ........................................................................................................ 108
4.2.1 Effluents .................................................................................................... 108
4.2.2 Receiving waters ....................................................................................... 108
4.3 Specific Bioassay Requirements ...................................................................... 108
4.3.1 Fish ........................................................................................................... 108
4.3.2 Daphnia .................................................................................................... 109
4.3.3 Microtox .................................................................................................... 109
5. SOURCES OF FURTHER INFORMATION ................................................................... 109
5.1 In-Situ Salmonid Eggs Bioassay ....................................................................... 109
5.2 In-Situ Caged Fish Bioassays ........................................................................... 109
5.3 Collection of Effluent and Water Samples for Laboratory Bioassays ............ 110
6. REVISION HISTORY .................................................................................................... 110
BIOLOGICAL SAMPLE COLLECTION: FRESHWATERS
1. INTRODUCTION ............................................................................................................ 114
2. GENERAL CONSIDERATIONS .................................................................................... 115
2.1 Preparing to Go to the Field .............................................................................. 115
2.2 Locating the Site in the Field ............................................................................. 115
2.3 Field Notes/Observations .................................................................................. 115
3. QUALITY ASSURANCE/QUALITY CONTROL ............................................................ 116
3.1 Field Quality Assurance .................................................................................... 116
3.1.1 Technique/Diligence .................................................................................. 117

Table of Contents
Field Sampling Manual, 2013
xi
3.2 Field Quality Control .......................................................................................... 118
3.2.1 Replicate Samples ................................................................................... 119
3.2.2 Split Samples ........................................................................................... 119
3.2.3 Reference Samples ................................................................................... 119
4. COLLECTING AND PROCESSING BIOLOGICAL SAMPLES ..................................... 120
4.1 Lake Biological Samples .................................................................................. 120
4.1.1 Bacteria ..................................................................................................... 120
4.1.1.1 Shore Samples ................................................................................ 120
4.1.1.2 Surface Bacteriological Samples at Deep Stations .......................... 121
4.1.1.3 Deep Samples ................................................................................. 122
4.1.2 Zooplankton ............................................................................................. 123
4.1.3 Phytoplankton ........................................................................................... 125
4.1.3.1 Surface Samples ............................................................................. 126
4.1.3.2 Deep Samples ................................................................................. 126
4.1.4 Benthic Fauna .......................................................................................... 127
4.1.4.1 Grab Sampling ................................................................................. 129
4.1.4.2 Core sampling ................................................................................. 130
4.1.5 Macrophytes ............................................................................................. 131
4.1.5.1 Taxonomy ........................................................................................ 132
4.1.5.2 Tissue Analysis ................................................................................ 135
4.1.5.3 Biomass Studies ............................................................................... 135
4.1.6 Fish .......................................................................................................... 136
4.1.6.1 Gill Nets .......................................................................................... 136
4.1.6.2 Beach Seining ................................................................................. 139
4.1.6.3 Set Lines .......................................................................................... 141
4.1.6.4 Processing Fish Tissues ................................................................. 142
4.2 River/Stream Biological Samples ..................................................................... 144
4.2.1 Bacteria ..................................................................................................... 144
4.2.2 Periphyton ................................................................................................ 146
4.2.3 Benthic Fauna (macro-invertebrates) ....................................................... 148
4.2.3.1 Surber Sampler ................................................................................ 149
4.2.3.2 Hess Sampler .................................................................................. 150
4.2.3.3 Drift Net Sampler ............................................................................. 151
4.2.4 Macrophytes ............................................................................................. 153
4.2.5 Fish ............................................................................................................ 153
4.2.5.1 Gill Nets .......................................................................................... 154
4.2.5.2 Seining ............................................................................................ 155
4.2.5.3 Set Lines .......................................................................................... 156

Table of Contents
Field Sampling Manual, 2013
xii
4.2.5.4 Electrofishing ................................................................................... 156
5. SHIPPING ..................................................................................................................... 157
6. SOURCES OF FURTHER INFORMATION .................................................................. 158
7. REVISION HISTORY .................................................................................................... 160
APPENDIX 1 GENERIC FIELD CHECKLIST ................................................................... 161
APPENDIX 2 LAB SAMPLE CONTAINER, PRESERVATION, AND HOLD TIMES
FOR SEDIMENTS AND TISSUES ............................................................................... 163
APPENDIX 3 LABORATORY SAMPLE CONTAINER, PRESERVATION, AND
HOLD TIMES FOR FRESH WATER BIOLOGICAL SAMPLING ................................. 164
PART D SOIL AND SEDIMENT SAMPLING
COMPOSTED MATERIALS SAMPLING
1. INTRODUCTION ........................................................................................................... 168
2. SAMPLING AND ANALYSIS REQUIREMENTS ........................................................... 168
3. TRACE ELEMENTS ...................................................................................................... 169
3.1 Trace Element Concentration Codes ................................................................ 169
4. PH ................... .............................................................................................................. 169
5. SAMPLING PROCEDURES ......................................................................................... 169
6. PRODUCT MATURITY ................................................................................................. 170
6.1 Reheating Test ................................................................................................... 170
6.2 Ratio Between Organic Solids and Mineral Solids ......................................... 170
7. FOREIGN MATTER CONTENT ................................................................................... 171
8. REVISION HISTORY .................................................................................................... 171

Table of Contents
Field Sampling Manual, 2013
xiii
LAKE AND STREAM BOTTOM SEDIMENT SAMPLING
1. INTRODUCTION ........................................................................................................... 174
2. GENERAL CONSIDERATIONS .................................................................................... 175
2.1 Preparing to Go to the Field .............................................................................. 175
2.2 Locating the Site in the Field ........................................................................... 175
2.3 Field Notes/Observations .................................................................................. 176
3. QUALITY ASSURANCE/QUALITY CONTROL ............................................................ 176
3.1 Field Quality Assurance .................................................................................... 176
3.2 Field Quality Control .......................................................................................... 177
3.2.1 Replicate Samples ................................................................................... 178
3.2.2 Reference Samples ................................................................................... 178
4. SAMPLING EQUIPMENT ............................................................................................. 178
4.1 Grab Samplers ................................................................................................... 179
4.1.1 Ekman Grab ............................................................................................. 180
4.1.2 Petersen Grab ........................................................................................... 180
4.1.3 Ponar Grab ............................................................................................... 181
4.2 Core Samplers .................................................................................................... 181
4.3 Sediment Particle Size Samplers ...................................................................... 182
5. COLLECTING SEDIMENT SAMPLES .......................................................................... 183
5.1 Collecting Lake Sediment Samples .................................................................. 183
5.1.1 Sampling from a Boat .............................................................................. 183
5.1.2 Winter Sampling ...................................................................................... 186
5.2 River/Stream ....................................................................................................... 187
5.2.1 Access from a bridge ................................................................................ 187
5.2.2 Sampling from a Boat .............................................................................. 189
5.2.3 Winter Sampling ...................................................................................... 189
5.2.4 Sampling for Sediment Particle Size ......................................................... 190
6. SHIPPING ..................................................................................................................... 191
7. SOURCES OF FURTHER INFORMATION .................................................................. 192
8. REVISION HISTORY .................................................................................................... 193

Table of Contents
Field Sampling Manual, 2013
xiv
APPENDIX 1 GENERIC FIELD CHECKLIST ................................................................... 194
APPENDIX 2 LAB SAMPLE CONTAINER, PRESERVATION, AND HOLD TIMES
FOR SEDIMENTS AND TISSUES ............................................................................... 196
PART E WATER AND WASTEWATER SAMPLING
AMBIENT FRESHWATER AND EFFLUENT SAMPLING
1. INTRODUCTION ........................................................................................................... 201
2. GENERAL CONSIDERATIONS .................................................................................... 202
2.1 Preparing to Go to the Field .............................................................................. 202
2.2 Locating the Site in the Field ............................................................................ 202
2.3 Field Notes/Observations .................................................................................. 203
3. QUALITY ASSURANCE/QUALITY CONTROL (QA/QC) .............................................. 204
3.1 Field Quality Assurance .................................................................................... 204
3.2 Quality Control .................................................................................................. 206
3.2.1 Blanks ...................................................................................................... 206
3.2.1.1 Trip Blanks ....................................................................................... 207
3.2.1.2 Field Blanks ..................................................................................... 207
3.2.1.3 Equipment Blanks (prepared prior to the field trip) .......................... 208
3.2.1.4 Filtration Blanks ............................................................................... 208
3.2.2 Replicate Samples ................................................................................... 209
3.2.2.1 Co-located Samples (field duplicate, triplicate, etc.) ......................... 209
3.2.2.2 Split Samples ................................................................................... 209
3.2.3 Spiked Samples (Field) ............................................................................ 209
3.2.4 Reference Samples ................................................................................... 210
4. COLLECTING SAMPLES ............................................................................................ 210
4.1 Lake .................... ................................................................................................. 211
4.1.1 Shore Sample ........................................................................................... 211
4.1.2 Sampling from a Boat .............................................................................. 212
4.1.2.1 Site Identification ............................................................................. 213
4.1.2.2 Surface Water .................................................................................. 213
4.1.2.3 Deep Water ..................................................................................... 214
4.1.3 Winter Sampling ...................................................................................... 215

Table of Contents
Field Sampling Manual, 2013
xv
4.2 River/Stream ....................................................................................................... 216
4.2.1 Access from the Stream Bank .................................................................. 217
4.2.2 Access from a Bridge ............................................................................... 218
4.2.3 Sampling from a Boat .............................................................................. 220
4.2.4 Winter Sampling ...................................................................................... 220
5. COLLECTING EFFLUENT AND RECEIVING WATER SAMPLES ............................... 223
5.1 Effluent Stream .................................................................................................. 224
5.2 Receiving Waters .............................................................................................. 226
6. FIELD MEASUREMENTS ............................................................................................. 226
6.1 Temperature ....................................................................................................... 227
6.2 Dissolved Oxygen (DO) ..................................................................................... 228
6.3 Conductivity/Salinity .......................................................................................... 230
6.4 pH ..................................................... ................................................................... 231
6.5 Clarity ................. ................................................................................................. 233
6.6 ORP ....................... .............................................................................................. 233
6.7 Stream Flow ....................................................................................................... 234
7. FIELD FILTRATION AND PRESERVATION ................................................................. 235
7.1 Filtration.................. ............................................................................................. 236
7.2 Preservation ....................................................................................................... 237
8. SHIPPING ..................................................................................................................... 238
9. CLEANING EQUIPMENT ............................................................................................. 239
10. SOURCES OF FURTHER INFORMATION .................................................................. 240
APPENDIX 1 GENERIC FIELD CHECKLIST ................................................................... 242
APPENDIX 2 SITE IDENTIFICATION ............................................................................... 244
Appendix 2.1 Site Identification Guide ................................................................ 245
Appendix 2.2 Site Data Sheet (Lake) ................................................................... 246
Appendix 2.3 Site Data Sheet (River) .................................................................. 247
Appendix 2.4 Site Data Sheet (Effluent) .............................................................. 248

Table of Contents
Field Sampling Manual, 2013
xvi
APPENDIX 3 SAMPLING FOR THE MOST COMMON VARIABLES ................................ 249
Appendix 3.1 General Chemistry (including nutrients ....................................... 250
Appendix 3.2 Metals ............................................................................................. 251
Appendix 3.3 Carbon ............................................................................................. 251
Appendix 3.4 Chlorophyll a .................................................................................. 252
APPENDIX 4 SAMPLE CONTAINER, PRESERVATION, AND HOLD TIMES FOR
WATER AND EFFLUENT SAMPLES .......................................................................... 254
APPENDIX 5 EFFLUENT SAMPLING CHECKLIST GUIDE ............................................ 255
Effluent Sampling Checklist ...................................................................................... 256
Effluent Sampling Checklist ...................................................................................... 257
GROUNDWATER POLLUTION MONITORING
1. INTRODUCTION ........................................................................................................... 261
2. PRELIMINARY ASSESSMENT .................................................................................... 261
2.1 Potential Contaminants .................................................................................... 261
2.2 Hydrogeological Studies ................................................................................... 262
3. MONITORING SYSTEM DESIGN ................................................................................ 262
4. MONITORING WELL SPECIFICATIONS ..................................................................... 263
4.1 Well Design and Dimensions ............................................................................ 263
4.2 Materials .............................................................................................................. 265
5 WELL CONSTRUCTION .............................................................................................. 265
5.1 Drilling Techniques ............................................................................................ 265
5.2 Monitoring Well Development .......................................................................... 266
5.3 Hydraulic Assessment and Documentation ..................................................... 266
6. SAMPLING PROGRAM ................................................................................................ 267
6.1 Sampling Schedule ............................................................................................ 267
6.2 Piezometric Records .......................................................................................... 267
6.3 Field Measurements ........................................................................................... 268
7. QUALITY ASSURANCE AND QUALITY CONTROL .................................................... 268

Table of Contents
Field Sampling Manual, 2013
xvii
8. SAMPLE COLLECTION ............................................................................................... 269
8.1 Sampling and Measuring Methods .................................................................. 269
8.2 Immiscible Layers .............................................................................................. 270
8.3 Purging ........................... ..................................................................................... 270
8.4 Sample Extraction .............................................................................................. 271
8.4.1 Organic Contaminant Sampling ................................................................ 271
8.4.2 Inorganic Contaminant Sampling .............................................................. 272
8.5 Sample Preservation .......................................................................................... 273
9. SOURCES OF FURTHER INFORMATION . ................................................................. 274
10. REVISION HISTORY .................................................................................................... 276
APPENDIX 1 RECOMMENDATIONS FOR SCREEN AND CASING MATERIALS IN
SAMPLING APPLICATIONS ....................................................................................... 277
APPENDIX 2 DRILLING METHODS MATRIX ................................................................... 279
APPENDIX 3 TYPICAL MONITORING WELL DESIGN .................................................... 280
APPENDIX 4 SAMPLING EQUIPMENT ........................................................................... 281
APPENDIX 5 SAMPLE CONTAINER AND PRESERVATION CRITERIA ......................... 282
APPENDIX 6 GENERALIZED FLOW DIAGRAM OF GROUNDWATER
SAMPLING STEPS ....................................................................................................... 285
EFFLUENT FLOW MEASUREMENT
1. INTRODUCTION .......................................................................................................... 289
2. OPEN CHANNEL FLOW .............................................................................................. 289
2.1 Primary Devices (Weirs and Flumes) ............................................................... 289
2.1.1 Weirs ........................................................................................................ 291
2.1.1.2 Flow Conditions ............................................................................... 291
2.1.1.3 Application ........................................................................................ 293
2.1.1.4 Common Weir Types ...................................................................... 293
2.1.2 Flumes ..................................................................................................... 301
2.1.2.1 Definition and Description ................................................................. 301
2.1.2.2 Flow Conditions ................................................................................ 301

Table of Contents
Field Sampling Manual, 2013
xviii
2.1.2.3 Application ........................................................................................ 302
2.1.2.4 Common Flume Types ..................................................................... 302
2.1.3 Installation and Design of Primary Flow Measurement Devices ................ 309
2.1.3.1 Weir Installation ................................................................................ 309
2.1.3.2 Flume Installation ............................................................................. 311
2.1.4 Calibration of Primary Flow Measurement Devices ................................... 311
2.1.4.1 Volumetric Method ........................................................................... 311
2.1.4.2 Dilution (dye) Method ....................................................................... 312
2.1.4.3 Point Method .................................................................................... 312
2.1.5 Maintenance of Primary Flow Measurement Devices ............................... 312
2.2 Secondary Measuring Devices (Flow Meters) .................................................. 312
2.2.1 Floats ....................................................................................................... 312
2.2.2 Electrical (Capacitance Probe) ................................................................. 313
2.2.3 Ultrasonic Level Sensors ........................................................................... 315
2.2.4 Bubblers ................................................................................................... 315
2.3 Selection Criteria for Secondary Measuring Devices ...................................... 316
2.4 Installation of Secondary Flow Measurement Devices ................................... 316
2.5 Calibration of Secondary Flow Measurement Devices ................................... 317
2.6 Maintenance of Secondary Flow Measurement Devices ................................ 317
3. CLOSED CHANNEL FLOW MEASUREMENT ............................................................. 318
3.1 Orifice Flow Meter .............................................................................................. 318
3.2 Venturi Flow Meter ............................................................................................. 319
3.3 Electromagnetic Flow Meter .............................................................................. 322
3.4 Doppler Flow Meter ............................................................................................ 322
3.5 Pressure Transducers ........................................................................................ 323
3.5.1 Selection of Pressure Transducers .......................................................... 324
3.6 Area Velocity ....................................................................................................... 324
4. FLOW RECORDERS .................................................................................................... 325
4.1 Flow Transmitters .............................................................................................. 326
4.2 Chart Recorders and Data Loggers .................................................................. 326
4.2.1 Charts vs Data Loggers ............................................................................ 327
4.2.2 Selection Criteria of Recorders and Data Loggers .................................... 327
5. SOURCES OF FURTHER INFORMATION .................................................................. 328

Table of Contents
Field Sampling Manual, 2013
xix
6. REVISION HISTORY .................................................................................................... 328
APPENDIX 1 EFFLUENT FLOW MEASUREMENT CHECKLIST ..................................... 329
A. General Information ........................................................................................... 329
B. Measuring Devices ............................................................................................ 329
C. Maintenance ....................................................................................................... 330
D. Calibration ......................................................................................................... 330
GLOSSARY
INDEX

PART A QUALITY CONTROL AND QUALITY ASSURANCE
©Her Majesty the Queen in Right of the Province of British Columbia
2013 All Rights Reserved

Quality Control and Quality Assurance
Field Sampling Manual, 2013
2
Table of Contents 1. INTRODUCTION .................................................................................................................. 4
1.1 QA Guidelines ........................................................................................................... 4 1.1.1 Study Considerations ...................................................................................... 4 1.1.2 Design Considerations .................................................................................... 5 1.1.3 Field Activities .................................................................................................. 5
2. GENERAL GUIDELINES ........................................................................................................ 6 2.1 QA Manual ................................................................................................................ 6 2.2 Field Sampling Record Keeping .............................................................................. 6 2.3 Sample History Requirements ................................................................................. 7 2.4 Sampling Methods Documentation ......................................................................... 7 2.5 New Sampling Methods ............................................................................................ 8 2.6 Sample Preparation and Pre-Treatment .................................................................. 8 2.7 Equipment ................................................................................................................ 8 2.8 Sampler Qualifications ............................................................................................. 9 2.9 Chemical Reagents and Preservatives ................................................................... 9 2.10 Reagent Water ......................................................................................................... 10 2.11 Gravimetric Measurement ...................................................................................... 11 2.12 Volumetric Measurement ....................................................................................... 11 2.13 Sample Containers .................................................................................................. 11 2.14 Contamination Control ........................................................................................... 12 2.15 Calibration Practices .............................................................................................. 12 2.16 Quality Control Approaches .................................................................................. 12 2.17 Quality Control Samples ........................................................................................ 13
2.17.1 Field and Trip Blanks ..................................................................................... 14 2.17.2 Field and Trip Reference Standards .............................................................. 15 2.17.3 Duplicates and Replicates ............................................................................. 15 2.17.4 Multi-Agency Same Site Replicates .............................................................. 16 2.17.5 Split Samples ................................................................................................. 16 2.17.6 Matrix Spiking ................................................................................................ 16 2.17.7 Surrogate Spikes ........................................................................................... 18
2.18 Data Quality Objectives .......................................................................................... 18 2.19 Expression of Results ............................................................................................ 18 2.20 Performance Audits ................................................................................................ 19 2.21 Interstudy Comparison Results ............................................................................. 20
3. FIELD ANALYTICAL LABORATORIES .............................................................................. 20
4. SOURCES OF FURTHER INFORMATION .......................................................................... 20 4.1 Laboratory QA/QC ................................................................................................... 20 4.2 Sampling QA/QC ..................................................................................................... 21
5. REVISION HISTORY ............................................................................................................ 22

Quality Control and Quality Assurance
Field Sampling Manual, 2013
3
APPENDIX 1 SAMPLER EVALUATION CHECK LIST ......................................................... 23
APPENDIX 2 AUDIT TYPES, PURPOSE, AND SUGGESTED AUDIT FREQUENCY ..................................................................................................................... 24
APPENDIX 3 QUALITY ASSURANCE GUIDELINES TO SUPPLEMENT THE STANDARD EFFLUENT AND RECEIVING ENVIRONMENT QUALITY ASSURANCE CLAUSE ..................................................................................................... 25

Quality Control and Quality Assurance
Field Sampling Manual, 2013
4
1. Introduction A thorough program of quality assurance/quality control (QA/QC) will enable collection of meaningful and scientifically credible samples. Quality assurance (QA) includes a range of management and technical practices designed to guarantee that the delivered end product is commensurate with the intended use. For environmental- or discharge-related studies, QA ensures that the data are of adequate scientific credibility to permit statistical interpretations which lead to resource use management decisions. One of the most important aspects of QA is quality control (QC). QC includes specific formal goals (called data quality objectives, or DQOs), collection of data to assess data quality, the statistical assessment of the data quality, and the remedial measures taken whenever the DQOs are not realized. A successful program of QA/QC not only ensures the sampling process is in control but should also present estimates of the sampling error, especially sampling variance. If some component of a sampling program is found not to be in control, then remedial response must be immediately initiated as soon as the problem is discovered, and both the problem and the remedial response must be thoroughly documented. Timely feedback communication between samplers and analysts is essential once a problem has been identified.
1.1 QA Guidelines Guidelines alone cannot guarantee high quality results. However, a genuine commitment to the following guidelines should ensure that problems are identified and remedied on a timely basis.
1.1.1 Study Considerations
• Develop clearly specified study objectives for sampling programs. • Ensure staff participate in ongoing programs of staff training. • Ensure that every sampling program has an identifiable person designated to
be responsible as the QA Officer for the program QA/QC; for large programs this should be a full time position. The QA Officer should never be the person responsible for a program’s monetary budget, since budget minimization and QA optimization are often antagonistic rather than complementary responsibilities, and QA should have an independent champion.
• Ensure criteria (sometimes called data quality objectives or DQOs) are established on a formal basis and are followed. It is important that resources and monies not be wasted collecting out-of-control information.
Quality Control and Quality Assurance
Field Sampling Manual, 2013
5
• Involve analytical laboratory personnel in study planning and data interpretation.
1.1.2 Design Considerations
• Base sampling program design upon statistical concepts. • Ensure each and every step of the sampling and post-sampling process follows
documented protocols. • Enhance regular documentation with photographs and video recordings. • Ensure samples are ‘representative’ of the environment, object, or waste being
sampled. • Ensure proactive method improvement practices are performed. • Participate on collaborative studies to ascertain accuracy and precision of the
results and to ensure results are comparable to those produced elsewhere. • If a separate study using different personnel is underway in the same or
neighboring environs, initiate one or more common sites where both teams can both sample and share results. Data comparisons between different teams at one locale offer effective and timely pointers to methodology problems.
• Implement regular inspections by the QA Officer of every aspect of the sampling program on a regular basis and issue written QA/QC reports on a regular basis, usually quarterly or annually.
• Ensure that the overall sampling program is re-evaluated in detail by an outside party not less frequently than every five years.
• Minimize environmental impacts due to monitoring and sample collection. Small ecosystems may be so vulnerable as to be severely affected by the sampling process itself.
• Ensure samplers have a written “game plan” of what to do and whom to contact when something goes wrong.
1.1.3 Field Activities
• Label all samples with unambiguous identification of exact date, place and time of sampling plus name of sampler.
• Record all details relevant to the sampling in a field note book; unusual conditions and variations from usual sampling techniques especially require thorough documentation.
• Ensure instruments and equipment are regularly maintained and calibrated; maintenance logs shall be kept.
• Follow common sense approaches to avoid contaminating samples, clean sample collection equipment regularly, check equipment cleanliness and performance by running blanks and reference samples where appropriate.

Quality Control and Quality Assurance
Field Sampling Manual, 2013
6
• Where practical, collect samples from areas that are fairly homogeneous in time and space (i.e., avoid sampling situations where a small distance in time or space will yield very different results). Where it is not practical to avoid such situations, special attention will be required to achieve representative samples.
• Collect replicate samples towards ascertaining the precision of the sampling method, or the analytical procedure, and also the local heterogeneity. Total assay error (sum of analytical error plus sampling error) should preferably be <10% of local heterogeneity (as variance), and must not exceed 20% of local heterogeneity (as variance). Analytical error (as variance) should fall below 4% of local heterogeneity (as variance).
2. General Guidelines
2.1 QA Manual Major sampling programs shall have a formal QA Manual which documents all resources, policies and procedures pertinent to that sampling program. The Quality Manual shall include detailed descriptions of the topics outlined in this section and shall clearly define the QA/QC responsibilities of management, supervisory staff, and field samplers. The QA Manual shall be reviewed and updated regularly. Revisions shall be both dated and initialed.
2.2 Field Sampling Record Keeping The Field Sampling Record System shall be designed to ensure sample and sampler traceability, including dates and samplers' initials or signatures. Dated and signed materials shall include forms, instrumental records and printouts, as well as notebooks. If a sample numbering system is employed, it must be designed to eliminate the possibility of a sample mix-up. The record storage system should be designed for easy retrieval. A policy on the length of the storage and disposal of records shall be established. A policy shall also be established as to the ownership of field notebooks, and as to their deposition when an individual sampler ceases employment on a project or with a company.

Quality Control and Quality Assurance
Field Sampling Manual, 2013
7
2.3 Sample History Requirements Documentation and procedures on sample history shall be maintained, including:
• Method of sample collection • Time and location of sampling • Name of sampler(s) • Chemical preservative added or other sample treatment • Type of sample containers used • Storage conditions • Time and condition of sample on receipt at laboratory
Potential deficiencies in sample history requirements shall be monitored. Noncompliance must be identified and remedied.
2.4 Sampling Methods Documentation An inventory of sampling methods shall be maintained that will include:
• All current methods • All previous methods • Date of transition from one method to another Sampling method and procedures documentation shall include:
• A description of the procedure in sufficient detail that an experienced sampler, unfamiliar with the specific sampling method, should be able to perform the sample collection and treatment.
• Procedures for preparation of preservative reagents, if employed. • Operating instructions for the sampling equipment, which are supplemental to the
manufacturer's operating manuals. • Method specific requirements for quality control sample preparation and analysis. • Quality control criteria (i.e., acceptable limits). Sampling methods and documentation shall be reviewed on a regular basis, not less than once a year. Methods shall be periodically revalidated, particularly when there has been a change in either equipment or personnel. Where data are kept on computer files, changes in sampling methodology shall be reflected by changes in related computer codes.

Quality Control and Quality Assurance
Field Sampling Manual, 2013
8
2.5 New Sampling Methods Sampling methods shall be reviewed periodically to ensure that the most up-to-date methods are being used. Sampling methods which are new to the samplers, are modifications to existing methods, or have been developed in-house must be validated. Validation shall include verification of the efficiency and adequacy of the sampling device or method over the range of conditions to be encountered. Validation shall additionally include equivalency testing to established sampling techniques.
2.6 Sample Preparation and Pre-Treatment Documentation shall be maintained for sample preparation and pre-treatment procedures including, where relevant, the detected procedures followed for:
• Drying or removal of moisture • Determination of moisture content • Sub-sampling, whether in field or in-laboratory • Preparation of geological samples including splitting, sieving, grinding,
pulverizing • Filtration and preservation of water samples • Specialized preparation of biological samples • Sample homogenization • Spiking samples with radionuclides or other tracer chemicals • Filtration • Addition of chemical preservatives or reagents • Freezing or freeze-drying Complete records shall be maintained to ensure that potential problems, including cross-contamination, are traceable.
2.7 Equipment
Equipment logs shall specify:
• Manufacturer, model, serial number • Significant modifications • Repair and maintenance history • Calibration history where relevant • Performance history

Quality Control and Quality Assurance
Field Sampling Manual, 2013
9
Routine maintenance shall be performed according to the manufacturer’s instructions and schedule. For those instruments requiring calibration, log books or equivalent records shall be kept which document daily operating, calibration, and setup parameters. Instrument operating instructions which supplement instructions given in the manufacturer’s operating manuals should be documented.
2.8 Sampler Qualifications Records of the qualifications and experience shall be kept for each sampler. These records shall include:
• Copy of current resume • Records of training in new sampling or assay techniques • Records of attendance at technical meetings or seminars • Records of completion of relevant courses (including in-house training courses,
night school classes, and courses sponsored by equipment manufacturers) Proficiency must be demonstrated for each sampling procedure which a sampler is expected to perform.
2.9 Chemical Reagents and Preservatives All chemical reagents and preservatives shall be reagent grade or better, and must meet specifications identified in sampling methodology protocols. Where reagents must be prepared or mixed, the detailed procedures for both the preparation and related quality control must be included in the written documentation for the procedure. Additionally, logs must be established and maintained which document the preparation of chemical reagents and preservatives, specifying: • Supplier, grade, and batch number • If applicable, details as to drying, mixing, etc. • Record of all laboratory operations performed and record of weights and volumes,
plus all calculations • Identity of person who prepared the reagent or preservative
A file of certificates for standard chemicals purchased from commercial suppliers shall be kept.

Quality Control and Quality Assurance
Field Sampling Manual, 2013
10
Prior to routine use, and periodically throughout its shelf life, performance of a reagent or preservative shall be verified. The performance of new and old reagents and preservatives should be compared consecutively. Written criteria should be specified setting the criteria for new versus old reagents. All chemical reagents and preservatives must be properly labeled. Labels shall identify material, concentration, date prepared plus expiry date. Expiry dates will vary depending on the chemical composition. A general guideline for concentrated standard stock solutions is an expiry date of one year. Expired chemical reagents or preservatives are never to be used, even if the expiry date is only one day past. Where practical, it is recommended that preservatives be pre-measured under laboratory conditions into vials or ampoules, and sealed for later use in the field without need for further measurement. Bulk preservatives intended for use with numerous samples are much more likely to become contaminated than sealed ampoules intended for single use.
2.10 Reagent Water Reagent water shall comply with ASTM D 1193-77, Standard Specification for Reagent Water, Type I, Type II, or Type III, or Standard Methods 18th Edition (1992), Section 1080 Reagent-Grade Water, Type I or Type II. If you are not sure what the previous sentence means, then it is recommended that you have the analytical laboratory which will be analyzing your samples supply appropriate reagent water. Reagent Water must be free from chemical substances and from microbiological organisms that might interfere with laboratory analyses of the samples. For many procedures, the presence of contaminants may be checked by submitting samples of Reagent Water as if they were genuine field collected samples. Microbiological evaluation may be performed using a Total Plate Count.
Analytical laboratories are expected to record the conductance of Reagent Water daily if it is in regular use, or weekly if it is infrequently used. Usually such thorough checking is not practical under field conditions. Therefore, firm rules must be followed to ensure an adequate quality of Reagent Water:
• Never use Reagent Water of unknown source. • Never use Reagent Water which has passed its expiry date even if the bottle is
sealed. • When a bottle of Reagent Water is first opened note the date on the bottle and do
not use Reagent Water that was first opened more than one month previous. • Using DI water prepared by one laboratory, for samples to be submitted to
another laboratory is discouraged.

Quality Control and Quality Assurance
Field Sampling Manual, 2013
11
2.11 Gravimetric Measurement The accuracy of gravimetric measurements shall be ensured by referencing calibrations to class S or S-1 weights. Annual balance calibration and daily calibration checks are required, and records must be kept. (Note that “S” and “S-1” are terms defined in NIST (formerly NBS) Circular 547.)
2.12 Volumetric Measurement The use of class A glassware will ensure accuracy of volumetric measurements. Delivery volumes of automatic pipettes and diluters shall be checked on a routine basis and records of results maintained. Volumetric glassware must be regularly cleaned and must not be oven dried. The effectiveness of cleaning shall be monitored by the analysis of blanks using randomly selected glassware. The results shall be recorded. Up-to-date documentation shall be kept on all glassware cleaning procedures and requirements.
2.13 Sample Containers Sample containers should be supplied by the analyzing laboratory pre-cleaned and capped, and preferably within sealed plastic-film dust-protection. The sample containers should be checked periodically for contamination both by the analyzing laboratory and by submission of sample blanks or low level standards. Warehouse storage of uncapped bottles is not acceptable. Cleaning of old bottles for reuse may be appropriate for some situations, but is inappropriate for many situations due to increased likelihood of contamination. Good practice calls for recycling rather than reuse of bottles. (This also applies to preservative vials.) Bottle cleaning must be carried out under laboratory conditions, and should not be done in the field. Rinsing of bottles with sample prior to sample collection is strongly discouraged. Sample containers must be sufficiently robust to take fairly rough handling in the field without rupturing or leaking. It is usual for different sample types and different groups of analytes to require specific types of sample containers and/or specific types of container lids. The analyzing laboratory should be consulted before sampling commences to ensure appropriate sample containers and lids are used. Information to this regard is in the 1994 Laboratory Manual (Permittee Edition).

Quality Control and Quality Assurance
Field Sampling Manual, 2013
12
As a rule, nothing but a sample and sample preservatives should ever be placed into a sample container. Never permit a thermometer, pH probe, or such like to be placed into a sample bottle, unless that bottle is a throw-away intended for no other purpose.
2.14 Contamination Control Effective separation of incompatible activities must be ensured.
The process of sample collection or sample pre-treatment must not interfere with nor lead to contamination of other monitoring or sampling in progress. For example, a series of nearby sites sampled consecutively in a small stream should be sampled from the downstream sequentially upstream. Similarly, a series of contaminated sites should preferably be sampled from least contaminated to most contaminated.
2.15 Calibration Practices The accuracy and stability of calibrations shall be established by setting requirements for the following, as appropriate:
• Equivalent standard/sample reagent backgrounds • Reagent blanks to establish zero response • Control and verification standards to verify accuracy and stability • Associated control limits and specified corrective action
All calibration results and remedial actions must be recorded.
2.16 Quality Control Approaches Appropriate quality control techniques shall be applied to each sample collected, series of samples collected, or series of measurements made in-situ. The QC data must be available to the client and the inclusion of QC results in reports is encouraged. It is important that there be good communication and close cooperation between persons responsible to collect the samples and persons responsible to perform laboratory analyses upon those samples. The samplers and analysts should be involved jointly in all aspects of QC from program design to data interpretation. It is particularly important that there be timely identification of problems, with effective feedback between samplers and analysts. Identifying a problem five years after the fact is too late to effect corrections.

Quality Control and Quality Assurance
Field Sampling Manual, 2013
13
2.17 Quality Control Samples In addition to the various environmental samples which must be collected to meet the objectives of the monitoring program, additional samples must be collected to meet the associated QA/QC objectives. These sample are known as “Quality Control Samples”. Generally, QC Samples are collected to meet two primary goals. The first goal is to give early warning if any sampling or analytical process begins to move out-of-control. The second goal is to provide data for use towards quantitating and identifying sources of systematic and random error associated with the collection and analysis of samples. The type and number of quality control samples to be analyzed should be stated in a section of the overall Quality Manual. For samples collected and forwarded to laboratories for analysis, quality control samples shall include:
• Field and trip blanks to monitor possible contamination prior to receipt at the laboratory.
• Duplicate or replicate samples to measure both field sampling error plus local environmental variance
• In-house reference samples to monitor accuracy; Optional Quality Control samples include:
• Analytical spikes to measure recoveries • Surrogate spikes to measure recoveries • Certified reference samples to monitor accuracy • Split samples to compare 2 or more laboratories For samples analyzed in the field, quality control samples shall include:
• Method blanks to monitor possible contamination • Duplicate or replicate samples to measure both field sampling error plus local
environmental variance • Duplicate or replicate analyses to ascertain the method precision • In-house plus certified reference samples to monitor accuracy • Analytical spikes to measure recoveries • Surrogate spikes to measure recoveries For measurements made in-situ, quality control results shall include:
• Hysteresis plots when results are collected as vertical profiles • Regular confirmation of the accuracy of the clock

Quality Control and Quality Assurance
Field Sampling Manual, 2013
14
• Regular intercomparisons either with a similar instrument or, preferably, with an instrument based on different operating principles.
Due to the wide diversity of samples collected or measurements made, it is not possible to list all QC requirements in this section. However, the Quality Manual for the study should have a comprehensive list covering every method to be employed by that study. In general, a level of QC in the range of 20 to 30% is considered appropriate, however, should serious problems be encountered, QC costs can easily rise in excess of 50% of resources. Note that large coordinated studies require far less proportion of total resources committed to QA then do small fragmented studies.
2.17.1 Field and Trip Blanks ‘Trip blanks’, sometimes called ‘transport blanks’, are aliquots of analyte-free reagent water which are sent from the laboratory to the field, and are later returned along with genuine samples. The seal remains unbroken in the field. These trip blanks are useful to determine contamination which might arise during handling, transport or storage of the samples. ‘Field blanks’, sometimes called equipment blanks or sampling blanks, are aliquots of analyte-free reagent water which are sent by the laboratory to the field, but the seal is broken in the field and the field blank sample is handled identically to a genuine sample. The purpose of field blanks is to determine contamination arising from the sample collection equipment, sample handling equipment (e.g., filtration apparatus) or from the general conditions during sampling (e.g., blowing dust). Since samplers have different preferences for where to start the field blank process (for example, some people place the field blank bottle in the sampler and lower it to water level, other start at post-collection step prior to sample handling, still other start at addition of reagents step), it is important to document in the field notebook exactly what procedure was followed. Ideally the same practice would be followed throughout a study, according to practice set out in standard protocols or in the QA Plan. Laboratory, trip, and field blank information should be reported along with the genuine results. When interferences are identified, the cause should be investigated and the problem remedied. The extent of the contamination problem should be discussed, including the likely effect upon the data. However, good practice does not permit ‘correction’ of the data by subtraction of either trip blank nor field blank data. Note that even when submitted on a blind basis, laboratories can often identify which samples are blanks.

Quality Control and Quality Assurance
Field Sampling Manual, 2013
15
2.17.2 Field and Trip Reference Standards ‘Trip Reference Standards’, sometimes called ‘transport reference standards’, are aliquots of water of known analyte concentration which are sent from the laboratory to the field, and are later returned along with genuine samples. The seal remains unbroken in the field. These trip reference samples are useful to determine both contamination and analyte loss which might arise during handling, transport or storage of the samples. They also yield estimates of analytical error. ‘Field Reference Samples’, sometimes called QC Samples, are aliquots of water having known concentrations which are sent by the laboratory to the field, but the seal is broken in the field, the contents are poured out and are handled identically to a genuine sample. The purpose of field reference samples is to determine contamination or analyte loss arising from the sample collection equipment, sample handling equipment (e.g., filtration apparatus) or from the general conditions during sampling (e.g., blowing dust). Since samplers have different preferences for where to start the field reference sample process (for example, some people place the field blank bottle in the sampler and lower it to water level, others start at post-collection step prior to sample handling, still others start at addition of reagents step), it is important to document in the field notebook exactly what procedure was followed. Ideally, the same practice would be followed throughout a study, according to practice set out in standard protocols or in the QA Plan. Laboratory, trip and field reference sample information should be reported along with the genuine results. When interferences are identified, the cause should be investigated and the problem remedied. The extent of the contamination problem should be discussed, including the likely effect upon the data. However, good practice does not permit ‘correction’ of the data by subtraction of either trip nor field reference sample data.
2.17.3 Duplicates and Replicates Replicate samples are multiple (i.e., two or more) samples collected at the same location and time, by the same person, and using the same equipment and procedures. The smallest number of replicates is two (i.e., a duplicate). The purpose of collecting replicate samples is to obtain the precision for each analyte analyzed within these samples. The observed variance will be the sum of the local environmental variance, the analytical variance, plus the sampling variance. There are various methods to estimate the sources of variation in results. Replicate analyses of replicate samples has been reported to be a particularly useful QC approach in that it permits identification of analytical uncertainty, sampling uncertainty, and environmental heterogeneity via analysis of variance (ANOVA) calculations (Ramsey et al., 1992).
Quality Control and Quality Assurance
Field Sampling Manual, 2013
16
The QA Manual should include Data Quality Objectives (DQOs) for the relative proportions of categories of variance. At a minimum, the sum of the analytical variance plus sampling variance should be less than 20% of the observed local variance.
2.17.4 Multi-Agency Same Site Replicates It often is important to show that different studies provide comparable data. For adjacent studies by different agencies, the best way to do this is by having a series of duplicate or replicate samples collected by both studies at one or more common sites. Preferably, these samples should be collected at the same time. Each sampling team or person must use the regular personnel, equipment, and procedures.
2.17.5 Split Samples Split samples are sub-samples taken from one large sample which has been homogenized and divided into two or more sub-samples. The homogenization minimizes differences between samples due to environmental variance. Split samples usually are used to compare results between two or more methodologies or two or more laboratories. They are used for different purposes than replicate samples, and must be clearly identified so as not to be confused with true replicate samples. Similarly, repeat analyses of a sample by a laboratory, and also division of a sample into two or more sub-samples by a laboratory are both used for different purposes from replicate samples (and from each other) and must be clearly identified to avoid ambiguity. Split samples are not appropriate where the method used to produce the split samples itself imposes significant sampling error. Most sample splitters do not perform well for samples high in non-filterable residues (= suspended solids).
2.17.6 Matrix Spiking Matrix spiking may be employed sometimes as part of an ongoing QA/QC program either to monitor the performance of a laboratory or of a specific instrument. Changes in spike recoveries over time for similar sample matrices may indicate variation in analytical results. Matrix spiking may also be used at the initiation of a new technique or instrument to ensure the method or instrument is appropriate to the matrix being sampled. Very large bias, whether positive or negative, would indicate the procedure or instrument was ineffective for that matrix. Spiking may also yield information as to interference problems, recovery problems and sample stability problems.

Quality Control and Quality Assurance
Field Sampling Manual, 2013
17
It is recommended for both accuracy and safety reasons that spikes be prepared by trained laboratory analysts under laboratory conditions. Field spiking operations should consist solely of adding a prepared spiking solution to the sample matrix. Field personnel performing spiking must have been trained in this technique. Additionally, the reproducibility of field spiking must be confirmed regularly through periodic replicate spikes. Spiking solutions must be clearly labeled as to content, expiry date, added preservatives, and as to appropriate storage environment. For example, some spiking solutions may have to be kept in the dark, or may have to be kept over ice. Spiking solutions should be of similar levels to what is expected in the environment. Spikes more than 5 times what actually occurs in the environment can mask interference effects, leading to over-optimistic estimates of analyte recovery. Spiking solutions should be small (less than 2%) of sample volumes so as not to affect the sample matrix. Spiking is not appropriate at concentrations below 5 times detection limit, nor is it appropriate for unstable chemicals for incompatible solvents. Genuine sample matrices should be used. A common fallacy is to assume that an overnight spike of sand with some contaminant has some relationship to multi-year exposure of soil with that substance. Samples should be closely examined just prior to and after addition of spiking solution. Any colour change, or an obvious increase in sample turbidity, may be indicative of a change in sample matrix or of related problems such as semi-miscible solvent. There are two problems to keep in mind when performing spike addition or when analyzing spike results. First, a spike program should also include a program of sample splitting or sample replication for genuine samples. Second, the spiked material may change chemically within the matrix over time. Thus, a just added spiked substance may have different chemistry than that same chemical in that same matrix for 5 or 10 years. If performed, then spike information should be reported along with sample analysis results. However, it is not good practice to ‘correct’ genuine samples results based on spike recoveries. Spike recovery is very dependent upon analyte, method of sampling and analysis used, on sample matrix, and on the concentration of analyte in both spiked and non-spiked samples. The QA Plan should specify appropriate data quality objectives specific to interpreting spike results for specific analytes. Certainly results outside three standard deviations of historic results at a particular site and matrix condition warrant further investigation.

Quality Control and Quality Assurance
Field Sampling Manual, 2013
18
2.17.7 Surrogate Spikes Surrogate spikes are spikes as described previously, with the important distinction that rather than spiking with the analyte of interest, one spikes with an substance distinctly different to the analyte but having very similar chemical properties in so far as the method of analysis is concerned. This permits one, for example, to substitute a non-toxic substance for one of extreme toxicity, provided both have been proven to behave similarly for the chemical assay procedure. Surrogate substances usually are chosen such that they are unlikely to occur in genuine samples. Isotopically labeled compounds are often used for this purpose. Surrogate spikes are a practical method to prove an assay method is in control. Surrogate spikes would not be used for a field study without close liaison with analytical laboratory personnel. Use of surrogates to adjust results, for example to compensate for evaporation loss, is strongly discouraged.
2.18 Data Quality Objectives Data quality objectives (DQOs) are formal data quality specifications, which must be tabulated within the QA Manual. These objectives determine the maximum amount of uncertainty (or error) which can be tolerated in the data if it is to be satisfactory for the intended use. DQOs are highly specific to the intended use of the data, and also to the overall costs. The DQOs should be specified within the Quality Manual before any samples are collected, so as to avoid situations where monies are spent collecting samples which are inadequate for the intended purpose. Once DQOs have been established and sampling has commenced, there must be regular performance checks to determine whether or not the DQOs are met. Corrective action must be taken when DQOs fail to be met. The Quality Manual must include specific actions which must be taken to check the DQOs and also specific action must be taken when any particular DQO is not met. Out-of-control events and actions must be recorded. Appendix 3 tabulates some example DQOs (Acceptability Criteria) and appropriate actions when these criteria fail to be met.
2.19 Expression of Results Since it is highly likely that measurements made in the field may be subject to further calculation and data analysis, it is recommended that the numeric results be reported with additional digits beyond those of the significant figures convention.

Quality Control and Quality Assurance
Field Sampling Manual, 2013
19
Where practical, explicit estimates of bias and precision should form part of the record of numeric results. The procedure used to estimate bias and precision should be recorded in the Quality Manual. The practice of left-censoring of data below the detection limit is discouraged, since it results in ambiguity. Good practice suggests reporting in such situations of actual instrumentation reading plus an unambiguous estimate of laboratory uncertainty. Variable names should be stated in consistent, unambiguous terms. Units must be expressed in unambiguous terms, for example:
Reporting Unit Type Example Units weight/volume %(w/v), mg/L, μg/L weight/weight %(w/w) volume/volume %(v/v)
2.20 Performance Audits Sampler performance should be audited periodically to check the functioning of QC procedures. Such Performance Audits link a program to a uniform standard that may be regional, provincial, national, or international. While these audits may be performed in-house usually, it is important that the audits be performed occasionally by an independent expert. Records of audit results and of action taken should be kept. Performance Audits should include visits to the sites where the activities to be audited are actually performed. The Auditor should check that written protocols do exist, are being followed, and do genuinely correspond to actual practice. The Auditor should check that the activities being performed correspond to the goals requiring that activity, that all staff are trained in both the activity and associated safety aspects. The Auditor should particularly check for deficiencies where scientific methodology has advanced and old technologies are no longer appropriate. For the convenience of auditors when auditing field sampling activities, a Sampler Evaluation Check List is included as Appendix 1 of this chapter. Recommendations as to different types of audits, purpose and relative timing are tabulated in Appendix 2 of this chapter. External audits are intended to introduce an independent, fresh point of view. External auditors should not be employed by or be closely associated with the office being audited. Use of different persons for successive independent audits is to be encouraged.

Quality Control and Quality Assurance
Field Sampling Manual, 2013
20
2.21 Interstudy Comparison Results One cannot always tell from reading printed methodologies whether the sampling and monitoring used by different study agencies yield comparable results. Therefore, agencies involved in the collection and analysis or monitoring of environmental and discharge samples are strongly urged to participate in Interstudy Comparisons Programs. Interstudy Comparison Programs have two or more study groups simultaneously monitoring side-by-side to exchange of collected samples, for example, exchange of diatom samples for comparison of taxonomic identifications.
3. Field Analytical Laboratories Where the equivalent to an analytical laboratory has been established in the field, the procedures specified in the British Columbia Environmental Laboratory Manual should be followed. The manual includes protocols for setting method detection limits, plus protocols for blank correction. Since many technicians are under the impression that blank correction is mandatory, it should be emphasized during training that blank correction is only performed under specific conditions. Inappropriate blank correction will add analytical noise, rather than reduce it. Blank correction rarely is appropriate. Note that many field laboratories may fall under Section 5 of the British Columbia Environmental Laboratory Manual. Section 5 provides for a somewhat reduced QC program for small laboratories provided they maintain a satisfactory score (PE Score >70) on the EDQA interlaboratory comparison program and also provided they run analyses in small batches (i.e., fewer than 11 samples per batch). Laboratories failing to achieve a satisfactory score on the EDQA interlaboratory comparison, or which run large batches of samples are expected to follow the full QC program.
4. Sources of Further Information
4.1 Laboratory QA/QC Anon. Standard Methods for the Examination of Water and Wastewater, AWWA,
APHA, 18th Edition (1992), Section 1000. Creed, J. T., Martin, J. D., and Sivaganesan, M. 1995. Preservation of Trace Metals in
Water Samples. Journal AWWA, 104-114.

Quality Control and Quality Assurance
Field Sampling Manual, 2013
21
Garfield, F.M. 1991. Quality Assurance Principles for Analytical Laboratories. Association of Official Analytical Chemists, USA.
Taylor, J.K. 1987. Quality Assurance of Chemical Measurements. Lewis Publishers
Inc., Chelsea, Michigan, USA. Worthington, J.C., Coll, S.A., and TechLaw Inc. 1992. Auditing Environmental Data
Systems. 46th Annual Quality Congress (May 18-20, 1992). Nashville Conference No. 18445. Pages 692-705.
4.2 Sampling QA/QC American Society for Testing and Materials. 1990. Emergency Standard Practice for
Generation of Environmental Data Related to Waste Management Activities. ASTM Designation ES 16 - 90. 14 pages. See Annual Book of ASTM Standards.
Barcelona, M.J. 1988. Overview of the Sampling Process. In Principles of
Environmental Monitoring, L.H. Keith(ed.). American Chemical Society, Washington, DC, USA. 458 pages.
Beak Consultants Ltd., Brampton, Ontario. 1991. Quality Assurance Guidelines for
Biology in Aquatic Environment Protection. Report prepared for the National Water Research Institute, Environment Canada, Burlington, Ontario, Canada.
Clark, M.J.R. 2000. Quality Assurance in Environmental Analysis. In: R.A.
Meyers (ed).), Encyclopedia of Analytical Chemistry, John Wiley & Sons Ltd., Chichester, UK, pp. 3197-3227.
Clark, M.J.R. and Whitfield, P.H. 1993. A Practical Model Integrating Quality
Assurance into Environmental Monitoring. Water Resources Bulletin, 29: 119-130.
Csuros, M. 1994. Environmental Sampling and Analysis for Technicians. Lewis
Publishers, Ann Arbor, USA. Gilbert, R.O. 1987. Statistical Methods for Environmental Pollution Monitoring. Van
Nostrand Reinhold, New York, USA, 320 pp. Hopps, H.C. 1986. Representative Sampling of Human Tissue. Journal of the
National Bureau of Standards, 91: 47-50. Keith, L.H. 1991. Environmental Sampling and Analysis: A Practical Guide. Lewis
Publishers, Boca Raton, Florida, USA.

Quality Control and Quality Assurance
Field Sampling Manual, 2013
22
Kramer, K.J.M. 1994. What About Quality Assurance Before the Laboratory Analysis? Marine Pollution Bulletin, 29: 222-227.
Kratochvil, B. and Taylor, J.K. 1981. Sampling for Chemical Analysis. Analytical
Chemistry, 53: 924A - 938A. Kratochvil, B., Wallace, D., and Taylor, J.K. 1984. Sampling for Chemical Analysis.
Analytical Chemistry, 56: 113R - 129R. Loring, D.H. and Rantala, R.T.T. 1992. Manual for the Geochemical Analyses of
Marine Sediments and Suspended Particulate Matter. Earth-Science Reviews, 32: 235-283.
Prasad, S.S. 1994. Trends in Quality Assurance in the Characterization of Chemical
Contaminants in the Environment. Trends in Analytical Chemistry, 13: 157-164. Ramsey, M.H., Thompson, M. and Hale, M. 1992. Objective Evaluation of Precision
Requirements for Geochemical Analysis Using Robust Analysis of Variance. Journal of Geochemical Exploration, 44: 23-36
Thompson, M. and Howarth, R. J. 1978. A New Approach to the Estimation of
Analytical Precision. Journal of Geochemical Exploration, 9: 23-30. Thompson, M. and Howarth, R. J. 1976. Duplicate Analysis in Geochemical Practice
(2 parts). Analyst, 101: 690-709.
5. Revision History February 28, 2001: Brief clarification text added to the Regent Water, the Split Sample
and the Surrogate Spikes sections. Also Appendix 3 was added. November 1996: Initial publication.

Quality Control and Quality Assurance
Field Sampling Manual, 2013
23
Appendix 1 Sampler Evaluation Check List
Date:Site:Sampler:Observer:
STEP or PROCEDURE OKAY? COMMENTS:
sampling day and shipping arrangements followed safety protocolsplanned to minimize transit delays
bottles clearly labelled & dated using a permanent marking pen.
samplers (and associated items such as ropes) are clean before use.
bottle caps removed just before sampling, are protected from contaminationi.e., placed in a clean, dry plastic bag; avoids touching inside of caps & bottles.
exercises caution when sampling; generally safety conscious around site.
sample taken at designated sampling site; any deviations from site locationrecorded.
samples in deep, well-mixed & flowing water whenever possible.
samples upstream when wading; avoids collecting in stirred-up water.
avoids causing debris from falling from bridge onto the sampler.
sample bottles are not rinsed before collection (i.e., are lab pre-cleaned).
bottles filled to correct level & securely capped immediately after filling,i.e., room for preservatives, small air space for coliforms.
handles preservatives carefully with appropriate safety equipment, i.e., gloves& glasses; demonstrates technique that minimizes preservative contamination;empty preservative vial re-capped, placed inside secondary container andreturned to cooler.no contact between preservative vial or dispenser & sample water or samplebottle.
no contact with sample water, inside of bottles or caps with anything!
allowed thermometer to equilibrate 3 or 4 minutes in field bottle before reading;thermometer never inserted in any sample bottle.
sampling time recorded as hh/mm (2400 hour clock); sample date as yy/mm/ddon all lab requisitions.
packs bottles carefully with enough ice packs to cool temperature sensitivesamples.
records field measurements, observations & possible contamination sourceswhere appropriate.
reusable sampling & safety equipment is kept clean & stored for future use in sucha manner as to minimize damage or contamination.
shipping coolers secured (taped) for transit; destination clearly labelled on cooler(s).

Quality Control and Quality Assurance
Field Sampling Manual, 2013
24
Appendix 2 Audit Types, Purpose, and Suggested Audit Frequency Audit Type Purpose Audit Frequency a. In-House Auditor b. Independent Auditor
Systems Audit
Qualitative (no measurements made) walk-through of operations to ensure that all aspects of the QA Program are operational.
Not less than once per year; ideally once per quarter.
Not less than once every 5 years; preferably every other year.
Performance Audits
Detailed walk-through of operations including quantitative checks such as handing a sampler a known sample to carry through sample handling and preservation, or side-by-side collection of samples alongside the routine sampler.
Not less than once a year; preferably once per quarter. Additional Performance Audits required should there have been a major change in operations, or should either the Systems Audit or the Performance Audit reveal serious QA/QC problems.
Not less than once every 5 years; preferably every other year.
Data Audits
Several samples are selected to be followed through the overall sampling process. All documentation (e.g., field notebooks) from sample collection to final computer records are checked in detail; calculations are confirmed.
At beginning of a new sampling program and annually thereafter.
Not less than once every 5 years; preferably every other year.

Quality Control and Quality Assurance
Field Sampling Manual, 2013
25
Appendix 3 Quality Assurance Guidelines to Supplement the Standard Effluent and Receiving Environment Quality Assurance Clause
The following guidelines have been developed to assist in the administration of the “Standard Quality Assurance Clause” developed by the QA Clause Committee. The objective of the standard QA Clause is to improve and maintain the quality of compliance and environmental data provided by the permittees. The clause requires permittees regularly to demonstrate that data quality is acceptable, based on the “Quality Assurance Guidelines”, and to take timely action to correct any unacceptable sample collection and analysis so as to avoid loss of data. This document sets quantitative guidelines for determining the acceptability of the blank, precision and accuracy data collected as an integral part of the permittee compliance and aquatic impact assessment programs. The guidelines apply to the monitoring of effluents and environmental water samples. Production of this data will enable permittees to assess their own sampling and analytical performance on a regular basis, as well as to provide the Ministry with an objective method of evaluating permittee performance. Quality Control Sample Types Objective Frequency Acceptability Criteria Action on When Criteria are Not Met
Laboratory Method Blanks
To determine the existence and magnitude of any contamination problem associated with laboratory methodology, environment, equipment and reagents.
Minimum of one method blank per batch run.
Laboratory method blanks preferably should not exceed the method detection limit (MDL). Where they do, they must not exceed the detection limit reported by the laboratory for the associated (same batch) samples.
All data associated with the blank must be evaluated to determine the impact upon the sample data. Sample results may require rejection or qualification based upon the degree and source of blank contamination. Note that the method blank is a control sample, and should not be used to substitute for the blank used for blank correction.
Field Blanks To determine the existence and magnitude of any contamination problem associated with sample containers, preservation reagents, or incidental contamination associated with sample collection, sample handling and sample transportation.
Field blanks are optional for monitoring of effluent parameters known to occur in high concentrations. Field blanks should be used for environmental samples and for monitoring of effluent parameters having low permit limits (i.e., near MDL). Minimum of one field blank per sample set.
Field blank contamination preferably should not be significantly greater in concentration nor occurrence than laboratory method blank contamination.
Detectable field blanks values should be checked to determine the source of contamination, and to determine the impact of this contamination upon the sample data. This evaluation may require analyses of additional field blanks, laboratory blanks, equipment blanks and filtration blanks. Sample results may require rejection or qualification based upon the degree and source of contamination. Note that field blanks results may not be subtracted from reported results.
Laboratory Duplicates/Replicates
Measures laboratory precision. Minimum of one lab duplicate per batch of 15 to 20 samples, or one duplicate per sample set or sample run, or randomly at an average frequency of at least 5% of all samples analysed. Where it is not possible to split a regular sample into two or more subsamples due to requirements for whole sample analysis, field duplicates should be substituted at a similar frequency.
For concentrations below 5 times the MDL, the difference between the two duplicate values shall not exceed twice the reported DL value. For concentrations at or greater than 5 times reported DL, the Relative Percent Difference (RPD, see Note 1) shall not exceed 20%. (The Ministry may establish less rigorous criteria for specific tests known to be imprecise.)
When results fall outside the allowable limits for duplicate values, preferably the entire batch of samples should be reanalysed if practicable. If this is not practicable then all data associated with the suspect data must be evaluated to determine the impact upon the sample data. Sample results may require rejection or qualification depending on the source and extent of the problem. Repeated problems over several batch runs must be thoroughly investigated and remedial measures taken. Laboratories should advice whether or not lab precision is a likely cause of the overall precision failure and QC sampling should be stepped up to pinpoint the cause.

Quality Control and Quality Assurance
Field Sampling Manual, 2013
26
Quality Control Sample Types Objective Frequency Acceptability Criteria Action on When Criteria are Not Met
Field Duplicates/Replicates Measures overall precision of sampling and analysis plus environmental heterogeneity. Also extremely poor results may indicate lack of representative samples.
Field duplicates are optional for effluents known to be highly stable and homogeneous. Field duplicates (or replicates) are mandatory for unstable or heterogeneous effluents, and for all environmental samples. Minimum of one duplicate sample per sample set.
It should be expected that the RPD is somewhat greater than that for laboratory duplicates. If one of a set of duplicate values at or greater than five times the MDL, then RPD values >20% indicate a possible problem, and > 50% indicate a definite problem, most likely either contamination or lack of sample representativeness.
The source of the problem must be determined, and the impact upon the sample data ascertained. A special evaluation study may well be required. Note that situations where non-representative samples are common call for specialised methods of sample collection.
Laboratory Reference Samples
Laboratory reference samples are SRMs, CRMs or lab-prepared samples handled identically to a genuine sample. Laboratory reference samples can be used to determine accuracy (bias) and multiple reference samples can be used to determine precision.
Minimum of one laboratory reference sample per batch run. Preferably SRMs or CRMs should be used, but where these are not available or practical, then in-house manufactured references may be employed. Where those are not practical, spikes or surrogates may be employed.
Preferably all values should meet the CRM or SRM manufacturer's specified confidence interval for the true value, or within 85% to 115% of the long-term mean, the design value, or the certified target value. However, tests for many organic substances are not this accurate nor precise. It is useful to plot results from laboratory reference samples on control charts. All values should fall within +/- 3 standard deviations of the mean or design value, whichever employed. (Control charts usually have additional decision rules regarding sequential values or runs.)
Where samples are stable, they should be re-analyzed. If this cannot be done, then the impact of the problem must be evaluated. Sample results may require rejection or qualification based on the scale of the problem.
Field Reference Samples Field reference samples are SRMs, CRMs or lab-prepared samples shipped from lab to field, seal broken, sample poured out and handled identically to a genuine sample. Field reference samples can be used to determine accuracy (bias) and multiple reference samples can be used to determine precision.
It is suggested that field reference samples (and similarly field spikes and surrogates) not be mandatory. They may be employed in special studies to characterise particular problems.
(Study specific) (Study specific)
Note 1: Whereas replicate data are usually reported in terms of relative standard deviation (RSD) or confidence intervals (CI), duplicate results are usually reported as Relative Percent Difference (RPD). For two duplicate values A and B, where A is larger than B, the RPD = 2*(A-B)/(A+B)*100% Note 2: With regard to both laboratory duplicates and field duplicates, duplicate analysis of blank samples may not be substituted for duplicate analyses of genuine samples. Note 3: Calibration solutions must not be employed as reference materials. Also blanks may not be substituted for reference materials. Note 4: For reference samples both the design (manufacturer's) value and the recovery should be reported. Note 5: Handling of QC samples on a blind basis is recommended where practical, but is not mandatory. Note 6: Field Duplicates/Replicates preferably should be collocated samples, either samples collected simultaneously side by side or as one large sample split into several sub-samples by a sample splitter. Sequential samples are not encouraged because of environmental heterogeneity. Note 7: Accuracy is usually measured and reported as % Recovery -- whether for results from SRMs, CRMs, in-house standards, spikes and surrogates.

PART B AIR AND AIR EMISSIONS TESTING
©Her Majesty the Queen in Right of the Province of British Columbia
2013 All Rights Reserved

HIVOL SAMPLING TO ASSESS CHRONIC HAZARD OF TRACE METALS IN AIR PARTICULATES
©Her Majesty the Queen in Right of the Province of British Columbia
2013 All Rights Reserved
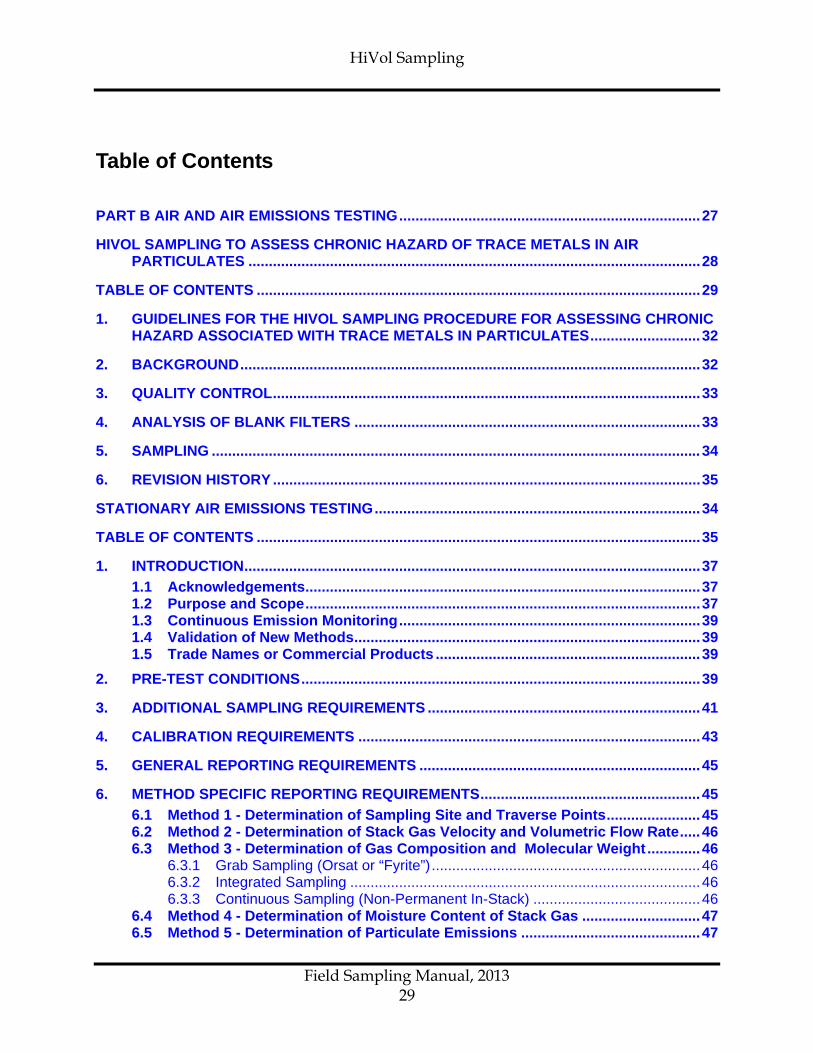
HiVol Sampling
Field Sampling Manual, 2013
29
Table of Contents PART B AIR AND AIR EMISSIONS TESTING .......................................................................... 27
HIVOL SAMPLING TO ASSESS CHRONIC HAZARD OF TRACE METALS IN AIR PARTICULATES ............................................................................................................... 28
TABLE OF CONTENTS ............................................................................................................. 29
1. GUIDELINES FOR THE HIVOL SAMPLING PROCEDURE FOR ASSESSING CHRONIC HAZARD ASSOCIATED WITH TRACE METALS IN PARTICULATES ........................... 32
2. BACKGROUND ................................................................................................................. 32
3. QUALITY CONTROL ......................................................................................................... 33
4. ANALYSIS OF BLANK FILTERS ..................................................................................... 33
5. SAMPLING ........................................................................................................................ 34
6. REVISION HISTORY ......................................................................................................... 35
STATIONARY AIR EMISSIONS TESTING ................................................................................ 34
TABLE OF CONTENTS ............................................................................................................. 35
1. INTRODUCTION ................................................................................................................ 37 1.1 Acknowledgements ................................................................................................. 37 1.2 Purpose and Scope ................................................................................................. 37 1.3 Continuous Emission Monitoring .......................................................................... 39 1.4 Validation of New Methods ..................................................................................... 39 1.5 Trade Names or Commercial Products ................................................................. 39
2. PRE-TEST CONDITIONS .................................................................................................. 39
3. ADDITIONAL SAMPLING REQUIREMENTS ................................................................... 41
4. CALIBRATION REQUIREMENTS .................................................................................... 43
5. GENERAL REPORTING REQUIREMENTS ..................................................................... 45
6. METHOD SPECIFIC REPORTING REQUIREMENTS ...................................................... 45 6.1 Method 1 - Determination of Sampling Site and Traverse Points ....................... 45 6.2 Method 2 - Determination of Stack Gas Velocity and Volumetric Flow Rate ..... 46 6.3 Method 3 - Determination of Gas Composition and Molecular Weight ............. 46
6.3.1 Grab Sampling (Orsat or “Fyrite”) .................................................................. 46 6.3.2 Integrated Sampling ...................................................................................... 46 6.3.3 Continuous Sampling (Non-Permanent In-Stack) ......................................... 46
6.4 Method 4 - Determination of Moisture Content of Stack Gas ............................. 47 6.5 Method 5 - Determination of Particulate Emissions ............................................ 47

HiVol Sampling
Field Sampling Manual, 2013
30
6.6 Continuous Emission Monitoring Survey (Non-Permanent In-Stack) ................ 49 6.7 High Volume Particulate Sampling Methods ........................................................ 50 6.8 Determination of Gaseous Emissions from Stationary Sources ........................ 50
7. SOURCES OF FURTHER INFORMATION ....................................................................... 51
8. REVISION HISTORY ......................................................................................................... 53 Appendix 1 Platform, Access and Safety Requirements .................................... 54 Appendix 1.1 Additional Platform, Access and Safety Requirements for
Monitoring Stack Emissions .............................................................. 55 Appendix 1.2a Sampling Facilities on Circular Stacks ............................................. 58 Appendix 1.2b Sampling Facilities on Circular Stacks ............................................. 59 Appendix 1.3 Sampling Facilities on Rectangular Stacks ..................................... 60 Appendix 1.4 Dimensions of a Stack Sampling Platform ....................................... 61 Appendix 2 Cyclonic Flow Check & Pitot Leak Check Procedure .................... 62 Appendix 3 High Volume Particulate Sampling ................................................... 64 Appendix 3.1 Sample Collection Procedure ............................................................ 65 Appendix 3.2 Sample Recovery ................................................................................ 67 Appendix 3.3 Analytical Procedure .......................................................................... 67 Appendix 4 Sample Train Leak Check Procedures ............................................. 68 Appendix 5 Sampling Under Adverse Conditions ............................................... 69 Appendix 6 Calibration Forms ............................................................................... 70 Appendix 6.1 General Calibration Form ................................................................... 71 Appendix 6.2 Orifice Meter Calibration Form .......................................................... 72 Appendix 6.3 Nozzle Diameter Calibration Form .................................................... 73 Appendix 6.4 Temperature Calibration Form .......................................................... 74 Appendix 6.5 S-Type Pitot Calibration Form ........................................................... 75 Appendix 6.6 Magnehelic Calibration Form ............................................................ 76 Appendix 6.7 Dry Gas Meter Calibration Form ........................................................ 77 Appendix 7 Regulatory Agency Approved Test Methods .................................. 78 Appendix 7.1 Parameters and Approved Methods ................................................. 79 Appendix 7.2 Method Sources .................................................................................. 83 Appendix 8 Continuous Emission Monitoring (Non-Permanent In-Stack)
Reporting Forms ................................................................................ 86 Appendix 8.1 Analysis of Calibration Gases ........................................................... 87 Appendix 8.2 Analyzer Calibration Data .................................................................. 88 Appendix 9 Compliance Testing Report Requirements ...................................... 89 Appendix 9.1 Source Emission Survey Report Format .......................................... 90 Appendix 9.2 Compliance Testing Report Summary Table ................................... 95 Appendix 9.3 System Calibration Bias and Drift Check ......................................... 96
APPENDIX 10 PSYCHROMETRIC CHARTS AND VAPOUR PRESSURE TABLES ............ 97 Appendix 10.1 Vapour Pressures of Water in Millimeters of Mercury .................... 98 Appendix 10.2 High Temperature Psychrometric Chart for Air-Water Vapour
Mixtures at 101.3 kPa ......................................................................... 99 Appendix 10.3 Sample Container, Preservation, and Hold Times for Air (Vapours) ........................................................................................... 100

HiVol Sampling
Field Sampling Manual, 2013
31
APPENDIX 11 DETERMINATION OF TOTAL REDUCED SULPHUR COMPOUNDS USING GRAB SAMPLING ........................................................................................ 101
APPENDIX 12 METHOD FOR MEASURING PARTICULATE EMISSIONS FROM STATIONARY SOURCES WITH CYCLONIC FLOW PATTERN (ALIGNMENT METHOD) ............................................................................... 102
APPENDIX 12.1 PRINCIPLE .................................................................................................... 103
APPENDIX 12.2 APPLICABILITY ............................................................................................ 103
APPENDIX 12.3 APPARATUS AND REAGENTS ................................................................... 104
APPENDIX 12.4 PROCEDURES .............................................................................................. 104
APPENDIX 12.5 CALCULATIONS AND REPORTING ............................................................ 106

HiVol Sampling
Field Sampling Manual, 2013
32
1. Guidelines for the HiVol Sampling Procedure for Assessing Chronic Hazard Associated with Trace Metals in Particulates Three requirements of the sampling procedure are: • That the lab provide quality control information to accompany all reported
measurements. • That trip blanks accompany every 5 samples collected, and that 5 blank filters be
analyzed prior to field circulation for every new filter type put into use. • That the Hi Volume sampler draw a sample over a full 7 days per filter, and that the 7
day sampling intervals be contiguous (one interval following immediately after another) over the course of a full year.
These requirements maximize the amount of information obtained from the current sampling equipment and lab methodologies so that a chronic exposure hazard can be calculated with the greatest accuracy without significantly increasing the costs of sample collection and analysis. Other requirements are: • That the site meet Ministry standards for particulate sampling. • That the motor exhaust from the HiVol must be vented away from the sample inlet
according to Ministry standards. Any lab providing analysis services must meet Ministry certification requirements.
2. Background An assessment of the chronic impact of trace metals involves calculating the average metal concentration found in a sequence of samples. The HiVol sampling method involves drawing particulate onto a filter. Lab analysis of the sample will determine the combination of metals in the sample and metals in the filter.
In calculating an averaged ambient metal concentration, the averaged metal content of the filters must be subtracted from the averaged total (sample and filter) of the metal measured. The greatest source of uncertainty in calculating ambient metals concentrations is generally due to the variability in the metal composition of the filter.

HiVol Sampling
Field Sampling Manual, 2013
33
3. Quality Control Because metal quantities are often present in concentrations which border on the threshold of detection: − A proper understanding of the uncertainties and statistical distribution of the amounts
of metals in the analyzed sample (filter plus collected particulate) is required, as is
− A proper understanding of the uncertainties and statistical distribution of the amounts of metals in blank filters.
Under no circumstance should data be censored at a detection limit as this destroys the statistical profile. All information provided from the lab analysis must include the quality control information. The intent is to separate bias and precision from overall uncertainties so that averaged quantities can be accorded an appropriate uncertainty. This also allows us to incorporate information, obtained from a variety of analytic sources (labs) and methodologies, into a statistical analysis, adjusting for bias and precision as required. To mitigate the costs associated with quality control, samples can be processed in batches. However, to build a base of quality control information, a given batch should not contain more than 5 samples. As quality control reference samples that contain metals in known quantities which match those found in a typical field sample become available, at least one reference sample must be included with every sample batch analyzed.
Because of the volume of information, all data from the lab analysis must be available electronically in a form that can be easily incorporated into Ministry databases. Labs that seek to provide analysis services must receive approval from the Ministry for the data delivery formats before submitting data.
4. Analysis of Blank Filters A statistical base of information must be generated for every filter type used in the collection of ambient metal samples. This can be accomplished whenever a new filter type is introduced by having the lab provide an analysis of the metallic composition of 5 filters prior to their type being circulated. At present, only the Pallflex Teflon TX40HI20WW has been approved for metals analysis sampling. Other filter types must receive approval from the Ministry before being used.

HiVol Sampling
Field Sampling Manual, 2013
34
The contamination associated with the field analysis can be determined by analyzing trip blanks. A trip blank is a blank filter that is delivered to the field site, placed on the HiVol sampler, removed immediately without activating the sampler, and then repackaged and shipped to the lab for analysis. To develop a base of information, trip blanks must accompany every 5 samples collected in the field. This will allow tracking of contamination and variations between filter batches. Should a significant trend be noted in the trip blanks, it may be necessary to reanalyze a sequence of blanks (not trip blanks) to ensure that the filter composition has not shifted. If, after this, it is determined that the composition of the filter has not changed, the sampling methodology should be re-examined to ensure contamination is being minimized.
5. Sampling (a) The uncertainty introduced from the metal composition of the filter can be
reduced if the amount of sample per filter is increased. This can be accomplished by running the HiVol sampler for more than 24 hours per filter.
The limit of how long to run a sample depends on the build-up of particulate on the filter, blocking air flow pathways through the filter and altering its screening properties. The suppliers of filters generally do not have maximum loading limits specified.
(b) A rough estimate of acceptable loading can be obtained from maximum loadings
from past measurements in BC. For TSP, this was 1.3 grams (ambient concentration of 787ug/M3 collected over 24 hours); for PM10, this was 0.7 grams (ambient concentration of 419ug/M3 collected over 24 hours). No failure of equipment was noted for such loadings (over the 24 hours of the sample).
Actual loading limits will depend on the density and size of particulate collected, however, it is anticipated that the HiVol filter should not become overloaded if operated for 7 days in an environment where the ambient concentration rarely exceeds 100ug/m3.
(c) For quality assurance, the flow rate of the HiVol must be measured at the
beginning and end of the sampling interval, and this information must be available for incorporation into Ministry databases.
(d) The number of days (7) is selected to fit within a normal work week schedule, and
is long enough that the relative uncertainty associated with the metallic composition of the Teflon filters (Pallflex EMFAB TX40HI20WW) is less than levels set by current ambient objectives.

HiVol Sampling
Field Sampling Manual, 2013
35
The number of days can be extended if it is demonstrated that this will not overload the HiVol sampler. The number of days can be reduced if filters of greater metallic purity (less trace metal composition, or more uniform metallic composition) are used. At present only the Pallflex Teflon TX40HI20WW has been approved for metals analysis sampling, so the sampling period must not be reduced without prior consultation with the Ministry.
(e) The sampling must be performed over contiguous intervals (the next sample
started as soon as the previous sample is finished) so that statistical artifacts associated with high (or low) concentration episodes can be minimized.
(f) Equipment downtime is tolerable as long as samples are collected over at least
85% of the time for each calendar month. Experience with HiVol samplers that are run continuously shows that the brushes on the motor need to be replaced every month.
6. Revision History
October 11, 2013: This section republished without change. Appendix 10.3 - Sample Container, Preservation, and Hold Times for Air (Vapours) included
February 28, 2001: This section republished without change. November 1996: Initial publication.

STATIONARY AIR EMISSIONS TESTING
©Her Majesty the Queen in Right of the Province of British Columbia
2013 All Rights Reserved

Stationary Air Emissions Testing
Field Sampling Manual, 2013
35
Table of Contents 1. INTRODUCTION ................................................................................................................ 37
1.1 Acknowledgements ................................................................................................. 37 1.2 Purpose and Scope ................................................................................................. 37 1.3 Continuous Emission Monitoring .......................................................................... 39 1.4 Validation of New Methods ..................................................................................... 39 1.5 Trade Names or Commercial Products ................................................................. 39
2. PRE-TEST CONDITIONS .................................................................................................. 39
3. ADDITIONAL SAMPLING REQUIREMENTS ................................................................... 41
4. CALIBRATION REQUIREMENTS .................................................................................... 43
5. GENERAL REPORTING REQUIREMENTS ..................................................................... 45
6. METHOD SPECIFIC REPORTING REQUIREMENTS ...................................................... 45 6.1 Method 1 - Determination of Sampling Site and Traverse Points ....................... 45 6.2 Method 2 - Determination of Stack Gas Velocity and Volumetric Flow Rate ..... 46 6.3 Method 3 - Determination of Gas Composition and Molecular Weight ............. 46
6.3.1 Grab Sampling (Orsat or “Fyrite”) .................................................................. 46 6.3.2 Integrated Sampling ...................................................................................... 46 6.3.3 Continuous Sampling (Non-Permanent In-Stack) ......................................... 46
6.4 Method 4 - Determination of Moisture Content of Stack Gas ............................. 47 6.5 Method 5 - Determination of Particulate Emissions ............................................ 47 6.6 Continuous Emission Monitoring Survey (Non-Permanent In-Stack) ................ 49 6.7 High Volume Particulate Sampling Methods ........................................................ 50 6.8 Determination of Gaseous Emissions from Stationary Sources ........................ 50
7. SOURCES OF FURTHER INFORMATION ....................................................................... 51
8. REVISION HISTORY ......................................................................................................... 53
APPENDIX 1 PLATFORM, ACCESS AND SAFETY REQUIREMENTS ............................... 54 Appendix 1.1 Additional Platform, Access and Safety Requirements for
Monitoring Stack Emissions .................................................................................. 55 Appendix 1.2a Sampling Facilities on Circular Stacks ............................................. 58 Appendix 1.2b Sampling Facilities on Circular Stacks ............................................. 59 Appendix 1.3 Sampling Facilities on Rectangular Stacks ..................................... 60 Appendix 1.4 Dimensions of a Stack Sampling Platform ....................................... 61
APPENDIX 2 CYCLONIC FLOW CHECK & PITOT LEAK CHECK PROCEDURE ............. 62
APPENDIX 3 HIGH VOLUME PARTICULATE SAMPLING .................................................. 64 Appendix 3.1 Sample Collection Procedure ............................................................ 65 Appendix 3.2 Sample Recovery ................................................................................ 67 Appendix 3.3 Analytical Procedure .......................................................................... 67

Stationary Air Emissions Testing
Field Sampling Manual, 2013
36
APPENDIX 4 SAMPLE TRAIN LEAK CHECK PROCEDURES............................................ 68
APPENDIX 5 SAMPLING UNDER ADVERSE CONDITIONS ............................................... 69
APPENDIX 6 CALIBRATION FORMS ................................................................................... 70 Appendix 6.1 General Calibration Form ................................................................... 71 Appendix 6.2 Orifice Meter Calibration Form .......................................................... 72 Appendix 6.3 Nozzle Diameter Calibration Form .................................................... 73 Appendix 6.4 Temperature Calibration Form .......................................................... 74 Appendix 6.5 S-Type Pitot Calibration Form ........................................................... 75 Appendix 6.6 Magnehelic Calibration Form ............................................................ 76 Appendix 6.7 Dry Gas Meter Calibration Form ........................................................ 77
APPENDIX 7 REGULATORY AGENCY APPROVED TEST METHODS............................. 78 Appendix 7.1 Parameters and Approved Methods ................................................. 79 Appendix 7.2 Method Sources .................................................................................. 83
APPENDIX 8 CONTINUOUS EMISSION MONITORING (NON-PERMANENT IN-STACK) REPORTING FORMS ................................................................................... 86 Appendix 8.1 Analysis of Calibration Gases ........................................................... 87 Appendix 8.2 Analyzer Calibration Data .................................................................. 88
APPENDIX 9 COMPLIANCE TESTING REPORT REQUIREMENTS .................................. 89 Appendix 9.1 Source Emission Survey Report Format .......................................... 90 Appendix 9.2 Compliance Testing Report Summary Table ................................... 95 Appendix 9.3 System Calibration Bias and Drift Check ......................................... 96
APPENDIX 10 PSYCHROMETRIC CHARTS AND VAPOUR PRESSURE TABLES ............ 97 Appendix 10.1 Vapour Pressures of Water in Millimeters of Mercury .................... 98 Appendix 10.2 High Temperature Psychrometric Chart for Air-Water Vapour
Mixtures at 101.3 kPa .............................................................................................. 99 Appendix 10.3 Sample Container, Preservation, and Hold Times for Air
(Vapours)................................................................................................................................... 94 APPENDIX 11 DETERMINATION OF TOTAL REDUCED SULPHUR COMPOUNDS
USING GRAB SAMPLING .............................................................................................. 101
APPENDIX 12 METHOD FOR MEASURING PARTICULATE EMISSIONS FROM STATIONARY SOURCES WITH CYCLONIC FLOW PATTERN (ALIGNMENT METHOD) ................................................................................................. 102 Appendix 12.1 Principle ............................................................................................. 103 Appendix 12.2 Applicability ...................................................................................... 103 Appendix 12.3 Apparatus and Reagents ................................................................. 104 Appendix 12.4 Procedures ........................................................................................ 104 Appendix 12.5 Calculations and Reporting ............................................................. 106
Stationary Air Emissions Testing
Field Sampling Manual, 2013
37
1. Introduction The requirements contained in this document are intended to supplement and update
various stack sampling reference methods, and will clarify specific points as well as stating any requirements which may be unique to the Ministry of Environment, Lands and Parks (MELP).
1.1 Acknowledgements The staff of the Greater Vancouver Regional District (GVRD) prepared the original
version of this document which has subsequently been adopted and modified by the Ministry of Environment, Lands and Parks. Publication of the GVRD material is with the permission of the GVRD.
1.2 Purpose and Scope This document standardizes sampling protocols and methods which may be required by
permit, approval, regulation, or bylaw. It also serves as a guideline for stationary emission testing survey reporting for regulatory staff, permittees, and consultants.
Reference to the “Regulatory Body or Agency” means the governing body, Ministry of
Environment, Lands and Parks and/or the delegated Greater Vancouver Regional District which regulates the discharge of contaminants into the air, as stated in the Waste Management Act (WMA). “Regulatory Administrator” has the same meaning as Director, District Director and manager, as defined in the WMA and Air Quality Director under Greater Vancouver Regional District Bylaw 725. “Regulatory Officers” has the same meaning as an officer defined in the WMA.
The Regulatory Administrator must be contacted if any deviations from the methods or
equipment included in this code are contemplated (Appendix 7.1). Request for testing deviations require prior written approval by the Regulatory Administrator. Any questions with respect to details contained in this document should be directed to the attention of:
Director, Air Resources Branch Director, Air Quality Department Environment and Resource Management Greater Vancouver Regional District Department 4330 Kingsway Ministry of Environment, Lands and Parks Burnaby BC V5H 4G8 Location: 3-2975 Jutland Rd

Stationary Air Emissions Testing
Field Sampling Manual, 2013
38
Victoria, B.C. V8T 5J9 Phone: (604) 436-6700 Mail: P.O. Box 9341 Stn Prov Govt Fax: (604) 436-6707 Victoria, B.C. V8W 9M1 Phone: (250) 387-9933 or 387-9932 Fax: (250) 356-7197

Stationary Air Emissions Testing
Field Sampling Manual, 2013
39
1.3 Continuous Emission Monitoring For in-stack continuous emission monitors (CEMs), the Regulatory Agency requires the
use of Environment Canada or United States Environmental Protection Agency (U.S. EPA) protocols and performance specifications (as listed in Appendix 7.1), unless otherwise superseded by other Provincial or GVRD requirements.
1.4 Validation of New Methods The Regulatory Agency may adopt new stationary source test methods that are not used
in other jurisdictions provided the requirements of U.S. EPA Method 301 have been met (see Appendix 7.1 listing). The onus is on the source owner or operator proposing the new method to ensure that all the requirements of Method 301 have been met. Before a new method can be accepted, the Regulatory Administrator may require substantial documentation to indicate all the information required under Method 301 is supplied as appropriate.
1.5 Trade Names or Commercial Products Mention of trade names or commercial products does not constitute endorsement by the
Ministry of Environment, Lands and Parks or the Greater Vancouver Regional District.
2. Pre-Test Conditions The following conditions must be met prior to sampling: All manual source testing results submitted to the Regulatory Agency must have been
conducted or continuously supervised on-site by at least one individual who has passed relevant stack sampling courses as required by the Regulatory Administrator. Relevant courses include the following:
British Columbia Institute of Technology (BCIT), Stack Testing and Sampling; Mount Royal College (Calgary), Stack Sampling Course; University of Windsor, The Windsor Stack Sampling Course; Fanshawe College (London, Ontario), Air Sampling and Evaluation LabII; and United States Environmental Protection Agency (U.S. EPA), Source Sampling for
Pollutants. Note: It may be possible to challenge the above courses. Further information
may be obtained by contacting the educational institution.

Stationary Air Emissions Testing
Field Sampling Manual, 2013
40
It is the responsibility of the owner/operator of a facility to provide safe access to the chosen sampling location and a firm platform for obtaining samples shall be provided following Appendix 1 of this chapter and pertinent Workers' Compensation Board Regulations.
The chosen sampling site must meet the minimum requirement of two stack diameters
downstream and a half a diameter upstream from the last flow disturbance. Note that this requires more sampling points compared to a sampling site that is located eight stack diameters downstream and two diameters upstream from the last flow disturbance.
The cross-sectional sampling point layout within a rectangular duct must be chosen such
that the ratio of the length to the width is between 1.0 and 2.0. For particulate sampling, the mean rotational angle for all sampling points must not
exceed +/-20o from the 0o reference position (calculated as outlined in Appendix 2 of this chapter).
For sources that operate under Provincial permit, approval, regulation or bylaw, the
proponent is to provide the Regulatory Administrator with a minimum of five working days advance notice before emission compliance testing is carried out. Alternately, the proponent can provide the Regulatory Administrator with another mutually acceptable minimum advance notice duration, in writing, before emission testing is carried out.
For sources that operate under GVRD permit, approval or bylaw, the proponent shall
provide the Regulatory Administrator with a minimum of three working days advance notice before any emission compliance testing is carried out.
The results of all air emission testing performed for regulatory compliance requirements
under permit, approval, regulation or bylaw shall be retained by the facility, for a period of five years, and be made available to the Regulatory Administrator upon request.
A detailed test plan must be submitted in writing for approval for any non-routine (e.g.,
Destruction Removal Efficiency or Special Waste Facility) testing programs 30 days prior to the scheduled sampling.

Stationary Air Emissions Testing
Field Sampling Manual, 2013
41
3. Additional Sampling Requirements In addition to the requirements of the Reference Method for Source Testing:
Measurement of Releases of Particulate from Stationary Sources (EPS 1/RM/8), or U.S. EPA Methods 1 to 5, the following requirements must be fulfilled for all compliance testing:
A minimum of three test runs constitute a valid stack survey, unless the method being
used specifically states otherwise. Where less than three runs are being used, the Stack Emission Survey Report must quote the language and section of the method that allows exception from the three test run requirement.
• For a valid stack survey, the individual test runs should be taken on the same day.
The duration, over which the three test runs are extracted, for a valid stack survey, should not exceed two days. Any individual run shall be taken on one given day. Alternately, the proponent can provide the Regulatory Administrator with another mutually acceptable duration for stack sampling, in writing before emission testing is carried out.
• The results of individual test runs and the average of all test runs constituting a valid stack survey shall be reported. The arithmetic average of all test runs taken during a valid stack survey shall be used to assess compliance with the limits stated in permits, approvals, regulations or bylaws.
The minimum duration of one complete test run must be 60 minutes, except testing for
dioxins, furans, PCBs and PAHs which shall be a minimum of 240 minutes per individual test run, unless the method being used states otherwise. Where exception is being made, the language and section of the method that allows for this must be quoted in the Stack Emission Survey Report (see Appendix 9.1).
The sampling nozzle shall be sized to obtain a sample volume of 1 m3 (as sampled) or
greater for particulate testing. Sample points shall be calculated using the applicable tables found in EPS 1/RM/8 or the
US EPA CFR 40 Part 60. The general guidelines are: stacks with diameters greater than 61 cm - 12 point minimum, 24 point maximum (25 for
rectangular stacks) stacks with diameters between 30 and 61 cm - 8 point minimum, 24 point maximum (25
for rectangular stacks)

Stationary Air Emissions Testing
Field Sampling Manual, 2013
42
Consult the applicable tables for calculating points at locations requiring more than the minimum number of points and less than the maximum.
In the recovery procedure for a standard particulate test, acetone and deionised water
must be used for washing the interior surfaces of the nozzle, probe, cyclone (if used), and filter holder (the front half of the sampling train). Make blank determinations on the acetone and water and subtract the weight from the washing particulate catch. The blank volumes approximate the average amount of water and acetone used for each front half wash.
In performing grab sampling (e.g., bag, bomb, or container for independent analysis),
unless the method being used states otherwise: two grab samples withdrawn one after the other constitute a single test run, a minimum of three test runs are required for each valid stack survey, and an interval of at least one hour is required between the individual test runs. For cases where deviations from the above three conditions are applied, the Stack
Emission Survey Report must quote the language and section of the method that allows the exception(s).
High volume particulate sampling is considered to be non-standard and requires prior
written approval from the Regulatory Administrator. If sampling by these methods has been approved, the method outlined in Appendix 3 of this chapter must be followed.
Leak checks are mandatory and should be carried out as outlined in Appendix 4 of this
chapter. Sampling under adverse conditions may require specialized equipment or procedures.
Some of these are listed in Appendix 5 of this chapter.

Stationary Air Emissions Testing
Field Sampling Manual, 2013
43
4. Calibration Requirements The following table outlines the general requirements for the calibration of source testing
equipment:
Equipment Interval Recommended Procedure Dry Gas Meter Annually when equipment remains at a permitted
facility Every 6 months when equipment is used at various facilities
Against a: • spirometer, • wet test meter, • calibration checked dry gas meter, and/or • critical orifice as indicated in U.S. EPA Method 5.
Magnehelic Gauges
Annually when equipment remains at a permitted facility Every 6 months when equipment is used at various facilities
Against an inclined manometer, as indicated in U.S. EPA Method 2
Nozzles Calibrate before initial field use. When nozzles become nicked, dented or corroded they are to be reshaped and calibrated prior to use.
Calibrate by measuring with a micrometer. Examine thoroughly prior to each field use. See U.S. EPA Method 5.
Pitot Tubes After each field use re-examine. For a new pitot tube or in the event of any damage such that the pitot tube does not meet specification, repair and calibration is required.
Calibrate in a wind tunnel using the procedures outlined in U.S. EPA Method 2.
Thermocouples Every 6 months Against an National Institute of Standards & Technology (N.I.S.T) thermometer, with ice, water, and hot oil as indicated in U.S. EPA Method 2.
Rotameters Need not be calibrated, but should be cleaned and maintained according to the manufacturer’s instruction, as indicated in U.S. EPA Method 3.
In addition to the requirements above, if critical orifices are used as a means of checking
calibration, they are to be checked once every two years against a spirometer, wet test meter, or calibrated dry gas meter.
The calibration certificate must include all pertinent data, the date of calibration, and the
name of the technician who performed the calibrations. Valid calibration certificates for all pertinent equipment used in the emission survey must be included in the report. The calibration sheets to be used are those referenced in Appendix 6 of this chapter, or those which include all the pertinent data outlined in these reference calibration sheets.
All calibrated instruments shall be permanently and uniquely identified for easy reference. A copy of the most current calibrations shall be carried with the source testing team on all
field tests and must be provided to Regulatory Agency audit staff or officer upon request.

Stationary Air Emissions Testing
Field Sampling Manual, 2013
44
Note that the stated interval of either six months or annually should be considered a maximum time frame, as calibrations must be conducted as required.

Stationary Air Emissions Testing
Field Sampling Manual, 2013
45
5. General Reporting Requirements The stack emission survey reports must be tabulated, summarized, and forwarded to the
Regulatory Administrator in the appropriate Region or District either as an attachment to the Permittees’ quarterly reports or as a separate report.
All stack emission survey reports shall be clearly legible and contain the necessary detail
as specified in the report requirements in Appendix 9 of this chapter. All reports shall include, but not be limited to, the information listed in Appendix 9, unless prior written authorization has been obtained from the Regulatory Administrator.
The electronic reporting of data may be required in the future.
6. Method Specific Reporting Requirements In addition to the requirements specified in EPS 1/RM/8, or U.S. EPA Methods 1 to 5,
the following outlines the minimum reporting requirements for Methods 1 through 5, high volume particulate sampling, and gaseous constant rate sampling.
6.1 Method 1 - Determination of Sampling Site and Traverse Points
Report all stack dimensions. A diagram of the sampling site must include the following: Measured distance and number of duct diameters upstream and downstream from the last
flow disturbance Stack shape and cross sectional distances Stack cross sectional area Number of sample ports Nipple length and diameter Include the measured location of all traverse points, along with a notation of any points
which have been combined during the testing period [i.e., multiple points within 1.3 to 2.5 cm (0.5 to 1 inch) of the stack wall].

Stationary Air Emissions Testing
Field Sampling Manual, 2013
46
6.2 Method 2 - Determination of Stack Gas Velocity and Volumetric Flow Rate
A cyclonic flow check is required at each measurement location. In the report, include
the rotational angle for each individual point as well as the calculated mean rotational angle for all sampling points. The cyclonic flow check need not be repeated for each survey provided a previous cyclonic flow check has been performed and no modifications affecting the flow patterns have taken place since that time.
Report the devices used for velocity measurement along with the range of the instrument
used to measure the differential pressure. Calibration data is required for the S-type pitot tubes, standard pitot tubes, and/or magnehelic gauges used during the measurement period.
6.3 Method 3 - Determination of Gas Composition and Molecular Weight
6.3.1 Grab Sampling (Orsat or “Fyrite”) Take a minimum of three individual samples during each test run - one at the start,
midpoint, and conclusion of each test. Report the time the individual tests were carried out and the results of these measurements.
6.3.2 Integrated Sampling Note the type of collection bag (Tedlar, Mylar, Aluminized Mylar) as well as the
sampling time and rate. Report the time lapse between collection and analysis along with results of the leak check procedure performed on the system.
6.3.3 Continuous Sampling (Non-Permanent In-Stack) Report the type of analyzer, method of detection, calibration procedure with results, and
leak check results. Report sample times and any interruptions or problems with the measurement system.

Stationary Air Emissions Testing
Field Sampling Manual, 2013
47
6.4 Method 4 - Determination of Moisture Content of Stack Gas
The moisture calculations for saturated conditions shall include two values: a moisture value from the condenser method a moisture value from a psychometric chart and/or saturation vapour pressure tables, as
found in Appendix 10 of this chapter. The lower of the two reported values is to be considered the correct moisture value and is
to be used in all subsequent calculations. Record the temperature of the last impinger for each sampling interval on the field sheet. Record reported weights or volumes of impingers individually including the weight
difference of the silica gel.
6.5 Method 5 - Determination of Particulate Emissions
Calibration sheets are required for the following equipment: Dry Gas Meters Pitot Tubes Magnehelic Gauges Orifice Meters Thermocouples Nozzles A flow chart or schematic of the collection system components is required. This
schematic shall indicate but not be limited to: the type of sampling probe liner, type and number of impingers, and contents and volume of impingers.
Leak tests are to be conducted as outlined in Appendix 4 of this chapter. The field sheets
must document the time, vacuum reading, and the leakage rate. The sampling field sheet must be complete and legible. Readings are taken and recorded
for each sampling interval which must be a minimum of 2.5 minutes and a maximum of 5 minutes. This is to include:
Stack temperature

Stationary Air Emissions Testing
Field Sampling Manual, 2013
48
Velocity pressure (Δ P) Orifice pressure (Δ H)

Stationary Air Emissions Testing
Field Sampling Manual, 2013
49
Dry gas meter, probe, hot box, and last impinger temperature Pump vacuum (millimeters of Hg) Dry gas meter volume In addition, document all pre-test estimates of moisture, stack
temperature, maximum velocity pressure and the nozzle estimate on field sheets.
Document the sample recovery procedure, including all clean up procedures for the
sampling probe, cyclone, filter holder and impingers.
6.6 Continuous Emission Monitoring Survey (Non-Permanent In-Stack)
With the exception of sources covered under the MELP Asphalt Plant Regulation, three
one-hour tests with calibrations run between each test are required for a valid continuous emission monitoring survey. Emission calculations for tests of one hour will be based on readings at one minute intervals (a minimum of 60 measurements).
For sources covered under the MELP Asphalt Plant Regulation, a single one hour test is
required for a valid emission monitoring survey for organics and carbon monoxide. Calibration runs are to be performed both before and after the test. Emission calculations will be based on readings at one minute intervals (a minimum of 60 measurements).
Reports for continuous emission monitoring surveys shall include: A detailed sampling system description and schematic diagram Copies of digital or chart recorder printouts labeled with individual test start and finish
times, chart speed, pre-and post calibrations, span, drift determination, parameters sampled, number of sample points, and NOX converter efficiency.
Tables for: Analysis of calibration gases Analyzer calibration data System calibration bias and drift test Sample tables are found in Appendix 8 of this chapter.

Stationary Air Emissions Testing
Field Sampling Manual, 2013
50
6.7 High Volume Particulate Sampling Methods Please note that Method 5 is mandatory and only for unusual circumstances will the use
of the high volume procedure for compliance testing be considered. Prior written approval from the Regulatory Administrator is required, as it is a non-standard testing method. Information submitted to the Regulatory Agency shall include but not be limited to:
A detailed diagram of the sampling site including the duct locations where sampling was
conducted. A detailed schematic of the sampling apparatus. Calibration sheets for the following equipment: Pitot tubes Magnehelic Gauges Thermometers Calibration curve for the flow orifice. The size of the nozzle used. The sampling field sheets and all information necessary to conduct the calculations. A
sample calculation shall be conducted for one run. The percent isokinetics for each sampling point must be submitted.
Documentation of the sample recovery procedure which was used.
6.8 Determination of Gaseous Emissions from Stationary Sources
Sampling and analytical procedures must follow approved methods and be documented.
Gas sampling trains shall be operated within the recommended maximum flow rates outlined in the method. Any deviation from recognized procedures will require prior written approval from the Regulatory Administrator.
A flow chart or schematic of the collection system components is required. This diagram
must include the impinger contents and volumes as well as the type of impinger and sequence. Document the type of impinger connections.

Stationary Air Emissions Testing
Field Sampling Manual, 2013
51
Calibration sheets are required for: Dry Gas Meters Pitot tubes Magnehelics Thermometers Orifice meter On the gas sampling field sheet, detail sampling conditions as described in Appendix 9 of
this Chapter at an interval not greater than 10 minutes between readings.
In addition, Determination of Nitrogen Oxides (Flask Method) requires: 1) The volume of the collection flask - flask valve combination must be
measured prior to sampling. Record the measured volume on the flask.
2) On the field sheet, include the flask volume and initial and final flask
pressure and temperature. An initial and final barometric pressure are also to be included.
3) Enclose the sampling field sheet and all information necessary to
conduct the calculations. Include an example calculation for one run. The sample recovery procedure must be documented.
7. Sources of Further Information Alberta Stack Sampling Code. Publication Number: REF. 89 ISBN 0-7732-1406-2, 1995
version effective January 1, 1996 Air Resources Branch; Source Testing Code (Version #2). Nov. 1980. Province of
Ontario, Ministry of Environment, Report # ARB-TDA-66-80. Asphalt Plant Regulation. BC Regulation 217/97, Deposited June 27, 1997, Province of
British Columbia, Ministry of Environment, Lands and Parks.* Quality Assurance Handbook For Air Pollution Measurement Systems, Volume III. 1988.
United States Environmental Protection Agency, Environmental Monitoring Laboratory; Stationary Sources Specific Methods.
Standards of Performance for New Stationary Sources, Vol. 40. United States
Environmental Protection Agency, Office of the Federal Register;

Stationary Air Emissions Testing
Field Sampling Manual, 2013
52
Parts 53-60.

Stationary Air Emissions Testing
Field Sampling Manual, 2013
53
Source Sampling Manual Volume I. August 1981. State of Oregon, Department of Environmental Quality, Air Quality Control Division.
Occupational Health & Safety Regulation, BC Regulation 296/97, effective April 15,
1998, Workers Compensation Board of British Columbia. Reference Method for Source Testing: Measurement of Releases of Particulate from
Stationary Sources. December 1993. Environment Canada, EPS 1/RM/8.
Protocols and Performance Specifications for Continuous Monitoring of Gaseous
Emissions from Thermal Power Generation. September 1993. Environment Canada, EPS 1/PG/7.
* Available at http://www.qp.gov.bc.ca/stat_reg/regs/elp/R217_97.htm
8. Revision History October 11, 2013: This section republished without change. Appendix 10.3 - Sample
Container, Preservation, and Hold Times for Air (Vapours) included February 28, 2001: The Stationary Air Emissions Testing Section was revised in
detail, with the revised draft reviewed by private sector representatives.
November 1999: Initial publication.

Stationary Air Emissions Testing
Field Sampling Manual, 2013
54
Appendix 1 Platform, Access and Safety Requirements
Appendix 1.1 Additional Platform Access and Safety Requirements for Monitoring Stack Emissions
Appendix 1.2a Sampling Facilities on Circular Stacks Appendix 1.2b Sampling Facilities on Circular Stacks Appendix 1.3 Sampling Facilities on Rectangular Stacks
Appendix 1.4 Dimensions of a Stack Sampling Platform

Stationary Air Emissions Testing
Field Sampling Manual, 2013
55
Appendix 1.1 Additional Platform, Access and Safety Requirements for Monitoring Stack Emissions
The Workers’ Compensation Board (WCB) of British Columbia helps create a working environment that protects the health, safety and well being of workers. To achieve this, the WCB administers the Occupational Health and Safety Regulation adopted under the authority of the Workers Compensation Act and the Workplace Act. For platform access and safety requirements related to the monitoring of stack emissions, all applicable WCB requirements should be adhered to. The following section is intended only to serve as guidance for setting up stack sampling platforms, access ladders and other associated works. The latest WCB requirements are to be used in all cases where the following guidelines are in conflict.
(a) Safe access to the sampling locations and a firm platform for obtaining
stack samples shall be provided. Access ladders shall be constructed in accordance with the latest Workers' Compensation
Board (W.C.B.) requirements. In addition, it is recommended that a "safety climb" with two sets of harnesses be provided.
The basic platform shall be 1.07 metres (3.5 feet) wide with a 1.07 metre (3.5 foot) high
railing. If 2 ports are required at 90°, the stack platform shall serve the quarter of the stack circumference between the ports and shall extend at least 0.91 metres (3 feet) beyond each port. The 1.22 metre (4 foot) section of the top railing in front of the ports (Fig. 1.1 and 2) shall be hinged in such a manner that the top rail can swing upward and over 180 degrees. This facilitates the movement of the sampling box and probe perpendicular to the stack during a traverse without interference from the top railing of the platform.
The sampling port shall consist of a standard 10 cm (4 inch) male-threaded pipe nipple
welded to the stack at the sampling location with a screw cap to cover the opening. The ports shall be installed flush with the interior stack wall and shall extend outward from the exterior stack wall at least 7.6 centimetres (3 inches). Properly grounded electric outlets of 110/120 volts (15-20 amps), near each sampling port, or, spaced in such a manner as to be accessible for sampling at all ports, shall be installed to provide power for the sampling train components and accessories. The sampling port shall be approximately 1.52 metres (5 feet) above

Stationary Air Emissions Testing
Field Sampling Manual, 2013
56
the base of the platform. An eyebolt shall be installed 0.91 metres (3 feet) directly above each port. The eyebolt should be hooked with a 3.2 millimetre (1/8 inch) steel cable of the length indicated in Fig. 3. This cable should be supplied by the platform owner and should remain on the stack for future testing.

Stationary Air Emissions Testing
Field Sampling Manual, 2013
57
Circular stacks with an inside diameter greater than 1.22 metres (4 feet) or rectangular stacks (Fig. 2) with the largest dimension greater than 1.22 metres (4 feet), shall be equipped with platform extensions as indicated in Fig. 3. The required extensions are in addition to the basic platform width of 1.07 metres (3.5 feet) and must be firmly secured. The 1.22 metre (4 foot) width of the extension shall be centered around the traverse axis. Schematic diagrams showing facilities for circular and rectangular stacks are shown in Figs. 1, 1.1 & 2 respectively.
Constant rate or gaseous sampling does not require the installation of multiple ports and
eyebolts. (b) Access to working platform (W.C.B. regulation 30.14 and American National Standards
Institute (A.N.S.I.) A143-3 1974); Adequacy of the working platform (A.N.S.I. A14-3 1974); Guardrail system around working platform (W.C.B. regulation 8.70 and 8.78); Transfer of equipment up to the working platform (W.C.B. regulation 30.16). (c) The W.C.B. permits the Regulatory Agency to specify platform widths greater than 76
cm (30 inches), if desirable or necessary; The stairs, ladder and platform must be certified by a Professional
Engineer; It is the responsibility of the stack owner to comply with Industrial
Health and Safety requirements concerning the access to the stack and the platform.
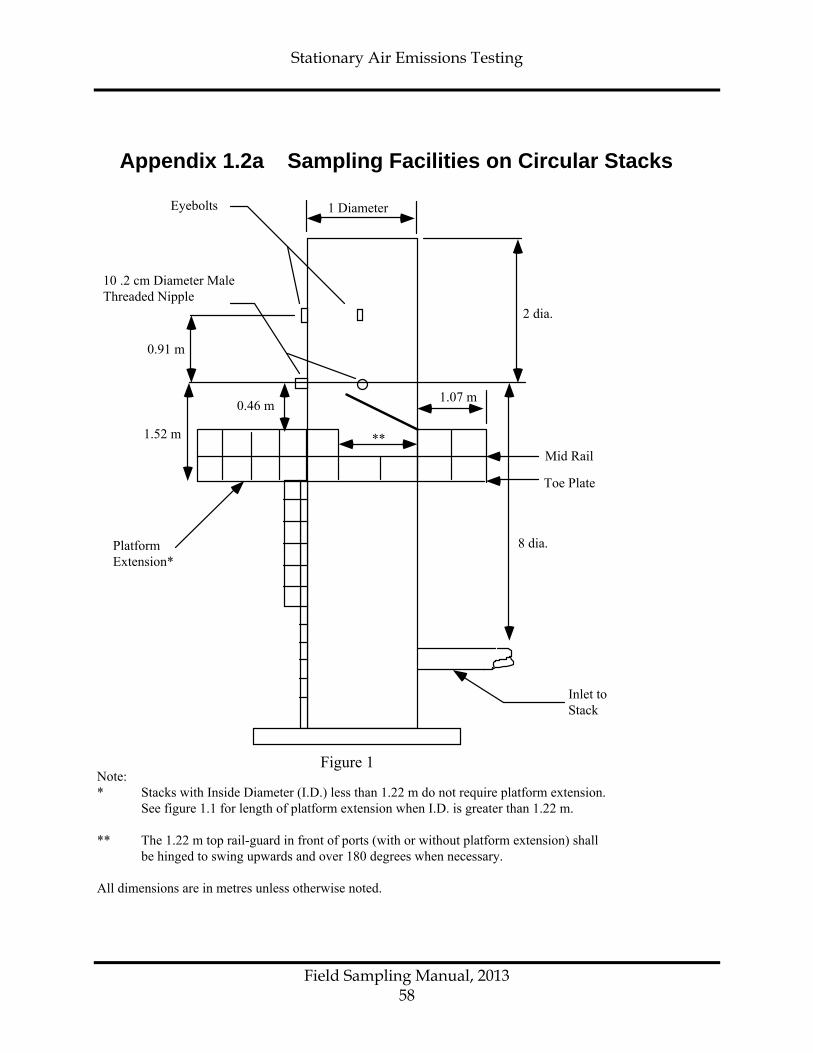
Stationary Air Emissions Testing
Field Sampling Manual, 2013
58
Appendix 1.2a Sampling Facilities on Circular Stacks
Eyebolts
10 .2 cm Diameter MaleThreaded Nipple
1 Diameter
2 dia.
1.07 m
0.91 m
1.52 m
0.46 m
Mid Rail
Toe Plate
8 dia.PlatformExtension*
**
Inlet toStack
Note:* Stacks with Inside Diameter (I.D.) less than 1.22 m do not require platform extension. See figure 1.1 for length of platform extension when I.D. is greater than 1.22 m.
** The 1.22 m top rail-guard in front of ports (with or without platform extension) shall be hinged to swing upwards and over 180 degrees when necessary.
All dimensions are in metres unless otherwise noted.
Figure 1

Stationary Air Emissions Testing
Field Sampling Manual, 2013
59
Appendix 1.2b Sampling Facilities on Circular Stacks
90o
1.07
1.22
Top rail to swingupwards and over 180o
Eyebolt
Port
Railing
Electric110/ 120(15 - 20 amps)
Schematic Diagram
Figure 1.1
All dimensions are in metres.

Stationary Air Emissions Testing
Field Sampling Manual, 2013
60
Appendix 1.3 Sampling Facilities on Rectangular Stacks
B
0.91 m
1.52 m
D
2D
PlatformExtension**
Top rail to swingupwards and over180o
Toe Plate
8D
Eyebolts (oneeyebolt on topof each port)
Port 10cmdiameter malethreaded nipple*
Electrical Outlet110/120 volts(15 - 20 amps)
Figure 2Note:* The number of ports required is described in the text.
** Stacks with I.D. less than 1.22 metres do not require platform extension. However, top rail in front of the ports, shall be hinged to swing upwards and over when necessary.
All dimensions are in metres, unless otherwise noted.

Stationary Air Emissions Testing
Field Sampling Manual, 2013
61
Appendix 1.4 Dimensions of a Stack Sampling Platform
CEYEBOLT
B A D
StainlessSteelCable
D A B CDIAMETER OR LARGESTDIMENSION OF A STACK
(m) (m)(m)(m)
BASE PLATFORMWIDTH
PLATFORMEXTENSION
LENGTH OFSTEEL CABLE
< 1.22
1.22 < D < 1.83
1.83 < D < 2.44
> 2.44
1.07
1.07
1.07
1.07
0
0.46
0.76
1.07
2.44
3.96
3.96
3.96
Figure 3

Stationary Air Emissions Testing
Field Sampling Manual, 2013
62
Appendix 2 Cyclonic Flow Check & Pitot Leak Check Procedure
Cyclonic Flow Location of a suitable sampling site for velocity measurement or for particulate and mist
determinations requires that the gas flow be essentially parallel to the stack walls.
If there is a possibility of cyclonic flow [as determined in Section 6.2 (a)], checks with a
pitot tube and draft gauge should be made as follows:
Pitot Leak-Check Connect calibrated S-type pitot tube to a manometer. Leak check the system by drawing a vacuum of two to four inches of water on the
manometer. The manometer reading should not change over a 15 second period.
Repeat this procedure applying a positive pressure to the system. If the system leaks, correct the problem and repeat the leak check procedure.
Cyclonic Flow Check Carefully zero the manometer and insert the pitot tube so that the planes of the face
openings are perpendicular to the stack area cross sectional plane - that is, parallel to the expected gas flow. The pitot tube is thus rotated 90° from its usual position.
Traverse the stack area by measuring the velocity head at each sampling point with the
pitot tube in this position. Keep the sampling port opening sealed while traversing. Temperature need not be measured at this time.
When the gas flow is exactly parallel to the stack walls and, therefore, parallel to the pitot
tube face openings, no reading will be obtained on the manometer. If a reading is obtained, rotate the pitot tube around its longitudinal axis until a zero reading is indicated on the manometer.
Record the angle of rotation for each point (starting with 0° in the pitot tubes initial
position) required to obtain a zero manometer reading.

Stationary Air Emissions Testing
Field Sampling Manual, 2013
63
Obtain an arithmetic average of the angles of rotation at each traverse point, including angles of 0°. If the average angle of rotation is < 20°, the gas flow conditions are acceptable. If the average angle is > 20°, the conditions are not acceptable; testing must be halted and the Regulatory Administrator is to be consulted.
To facilitate measurement of pitot tube rotation, a number of devices can be made,
depending on the user. Fabrication of a protractor that will fit over the sampling port along with a movable indicating arm clamped to the pitot tube will provide a measurement of the angle of rotation. A level indicator (available at most hardware stores) calibrated in 5° increments can also be mounted on the pitot tube and used to measure rotation.
The preferred device is a degree level (available at most hardware stores) with 1°
increments which can be mounted on the end of a pitot tube. Its alignment with the head of the pitot tube can be checked by one of two methods:
the use of two indicating levels, one at the front and one at the end or, by placing the pitot on a stable surface then place the indicating level at the front and then
at the end and compare readings. The readings do not have to be the same. The differential, using the front as the reference, or true value can be subtracted or added to the corresponding angular determinations of stack flow.

Stationary Air Emissions Testing
Field Sampling Manual, 2013
64
Appendix 3 High Volume Particulate Sampling
Appendix 3.1 Sample Collection Procedures Appendix 3.2 Sample Recovery Appendix 3.3 Analytical Procedure

Stationary Air Emissions Testing
Field Sampling Manual, 2013
65
Appendix 3.1 Sample Collection Procedure Use a pitot tube to map the velocity distribution across the face of the exhaust. Areas of
zero or negative flow should also be included if present. At each point at which the velocity is measured, measure the flow in the direction giving maximum deflection of the pitot pressure gauge.
Select six or more points of out going (positive) flow from the points measured above to
sample. The points shall be representative of the flow pattern and should include the point of maximum velocity. If six points of positive flow cannot be obtained, use the maximum number possible. Do not choose any points closer than 5 cm (2 inches) from the wall.
Measure the average exhaust temperature. Determine the nozzle size required for isokinetic sampling. An estimate of the orifice
temperature is required. For low temperature exhausts the orifice temperature is usually very close to the exhaust temperature. For higher temperature exhausts, a trial run may be necessary to determine the expected orifice temperature.
Calculate the required orifice pressure drop for each chosen sampling point to obtain an
isokinetic sample. Mount the nozzle so that the nozzle opening is parallel to the cyclone or stack exhaust. This will keep the differential pressure gauge properly positioned to read as it was designed to. With the probe out of the stream, turn on the blower and adjust the flow rate to that calculated for the first sampling point. Locate the probe nozzle at the first sampling point and immediately start the timer. Move the probe around until the velocity pressure matches that calculated for the flow rate which was pre-set. The sample rate may need to be adjusted after entering the gas stream. The probe nozzle must be pointing directly into the flow.
Continually monitor the velocity during the sampling period (with the pitot tube mounted
to the probe) and move the probe around as required to keep it in an area where the velocity matches the original velocity used to calculate the pre-set sampling rate. Record the sampling time, the orifice temperature and pressure drop on the data sheet.
A survey shall consist of three tests. The minimum sample time per test shall be 15
minutes with a minimum sampling time per point of 3 minutes.

Stationary Air Emissions Testing
Field Sampling Manual, 2013
66
Repeat the above steps for each sampling point. The blower need not be turned off between points if readjustment to the new sampling rate can be made rapidly.

Stationary Air Emissions Testing
Field Sampling Manual, 2013
67
Care should be taken so that the nozzle does not touch the walls of the exhaust stack as deposited particulate may be dislodged and enter the train. If there is reason to believe this happened, discontinue the sample, clean the train and restart the test.
If excessive loading of the filter should occur or the pressure drop should increase such
that isokinetic conditions cannot be maintained, replace the filter and continue the test.
At the conclusion of the sampling period, remove the probe from the exhaust and turn off
the blower (do not reverse this order as the filter may be broken and the sample lost). Plug the nozzle to prevent sample loss and transport the sample to the recovery area.
Measure the moisture content of the stack gas and the barometric pressure (absolute).
The moisture may usually be measured by the wet-dry bulb technique.
Appendix 3.2 Sample Recovery The probe and nozzle should be brushed with the blower turned on to suck the particulate
onto the filter. After filter removal and storage, the nozzle, probe and front half of the filter holder must
be rinsed with acetone or methanol and brushed until all visible particulate is removed.
Appendix 3.3 Analytical Procedure
The filter must be weighed immediately upon removal from the dessicator because of the relatively large filter and the possibility of a hygroscopic filter catch.

Stationary Air Emissions Testing
Field Sampling Manual, 2013
68
Appendix 4 Sample Train Leak Check Procedures Leak checks are necessary to assure that the sample has not been biased (low) by dilution
air. The method specifies that leak checks be performed at certain intervals as discussed below:
Pre-test - A pre-test leak check should be conducted by plugging the nozzle inlet and
pulling a vacuum at 380 mm Hg (15 inches Hg) for at least one minute. The leakage rate must be less than 0.57 L/min. (0.02 ft3/min.) or 4% of the estimate average sampling rate, whichever is less. Sampling cannot proceed until the leakage rate is acceptable.
During Sampling - If a component (e.g., filter assembly or impinger) change is made
(including problems due to breakages or cracks) during the sample run, a leak check shall be conducted before the component change. The leak check shall be performed at a vacuum equal to the maximum vacuum reached up until that point in the test. If this test has a leakage rate above the accepted maximum of 0.57 L/min. (0.02 ft3/min.) the sampling shall be considered invalid, and redone. After the component change the pre-test shall be repeated.
Post-test - A leak check is mandatory at the conclusion of each sample run. The leak check should be conducted at 380 mm (15 in.) Hg. If the leak check fails at 380 mm (15 in.), then the test may be repeated at the maximum vacuum reached during any point in the test run. The maximum allowable leakage rate is 0.57 L/min. (0.02 ft3/min.) or 4% of the average sample rate, whichever is less. A correction factor may be applied if the leakage is in excess of the acceptable limits. However, approval for acceptance must be granted by the Regulatory Administrator and each case will be assessed individually.

Stationary Air Emissions Testing
Field Sampling Manual, 2013
69
Appendix 5 Sampling Under Adverse Conditions It is essential that a sample be representative of the source from which it was taken.
Various conditions may affect this criterion. The following are some ways which these adverse conditions may be overcome:
Corrosive or highly reactive components - The use of special materials such as Inconel,
glass, quartz or Teflon. High vacuum sources - (found before exhaust fans and high natural draft stacks) -
Operation of the sampling train pump before and after probe insertion to avoid the escape of impinger solution into the filter holder; gas drawn before and after should not be included in the sample volume.
High pressure sources - Port sealed tightly yet allow for freedom of movement of the
probe; for example, a gas valve and packing gland could be incorporated in the port.
High temperature source (> 600°C or 1100°F) - Quartz or Inconel probe liner or water
cooled probe with temperature control to avoid cooling below dew point; shielded thermocouple.
High moisture content source - Probe temperature maintained above the dew point;
probe sheathed with insulation layer within an outer layer to prevent droplets from impinging on the actual probe, creating a cooling effect via evaporation; for Method 5 locate a filter between the third and fourth impinger (as specified in the method).
High velocity source - Relocate sampling site or expand duct or stack to reduce the
velocity; pumps of sufficient capacity to maintain the required sampling rates can be used.
• Low velocity source - Sources with a velocity in the range of 1.5-3.0 m/s (5-10 ft/s)
should be measured using an inclined manometer with a scale of 0 to 0.6 kPa (0-2.4 in. H2O). Sources with velocities below 1.5 m/s (5 ft/s) should have the sampling site relocated or the duct constricted to increase the velocity.

Stationary Air Emissions Testing
Field Sampling Manual, 2013
70
Appendix 6 Calibration Forms Appendix 6.1 General Calibration Form Appendix 6.2 Orifice Meter Calibration Form Appendix 6.3 Nozzle Diameter Calibration Form Appendix 6.4 Temperature Calibration Form Appendix 6.5 S-Type Pitot Calibration Form Appendix 6.6 Magnehelic Calibration Form Appendix 6.7 Dry Gas Meter Calibration Form

Stationary Air Emissions Testing
Field Sampling Manual, 2013
71
Appendix 6.1 General Calibration Form
Equipment Date Of Calibration Place Of Calibration Method S - Type Pitot Orifice Meter Temperature Device Rotameter Nozzle Diameter Dry Gas Meter Magnehelic Gauge

Stationary Air Emissions Testing
Field Sampling Manual, 2013
72
Appendix 6.2 Orifice Meter Calibration Form Technician :
Date : Signature :
Console I.D. : Parameter Summary Run No. 1 Run No. 2 Run No. 3 Run No. 4 Run No. 5 Md = mol. wet dry air Pb = atmospheric press. Y = dry gas meter calibration ΔH = press. diff.@ orifice Ri = initial dry gas vol. Rf = final dry gas vol. Δt = measured interval (min.) Qm = Y (Rf - Ri)/ Δt To = dry gas outlet temp. Tm = To + 273 or 460 Pm = Pb + ΔH/13.6 Ko = Qm/(Tm/Pm•ΔH/Md)1/2 Average Ko

Stationary Air Emissions Testing
Field Sampling Manual, 2013
73
Appendix 6.3 Nozzle Diameter Calibration Form Technician: Date : Signature: Nozzle I.D. Nozzle Diameter (a) Δ Diameter Average D1 D2 D3 (b) Diameter (c) Where: (a) D1, D2, D3 = three different nozzle diameters; each diameter must be measured with
a micrometer to within 0.25 mm (0.001 in.) (b) ΔDiameter = maximum difference between any two diameters, must be less than or
equal to 1.0 mm (0.004 in.) (c) Average Diameter = average of D1, D2 and D3

Stationary Air Emissions Testing
Field Sampling Manual, 2013
74
Appendix 6.4 Temperature Calibration Form Technician : Date : Signature : Barometric Pressure : Land Elevation: Type of Device and
I.D.:
Calibration Mercury In Glass Thermometer Temp. Temperature Device
Medium Actual Reading Corrected Reading ICE BATH BOILING WATER HOT OIL
Note: Temperature Device must read within 1.5% of certified mercury in glass thermometer to be acceptable.
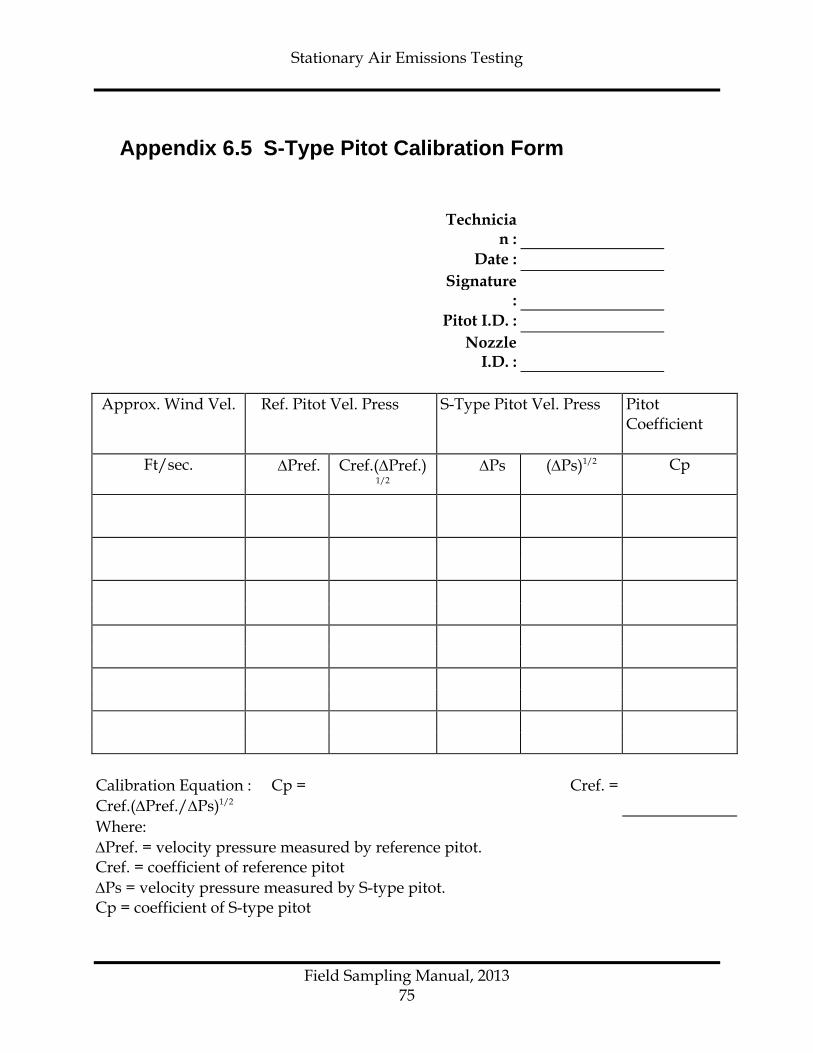
Stationary Air Emissions Testing
Field Sampling Manual, 2013
75
Appendix 6.5 S-Type Pitot Calibration Form Technicia
n :
Date : Signature
:
Pitot I.D. : Nozzle
I.D. :
Approx. Wind Vel. Ref. Pitot Vel. Press
S-Type Pitot Vel. Press
Pitot Coefficient
Ft/sec. ΔPref. Cref.(ΔPref.)
1/2 ΔPs (ΔPs)1/2 Cp
Calibration Equation : Cp = Cref.(ΔPref./ΔPs)1/2
Cref. =
Where: ΔPref. = velocity pressure measured by reference pitot. Cref. = coefficient of reference pitot ΔPs = velocity pressure measured by S-type pitot. Cp = coefficient of S-type pitot

Stationary Air Emissions Testing
Field Sampling Manual, 2013
76
Appendix 6.6 Magnehelic Calibration Form Technician
:
Date : Signature : Gauge I.D. : Scale : Manometer ΔP1 Magnehelic ΔP2 % Pressure Difference Average Percent Pressure Difference =(ΔP1 -ΔP2)/ΔP1 • 100 The magnehelic gauge must read within 5% of the gauge oil manometer (over its usable range) or the calibration and/or magnehelic gauge is not acceptable.

Stationary Air Emissions Testing
Field Sampling Manual, 2013
77
Appendix 6.7 Dry Gas Meter Calibration Form Technician
:
Date : Signature : Console
I.D.:
Parameter Summary Run No. 1 Run No. 2 Run No. 3
Ta = ambient (wet test meter) temp.
ΔP = press. diff. @ wet test meter
Pb = atmospheric pressure
Pv = vapour pressure
ΔH = press. diff.@ orifice
Ti = dry test inlet temp.
To = dry test outlet temp.
Ri = initial dry test vol.
Rf = final dry test vol.
Vi = initial wet test vol.
Vf = final wet test vol.
Pw = Pb + ΔP
Pd = Pb + ΔH
Tw = Ta + 273 or 460
Td = [(Ti + To)/2] + 273 or 460
Bw = Pv/Pb
Calibration Equation Result (Y)
Average (Y)
Calibration Equation : Y = [(Vf - Vi)/(Rf - Ri)] [(Pw/Pd)(Td/Tw)](1- Bw) The calibration factor must be within 2% (0.98-1.02) of the wet test meter or
Stationary Air Emissions Testing
Field Sampling Manual, 2013
78
spirometer reading for the meter to be acceptable.
Appendix 7 Regulatory Agency Approved Test Methods
Appendix 7.1 Parameters and Approved Methods Appendix 7.2 Method Sources

Stationary Air Emissions Testing
Field Sampling Manual, 2013
79
Appendix 7.1 Parameters and Approved Methods Parameter Method Notes Ammonia EPA CTM 27 Arsenic EPA 108 Benzene, Toluene, Ethyl benzene, Xylenes (BTEX)
EPA 18
Beryllium EPA 104 Carbon Dioxide (CO2) see Gas composition and molecular
weight listing
Carbon Monoxide (CO) EC c, EPA 10, EPA 10a, EPA 10b Chloride (Total) EPA 26 Chlorine and Chlorine Dioxide (Cl/ClO2) EPA 40CFR63.457 Combined Trains (Multi-metals including mercury)
EPA 29
Combined Trains (particulate/metals/gaseous hydrogen chloride (HCL))
EC f
Continuous Emission Monitoring (certification/QA/QC)
EC d, EPA PS-1 to PS-7
Fluoride Alcan 3010, EPA 13a, EPA 13b Alcan 3010 only applies to aluminium production facilities
Formaldehyde (HCOH) NCASI a, SW 0011 NCASI only applies to wood products facilities, use SW 0011 for all other facilities
Gas composition and molecular weight (Orsat or fyrite)
EPA 3
Gas composition and molecular weight (CO2, O2 instrumental)
EPA 3a

Stationary Air Emissions Testing
Field Sampling Manual, 2013
80
Parameter Method Notes Gas composition and molecular weight (CO2, O2 Orsat)
EPA 3b
Hexavalent Chromium EPA ALT 014, IC 306 Hydrogen Chloride (HCl) Halides and Halogens
EPA 26, EPA 26a EPA 26a is to be used when acid particulate matter is present in the emission
Hydrogen Sulphide (H2S) EPA 11, EPA 15 EPA 15 also includes Carbonyl Sulphide (COS) and Carbon Disulphide (CS2)
Lead (Pb) EPA 12 Mercury EPA 101a Metals (Ag, As, Cd, Cu, Mn, Ni, Pb, Sn, Tl, Zn)
EPA 29
Moisture Content EPA 4 Nitrogen Oxides (NOx) EPA 7, EPA 7a, EPA 7c, EPA 7d,
EPA 7e, EPA 20
Opacity EPA 9, EPA 9 alternative 1, MELP a, EPA 203
EPA 9 is the observation method; EPA 9 alternative 1 is the lidar method. EPA 203 is a proposed continuous method.
Organics (Total gaseous non-methane as carbon, grab)
EPA 25
Organics (Total gaseous hydrocarbons as methane, continuous)
EPA 25a To be used for testing asphalt plants
Organics (Speciation of hydrocarbons, grab)
EPA 18
Organics (polychlorinated biphenyls (PCBs) and other semi volatile organic compounds)
EC a

Stationary Air Emissions Testing
Field Sampling Manual, 2013
81
Parameter Method Notes Organics (boiling point ≥ 100oC, semi-volatile organics (Semi-Vost), polychlorinated dibenzo-para-dioxins (PCDDs), and polychlorinated dibenzofurans (PCDFs))
EC a, EPA 23
Organics (boiling point ≤ 100oC, volatile organics (VOST))
SW 0030
Oxidants (ozone) IC 411 With adjustments to impinger volumes* Oxygen (O2) See Gas composition and molecular
weight listing
Particulates EC e, EPA 5, EPA 5d, EPA 5f Particulates (Cyclonic flow) Appendix 12 Appendix 12 is contained within this chapter of
the B.C. Field Sampling Manual Particulates (High volume) EPA CTM 003, Oregon 8 ** Particulates (In-stack) EPA 17 Particulates (Sizing) EPA 201a Particulates (PM10) EPA 201, EPA 201a Particulates (and condensable organics) EPA 202, Oregon 7 Sampling site and traverse points EC e, EPA 1 Sampling site and traverse points (Stacks/ducts 4-12” diameter)
EPA 1a
Sulphur EPA 16 Sulphuric acid mist and sulphur dioxide (SO2)
EPA 8
Sulphur dioxide (SO2) EPA 6, EPA 6a, EPA 6c

Stationary Air Emissions Testing
Field Sampling Manual, 2013
82
Parameter Method Notes Total Reduced Sulphur (TRS) compounds Appendix 11, EPA 15a, EPA16, EPA
16a, EPA 16b Appendix 11 is under review, a revised method is anticipated for the next revision of this manual. .
Validation Protocol EPA 301 For new methods or the expansion of applicability for existing methods **
Velocity and volumetric flow rate (Stacks/ducts > 12” diameter)
EC e, EPA 2
Velocity and volumetric flow rate (Direct measurement)
EPA 2a, EPA 2d
Velocity and volumetric flow rate (3-D probe)
EPA CTM 019
Vinyl chloride EPA 106 Volatile organic compounds (VOCs) see Organics listing For the test methods followed by an asterisk (*) impingers must be analyzed and reported individually to prove that sample breakthrough has not occurred. Test methods followed by a double asterisk (**) require prior written approval. Testing of any parameters not listed or the altering of any methods listed above requires the approval of the Regulatory Administrator. A minimum of 30 days advance notice by a written request along with the supporting documentation for the Regulatory Administrator’s evaluation is required to determine the acceptability or rejection of such proposals. The Regulatory Administrator’s written approval is required before non-listed or altered method testing is to proceed.

Stationary Air Emissions Testing
Field Sampling Manual, 2013
83
Appendix 7.2 Method Sources
Alcan ALCAN METHODS
a. Method 3010-98 Sampling of the Cell Room Roof Vents at the A.S. & C. Aluminum Smelters in Quebec. Measurement of Total Particulates and Total Fluorides (Particulates and Gaseous) Revision: June 1998.
Listed in Appendix 7.1 as “Alcan” followed by the letter “a”. Alcan test methods can be obtained from Alcan International Limitée, Centre de recherche et de développement, Arvida - Madame Pâquerette Leclerc, 1955, boul. Mellon, C.P. 1250, Janquière Québec, G7S 4K8
EC ENVIRONMENT CANADA-ENVIRONMENTAL PROTECTION
SERVICE TEST METHODS
a. Reference Method for Source Testing: "Measurement of Releases of Selected Semi-Volatile Organic Compounds from Stationary Sources" EPS 1/RM/2, June 1989
b. Reference Method for Source Testing: "Measurement of Releases of Gaseous
Hydrogen Chloride from Stationary Sources" EPS 1/RM/1, June 1989 c. Reference Method for Source Testing: "Measurement of Releases of Carbon
Monoxide from Stationary Sources" EPS 1/RM/4, July 1990 d. Report: "Protocols and Performance Specifications for Continuous
Monitoring of Gaseous Emissions from Thermal Power Generation" EPS 1/PG/7, September 1993.
e. Reference Method for Source Testing: "Measurement of Releases of
Particulate from Stationary Sources" EPS 1/RM/8, December 1993 f. Report: "The National Incinerator Testing and Evaluation Program: Air
Pollution Control Technology" EPS 3/UP/2, September 1986 Listed in Appendix 7.1 as “EC” followed by a letter from a to f to match the above listing.

Stationary Air Emissions Testing
Field Sampling Manual, 2013
84
EC test methods can be ordered through Environment Canada at: Environmental Protection Publications, Technology Development Branch, Conservation and Protection, Environment Canada, Ottawa, Ontario, K1A 0H3
EPA UNITED STATES ENVIRONMENTAL PROTECTION AGENCY - CODE
OF FEDERAL REGULATIONS 40 Parts 60 and 61 -TEST METHODS
Listed in Appendix 7.1 as “EPA” followed by the appropriate method number, or for conditional test methods “EPA CTM” followed by the method number. Most EPA test methods can be found at the United States Environmental Protection Agency Technology Transfer Network (TTN) Website at http://www.epa.gov/ttn/emc/ Methods listed as “EPA 40CFR” are contained in the United States National Archives and Records Administration, Code of Federal Regulations. For downloading see http://www.access.gpo.gov/nara/about-cfr.html#page1
IC INTERSOCIETY COMMITTEE - APCA, ACS, AICHE, APWA, ASCE, ASME, AOAC, HPS, IPA - TEST METHODS
Listed in Appendix 7.1 as “IC” followed by the appropriate method number IC test methods are listed in a publication entitled “Methods of Air Sampling and Analysis,” Third Edition, James P. Lodge, Jr., Editor, Intersociety Committee APCA, ACS, AIChE, APWA, ASME, AOAC, HPS, ISA, Lewis Publishers, Inc, 1989.
MELP BRITISH COLUMBIA MINISTRY OF ENVIRONMENT LANDS AND
PARKS
Source Testing Code For the Visual Measurement of The Opacity of Emissions From Stationary Sources. Listed in Appendix 7.1 as “MELP” followed by the letter “a” Can be found at http://www.env.gov.bc.ca/epd/cpr/codes/stcvmoe.html
NCASI National Council for Air and Stream Improvement
Chilled Impinger Method for use at Wood Products Mills to Measure Formaldehyde Methanol, and Phenol. Listed in Appendix 7.1 as “IC” followed by the letter “a”.

Stationary Air Emissions Testing
Field Sampling Manual, 2013
85
NCASI test methods can be obtained from the National Council of the Paper Industry for Air and Stream Improvement (NCASI), Inc., P.O. Box 13318, Research Triangle Park, NC 27709-3318, (919) 558-1999. For general NCASI information see http://www.ncasi.org/
Oregon STATE OF OREGON - DEPARTMENT OF ENVIRONMENTAL
QUALITY AIR QUALITY DIVISION – SOURCE SAMPLING MANUAL VOLUME 1
Listed in Appendix 7.1 as “Oregon” followed by the appropriate method number. Oregon test methods can be obtained from the Source Testing Co-ordinator, Department of Environmental Quality, 2020 Southwest 4th Ave, Suite 400, Portland, OR 97201, Tel: (503) 229-5554, Fax (503) 229-5265. Further information is available on the web at: http://www.deq.state.or.us/
SW U.S. EPA TEST METHODS FOR EVALUATING SOLID WASTE
Volume IC: Laboratory Manual Physical/Chemical Methods, Publication SW-846 Listed in Appendix 7.1 as “SW” followed by the appropriate method number. SW test methods can be obtained from the National Technical Information Service (NTIS), Technology Administration, U.S. Department of Commerce, Springfield, VA 22161, Tel: (703) 605-6000 or 1-800-553-6847, Fax: (703) 605-6900. Further information is available at http://www.ntis.gov/

Stationary Air Emissions Testing
Field Sampling Manual, 2013
86
Appendix 8 Continuous Emission Monitoring (Non-Permanent In-Stack) Reporting Forms
Appendix 8.1 Analysis of Calibration Gases Appendix 8.2 Analyzer Calibration Data

Stationary Air Emissions Testing
Field Sampling Manual, 2013
87
Appendix 8.1 Analysis of Calibration Gases
Analytical method used:_________________________
Date:_______________________
Gas Concentration (indicate units) Sample Run Zero* Mid-range** High-range***
1 2 3
Average
Maximum Percent Deviation * Average must be less than 0.25 % of span ** Average must be 50 to 60 % of span *** Average must be 80 to 90 % of span

Stationary Air Emissions Testing
Field Sampling Manual, 2013
88
Appendix 8.2 Analyzer Calibration Data Source Identification:____________________
Analyzer Calibration Data for Sampling:________________________
Test Personnel:_________________________
Runs:______________________________________________
Date:_____________________________
Span:______________________________________________
Cylinder Value Analyzer Calibration Absolute Difference Difference (Indicate Units) Response (Indicate Units) (Indicate Units) (Percent of Span)
Zero gas
Mid-range
High-range

Stationary Air Emissions Testing
Field Sampling Manual, 2013
89
Appendix 9 Compliance Testing Report Requirements Appendix 9.1 Source Emission Survey Report Format Appendix 9.2 Compliance Testing Report Summary Table Appendix 9.3 System Calibration Bias and Drift Check

Stationary Air Emissions Testing
Field Sampling Manual, 2013
90
Appendix 9.1 Source Emission Survey Report Format Stack emission survey reports should contain the information listed below unless
mutually acceptable arrangements regarding the report content have been made between the facility and the Regulatory Administrator.
1. Title Page The title page shall contain: (a) plant name, (b) plant location, (c) permit, approval or registration number, (d) date of survey, (e) name of the sampling firm, and (f) report author(s). 2. Summary The summary of the source emission survey shall include but not be
limited to: A compliance testing report summary, which lists the parameters, described in Appendix
9.2. An indication of how the source emission survey compares with applicable emission
limits and previous emission testing shall be provided. 3. Table of Contents A table of contents listing the report sections and the appendices shall
be provided. 4. Introduction The introduction shall include, but not be limited to, information on: the reason for the survey, the name(s) and contact telephone number(s) of the team member(s) which have taken
relevant stack sampling courses, a list of stack sampling, and plant personnel present during testing with contact telephone
numbers, the name of the company which prepared the analytical results, and a list of analytical personnel and contact telephone numbers. General comments on: how the plant was operating, process data (relevant to the operation of the source of emissions and to the performance
of pollution abatement equipment), and presence of dust/flyash on and around the plant, or other pertinent observations (such as

Stationary Air Emissions Testing
Field Sampling Manual, 2013
91
opacity).
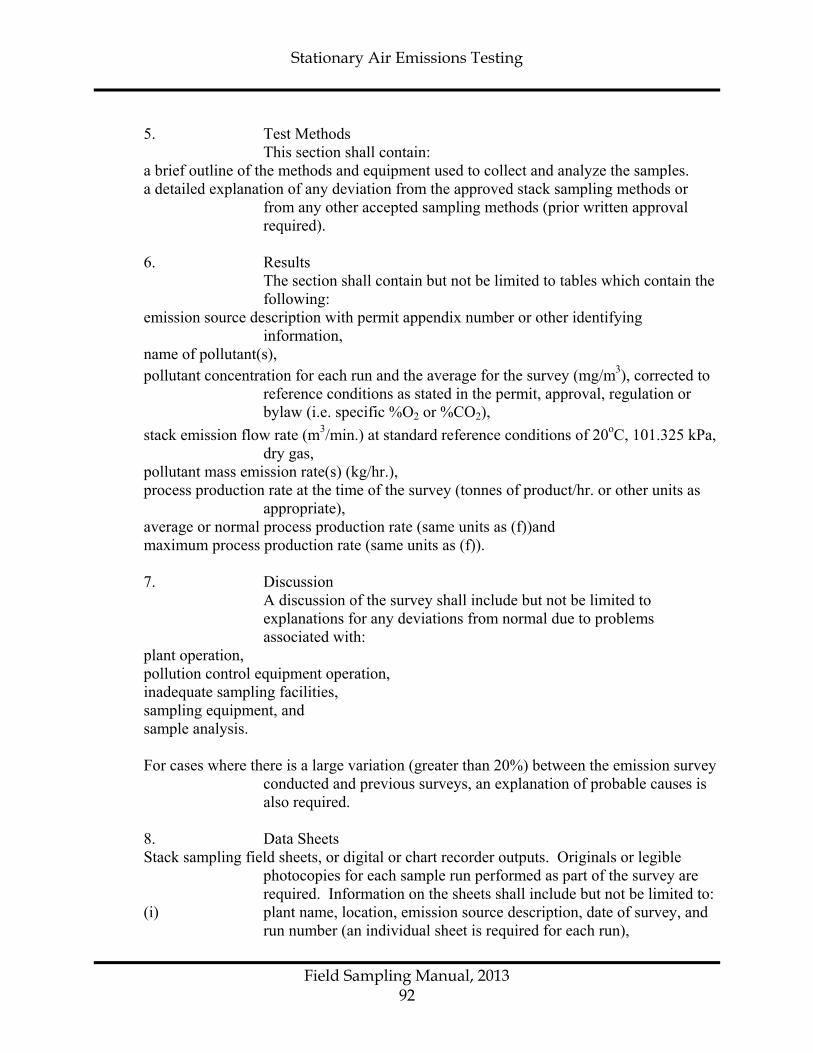
Stationary Air Emissions Testing
Field Sampling Manual, 2013
92
5. Test Methods This section shall contain: a brief outline of the methods and equipment used to collect and analyze the samples. a detailed explanation of any deviation from the approved stack sampling methods or
from any other accepted sampling methods (prior written approval required).
6. Results The section shall contain but not be limited to tables which contain the
following: emission source description with permit appendix number or other identifying
information, name of pollutant(s), pollutant concentration for each run and the average for the survey (mg/m3), corrected to
reference conditions as stated in the permit, approval, regulation or bylaw (i.e. specific %O2 or %CO2),
stack emission flow rate (m3/min.) at standard reference conditions of 20oC, 101.325 kPa, dry gas,
pollutant mass emission rate(s) (kg/hr.), process production rate at the time of the survey (tonnes of product/hr. or other units as
appropriate), average or normal process production rate (same units as (f))and maximum process production rate (same units as (f)). 7. Discussion A discussion of the survey shall include but not be limited to
explanations for any deviations from normal due to problems associated with:
plant operation, pollution control equipment operation, inadequate sampling facilities, sampling equipment, and sample analysis. For cases where there is a large variation (greater than 20%) between the emission survey
conducted and previous surveys, an explanation of probable causes is also required.
8. Data Sheets Stack sampling field sheets, or digital or chart recorder outputs. Originals or legible
photocopies for each sample run performed as part of the survey are required. Information on the sheets shall include but not be limited to:
(i) plant name, location, emission source description, date of survey, and run number (an individual sheet is required for each run),

Stationary Air Emissions Testing
Field Sampling Manual, 2013
93
(ii) relevant constant parameters for equipment as noted in the sampling method being performed and as stated in this code,

Stationary Air Emissions Testing
Field Sampling Manual, 2013
94
(iii) tabulated results that pertain to individual traverse points, grab samples or the specific survey which was performed, or digital or chart recorder outputs (with appropriate labeling).
iv) sample recovery procedures used, if applicable. v) example calculations as appropriate. Laboratory certificates of analysis, if applicable. System calibration bias and drift check, described in Appendix 9.3 if applicable. 9. Appendices Stack sampling site diagram (with stack dimensions and measured locations of traverse
points), Cyclonic flow check, Completed instrument calibration forms for equipment used during the survey. Detailed sampling system description and schematic diagram. Certificate of completion for relevant stack sampling course.

Stationary Air Emissions Testing
Field Sampling Manual, 2013
95
Appendix 9.2 Compliance Testing Report Summary Table Permit #(if applicable) Compliance: Yes ___ No ___ (attach explanations) Facility Name: Report Complete: Yes ___ No ___ (attach explanations) Location (Legal Address) Reason for test: Test Date: ________ 19___ to _______ 19___ Test methods used: Parameters Part ___ CO ___ SO2 ____ NOX ___ NO2 ___ Process operation: measured: Other: ____ ____ ____ ____ ____ Production rate during test: Normal Production rate: Fuel consumption rate: Type of fuel: Pollution control equipment operating conditions: Test Results:
Emission Source and # Parameter Run #1 Run #2 Run #3 Average Permit Limit
For Regulatory office use only I hereby state that the test results are accurate and the test(s) were conducted in
accordance with the procedures stated in the methods used. - Reviewed By : - Date :
_______________________________ ________________ signature date

Stationary Air Emissions Testing
Field Sampling Manual, 2013
96
Appendix 9.3 System Calibration Bias and Drift Check Source Identification:___________________________________ Run Number:_____________________ Test Personnel:___________________________________ Span:________________________ Date:___________________________________
Analyzer Initial Values Final Values Drift Calibration System System Cal. System System Cal. (% of Span) Response Calibration Bias Calibration Bias Response (% of Span) Response (% of Span)
Zero gas
Upscale gas (a) (a) As stated in the method being followed.

Stationary Air Emissions Testing
Field Sampling Manual, 2013
97
Appendix 10 Psychrometric Charts and Vapour Pressure Tables
Appendix 10.1 Vapour Pressures of Water in Millimeters of Mercury Appendix 10.2 High Temperature Psychrometric Chart for Air-Water Vapour
Mixtures at 101.3 kPa

Stationary Air Emissions Testing
Field Sampling Manual, 2013
98
Appendix 10.1 Vapour Pressures of Water in Millimeters of Mercury Temp. (°C) 0 1 2 3 4 5 6 7 8 9
0 4.58 4.93 5.29 5.69 6.10 6.54 7.01 7.51 8.05 8.61 10 9.21 9.84 10.52 11.23 11.99 12.79 13.63 14.53 15.48 16.48 20 17.54 18.65 19.83 21.07 22.38 23.76 25.21 26.74 28.35 30.04 30 31.82 33.70 35.66 37.73 39.90 42.18 44.56 47.07 49.69 52.44 40 55.32 58.34 61.50 64.80 68.26 71.88 75.65 79.60 83.71 88.02 50 92.51 97.20 102.09 107.20 112.51 118.04 123.80 129.82 136.08 142.60 60 149.50 156.43 163.77 171.38 179.31 187.54 196.09 204.96 214.17 223.73 70 233.70 243.90 254.60 265.70 277.20 289.10 301.40 314.10 327.30 341.00 80 355.10 369.70 384.90 400.60 416.80 433.60 450.90 468.70 487.70 506.10 90 525.76 546.05 566.99 588.60 610.90 633.90 657.62 682.07 707.27 733.24
100 760.00 787.57 815.86 845.12 875.06 906.07 937.92 970.60 1004.42 1038.92 110 1074.56 1111.20 1148.74 1187.42 1227.25 1267.98 1309.94 1352.95 1397.18 1442.63 120 1489.14 1536.80 1586.04 1636.36 1687.81 1740.93 1795.12 1850.83 1907.83 1966.35 130 2026.16 2087.42 2150.42 2214.64 2280.76 2347.26 2416.34 2488.16 2560.67 2634.84 140 2710.92 2788.44 2867.48 2948.80 3031.64 3116.76 3203.40 3292.32 3382.76 3476.24 150 3570.48 3667.00 3766.56 3866.88 3970.24 4073.88 4183.80 4293.24 4404.96 4519.72 160 4636.00 4755.32 4876.92 5000.04 5126.96 5256.16 5388.88 5521.40 5658.20 5798.04 170 5940.92 6085.32 6233.52 6383.24 6538.28 6694.08 6852.92 7015.56 7180.48 7349.20 180 7520.20 7694.24 7872.08 8052.96 8236.88 8423.84 8616.12 8809.92 9007.52 9208.16 190 9413.36 9620.08 9831.36 10047.20 10265.32 10488.76 10715.24 10944.76 11179.60 11417.48 200 11659.16

Stationary Air Emissions Testing
Field Sampling Manual, 2013
99
Appendix 10.2 High Temperature Psychrometric Chart for Air-Water Vapour Mixtures at 101.3 kPa
WATER VAPOUR % BY VOLUME
DR
Y B
ULB
TEMPER
ATU
RE, 0C
WET BULB TEMPERATURE, 0C
2030
4050
6070
8090
0 10 20 30 40 50 60 70 80 90
100
30 35 40 45 50 55 60 65 70 75 80 85 90 95

Stationary Air Emissions Testing
Field Sampling Manual, 2013
100
Appendix 10.3 Sample Container, Preservation, and Hold Times for Air (Vapours)
STORAGE CONTAINER MAXIMUM TYPE OF ANALYSIS TEMP(3) TYPE PRESERVATION HOLD TIME(4) AIR – VAPOURS – ORGANIC VOCs by Canister ambient SS canister none 30 Sampling VOCs by Thermal ≤6ºC thermal none 30 d Desorption desorption tube VOCs and other volatile ≤6ºC (or as see BC Lab none 30d substances by Charcoal applicable Manual Method and Miscellaneous reference collection Media method) *NOTE: 3 Storage temperature applies to storage at the laboratory. For all tests where refrigeration at ≤6°C is required at
the laboratory, samples should be packed with ice or cold packs to maintain a temperature of ≤10°C during transport to the laboratory. The storage of ≤8°C for microbiological samples applies during storage at the laboratory and during transport to the laboratory. To prevent breakage, water samples stored in glass should not be frozen. Except where indicated by "do not freeze", test results need not be qualified for frozen samples.
4 Hold Times: Single values refer to hold time from sampling to analysis. Where 2 values are given, the first is hold time from sampling to extraction, and the second is hold time from extraction to analysis.
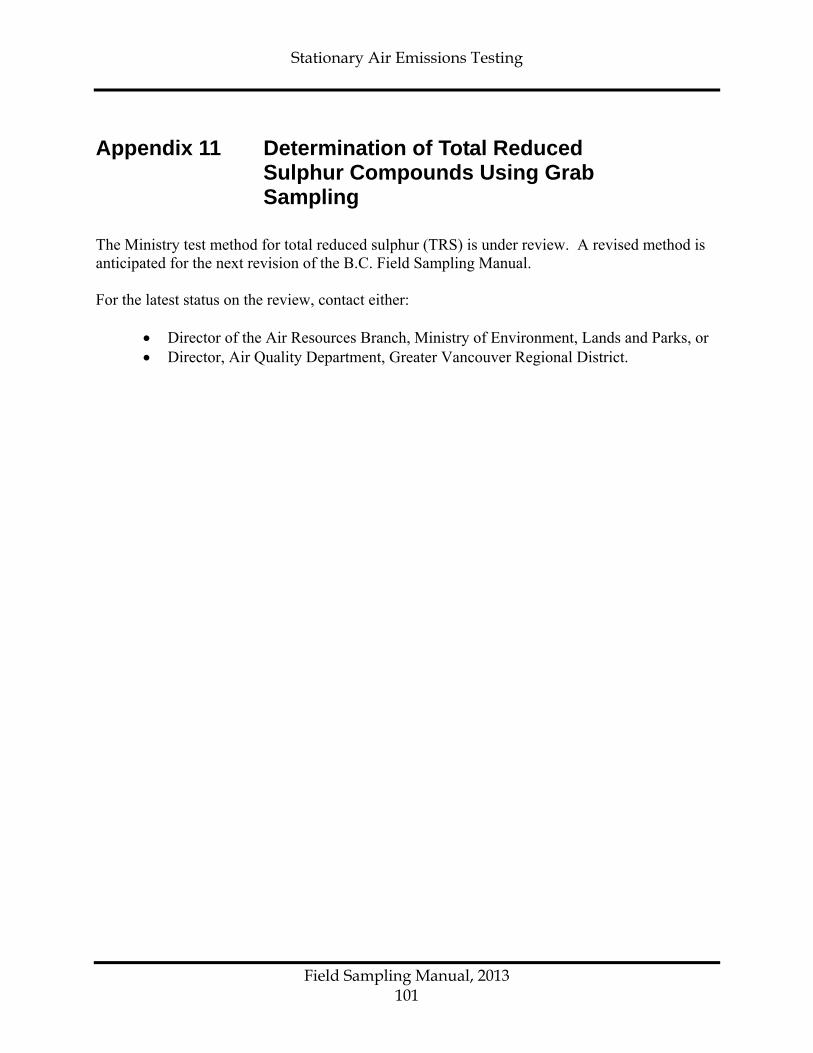
Stationary Air Emissions Testing
Field Sampling Manual, 2013
101
Appendix 11 Determination of Total Reduced Sulphur Compounds Using Grab Sampling The Ministry test method for total reduced sulphur (TRS) is under review. A revised method is anticipated for the next revision of the B.C. Field Sampling Manual. For the latest status on the review, contact either:
• Director of the Air Resources Branch, Ministry of Environment, Lands and Parks, or • Director, Air Quality Department, Greater Vancouver Regional District.

Stationary Air Emissions Testing
Field Sampling Manual, 2013
102
Appendix 12 Method for Measuring Particulate Emissions from Stationary Sources with Cyclonic Flow Pattern (Alignment Method) The Technical Committee on Cyclonic Flow Sampling (Ministry of Environment, British Columbia, November 31, 1990) originally compiled this method. For the text which follows minor modifications have been made to ensure that this method is consistent with current Ministry stack sampling procedures. Instead of referring to outdated Ministry methods reference is made to adopted U.S. EPA methods as appropriate. The technical content of the method itself has not been altered. Forward The method described in this Appendix is used to measure the releases of particulate matter from stationary sources with cyclonic flow pattern. This method is to be used in conjunction with U.S. EPA Methods 1 to 5. The complexity of the sampling and analytical procedures warrants that personnel performing them be trained and experienced. Application of this method for compliance testing requires strict adherence to the method in all aspects. Deviations from the method may invalidate the test results. Any changes in equipment, reagents, materials, procedures, or calculations from those specified in the method must be approved by the Regulatory Administrator prior to testing. This method is subject to amendment from time to time. Users should contact the Ministry for the most up-to-date version that is applicable to the source to be tested. This method was recommended by the Technical Committee on Cyclonic Flow Sampling. The members of this committee were as follows:
Mr. B.B. Manna, P.Eng., Chair, Ministry of Environment (MoE), British Columbia Mr. T.B. Leung, P.Eng., MoE, British Columbia Mr. P.K. Leung, P.Eng., Environment Canada Mr. L. Begoray, P.Eng., Alberta Environment Mr. P. Tam, P.Eng., B.H. Levelton & Associates

Stationary Air Emissions Testing
Field Sampling Manual, 2013
103
Appendix 12.1 Principle Particulate matter is withdrawn isokinetically from a number of sampling or traverse points in an enclosed gas stream. At each traverse point, the nozzle is canted directly into the flow at the pre-determined rotational angle where the maximum gas velocity occurs. The isokinetic sampling rate is based on the actual stack gas velocity. The particulate sample is collected in the nozzle, probe, cyclone (if used) and filter, all maintained within a temperature range required by U.S. EPA Method 5. The particulate weight is determined gravimetrically after removal of uncombined water. Simultaneous determinations of the gas stream moisture content, velocity, temperature, and molecular weight allow calculations of the particulate concentration and the particulate mass emission rate to be made.
Appendix 12.2 Applicability This method is used to determine the concentration of particulates in enclosed gas streams of stationary sources with cyclonic flow pattern. Gas flow inside a stack or flue is considered cyclonic if the average absolute value of the rotational angles, as determined by Section 4.1 of this method, is greater than 10 degrees. Prior to considering using this method, the tester must evaluate, to the satisfaction of the Regulatory Administrator, the feasibility of eliminating cyclonic flow patters at the sampling location by one or a combination of the following options:
Option One: Relocation of the sampling ports Option Two: Installation of flow straighteners to minimize the cyclonic flow pattern Option Three: Stack extension to minimize cyclonic effects
If none of the above options are feasible, the Regulatory Administrator may determine the applicability of the method for a specific source, taking into consideration pre-test information (to be submitted by the proponent) such as: (i) Particulate and stack/flue characteristics (e.g. particle size and particulate concentration
profile across stack or flue). (ii) Sampling ports location. (iii)Rotational (or yaw) and tilt (or pitch) angles. (iv) Supersaturation state of the gas stream. (v) Stability of the cyclonic flow pattern with respect to time and space.
Proponents must also consult with the Regulatory Administrator prior to using this method to perform a survey.

Stationary Air Emissions Testing
Field Sampling Manual, 2013
104
Appendix 12.3 Apparatus and Reagents Same as for U.S. EPA Method 5 - 2 and 3
Appendix 12.4 Procedures Pre-sampling Preparations In addition to following the procedures specified in U.S. EPA Method 5 - 4, a preliminary traverse shall be conducted to determine the velocity and rotational angle at each traverse point. Insert into the stack an S-type pitot tube that is connected to a differential pressure gauge. Position the pitot tube at the first traverse point. Rotate the pitot tube clockwise or anti-clockwise about its longitudinal axis until the pressure taps are equal (i.e. Δp equals zero or null). Determine and record the rotational angle, α, to the nearest degree by rotating the pitot tube ninety degrees about its longitudinal axis and in the opposite direction. Note that the value of α can be zero, positive or negative depending on the direction of the gas velocity in relation to the stack or flue axis (Figure A1). Record the velocity pressure reading, Δp, for this traverse point. Repeat the procedure for all the traverse points. Conduct a second series for measurements by repeating the procedure for the traverse points. The second test should be conducted under the same process conditions as the first test and the two tests should be conducted at least 60 minutes apart. After the rotational angle of each traverse point inside the stack/flue has been determined, recorded and verified, calculate the average of the absolute value of α. If the average α for each series of measurement is less than or equal to 10 degrees, the source is not considered to have a cyclonic flow pattern. Otherwise, submit the pre-sampling test results to the Regulatory Administrator and obtain prior approval to use this method for measuring particulate emissions under cyclonic flow conditions. Preparation of Collection Train Follow the procedures described in U.S. EPA Method 5 - 4.1.3. Sampling Train Operation If either or both the rotational angles and velocities measured for the same traverse point during the two discrete test runs as described, under Section 4.1, differ by five degrees and five percent or less respectively, the cyclonic flow pattern is deem to be stable; thus sampling procedures as outlined in Section 4.3.1 should be followed. However, if either or both the rotational angles and velocities differ by more than five degrees or five percent respectively, the cyclonic flow pattern is deemed to be unstable.

Stationary Air Emissions Testing
Field Sampling Manual, 2013
105
Therefore steps must be taken to minimize the time elapsed between the determination of the rotational angle and particulate sampling; sampling procedures are outlined in Section 4.3.2 should be followed.
The basic difference in the sampling procedures for stable and unstable cyclonic flow patterns is that for stable cyclonic flows, isokinetic sampling can be carried out at the pre-determined rotational angle of each traverse point whereas for unstable cyclonic flows, the rotational angle for each traverse point is determined and is used immediately for isokinetic sampling. Sampling Procedures for Stable Cyclonic Flow Patterns Prior to sampling, determine the rotational angle of each traverse point by following the procedures described in Section 4.1. Insert the sampling probe into the stack/flue with the nozzle canted directly into the flow at the pre-determined rotational angle of the first traverse point. Immediately start the vacuum pump and adjust the sampling rate to isokinetic conditions. Repeat this procedure for all the other traverse points. The isokinetic sampling rate is based on the actual stack gas velocity. Conduct isokinetic sampling for all the traverse points by following the procedures contained in U.S. EPA Method 5. Sampling Procedures for Unstable Cyclonic Flow Patterns Determine the rotational angle of the first traverse point. Adjust the sampling probe with the nozzle canted into the flow at this rotational angle. Immediately start the vacuum pump and adjust the sampling rate to isokinetic conditions. Turn the vacuum pump off at the conclusion of the sampling at the first traverse point. Repeat these procedures for all other traverse points. The isokinetic sampling rate is based on the actual stack gas velocity. Isokinetic sampling for all the traverse points must be conducted by following the procedures described in U.S. EPA Method 5. Sample Recovery and Sample Analysis Follow the procedures in U.S. EPA Method 5 - 4.2 and 4.3.

Stationary Air Emissions Testing
Field Sampling Manual, 2013
106
Appendix 12.5 Calculations and Reporting
The following modifications to U.S. EPA Method 5 are required: To determine the stack/flue gas flow rate, Qsp, use the average of the vertical components of the stack/flue gas velocity, vs cosine α, at each traverse point. Where possible, the calculated Qsp should be verified independently by other means, such as taking flow measurement at another location. The particulate emission rate, is the production of the concentration, cs, and the stack/flue gas flow rate, Qsp, from Section 5.1. To compensate for the potential bias associated with cyclonic sampling, correction factors may be used in calculating and reporting the final particulate emission rate, cs, and Qsp . Consult with the Regulatory Administrator regarding the values of the correction factors for a specific stationary emission source.
vs
α STACK / FLUE
α = Rotational Angle

Stationary Air Emissions Testing
Field Sampling Manual, 2013
107
vs = Stack Gas Velocity

PART C BIOLOGICAL TESTING
©Her Majesty the Queen in Right of the Province of British Columbia
2013 All Rights Reserved

BIOASSAYS: SAMPLE COLLECTION PLUS IN-SITU TESTS
©Her Majesty the Queen in Right of the Province of British Columbia
2013 All Rights Reserved

Bioassays: Sample Collection Plus In-Situ Tests
Field Sampling Manual, 2013
100
Table of Contents 1. INTRODUCTION .............................................................................................................. 101
2. IN-SITU SALMONID EGGS BIOASSAY ......................................................................... 101 2.1 Background ........................................................................................................... 101 2.2 Start Up ............. .................................................................................................... 102
2.2.1 Preparation .................................................................................................. 102 2.2.2 Procurement and Transportation of Eggs .................................................... 102
2.3 Field Deployment .................................................................................................. 103 2.4 End-Point .......... .................................................................................................... 104 2.5 Jordon/Scotty Incubator: ...................................................................................... 105
3. IN-SITU CAGED FISH BIOASSAY ................................................................................. 105 3.1 Background ........................................................................................................... 105 3.2 Start Up .............. ................................................................................................... 105
3.2.1 Preparation .................................................................................................. 105 3.2.2 Procurement and Transportation of Fish ..................................................... 106
3.3 Field Deployment .................................................................................................. 106 3.4 End-Point ........... ................................................................................................... 107
4. GENERAL PROCEDURE FOR COLLECTION OF EFFLUENT AND WATER SAMPLES FOR LABORATORY BIOASSAYS ............................................................... 108 4.1 Background ........................................................................................................... 108 4.2 Sampling ..... .......................................................................................................... 108
4.2.1 Effluents ....................................................................................................... 108 4.2.2 Receiving waters ......................................................................................... 108
4.3 Specific Bioassay Requirements ......................................................................... 108 4.3.1 Fish .............................................................................................................. 108 4.3.2 Daphnia ....................................................................................................... 109 4.3.3 Microtox ....................................................................................................... 109
5. SOURCES OF FURTHER INFORMATION ..................................................................... 109 5.1 In-Situ Salmonid Eggs Bioassay ......................................................................... 109 5.2 In-Situ Caged Fish Bioassays .............................................................................. 109 5.3 Collection of Effluent and Water Samples for Laboratory Bioassays .............. 110
6. REVISION HISTORY ....................................................................................................... 110

Bioassays: Sample Collection Plus In-Situ Tests
Field Sampling Manual, 2013
101
1. Introduction Bioassay studies of toxicity can be divided into two categories -- bioassays performed in-situ, and bioassays performed at a laboratory with samples transported from a site. This chapter presents methodology information for two in-situ methods, plus sample collection techniques for several laboratory techniques. The methodology for laboratory bioassay assays are presented in Section F of the British Columbia Environmental Laboratory Manual for the Analysis of Water, Wastewater, Sediment and Biological Materials, 1994 Edition (Permittee). In-situ bioassay studies are effective tools to assess the impact of a discharge, leachate or drainage into the aquatic environment. These studies are usually designed to evaluate the situation during a discharge event, or for upstream/downstream comparison. However, due to the physical limitations placed on the investigator and the lack of control over the metaphysical factors, the level of resolution with which pollution effects can be determined by in-situ studies is rather coarse and only substantial biological effects can be distinguished. Currently BC Environment endorses two in-situ methods of bioassay. The first type involves use of eyed salmonid eggs, placed in modified Whitlock-Vibert boxes. This method was developed by G.C. van Aggelen and has been successfully used in a number of field investigations. The second type of in-situ bioassay involves caging fish in some form of trap or cage. The author of this chapter assumes that the reader has a certain degree of familiarity with aquatic toxicity testing and field techniques. Explicit instructions on every detail that might be required are not provided although this procedure is intended to serve as a guide for this method.
2. In-Situ Salmonid Eggs Bioassay
2.1 Background It is well documented that developing embryos have periods of extreme sensitivity when their susceptibility to foreign toxicants is maximal. Fish embryos are no different, with extensive data from life cycle toxicity testing to support this. The method described below is based upon starting the bioassay with Pacific Salmonid eggs that have just come into the "eyed stage" of development. Eyed stage is defined by Piper et al., U.S. Dept. of Interior, U.S. Fish and Wildlife, 1982, as the stage between the time the eyes become visible and hatching occurs.

Bioassays: Sample Collection Plus In-Situ Tests
Field Sampling Manual, 2013
102
This stage of development guarantees that the eggs have been fertilized and that the embryos are hardy enough to be handled and transported. Developmental stages prior to this are extremely sensitive to handling and transportation; mortality rates associated with these factors are very high.
2.2 Start Up
2.2.1 Preparation Prior to conducting any field bioassay: • It is strongly recommended that a site visit be made to establish a general feel
for the area in question, sight out potential deployment areas, notify site manager(s), local neighbours, etc.
• Field dissolved oxygen, temperature, conductivity and pH should be taken. • Local Ministry fish and wildlife and DFO habitat staff must be made aware of
the intended study. Provide them with a briefing on the site location, duration and endpoints.
• An application for transplant authorization must be filed with the Federal/Provincial transplant committee. This application must detail the study, provide information on the type of eggs, their origin, and final disposal of the eggs/hatchout on completion, plus any other pertinent information. The study can not proceed without this authorization.
2.2.2 Procurement and Transportation of Eggs Procurement of eyed salmonid eggs is determined by the transplant committee and is somewhat seasonal when from the Federal/Provincial hatchery system. Most sea run salmon eggs are available from late August until mid November. Rainbow trout are available from the government hatcheries from November until March. There are some private trout farms, certified by the transplant committee, that will have eggs available at different times of the year. The scope of the study will determine the number of eggs that are required. A target of 100 eggs per box is a good target. A thousand (1000) eggs will usually allow for three control boxes and two downstream locations. The remaining eggs can serve as tissue control. Transportation of the eggs can be done in clean and disinfected (i.e., Wescodyn rinsed) containers that can be sealed. The eggs do not have to be placed in water as long as they are kept cool and moist. Paper towel or cheesecloth soaked in cool dechlorinated water works well. Eggs should be placed in a cooler and, if temperature is a factor, an ice pack should be added. The hatchery manager should be shown a copy of the transplant approval and you, in return, should receive information about the stocks (i.e., temperature units, disease control, stock origin, etc.) and a transfer document.
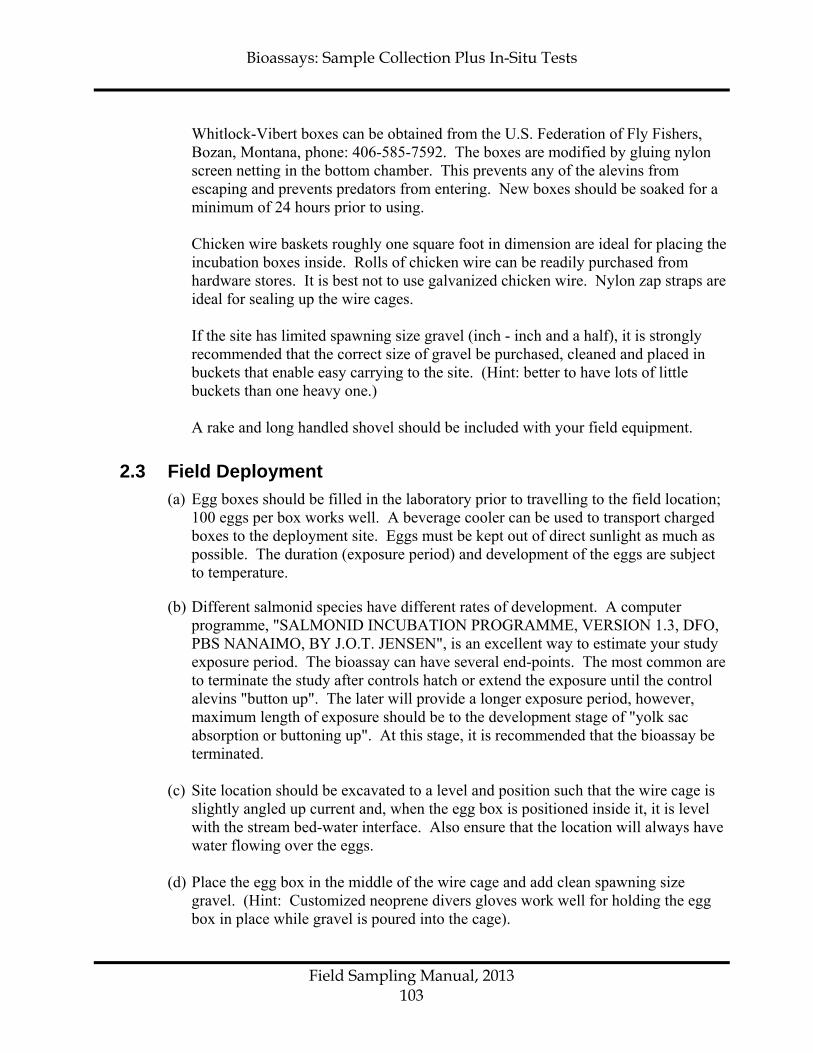
Bioassays: Sample Collection Plus In-Situ Tests
Field Sampling Manual, 2013
103
Whitlock-Vibert boxes can be obtained from the U.S. Federation of Fly Fishers, Bozan, Montana, phone: 406-585-7592. The boxes are modified by gluing nylon screen netting in the bottom chamber. This prevents any of the alevins from escaping and prevents predators from entering. New boxes should be soaked for a minimum of 24 hours prior to using. Chicken wire baskets roughly one square foot in dimension are ideal for placing the incubation boxes inside. Rolls of chicken wire can be readily purchased from hardware stores. It is best not to use galvanized chicken wire. Nylon zap straps are ideal for sealing up the wire cages. If the site has limited spawning size gravel (inch - inch and a half), it is strongly recommended that the correct size of gravel be purchased, cleaned and placed in buckets that enable easy carrying to the site. (Hint: better to have lots of little buckets than one heavy one.) A rake and long handled shovel should be included with your field equipment.
2.3 Field Deployment (a) Egg boxes should be filled in the laboratory prior to travelling to the field location;
100 eggs per box works well. A beverage cooler can be used to transport charged boxes to the deployment site. Eggs must be kept out of direct sunlight as much as possible. The duration (exposure period) and development of the eggs are subject to temperature.
(b) Different salmonid species have different rates of development. A computer programme, "SALMONID INCUBATION PROGRAMME, VERSION 1.3, DFO, PBS NANAIMO, BY J.O.T. JENSEN", is an excellent way to estimate your study exposure period. The bioassay can have several end-points. The most common are to terminate the study after controls hatch or extend the exposure until the control alevins "button up". The later will provide a longer exposure period, however, maximum length of exposure should be to the development stage of "yolk sac absorption or buttoning up". At this stage, it is recommended that the bioassay be terminated.
(c) Site location should be excavated to a level and position such that the wire cage is
slightly angled up current and, when the egg box is positioned inside it, it is level with the stream bed-water interface. Also ensure that the location will always have water flowing over the eggs.
(d) Place the egg box in the middle of the wire cage and add clean spawning size
gravel. (Hint: Customized neoprene divers gloves work well for holding the egg box in place while gravel is poured into the cage).

Bioassays: Sample Collection Plus In-Situ Tests
Field Sampling Manual, 2013
104
(e) Once the egg box is totally covered with gravel, close the wire cage and seal it with wire or nylon zap straps. It is recommended that a minimum of three boxes be used for each site.
(f) Field parameters such as temperature, dissolved oxygen, and pH should be
measured each time the eggs are checked. Water flow rates and climatological factors should be recorded. (Note: Temperature is a critical measurement as egg development is driven by temperature.) Consequently control boxes should be placed in conditions (temperature, depth, light) as similar to test boxes as possible.
(g) One cage at each site should be designated as the "check cage". This cage should
be the only one observed during the weekly monitoring of the study. When observing the eggs, every attempt should be made to shield the eggs from direct sunlight. The checking should be conducted as quickly as possible. If a longer time (10+ minutes) is required, keep eggs moist. (Hint: An empty bucket is useful for putting removed gravel in while checking the egg box.)
(h) Record mortality and any other pertinent observations in field note book.
2.4 End-Point A number of end-points can be used for this type of study, however, any response has to be a statistical comparison of control survival (up-stream) against the downstream (impacted) site(s) survival. The test is invalid if there is twenty percent mortality in the control. The Toxstat computer programme version 3.2 by Gulley, Boelter and Bergman, University of Wyoming, is useful for statistical manipulations.
Mortality is the most obvious response to measure. Fish eggs turn white when they are dead. This is because the yolk contains a large amount of protein called globulin. The globulin is in solution in the yolk and is held in this state by the presence of salts. It can not remain in solution in water which contains no salts or electrolytes. The removal or diluting of salts from the yolk causes it to precipitate. In a normal egg, the yolk membranes prevent the salts from diffusing into the periviteline space and from there through the porous egg case. Toxicants can diffuse across this membrane and cause its break down and eventually rupture.
Hatching rate is also a significant measure for this type of bioassay. It is possible for hatching to be early or delayed depending on the material and toxic action. Metals can cause impaired hatching or head encapsulation where the alevin's head becomes trapped in the egg capsule and dies. Iron or metal oxides can precipitate onto the egg's surface and cause it to suffocate.

Bioassays: Sample Collection Plus In-Situ Tests
Field Sampling Manual, 2013
105
Any surviving eggs or alevin must be returned to the laboratory and destroyed. Survivors must not be released. This is a condition of the transplant approval.
2.5 Jordon/Scotty Incubator: The Jordan/Scotty in-stream incubators can be used as an alternative to the Whitlock-Viebert boxes. Often the spread of fungus between eggs is the main reason for high mortality rates. Fungus usually establishes itself on dead eggs but can spread to alive and healthy eggs. To avoid this phenomenon, which often occurs in the Whitlock-Viebert boxes, it is recommended that Jordan/Scotty in-stream incubators be used, since they offer small separated chambers for each individual egg. The interpretation of the observed egg mortality rates in bioassays using Jordan/Scotty incubators is not confused by mortalities due to fungus spread and can most likely be attributed to water toxicity with reference to salmonid eggs. For drawings of the incubator and further information, see the pamphlet published by Scotty Plastics, 21 Erie St., Victoria, B.C., Canada, V8V 1P8.
3. In-Situ Caged Fish Bioassay
3.1 Background Under certain conditions, it is possible to use caged fish to determine if deleterious effects are happening in receiving waters. The deployment of caged fish into fresh and marine waters will usually only provide the investigator with a measure of mortality.
3.2 Start Up
3.2.1 Preparation Prior to conducting any field bioassay: • It is strongly recommended that a site visit be made to establish a general feel
for the area in question, sight out potential deployment areas, notify site manager(s), local neighbours, etc.
• Field dissolved oxygen, temperature, conductivity and pH should be taken. • Local Ministry fish and wildlife and DFO habitat staff must be made aware of
the intended study. Provide them with a briefing on the site location, duration and endpoints.

Bioassays: Sample Collection Plus In-Situ Tests
Field Sampling Manual, 2013
106
• An application for transplant authorization must be filed with the Federal/Provincial transplant committee. This application must detail the study, provide information on the type of fish, their origin, and final disposal of the fish on completion, plus any other pertinent information. The study can not proceed without this authorization.
3.2.2 Procurement and Transportation of Fish The procurement of fish, when Environment Canada’s Toxicology group is not used, will have to be done using the Federal/Provincial hatchery system. The species of fish exposed must be relevant to the site’s environment and may be from indigenous or cultured stocks. Various species of salmonids are available, however, the age and size is often seasonal and species dependent. There are also private trout farms that will provide stocks. Fish farms can be contacted for marine salmonids. If marine work is intended, the stocks will have to be salinity acclimated following a suitable protocol (see Environment Canada, 1/Rm/10, for an example). Transportation of the fish can be done in clean and disinfected containers (i.e., Wescodyn or Rocol) that can be sealed. A portable compressed air system or bottled oxygen must be provided when travelling any great distance. Temperature will also play an important factor in the summer months during transit. Dechlorinated ice blocks should be used for cooling. The fish supplier should provide you with a statement regarding the stocks’ origin and any disease treatments they have undergone. Many different cage designs have been developed to hold fish. The chief concern of the design of these is that they must be capable of sustaining fish for the duration of the exposure, not allow escape, and, at the same time, allow adequate flow. Specific designs can be tailored for the type of receiving environment (rivers, ditches, tidal areas, submerged or surface exposure conditions). Construction materials must not contribute to toxicity or injure the organisms.
3.3 Field Deployment (a) Cages should be positioned and secured prior to adding the fish. The control
location should resemble the location of impact with regards to flow rate, geography, depth, etc. Location should take into account flow rates depth, tides, etc. In swift flowing water, back eddies or side pools work well so fish are not under constant current swimming stress. If possible, try to locate cages where direct sunlight can be avoided. When working in a marine environment, make sure rope lengths are calculated for tide changes. Floats must be brightly coloured to avoid navigation hazards for boaters.
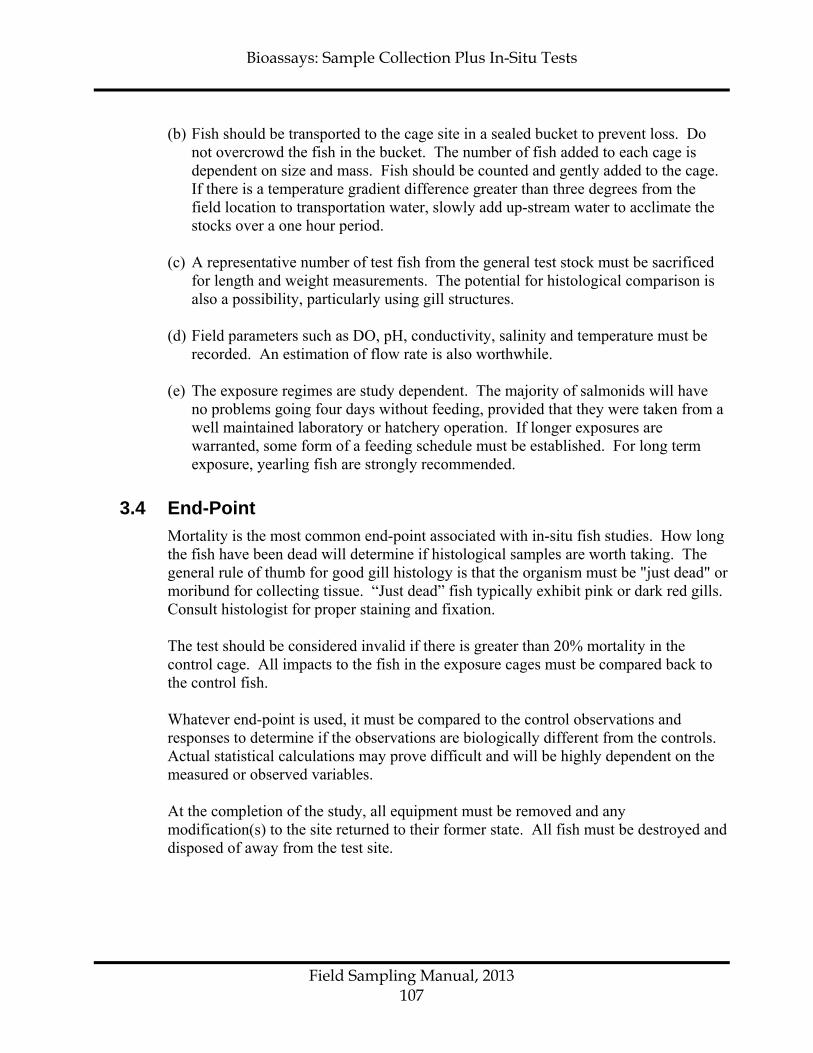
Bioassays: Sample Collection Plus In-Situ Tests
Field Sampling Manual, 2013
107
(b) Fish should be transported to the cage site in a sealed bucket to prevent loss. Do not overcrowd the fish in the bucket. The number of fish added to each cage is dependent on size and mass. Fish should be counted and gently added to the cage. If there is a temperature gradient difference greater than three degrees from the field location to transportation water, slowly add up-stream water to acclimate the stocks over a one hour period.
(c) A representative number of test fish from the general test stock must be sacrificed
for length and weight measurements. The potential for histological comparison is also a possibility, particularly using gill structures.
(d) Field parameters such as DO, pH, conductivity, salinity and temperature must be
recorded. An estimation of flow rate is also worthwhile.
(e) The exposure regimes are study dependent. The majority of salmonids will have no problems going four days without feeding, provided that they were taken from a well maintained laboratory or hatchery operation. If longer exposures are warranted, some form of a feeding schedule must be established. For long term exposure, yearling fish are strongly recommended.
3.4 End-Point Mortality is the most common end-point associated with in-situ fish studies. How long the fish have been dead will determine if histological samples are worth taking. The general rule of thumb for good gill histology is that the organism must be "just dead" or moribund for collecting tissue. “Just dead” fish typically exhibit pink or dark red gills. Consult histologist for proper staining and fixation. The test should be considered invalid if there is greater than 20% mortality in the control cage. All impacts to the fish in the exposure cages must be compared back to the control fish.
Whatever end-point is used, it must be compared to the control observations and responses to determine if the observations are biologically different from the controls. Actual statistical calculations may prove difficult and will be highly dependent on the measured or observed variables.
At the completion of the study, all equipment must be removed and any modification(s) to the site returned to their former state. All fish must be destroyed and disposed of away from the test site.

Bioassays: Sample Collection Plus In-Situ Tests
Field Sampling Manual, 2013
108
4. General Procedure for Collection of Effluent and Water Samples for Laboratory Bioassays
4.1 Background The physical collection of a sample for liquid phase bioassay testing will vary only slightly between the different bioassay types. The only major difference will be in the volume of material required to complete the requested bioassay(s) and the dilution series. It is strongly recommended that field staff consult the laboratory for confirmation on the amount of liquid required to conducted the requested bioassay(s).
4.2 Sampling
4.2.1 Effluents Sampling may be done by a single grab, or composited manually over a given period of time. Once a composite sample has been collected, it should be thoroughly mixed and transferred into non-toxic shipping containers.
4.2.2 Receiving waters Receiving water should be pumped from the designated sampling depth using clean polyethylene tubing into a clean polyethylene or polypropylene container.
4.3 Specific Bioassay Requirements
4.3.1 Fish Sample-volume requirements depend on fish size and numbers per test solution, load-density requirements, test concentrations and the use of replicates. For single concentrations (i.e., permit compliance), sample volumes of 25-50 litres are normally required. For tests to determine an LC50, sample volumes of 60 to 100L or more are normally required.
Containers for storage and transportation of samples must be made of non-toxic material, such as lab-cleaned glass. The containers must be new or thoroughly cleaned and dried, and should be rinsed with clean water, then with the sample to be collected. The container must be filled with sample to exclude air and then be sealed. Labelling must include: sample type, location, date, and time of collection, and name of sampler.

Bioassays: Sample Collection Plus In-Situ Tests
Field Sampling Manual, 2013
109
Samples should be kept from freezing. During transport, samples should be kept dark, and at a temperature of 1°C to 8°C if more than two days are spent in transit.
4.3.2 Daphnia The volume of material required to conduct the bioassay is two litres. Only clean non-toxic bottles are to be used and are to be brim full. The same shipping and handling procedures as above apply.
4.3.3 Microtox The volume of material required is 500 mL to 1000 mL; this will allow for portions to be used for measuring initial DO and pH. It is recommended that samples be collected in borosilicate glass with screw caps lined with Teflon. The same conditions as above apply for handling and transportation.
5. Sources of Further Information
5.1 In-Situ Salmonid Eggs Bioassay Whitlock, D. Sept. 1977. The Whitlock-Vibert Box Handbook. Federation of Fly
Fishermen. Meehan W.R. (editor). 1991. Influences of Forest and Rangeland Management of
Salmonid Fishes and Their Habitat. American Fisheries Society. Special Publication 19.
Piper, R.G., McElwain, Orme, McCraren, Fowler, Leonard. 1982. Fish Hatchery
Management. U.S. Fish & Wildlife, Washington D.C. Scott Plastics Ltd. 2000, Jordan/Scotty Salmonid Egg. Incubator, 10pp.
5.2 In-Situ Caged Fish Bioassays Sprague, J.B. 1973. The ABC's of Pollutant Bioassay Using Fish. In Biological
Methods for the Measurement of Water Quality. ASTM STP 528. American Society for Testing and Materials, Philadelphia, PA.
September 1992. Technical Guidance Manual for Aquatic Environmental Effects
Monitoring. Environment Canada, Department of Fisheries and Oceans. Environmental Protection Series. July 1990. Biological Test Method: Acute
Lethality Using Three Spine Stickleback. Report 1/RM/10.

Bioassays: Sample Collection Plus In-Situ Tests
Field Sampling Manual, 2013
110
5.3 Collection of Effluent and Water Samples for Laboratory Bioassays September 1992. Technical Guidance Manual for Aquatic Environmental Effects
Monitoring. Environment Canada, Department of Fisheries and Oceans. Environmental Protection Series. July 1990. Biological Test Method: Acute
Lethality Using Daphnia spp. Report 1/RM/11 Environmental Protection Series. July 1990. Biological Test Method: Acute
Lethality Using Rainbow Trout. Report 1/RM/9 Environmental Protection Series. July 1992. Biological Test Method: Toxicity Test
Using Luminescent Bacteria. Report 1/RM/24 British Columbia Environmental Laboratory Manual For the Analysis of Water,
Wastewater, Sediment and Biological Materials, 1994 Edition (Permittee). Environmental Protection Department, Ministry of Environment, Lands and Parks, Victoria, Canada.
6. Revision History October 11, 2013: This section republished without change. Appendix 2 - Sample
containers, StorageTM, Preservation and Holding Times and Appendix 3 - Laboratory Sample Container, Preservation, and Hold Times for Fresh Water Biological Sampling updated.
February 28, 2001: Addition of Information about this Jordon/Scotty salmonid egg
incubator. Out of print reference deleted. November 1996: Initial Publication.

BIOLOGICAL SAMPLE COLLECTION: FRESHWATERS
©Her Majesty the Queen in Right of the Province of British Columbia
2013 All Rights Reserved

Biological Sample Collection: Freshwaters
Field Sampling Manual, 2013
112
Table of Contents 1. INTRODUCTION .............................................................................................................. 114
2. GENERAL CONSIDERATIONS ...................................................................................... 115 2.1 Preparing to Go to the Field ................................................................................. 115 2.2 Locating the Site in the Field ............................................................................... 115 2.3 Field Notes/Observations ..................................................................................... 115
3. QUALITY ASSURANCE/QUALITY CONTROL .............................................................. 116 3.1 Field Quality Assurance ....................................................................................... 116
3.1.1 Technique/Diligence .................................................................................... 117 3.2 Field Quality Control ............................................................................................. 118
3.2.1 Replicate Samples ....................................................................................... 119 3.2.2 Split Samples ............................................................................................... 119 3.2.3 Reference Samples ..................................................................................... 119
4. COLLECTING AND PROCESSING BIOLOGICAL SAMPLES ...................................... 120 4.1 Lake Biological Samples ...................................................................................... 120
4.1.1 Bacteria ....................................................................................................... 120 4.1.1.1 Shore Samples ................................................................................... 120 4.1.1.2 Surface Bacteriological Samples at Deep Stations ............................ 121 4.1.1.3 Deep Samples .................................................................................... 122
4.1.2 Zooplankton ................................................................................................. 123 4.1.3 Phytoplankton .............................................................................................. 125
4.1.3.1 Surface Samples ................................................................................ 126 4.1.3.2 Deep Samples .................................................................................... 126
4.1.4 Benthic Fauna ............................................................................................. 127 4.1.4.1 Grab Sampling .................................................................................... 129 4.1.4.2 Core sampling ..................................................................................... 130
4.1.5 Macrophytes ................................................................................................ 131 4.1.5.1 Taxonomy ........................................................................................... 132 4.1.5.2 Tissue Analysis ................................................................................... 135 4.1.5.3 Biomass Studies ................................................................................. 135
4.1.6 Fish .............................................................................................................. 136 4.1.6.1 Gill Nets .............................................................................................. 136 4.1.6.2 Beach Seining ..................................................................................... 139 4.1.6.3 Set Lines ............................................................................................. 141 4.1.6.4 Processing Fish Tissues ..................................................................... 142
4.2 River/Stream Biological Samples ........................................................................ 144 4.2.1 Bacteria ....................................................................................................... 144 4.2.2 Periphyton ................................................................................................... 146 4.2.3 Benthic Fauna (macro-invertebrates) .......................................................... 148
4.2.3.1 Surber Sampler ................................................................................... 149 4.2.3.2 Hess Sampler ..................................................................................... 150 4.2.3.3 Drift Net Sampler ................................................................................ 151

Biological Sample Collection: Freshwaters
Field Sampling Manual, 2013
113
4.2.4 Macrophytes ................................................................................................ 153 4.2.5 Fish .............................................................................................................. 153
4.2.5.1 Gill Nets .............................................................................................. 154 4.2.5.2 Seining ................................................................................................ 155 4.2.5.3 Set Lines ............................................................................................. 156 4.2.5.4 Electrofishing ...................................................................................... 156
5. SHIPPING .................. ..................................................................................................... 157
6. SOURCES OF FURTHER INFORMATION .................................................................... 158
7. REVISION HISTORY ....................................................................................................... 160
APPENDIX 1 GENERIC FIELD CHECKLIST ...................................................................... 161
APPENDIX 2 LAB SAMPLE CONTAINER, PRESERVATION, AND HOLD TIMES FOR SEDIMENTS AND TISSUES .................................................................................. 163
APPENDIX 3 LABORATORY SAMPLE CONTAINER, PRESERVATION, AND HOLD TIMES FOR FRESH WATER BIOLOGICAL SAMPLING ............................................... 165

Biological Sample Collection: Freshwaters
Field Sampling Manual, 2013
114
1. Introduction This section covers the minimum requirements to ensure quality and consistency of the field aspects of biological data collection. The essential tasks in biological sampling are to collect representative samples that meet the requirements of the program, and to prevent deterioration and contamination of the samples before analysis. The procedures outlined in this manual are oriented primarily towards BC Environment employees, consultants, or those under a legal requirement to undertake a sampling program for the Ministry. Following the protocols outlined in this manual will aid field staff in collecting reliable, representative samples. The protocols presented here are the most acceptable ones used at present. It should be emphasized that in unusual circumstances or with development of new methods, experienced professional judgment is a necessary component of method choice and application. It is intended that this document will be updated as the need arises to incorporate new knowledge. For specialized sampling needs, a considerable literature exists which can be consulted. This is particularly the case with benthic stream invertebrates. This manual does not address the collection of samples for the purpose of providing legal evidence. For information regarding legal sampling refer to Guidelines for the Collection and Analyses of Water and Wastewater Samples for Legal Evidence (Lynch and van Aggelen, 1994). This section does not address project design (site locations, frequency of sampling, duration, quality assurance program, etc.) or data interpretation. These topics are the subject of separate sections. The sample containers, preservatives and sampling procedures described in this manual reflect those generally used by BC Environment staff. Shipping procedures and safety measures are also outlined. Different agencies or laboratories may have specifications which differ from those described here. It should be acknowledged that funding for the initial manuscript upon which this section is based was provided by the Aquatic Inventory Task Force of the Resource Inventory Committee.

Biological Sample Collection: Freshwaters
Field Sampling Manual, 2013
115
2. General Considerations
2.1 Preparing to Go to the Field Preparation for each sampling trip is critical since oversights are not usually noticed until staff reach the first station. The most effective way to prepare for a sampling trip is with a checklist that is designed to meet the requirements of each project. Other than considering site-specific instructions, the checklist should identify the following needs:
• Type and number of (labeled) bottles, including extras • Field equipment such as sediment grabs, invertebrate samplers, fish nets, tow
nets, etc. • Preservatives • Appropriate quantity of ice packs and coolers • Log books • Personal gear (for all possible weather conditions such as survival suits, raincoats,
protective footwear, etc.) • First aid kit and other safety equipment (life jackets, survival suits) • Camera or video equipment as required • Laboratory requisition forms (partially filled out) A general operating procedure is to have the essential equipment in a box or plastic “tote” which is dedicated to this activity. See Appendix 1 of this chapter for an example of a generic checklist.
2.2 Locating the Site in the Field It is the responsibility of the field staff to locate all sampling stations accurately. Only if the same location is sampled consistently can temporal changes in the water quality be interpreted with confidence. Therefore, accurate station location descriptions (that identify key landmarks) must be prepared on the first visit to every sampling site. Good photographic documentation is the best way of ensuring that each site is easily recognized. A map that labels the sample sites should accompany the site identification log book. This log book can be in the form of a 3-ring binder with a 1:50 000 map. The basic site location data (latitudes, longitudes, map sheet number, site identification number, etc.) should be incorporated into the database (EMS in the case of BC Environment).

Biological Sample Collection: Freshwaters
Field Sampling Manual, 2013
116
2.3 Field Notes/Observations Good sampling practice always involves the use of detailed field notes. Specific information about seemingly unimportant facts such as the time of day or weather conditions are often important when interpreting data. A field log book (3-ring binder with waterproof paper) for each project is mandatory. All field measurements (DO, temperature, conductivity, etc.) should be entered (by date) directly into this field log book. The following list emphasizes those observations that should be recorded for biological variables:
• Site name and EMS code • Date and time • Weather • Names of all the personnel on the sampling crew • Station depth (phytoplankton, zooplankton, fish) • Tow volumes (zooplankton) (net mouth size, mesh size, tow depth) • Surface area sampled (periphyton) • Fish species collected including sex, weight, length, and comments regarding
general appearance (health) • Preservatives used (for each sample) All information recorded in the log book should be initialed by the data recorder and entered into the database as soon as possible upon return from the field. The field note book is a very important document and it should be stored as an archival document for future reference.
3. Quality Assurance/Quality Control
3.1 Field Quality Assurance The field quality assurance program is a systematic process which, together with the laboratory and data storage quality assurance programs, ensures a specified degree of confidence in the data collected for an environmental survey. The field quality assurance program involves a series of steps, procedures, and practices which are described below.

Biological Sample Collection: Freshwaters
Field Sampling Manual, 2013
117
3.1.1 Technique/Diligence The quality of data generated in a laboratory depends, to a large degree, on the integrity of the samples that arrive at the laboratory. Consequently, the field investigator must take the necessary precautions and have the appropriate knowledge to collect representative samples and protect samples from contamination and deterioration. Included in this category are consistency of sampling, correct use of equipment, and detailed field notes. There are many sources of contamination; the following are some basic precautions to heed for biological samples particularly where tissue samples are to be obtained and processed: • Sample containers, new or used, must be cleaned according to the
recommended methods and certified by the issuing laboratory as ‘contamination free’ (if pre-cleaned by the laboratory). Pre-cleaned bottles must be supplied with caps attached. Always label and store pre-cleaned bottles in plastic bags to avoid confusion and contamination during transport.
• Only the recommended type of sample container for each analysis should be
used. Use only certified contamination free preservatives. • The inner portion of sample bottles and caps must not be touched with
anything (e.g., bare hands, gloves, etc.) other than the sample itself . • Sample containers must be kept in a clean environment, away from dust, dirt,
fumes and grime. Bottles must be capped at all times and stored in clean shipping coolers both before and after the collection of the sample. Vehicle cleanliness is an important factor in eliminating contamination problems.
• Petroleum products (gasoline, oil, exhaust fumes) are prime sources of
contamination. Spills or drippings (which are apt to occur in boats) must be removed immediately. Exhaust fumes and cigarette smoke can contaminate samples with lead and other heavy metals. Air conditioning units are also a source of trace metal contamination.
• Samples must never be permitted to get warm; they should be stored in a cool
place. Coolers packed with ice packs are recommended (most samples must be cooled to 4°C during transit to the laboratory; some are required to be frozen through the use of dry ice). Conversely, samples must not be permitted to freeze unless freezing is part of the preservation protocol.

Biological Sample Collection: Freshwaters
Field Sampling Manual, 2013
118
• Samples must be shipped to the laboratory without delay so that they arrive within 24 hours of sampling. Samples must be analyzed within the time limits set out in Appendix 2
• of this chapter. • The sample collectors should keep their hands clean and refrain from smoking
or eating while working with biological samples. For taxonomic samples: The following is the basic information which must accompany samples:
• Collection site (gazetted name, preferably with latitude and longitude and the sample site number),
• Collection date (using the Y/M/D convention written as "1999 June 12" not 99/06/12!!),
• Sampler's name, • Collection method and details (e.g., net mouth size). All of these data should be recorded in such a way that they will remain legible. Labels inside bottles filled with wet samples should be written with pencil on paper labels designed for this use. As part of the lab taxonomic identification process, verification of taxa by recognized experts should be routine. Voucher specimens should be retained for future reference and reverification. Voucher material should be stored using museum standards for preservation. At present, this is 125 mL Flint glass jars with wide mouth, plastic caps with a plastic gasket and liner. Preservatives should be noted under different sample types.
3.2 Field Quality Control Quality control is an essential element of a field quality assurance program. In addition to standardized field procedures for biological sampling, field quality control requires, at the very minimum, the submission of replicate samples for all variables and reference samples for macro-invertebrate and fish tissue samples. Replicate samples detect heterogeneity within the environment, allow the precision of the measurement process to be estimated, and provide a check on the reproducibility of the sampling. There are many aspects to laboratory QA/QC noted below, and the field and lab aspects typically have to be considered together. One essential component is reference samples. They are used to document the bias of the analytical (laboratory) process. The timing and the frequency of replicate samples are established in the project design and will vary with each project.

Biological Sample Collection: Freshwaters
Field Sampling Manual, 2013
119
3.2.1 Replicate Samples To determine the degree of heterogeneity within the biological community being sampled, it is necessary to take replicate samples. These replicates can consist of multiple samples (grabs, tows, or whole fish) from the same general area (to measure how well a single sample represents the community or how many samples are necessary to achieve some level of sampling confidence), or portions of a single sample (i.e., sectioned grabs - to measure more localized invertebrate heterogeneity).
3.2.2 Split Samples Split samples are aliquots taken from the same container and assumed to be identical. These samples can be sent to two or more laboratories for separate analysis and the results can be used to determine interlab variability of the different laboratories or the consistency of results within one lab.
3.2.3 Reference Samples For tissue samples, laboratory tested and preserved reference materials are available. For example, the National Research Council of Canada has dogfish liver and muscle tissue and lobster hepatopancreas tissue for the determination of trace elements and organomercury. These reference tissues have been subjected to a large number of analyses performed by independent laboratories using several different analytical techniques. Consequently, the NRC provides mean values and confidence intervals for these substances. Other reference tissues are available from other sources. For taxonomy samples, some basic taxonomic reference materials are available. The US EPA is one source of these at least for algal taxonomy, chlorophyll a and some bacterial species. These reference samples should be submitted to the analyzing laboratory along with the samples collected during a field trip. They should be transferred to a regular sample container and labeled with plausible site names and numbers (the codes used for identification must be documented in the field log book).

Biological Sample Collection: Freshwaters
Field Sampling Manual, 2013
120
4. Collecting and Processing Biological Samples
4.1 Lake Biological Samples The collection of deep water samples requires that at least one member of the sampling group be very familiar with boat operation and safety. If the sampling trip involves the use of a boat, then the weather forecast or marine conditions should be obtained prior to departure from home. If conditions are poor, then the sampling trip should be postponed.
4.1.1 Bacteria Samples collected for bacterial analysis are simply grab water samples collected at designated sites. They can be collected at near shore or deep water stations. Deep samples require the use of a Van Dorn bottle for the sample collection (Figure 1). All bacteriological samples must be cooled (to 4°C) as soon as they are collected and must be shipped to the lab as soon as possible. The following are the protocols for collecting shore samples, deep water surface samples, and depth profile samples.
4.1.1.1 Shore Samples To avoid contamination from suspended sediments, the sample collector must wade out past the point where wave action affects the lake bottom. In most cases, this distance is not far from shore. The sampler should not exceed a depth where there exists a reasonable possibility that water might unexpectedly enter the gum-boot or hip-wader. This is particularly important during colder weather when getting wet poses a health risk (such as hypothermia).
PROTOCOL
(shore samples)
(a) Obtain labeled, sterilized, 250 mL bottles and wade into the lake at the most accessible point.
(b) Once you reach a sufficient depth (where bottom material will not
interfere with the sample), stop and orient yourself towards the center of the lake. Often samplers wait standing in place for 2 - 3 minutes to ensure sediment disturbed by wading can settle.
(c) Remove the lid and hold it aside without allowing the inner surface to
touch anything.

Biological Sample Collection: Freshwaters
Field Sampling Manual, 2013
121
(d) With your other hand, grasp the bottle well below the neck. Lean out towards the center of the lake and in one continuous motion plunge the bottle beneath the surface to a standardized depth (two frequently used depth for surface samples are 0.1 m and 0.5 m) and slowly force it through the water until it is entirely full. This motion creates a current over the mouth of the bottle such that water entering the bottle has not come in contact with your hand.
(e) Pour out enough water to provide 2.5 - 5 cm air space above the
sample. Replace the cap immediately. (f) Return to shore and pack the sample in a cooler containing a sufficient
quantity of ice packs (twice the volume of ice to samples in summer months or equal volume when sampling in winter months).
4.1.1.2 Surface Bacteriological Samples at Deep Stations
PROTOCOL (for collecting surface samples at deep stations)
(a) The person at the bow (front) should always collect the samples. This
is because the bow is the anchor point and even in a slow current the boat will drift so that the bow is upstream. This precaution reduces the potential of contamination from the boat or motor. The person in the stern (rear) can be responsible for holding the boat’s position (when not anchored), taking the field measurements, and making field notes, and helping to stabilize boat when bow person is working near gunwales.
(b) Obtain a labeled, sterilized, 250 mL sample bottle and remove the lid
without touching the inner surface of either the bottle or lid.
(c) Reach out an arm length from the boat to take the sample. Ensure that the person in the stern is providing counterbalance (working over the opposite side of the boat).
(d) Plunge the bottle under the surface and move it slowly towards the
current (the direction the boat is facing) until the bottle is entirely full. (e) Pour out enough water to provide a 2.5-5 cm air space above the
sample. (f) Recap the bottle and place in a cooler immediately.

Biological Sample Collection: Freshwaters
Field Sampling Manual, 2013
122
4.1.1.3 Deep Samples Deep samples are usually collected by Van Dorn sampler. Note that Van Dorn samplers are available in both horizontal and vertical configurations. The advantage of the vertical configuration is that the water within the open bottle is flushed out as the bottle is lowered so that one can be guaranteed that the water was collected from the indicated depth. The advantage of the horizontal configuration is that a very narrow depth range is sampled. Vertical configurations are usually used in large lakes. Horizontal configurations are used for samples to be collected at or just above/below a very sharp thermocline, or to be collected near the lake bottom. Horizontal configurations are mandatory for very shallow lakes.
Figure 1. Van Dorn Sampler PROTOCOL
(for taking deep samples)
(a) Open the Van Dorn sampler by raising the end seals. (b) Set the trigger mechanism as in Figure 1. (c) Lower the sampler to the desired depth. Ensure that the dead end of
the rope is tied to the boat.

Biological Sample Collection: Freshwaters
Field Sampling Manual, 2013
123
(d) Send the messenger down to “trip” the mechanism that closes the end seals.
(e) Retrieve the sampler to the surface.
(f) Flush the drain valve with some of the sample water so as to reduce
the possibility that bacteria from previous sample sites will contaminate the current sample. Then, transfer the water sample from the Van Dorn bottle to sterilized, labeled, 250 mL sample bottles via the drain valve. Leave a 2.5-5 cm air space at the top of the bottle. Take care to avoid contact with the drain spout as contamination often occurs at this stage.
(g) Recap the bottle and place in the cooler immediately.
4.1.2 Zooplankton Zooplankton, or planktonic animals, are free floating and suspended in open or pelagic waters. They are generally collected with a conical net (Figure 2) that has a specific mesh size (ranging from as small as 64 µm to as large as 256 µm). Small mesh openings will clog more readily than larger ones, but small organisms will pass readily through larger openings. The mesh size required for a particular lake will depend on the productivity of the lake and the purpose of the study. The size of the mesh and the diameter of the net opening used for each BC Environment project will be clearly outlined in the project design. The preferred net mesh, when appropriate, is 64 µm with a net mouth diameter of 20 cm. The net is lowered to a particular depth and pulled directly up through the water column (known as a vertical tow). Alternatives to the vertical tow are the horizontal and oblique tows in which various strata of the lake are sampled individually (a horizontal tow) or as a composite (oblique tow). These are elaborate techniques that require specialized equipment rigged to the boat and a tow net that has remote open and close capabilities. Unless there is specific need for data from horizontal and oblique tows they are not used. Therefore, the vertical tow is the only protocol that will be mentioned here.

Biological Sample Collection: Freshwaters
Field Sampling Manual, 2013
124
Figure 2. Plankton tow net
PROTOCOL (vertical tow)
(a) Ensure rope is securely fastened at the plankton net opening and that
the dead end is tied to the boat. (b) At the designated site, lower the net to depth outlined in the project
design. Note: The actual distance that the net travels through the water must
be recorded and the total volume of water that passes through the net must be calculated (see Figure 3).
(c) In smaller lakes, haul the net hand over hand with a steady, unhurried
motion at a rate of 0.5 m/s. In large lakes, when long net hauls are conducted, use a davit, meter wheel, and winch.
(d) Once the net is at the surface, wash the net by raising and lowering the
net body below the net mouth in the water. Then squirt de-ionized water against the outside of the netting and from the top downward. This washes any adhered plankton down into the cod-end (removable ‘cup’ at the end of the net).
(e) Disconnect the cod-end and carefully decant the water and plankton
into a pre-labeled bottle. Rinse the cod-end several times, pouring each rinsate into the bottle (this ensures that all plankton are collected).

Biological Sample Collection: Freshwaters
Field Sampling Manual, 2013
(f) Wash the net by rinsing (pulling it through the water without the cod-end). This is an absolute necessity before proceeding to the next sample site (particularly between lakes).
(g) Preserve the sample with 70% ethanol (70mL of 100% ethanol for
each 30 mL of sample volume) and place in the cooler for shipping.
Figure 3. Tow volume calculation
4.1.3 Phytoplankton Phytoplankton collection in the open water of a lake consists of surface and/or deep grab sampling. A Van Dorn bottle is the most common tool for collecting the deep samples.
125

Biological Sample Collection: Freshwaters
Field Sampling Manual, 2013
126
4.1.3.1 Surface Samples PROTOCOL
(for collecting surface phytoplankton samples)
(a) Anchor the boat at the designated sample site (alternatively, if the water is too deep or a buoy is not present, the person in the stern will have to maintain position while the person in the bow takes the samples).
(b) Obtain a labeled, 1 litre sample bottle and remove the lid without
touching the inner surface of either the bottle or lid. (c) Reach out an arm length from the boat to take the sample. Ensure that
the person in the stern is providing counterbalance (working over the opposite side of the boat).
(d) Plunge the bottle under the surface and move it slowly towards the
current (the direction the boat is facing) until the bottle is entirely full. Standard sampling depths for “surface” water samples are 0.1 m and 0.5 m.
(e) Preserve the sample with 3 mL of Lugol’s solution (3-4 mL per 1 litre
of sample). A general guideline is that there be sufficient Lugol’s to turn the sample the colour of weak tea.
Note: Plankton nets for phytoplankton samples are not recommended
for quantitative samples. They are size selective and very non-quantitative. They can be used however for identification of the species present as the larger density assists in the taxonomic work.
4.1.3.2 Deep Samples PROTOCOL
(for collecting deep water samples) (a) Open the Van Dorn sampler by raising the end seals. (b) Set the trigger mechanism as in Figure 1.

Biological Sample Collection: Freshwaters
Field Sampling Manual, 2013
127
(c) Lower the sampler to the desired depth (epilimnion, hypolimnion or thermocline - the location of which should have been determined by prior DO/temperature profile data collection - see Ambient Freshwater Sampling chapter). Ensure that the dead end of the rope is tied to the boat.
(d) Send the messenger down to “trip” the mechanism that closes the end
seals. (e) Retrieve the sampler to the surface. (f) Transfer the water sample from the Van Dorn bottle to labeled, 1 liter
sample containers via the drain valve. (g) Preserve the sample with 3 mL of Lugol’s solution (3-4 mL per 1 liter
of sample). (h) Recap the bottle and place in the cooler.
4.1.4 Benthic Fauna Benthic invertebrates in lakes or large slow moving rivers are generally collected in the same fashion as sediment samples (see Collection of Lake and Stream Bottom Sediment Samples chapter). The processing of the sample once it has been collected is where the techniques differ. The sampling equipment is described in the section titled ‘sediment sampling’, and consequently, will not be discussed here. The type of grab sampler to be used at a particular site will depend on the site conditions and the purpose of the study. The equipment to be used will be dictated by the project design and must be outlined in the field log book and pre-sampling checklist. Figure 4 presents the grab samplers that are available, while Figure 5 presents the core sampler most commonly used.

Biological Sample Collection: Freshwaters
Field Sampling Manual, 2013
Figure 4. Common Sediment Grab Samplers
128

Biological Sample Collection: Freshwaters
Field Sampling Manual, 2013
129
Figure 5. Kajak-Brinkhurst Sediment Core Sampler
4.1.4.1 Grab Sampling PROTOCOL
(boat sampling with a grab sampler)
(a) Ensure that the rope is securely fastened to the sampler and that the dead end of the rope is tied to the boat.
(b) Set the grab sampling device with the jaws cocked open (see
Figure 4). Great care should be taken while dealing with the device while it is set as accidental closure can cause serious injuries.
(c) Lower the sampler until it is resting on the sediment (its own weight is
adequate to penetrate soft sediments). At this point, the slackening of the line activates the mechanism to close the jaws of the Ponar and Petersen grabs.

Biological Sample Collection: Freshwaters
Field Sampling Manual, 2013
130
(d) For the Ekman grab, send the messenger down to ‘trip’ the release mechanism.
(e) Retrieve the sampler slowly to minimize the effect of turbulence (that
might result in loss/disturbance of surface sediments). (f) Place a container (i.e., a shallow pan) beneath the sampler just as it
breaks the surface of the water. Note: If the jaws were not closed completely, the sample must be
discarded. Discard the sample into a bucket if the second collection attempt is made from the same general area. Dump the unwanted sample only after the “real” sample has been successfully collected.
(g) Place a sieve between the sampler and the pan and gently open the
jaws and allow the sediments to empty into the sieve. The size of the sieve mesh will depend on the purpose of the study, but a common mesh size is 0.20 mm (200 µm). This size represents the practical lower limit for general study of benthic organisms. It is not as crucial to have small mesh size when the only analysis to be conducted is biomass.
(h) Immediately record (in the field log book) observations regarding the
appearance of the sediment (i.e., texture, colour, odour, presence of biota, presence of detritus).
(i) Rinse the sieve with de-ionized or on-site water to remove as much
sediment as possible.
(j) Transfer the organisms to a pre-labeled sample bottle and preserve with 70% ethanol.
4.1.4.2 Core sampling PROTOCOL
(boat sampling with a core sampler) (a) Open the valve and set the trigger mechanism (as per Figure 5).
Ensure the rope is securely fastened to the corer and attach the dead end of the rope to the boat.
(b) Lower the corer to approximately 5 m above an area of undisturbed
sediments and then allow it to fall freely into the sediments.

Biological Sample Collection: Freshwaters
Field Sampling Manual, 2013
131
(c) Send the messenger down to release the trigger mechanism. (d) Carefully retrieve the sampler and place a stopper into the bottom
opening before removing from the water to prevent loss of the sample. (e) Remove the liner from the corer and stopper the upper end.
Note: Once on shore, the sample can be treated as a bulk sample or it
can be sectioned and the organisms separated from the sediment in strata.
(f) For bulk samples all the sediment may be sieved as per the grab
samples above. Otherwise, the sediment should be sectioned in regular intervals as it is extruded (record the thickness of each stratum the length of entire core). Each stratum may be sieved and its contents placed in pre-labeled sample bottles or, the unsieved sediments can be placed directly into pre-labeled sample bottles.
(g) Preserve the samples with 70% ethanol.
Note: It is preferable to section the core as soon as possible after it is
retrieved. As the sediment warms, it tends to expand in the core tube. With warming, decomposition gases are liberated at a much faster rate and if they bubble through the core, they will disturb the stratigraphy.
4.1.5 Macrophytes Aquatic plants are collected for one of three purposes: first, biomass studies for the determination of how much plant material is present on an area or lake basis; second, tissue analyses for the detection of metals, pesticides and plant products; or third, taxonomic analyses as part of ecological or impact studies (permanent records of community structure over time) and to serve as reference specimens for the above two analyses. These reference specimens are a valuable scientific record and their collection and subsequent handling should be done with care so that much of the time and expense that has gone into their collection is not wasted. Reference specimens are stored in herbaria which provide permanent records of what was found and allow identifications to be re-verified if necessary. Even when the major thrust of the work is for biomass studies or tissue analyses, representative specimens must still be collected and saved as vouchers of the species that were analyzed. With respect to sampling for taxonomic purposes, Warrington (1994) documents techniques regarding the processing of individual taxa within each of the three groups of aquatic plants (floating, submergent, and emergent). This manual presents a general overview of the protocols for collecting aquatic plants for taxonomic purposes.

Biological Sample Collection: Freshwaters
Field Sampling Manual, 2013
132
4.1.5.1 Taxonomy Generally, the whole plant should be collected. Some groups cannot be identified to species without mature fruits or flowers. Large plants are pressed and mounted on a 30 by 40 cm white card that is dimensionally stable when wetted. Small plants like the duckweeds do not make satisfactory pressed and dried specimens. In this case, small screw cap vials make good collecting and preservation containers.
PROTOCOL
(small floating species collection)
(a) Scoop a few individual plants into a pre-labeled vial. (b) Preserve the specimens in a solution of 70% ethanol, 25% water and
5% formalin. (c) These specimens must be submitted to a herbarium where they will be
identified to species and stored for future reference.
PROTOCOL (collection of large emergent or rigid plants for taxonomic purposes)
(a) Field notes should be written directly on the card stock before you
place the plants onto the card (you will not be able to write on the card once it is wet). The notes should be written in pencil in the lower right hand corner of the card where it will later be covered by the permanent label.
(b) Collect an entire specimen and store it until conditions are appropriate
to mount. Note: Do not leave them out in the sun even briefly as they will
wither very quickly and become useless as specimens. Emergent plants should not be submerged, but kept in a bag with a little water in the bottom to maintain high humidity. It is best to keep each species in its own bag and all the bags from one lake or site together in one large (garbage) bag.
(c) To mount each specimen, lay the plant on the card stock with the roots
in the bottom left corner (fold over the top if it is too tall to fit). Note: Do not cover the label area in the bottom right corner.

Biological Sample Collection: Freshwaters
Field Sampling Manual, 2013
133
(d) Spread out leaves and flowers, turn some over so the bottoms can be seen, and try to make a neat and tidy specimen that covers the whole sheet.
Note: For small plants fill the sheet with more specimens from the
same clump or clone, to show as much variability as possible. (e) For fruiting plants where the seeds may be shed on drying, collect the
seeds into small paper or cellophane pouches and attach these pouches to the finished herbarium sheet.
(f) After mounting the aquatic plant on the card stock, place a piece of
heavy blotting paper on top of the specimen to help dry the plant quickly.
(g) Wrap the card stock, plant, and blotter in a newsprint folder. The
newsprint should be 30 by 90 cm in size and folded in half to form a folder in which the mounted plant is placed.
(h) Once you have accumulated several of these wrapped packages (each
containing one card stock/specimen), place them into a plant press with a piece of corrugated cardboard separating each package.
Note: The corrugations should run in the same direction so that air
flow through the press is facilitated. (i) Drying should take place within several days to prevent fungal growth
and rotting and to preserve colours and shapes as much as possible. If you will be in a laboratory or herbarium the same day, the plant presses may be dried in a proper plant drier or a forced draft oven at 40°C. In the field, use motel hot air registers, baseboard heaters, or hair dryers to move warm air through the corrugated cardboard. If the weather is dry, secure the plant press on the roof of the truck and allow air to blow through the corrugated cardboard as you drive from site to site. As the plants in the presses dry it will be necessary to retighten the presses periodically, at least daily, to maintain the pressure and hold the plants flat.
(j) These specimens must be submitted to a herbarium where they will be
identified to species and stored for future reference.
Biological Sample Collection: Freshwaters
Field Sampling Manual, 2013
134
PROTOCOL (collection of large submergent or
non-rigid plants for taxonomic purposes)
(a) Field notes should be written directly on the card stock before you place the plants onto the card (you will not be able to write on the card once it is wet). The notes should be written in pencil in the lower right hand corner of the card, where it will later be covered by the permanent label.
(b) Collect an entire specimen and store it until conditions are appropriate
to mount.
Note: Do not leave them out in the sun even briefly as they will wither very quickly and become useless as specimens. Keep them in a bag or bucket of water at all times until you are ready to press them. It is best to keep each species in its own bag and all the bags from one lake or site together in one large bag.
(c) Since these plants are flaccid and clump together when removed from
water, they need to be floated onto the card stock and arranged neatly to keep them from becoming a useless mat. Start by slowly lifting the bottom of the card stock out of the water at the root end and arranging and spreading the plant as you continue. Once a portion is out of the water, it will stay in place. Some, but not all, plants will allow a limited amount of rearranging once they are out of the water. Hold the card stock with one corner down and let most of the excess water drain off. Floating is best done in 36 by 50 cm photographic trays or directly in the lake from which the specimen was collected (it will be difficult in lakes if there is any wind or waves). A tray on a picnic table at a site with running water is an ideal mounting and pressing site.
Note: Do not take plants to a different lake to float them onto the card
stock; you risk spreading weeds from lake to lake.
(d) Continue as in (e) through (j) on the previous page.

Biological Sample Collection: Freshwaters
Field Sampling Manual, 2013
135
4.1.5.2 Tissue Analysis Plant tissues may be collected for analyses of metals, pesticides, nutrients, plant products, for dry weight/wet weight ratios, or for other laboratory analyses. In all cases an entire, intact, voucher specimen of each species should be collected and filed in a herbarium as a record of what was analyzed. The procedures outlined above under the section headed Taxonomy (4.1.5.1) should be followed. For analyses of chemicals, it may be necessary to analyze distinct portions of the plant separately to determine where the material is localized in the plant (the portion to be collected will be outlined in the project design).
PROTOCOL
(collecting samples for tissue analysis) (a) Collect entire specimens and keep them submerged and covered until
they can be processed (plants should never be allowed to desiccate). (b) Place each specimen in individual air tight bags (e.g., Zip Lock) or
tissue cups or glass bottles (for analysis of trace organics). Ensure each is fully labeled. Ensure the quantity of tissue and the types of container are appropriate for the analysis that will be conducted (see Appendix 2 of this chapter).
(c) Place the sample container in the required cooler for shipping (some
analyses need to be frozen, therefore, these samples will be placed in a cooler containing a sufficient quantity of dry ice). Always wear gloves when handling dry ice.
4.1.5.3 Biomass Studies Biomass studies, mass of plants per unit area, are not routine and are usually conducted as part of a research project. They are not performed as part of standard sampling programs. They often require the use of SCUBA to map out and harvest the designated area. Refer to Warrington (1994) for further information regarding biomass protocols.

Biological Sample Collection: Freshwaters
Field Sampling Manual, 2013
136
4.1.6 Fish The fish collecting and processing protocols outlined here are designed primarily for the purpose of analyzing tissues for levels of bioaccumulated substances. Since fish are high on the aquatic food chain, analyses of their tissues may provide valuable toxicological information about substances that are difficult to measure in ambient waters (such as mercury). For an extensive review of the common fish capture techniques refer to Chapter 9 of Stream Survey Manual (Koning, 1994), and Fish Collection, Preservation, Measurement and Enumeration Manual (Triton Environmental Consultants, 1994). The various collection techniques discussed here are partially selective in terms of the species and size classes that each captures. Therefore, the particular method to be used will depend on the purpose of the study and will be outlined in the project design. Always note date and time of each net set. It is recommended that depth and bottom type be recorded as well. Note: For collecting fish samples, permits are necessary from the
appropriate agencies.
4.1.6.1 Gill Nets Gill nets are constructed of fine monofilament line suspended between a buoyant ‘float line’ and a non-buoyant ‘lead line’. Nets may be all one mesh size or may be composed of different mesh sizes by joining a series of panels. Panels are generally 15 metres long. The mesh size of a panel is measured by pulling two opposing knots of a mesh-hole tight and measuring the distance. Mesh sizes generally range from 2.5 to 12.5 cm. The size of the mesh chosen will determine the size of the fish that will be caught. There are two types of gill nets; (1) floating gill net - positive buoyancy for capturing surface-dwelling
species , and (2) sinking gill net - negative buoyancy for capturing bottom-dwelling
species. The ends of the net are equipped with a bridle, tether lines, anchors, and buoys. Gill nets can either be set with an anchoring point on shore or with both ends anchored in open water (Figure 6).

Biological Sample Collection: Freshwaters
Field Sampling Manual, 2013
137
shore set net
Figure 6. Various configurations for setting gill nets
PROTOCOL (shore set gill net)
(a) Select a location where there is both an ideal shore line anchoring
point (e.g., a tree, a large rock, a dock etc.) and suitable near shore depth (so the net will not bunch on the bottom). Avoid setting the net near obstacles such as sunken stumps or logs that can entangle and rip nets.

Biological Sample Collection: Freshwaters
Field Sampling Manual, 2013
138
(b) Tie one end of the net to the shore anchor point with a tether line. Load the remainder of the net neatly into the boat.
(c) One person then slowly rows in the direction that the net is intended to
be set while the other person gently feeds the net out. (Hint: If the boat has protuberances, rivets, or sharp edges that will snag the net during deployment, it is advisable to cover these with a sheet of poly film.)
(d) Once the net is at full extension, the anchor is lowered and the buoy
deployed. Attach labeled buoys to the float line at intervals of about 5 meters to warn boaters. Do not set a net near a swimming beach during swimming season, or leave a net unattended near boating lanes.
Note: Ensure that the buoy is well flagged (and preferably labeled to identify the net as part of a BC Environment study).
(e) While kneeling, grab the float line and pull the boat along the net to
check for fish (if the boat is equipped with a motor, raise it to avoid entanglement with the net). Collect any fish encountered. If enough fish have been caught, reverse your path and retrieve the net. (Hint: If there is any wind, it is advisable to retrieve the net against the wind to prevent the boat from drifting over and entangling the net.)
Note: When retrieving the net (after having been set for an appropriate period of time), there is the option of hauling the net in and then removing the catch or, removing the catch first. (Hint: removing the fish before the net is in the boat poses fewer entanglement problems.)
(f) Place captured fish in an ice-filled cooler. Label cooler for the site if
there is more than one capture site. (g) Return to shore and process the fish as per section 4.1.6.4.
PROTOCOL
(gill net - open water)
(a) Load the net neatly in the bow of the boat and proceed to the deployment site (established in the project design). Avoid sunken stumps and logs that can entangle and rip nets.

Biological Sample Collection: Freshwaters
Field Sampling Manual, 2013
139
(b) Anchor one end of the net securely. The person in the bow is responsible for deploying the net while the person in the stern controls the boat (reverse in the direction the net is to be set). (Hint: try to set the net with the wind to prevent the boat from drifting over and entangling the net. Alternatively, you may set against the wind in reverse while under power.)
(c) Gently feed the net out and set the other anchor when the float line is
taut. Attach labeled buoys to the float line at intervals of about 5 meters to warn boaters . Do not set a net near a swimming beach during swimming season, or leave a net unattended near boating lanes.
Note: Both buoys should be well flagged and labeled (indicating the net is part of a BC Environment study).
(d) While kneeling, grab the float line and pull the boat along the net to
check for fish (if the boat is equipped with a motor, raise it to avoid entanglement with the net). Collect any fish encountered. If enough fish have been caught, reverse your path and retrieve the net. (Hint: If there is any wind, it is advisable to retrieve the net against the wind to prevent the boat from drifting over and entangling the net.)
Note: When retrieving the net (after having been set for an appropriate period of time), there is the option of hauling the net in and then removing the catch or, removing the catch first. (Hint: removing the fish before the net is in the boat poses fewer entanglement problems.)
(e) Place captured fish in an ice-filled cooler. Label cooler for the site if
there is more than one capture site. (f) Return to shore and process the fish as per section 4.1.6.4
4.1.6.2 Beach Seining A seine is a panel of netting pulled by bridles at each end (Figure 7). For many smaller seines, the bridle is attached to pulling poles or ‘brails’. The upper line of the seine is equipped with floats and the lower with weights. Beach seines are effective only over shorelines and river bottoms that are free of obstacles such as logs, stumps or large boulders.

Biological Sample Collection: Freshwaters
Field Sampling Manual, 2013
140
Figure 7. Seine net
PROTOCOL (small seines - wading)
(a) One person holds a brail securely against the bottom in ankle deep
water while the second person wades directly out with the other brail. The first person remains stationary while the second pulls the seine to full extension and sweeps around pulling the net back in toward shore (all the while ensuring that the weighted line remains against the bottom).
(b) Both people then pull the net up on shore where the fish are collected. (c) Process the fish as per section 4.1.6.4
PROTOCOL
(large seines - beach seine from boat)
(a) Attach a length of rope to each bridle (the length will be the distance off shore from which the seine net will be pulled).
(b) Tie an anchor to one of the ropes and brace the anchor on shore. Load
the net into the bow of the boat.

Biological Sample Collection: Freshwaters
Field Sampling Manual, 2013
141
(c) The operator of the boat then reverses slowly directly away from shore while the person in the bow feeds the rope out.
(d) Once the end of the rope is reached, the boat operator turns 90° and
proceeds (in reverse) parallel to the beach while the person in the bow of the boat feeds out the net.
(e) Once the end of the net is reached, the boat operator turns back
towards shore while the person in the bow feeds out the rope. (f) The net is retrieved by pulling from both ends at the same rate (this
ensures that the net is not pulled in at an oblique angle). (g) When the net is about 10 m from the beach, the two people then
approach one another as they continue to haul it up on the beach where the fish are collected.
(h) Process the fish as per section 4.1.6.4
4.1.6.3 Set Lines A set line is a heavy line anchored at each end (one anchor having the flag line). It has regularly spaced leaders with hooks. Set lines can be used in situations where the use of nets are not appropriate (such as very deep or fast flowing waters).
PROTOCOL (for set lines)
(a) Bait each hook and load the line carefully into the bow of the boat.
Carefully lower the end of the line (anchor without a buoy or marker line).
(b) The boat operator then slowly reverses in the direction the line is to be
set while the person in the bow carefully feeds out the line (use extreme caution with the hooks).
Note: Never wrap a line around your wrist, arm, or leg due to danger of the line snagging.
(c) Once the end of the line is reached (the other anchor is encountered),
the anchor is lowered using the flag (buoy) line and the boat operator reverses slowly to ensure that the line is taut.

Biological Sample Collection: Freshwaters
Field Sampling Manual, 2013
142
(d) Ensure that the buoy is labeled indicating a BC Environment study. (e) To retrieve the line (generally the next day - outlined in the project
design) haul up the flag line until the first hook is reached, then slowly move in the direction that the line is set as the remaining hooks are hauled into the boat.
(f) Return to shore and process the fish as per section 4.1.6.4
4.1.6.4 Processing Fish Tissues
PROTOCOL (preparation of fish tissue for analysis of trace metals)
(a) Each specimen should be identified, weighed, measured, and scale
samples taken for aging before dissection (see Triton, 1994). Sex should be determined after dissection and maturity commented on if possible (i.e., degree of egg or sperm development).
(b) Wipe specimen clean of mucous and foreign matter with a 4% nitric
acid/de-ionized water solution prior to dissection.
Note: Dissect specimens on cleaned glass or plastic surfaces only. (c) When removing a block of tissue from the specimen, the cutting
instrument (plastic or stainless steel knife) should be wiped clean after each incision using a paper towel soaked with de-ionized water. Use a new paper towel for each specimen dissected. The preferred location on the fish for a sample of muscle tissue is the upper part of the side behind the dorsal fin.
Note: Care should be taken not to cut into the digestive tract during dissection. If the target fish are small, composite tissue samples may be required (this will be identified in the project design).
(d) Remove a minimum of 100 g of muscle tissue and place in a pre-
labeled tissue cup (acid washed, leak-proof plastic containers available from the issuing laboratory). Remove the liver and place in a pre-labeled tissue cup.
Note: Muscle tissue samples should be free of skin and bones. Liver samples must exclude the gall bladder.
(e) Immediately place each tissue cup in a cooler containing ice packs.

Biological Sample Collection: Freshwaters
Field Sampling Manual, 2013
143
(f) The glass or plastic dissecting board should be wiped clean with the 4% nitric acid/de-ionized water solution before proceeding to the next specimen. The acid should be certified pure and a QC check made of the working solution for contamination. An alternative is to use solvent washed aluminum foil as a disposable clean surface (replace after each specimen).
PROTOCOL
(preparation of fish tissue for analysis of organic contaminants)
(a) Each specimen should be identified, weighed, measured, and scale samples taken for aging before dissection. Gender should be determined after dissection, and maturity commented on, if possible.
(b) Wipe specimen clean of mucous and foreign matter with de-ionized
water (stored in a glass container) prior to dissection.
Note: Dissect specimens on glass or stainless steel surfaces only. At no time should the sample come into contact with plastic.
(c) When removing a block of tissue from the specimen, the pre-cleaned (solvent washed, heat treated) cutting instrument should be wiped clean after each incision using a paper towel soaked with de-ionized water. Use a new towel for each specimen dissected.
Note: Care should be taken not to cut into the digestive tract during dissection.
(d) Remove a minimum of 50 g (see Appendix 2 of this chapter) of
muscle tissue and place in a pre-labeled glass container (acetone washed, heat treated at 400°C - available from the issuing laboratory). Remove the liver and place in a pre-labeled glass container.
Note: Muscle tissue samples should be free of skin and bones. Liver samples must exclude the gall bladder.
(e) Immediately place each sample container into a resealable bag (e.g.,
Zip Lock) and then in a cooler with ice packs (or dry ice if sample is to be analyzed for volatile or semivolatile organics).
(f) The dissection board should be wiped clean with de-ionized water
before proceeding to the next specimen.

Biological Sample Collection: Freshwaters
Field Sampling Manual, 2013
144
4.2 River/Stream Biological Samples In some instances, the protocols for collecting biological specimens in rivers are similar to those used for sampling in lakes. But in the case of benthic fauna and fish, the collection techniques are considerably different. The following are the protocols for the collection of biological samples from flowing waters.
4.2.1 Bacteria As is the case for lakes, bacteria are collected as grab samples and immediately cooled to 4°C to minimize metabolic activity (growth/reproduction) until they can be analyzed by the laboratory. Wherever practical, samples should be collected at mid-stream rather than near-shore. Samples collected from mid-stream reduce the possibilities of contamination (i.e., shore effects - back eddies, seepage from near shore soils, etc.). The most important issue to consider when deciding where the sample should be collected from is SAFETY. If the flow is sufficiently slow that the collector can wade into the stream without risk, then the sample can be collected at a depth that does not pose a threat (discretion is the key - never wade into water that appears deep or fast flowing). When conditions dictate that the sample be taken from the stream bank, deviations from the standard protocol should be accurately documented in the field log book and transferred to the database as soon as possible.
PROTOCOL (for wading into flow)
(a) Obtain a labeled, sterile 250 mL bottle and wade into the river
downstream from the point at which you will collect the sample. Wade upstream to the sample site. This ensures that you will not disturb sediments upstream from the sample point.
(b) Stand perpendicular to the flow and face upstream. (c) Remove the lid and hold it aside without allowing anything to touch
the inner surface. (d) With your other hand, grasp the bottle well below the neck. Plunge it
beneath the surface with the opening facing directly down, then immediately orient the bottle into the current.

Biological Sample Collection: Freshwaters
Field Sampling Manual, 2013
145
(e) Once the bottle is full, remove it from the water by forcing it forward (into the current) and upwards. Pour out some water to ensure there is an air space.
(f) Replace the cap immediately. (g) Return to shore and place the sample in a cooler with sufficient ice
packs (twice the volume of ice as the sample in summer, same volume in winter).
PROTOCOL
(for sampling from the stream bank) (when the current is too strong, water is too deep, or ice is too thin)
(a) Secure yourself to a solid object on shore (with a safety harness and
line if necessary). (b) Remove lid from a labeled, sterile 250 mL bottle and place into a clean
resealable bag (e.g., Zip Lock). (c) Hold the bottle well below the neck.
(d) Reach out (arm length only) and plunge the bottle under the water and
immediately orient it into the current. (e) When the bottle is full, pull it up through the water while forcing into
the current. Pour some water out so as to leave an air space. (f) Immediately recap the bottle. (g) Place the sample in a cooler with sufficient ice packs (twice the
volume of ice as the sample in summer, same volume in winter). Note: If conditions are such that sampling from a bridge is an option,
refer to the chapter, Ambient Freshwater and Effluent Sampling, 4.2.2, for the protocol.

Biological Sample Collection: Freshwaters
Field Sampling Manual, 2013
146
4.2.2 Periphyton Periphyton are defined as attached species of microflora (algae) and are primarily found on hard, immobile surfaces such as large stones (cobbles, boulders) and on aquatic plants. Analysis of periphyton communities, particularly for the purpose of biomass calculations, involves collecting the algae from a known surface area. To do so, the following pieces of equipment are required:
• A piece of equipment to outline a known surface area and contain the removed biomass - for example, a toilet bowl plunger that has had the handle insertion hole cut larger. The diameter of the hole is known, therefore the surface area of the exposed rock below the hole is known. A rim of neoprene is glued around the hole to prevent water and algae from escaping when collecting the sample. It is also possible to use a template if the algal mass is gelatinous or coherent enough to be picked off the growing surface. A template is a piece of flexible rubber or plastic with a square or round hole cut in it to define the area to be scraped.
• A water bottle (squirt bottle) containing de-ionized water • A tooth brush (to scrape the algae free from the rock) • A turkey baster (to transfer the sample from the scraping cup to the sample
bottle • Pre-labeled sample bottles • Ethanol
PROTOCOL (natural substrate)
(a) Choose a location of fairly uniform substrate over wetted width. Try to work
in upstream but random direction. Select rocks that are relatively flat and large enough to accommodate at least three scraping cups. Unless the project design states that rocks with the most dense growth are to be sampled, the sample collector should select the rocks randomly. To do so, the collector should not specifically look for an area from which to sample, but instead should wade into the water and stop without regard for apparent algal concentration and then grab the first rock that is suitable for scraping. Return to shore with the selected rock and repeat the process until 3 or 4 rocks are collected. Don’t attempt to lift rocks that are too heavy and don’t enter water that may pose a threat to your safety. Watch your footing while returning to shore with the rock.
(b) Hold the scraping cup firmly over a selected patch on a rock. Squirt some de-
ionized water into the cup. With the tooth brush, scrape the algae (within the cup) off the rock. Each new algal patch that is scraped can be referred to as a disc.

Biological Sample Collection: Freshwaters
Field Sampling Manual, 2013
147
(c) Transfer the water-algae mixture to a pre-labeled bottle (a turkey baster with the tip cut off works very well as the transfer tool). Do not remove the cup yet.
(d) Squirt some fresh de-ionized water into the cup, re-scrape and collect the
rinsate. At this point you have collected one disc. Collect and composite more discs until you have transferred a sufficient quantity of algae to the sample bottle [see (e)].
(e) If algal density is low or patchy, collect at least five discs from each rock. If
algal density is high or homogeneous, then take fewer discs per rock, but ensure that you use at least five rocks to characterize the periphyton at the site. Always record the total number of discs collected.
(f) If the sample is to be analyzed for biomass, place the bottle in a black garbage
bag and then immediately into a cooler that contains a sufficient quantity of ice packs (twice the volume of ice as the total sample when sampling in summer, equal volumes when sampling in winter).
(g) For measurement of biomass, the samples are prepared for chlorophyll
analysis by filtering the sample onto a membrane filter (0.45 or 1.0 μ pore size), then folding this filter and placing it inside a larger (8 to 10 cm.) Whatman type paper filter labeled (date, site, area scraped), then clipped with a plastic paperclip and placed into a jar with desiccant and placed in the freezer or in a cold cooler for shipment to the lab.
Note: In washing and transferring the sample, keep the volume of water used to a minimum. Filtering periphyton samples can be very difficult due to suspended sediments that generally accompany the periphyton.
It may be necessary to use a larger pore size filter than for phytoplankton (typically 0.45 µ). Periphyton cells are typically much larger than phytoplankton. An analysis of the filtrate from the periphyton sample will indicate if significant biomass is passing through the larger filter size chosen.
(h) If the samples are to be analyzed for taxonomy (only two or three discs are
required), then the sample must be preserved with Lugol’s solution. Use at least 1 mL of Lugol’s per 250 mL of sample (with heavy biomass, more preservative is needed). No filtration is required. Tip once or twice to mix preservative and sample water.

Biological Sample Collection: Freshwaters
Field Sampling Manual, 2013
148
(i) Different conditions or circumstances may require different methods than described here. Other methods are acceptable as long as they are described and documented and approved by Ministry authority. For example, where heavy periphyton growth occurs, a method for sampling heavy growth could use a template disc to define a sampling area and scrape the area around it, then remove the disc of periphyton with a scalpel. This method reduces the volume of wash water that must be used and potential clogging of filters.
4.2.3 Benthic Fauna (macro-invertebrates) Samplers used for the collection of invertebrates in the shallow portions (<one metre deep) of rivers or streams fall into two categories: those sampling natural substrates, and those using artificial substrates. Two of the more common samplers used for natural substrates are the Surber and Hess samplers (Figure 8). The Drift net sampler can also be used to collect the emerging or drifting invertebrate stages. Natural Substrate. The advantage of these types of sampler is that the sample reflects the natural community of the stream. The disadvantages are that such samples have a very high variability and many samples need to be taken to characterize the benthic community. The large number of samples necessary generally means relatively high cost. The recommended mesh size is 210 µm (microns) for most samples. In some specialized studies a different mesh size may be appropriate. It may be appropriate to collect the samples using a 210 µm mesh size but to do a preliminary sieving at 500µ. The sample material retained on the 210 µm mesh is stored to be processed later if the program design calls for it.
Drift net sampler

Biological Sample Collection: Freshwaters
Field Sampling Manual, 2013
149
Surber sampler
Hess sampler
Figure 8. Common benthic macro-invertebrate samplers
4.2.3.1 Surber Sampler The Surber sampler consists of two interlocking frames that support a capturing net. One frame outlines the area of stream bed to be sampled while the other supports the net. The sampler is intended for use in shallow (30 cm or less) flowing waters. Use A1 tent pegs (hooked) to anchor surber in fast moving water. Repetitive sampling should be timed (i.e., 5 minutes each for more uniform sampling).

Biological Sample Collection: Freshwaters
Field Sampling Manual, 2013
150
PROTOCOL (Surber sampler)
(a) Choose a wetted width location where substrate is fairly uniform. Provide a
description of general habitat (e.g., is this a run, pool or riffle section, etc.). Position the sampler securely at a random location on the stream bottom parallel to water flow with the net portion down-stream. The mesh size of the net should be compatible with the goal of the program.
Note: Take care not to disturb the substrate upstream from the sampler.
(b) Carefully turn over and lightly rub all rocks and large stones that lie within the frame. This process dislodges organisms that are clinging to the stones. Examine each large stone for organisms, including larval or pupal cases, that may be clinging to the stone before discarding (downstream or to the side of the sampler). In order to maintain comparability between stations, a limit on time spent on handling and rubbing the substrate should be set (5 minutes recommended).
(c) Stir remaining gravel with your hands to a depth of 5 to 10 cm. (d) Move the sampler upstream to a new randomly selected patch of stream
bottom and repeat steps (a) through (c). Continue this process until five patches of stream bottom have been sampled, each upstream from the last. This creates a composite of the five samples. The total area sampled will depend on the size of the sampler (x 5) and should be calculated and recorded in the field log book.
(e) Return to shore and carefully invert the net into a shallow pan containing
stream water. Ensure all invertebrates are rinsed from the net into the pan. (f) Transfer the organisms into a pre-labeled plastic sample bottle and preserve
with 70% ethanol. Rinse sample net after each use.
4.2.3.2 Hess Sampler The Hess sampler is a metal cylinder with a screened opening on one side and an opposite opening with a net attached (Figure 8). The sample collector places the Hess sampler in the stream with the screen oriented into the current and the net trailing behind. The water is able to flow freely through the sampler and out through the net. With a known radius, the stream bed area that is sampled is easily calculated. This value must be recorded in the field log book.

Biological Sample Collection: Freshwaters
Field Sampling Manual, 2013
151
PROTOCOL (Hess sampler)
(a) Position the frame securely on the stream bottom. Ensure the screened
opening is facing into the current and the net portion is trailing down-stream. Hold the sampler in position by applying pressure with your knees.
Note: Take care not to disturb the substrate upstream from the sampler.
(b) Reach into the cylinder and carefully turn over and lightly rub all rocks and
large stones. This process dislodges organisms that are clinging to the stones and washes them into the net. Examine each stone for organisms, including larval or pupal cases, that may be clinging to it before discarding it outside of the cylinder. In order to maintain consistency between samples, a standard time should be assigned to sampling each site (5 minutes recommended).
(c) Stir remaining gravel with your hands to a depth of 5 to 10 cm. (d) Move the sampler upstream to a new patch of stream bottom and repeat steps
(a) through (c). Continue this process until five patches of stream bottom have been sampled, each upstream from the last. This creates a composite sample of the five areas.
(e) Return to shore and carefully wash the contents of the net into the cod-end
then transfer to a shallow pan. Ensure all invertebrates are rinsed into the pan. (f) Transfer the organisms into a pre-labeled sample bottle and preserve with
70% ethanol. Rinse sample net after each use.
4.2.3.3 Drift Net Sampler Drift net samplers are designed to be anchored in flowing water to capture macro-invertebrates that have migrated or have been dislodged from the bottom surfaces into the current. They are limited to use in small, shallow streams. Ideally, drift nets should span the entire width of the stream that is being sampled. Several nets can be placed across the stream channel to capture all drift organisms and to measure spatial variation in the drift.

Biological Sample Collection: Freshwaters
Field Sampling Manual, 2013
152
PROTOCOL (Drift Net sampler)
(a) Anchor drift nets in water sufficiently shallow that they will extend above
the water surface. Set drift net samples for the time specified by the project design (the length of time is designed to collect a representative sample, but not so long that flow through the nets becomes impaired by clogging from captured particulate matter).
(b) Transfer the organisms into pre-labeled sample bottles. (c) Preserve with 70% ethanol and place in cooler. Initial fixation may be
done with 10% formalin. (d) Record time, area of net opening, stream discharge per unit time (see the
Ambient Fresh Water and Effluent Sampling chapter, 6.7), and volume of water filtered in the field log book.
Artificial substrates. The above techniques sample the benthos directly from the natural substrate. Another technique is to use artificial substrate and to place it in the stream so it is colonized by the organisms in the stream then removed later and the community analyzed. These types of samplers are best suited for upstream/downstream studies or studies designed to test for changes over time. They do not necessarily provide a representative sample of the actual community which is living in the stream. There are advantages and disadvantages to artificial substrates. Advantages: • Allow collection of samples from locations that can't be sampled because
of substrate or depth • Reduced variability • Non-destructive sampling of a location • Flexibility in sampling design Disadvantages: • Colonization rates differ from site to site • Species in sampler may be different than stream bottom • Long incubation/exposure times (6-10 weeks) • Vulnerability of samplers to vandalism

Biological Sample Collection: Freshwaters
Field Sampling Manual, 2013
153
The most frequently used artificial substrate sampler is the "barbecue basket" sampler. The basket sampler is fabricated by filling the basket (available in a number of variations from hardware stores) with gravel (2.5 to 7.5 cm diameter) that is then placed in the stream bottom. The substrate becomes colonized and is removed after some predetermined length of time.
PROTOCOL (basket sampler)
(a) Place the basket sampler in the stream and anchor if necessary. Leave in
place for the necessary colonization time.
(b) When the samplers are removed, take particular care not to dislodge organisms from the sampler. A general technique is to carefully place the basket sampler in a plastic bag underneath the water before it is lifted out.
(c) Record time, any site related data such as flow, temperature and pH (see
the Ambient Freshwater and Effluent Sampling chapter), and data about the appearance and condition of the basket sampler in the field log book.
(d) In the lab, remove the animals from the sampler by carefully washing each
rock into a sieve. Transfer the organisms into pre-labeled sample bottles. Preserve with 70% ethanol and place in cooler. Initial fixation may be done with 10% formalin before transfer to ethanol for longer term storage.
4.2.4 Macrophytes Due to the similarity in the techniques, refer to 4.1.5 (in lake sampling) for the protocols for collecting and processing macrophytes in rivers.
4.2.5 Fish All methods of collecting fish specimens in flowing waters can be dangerous (i.e., while nets or lines are being deployed in a current there is the possibility of becoming entangled or hooked). Consequently, it is an absolute requirement that, when sampling for fish, there must be at least one person who has extensive experience with the operation of a boat and the use of fishing equipment in flowing waters. Record time and date of set and retrieval to compute catch effort.

Biological Sample Collection: Freshwaters
Field Sampling Manual, 2013
154
4.2.5.1 Gill Nets When setting gill nets in flowing waters, two factors must be considered: the flow must be sufficiently slow that the net does not get dragged downstream, and the river must be deep enough that the net does not bunch on the bottom. Consequently, this technique is limited to large rivers in reaches where the current is very low.
PROTOCOL (shore set net)
(a) Select a location where there is an ideal shore line anchoring point (e.g., a
tree, a large rock, a dock, etc.), suitable river depth, and slow current. Avoid setting the net near obstacles such as sunken stumps or logs that can entangle or tear nets. One good location for migrating fish is at a sharp bend or point
(b) Tie one end of the net to the shore anchor point. Load the remainder of
the net neatly into the boat. (c) The person in the bow gently plays the net out while the boat is allowed to
drift out with the current (the tension on the float line keeps the boat under control). The boat operator (who must be experienced with boat operation and safety in flowing waters) should idle the boat in neutral and must remain ready to power up the motor or control direction if the conditions dictate.
(d) Once the net is at full extension, the boat operator idles into the current so
that the boat remains stationary while the other person lowers the anchor and deploys the buoy.
Note: Ensure that the buoy is well flagged (and preferably labeled to identify the net as part of a BC Environment study). Do not set the net near a swimming beach during swimming season or in boating channels.
(e) While kneeling in the bow of the boat, grab the float line and pull the boat
along the net into the current (if the boat is equipped with a motor, haul it up to avoid entanglement). Collect any fish encountered. Return to the end of the net and haul it in.

Biological Sample Collection: Freshwaters
Field Sampling Manual, 2013
155
Note: When retrieving the net (after having been set for an appropriate period of time) there is the option of hauling the net in and then removing the catch or, removing the catch first. (Hint: removing the fish before the net is in the boat poses fewer entanglement problems).
(f) Euthanize the captured fish and store them in an ice-filled cooler. Label
the cooler for the site if there is more than one capture site. (g) Process the fish as per 4.1.6.4.
4.2.5.2 Seining In larger rivers where there are areas of slow flow, beach seining as described for lakes is possible. Otherwise, seine nets can be used in shallow creeks to capture small fish.
PROTOCOL
(beach seining in large rivers - wading) (a) One person holds a brail securely against the bottom in ankle deep water
while the second person wades out with the other brail. The first person remains stationary while the second pulls the seine to full extension and sweeps around into the current then pulls the net back in toward shore (all the while ensuring that the weighted line remains against the bottom).
(b) Both people then pull the net up on shore where the fish are collected. (c) Process the fish as per 4.1.6.4.
PROTOCOL (creek seining)
(a) Position the net across the width of the stream. (b) One person holds it securely in place while the other person enters the
creek upstream and moves towards the net while kicking up rocks. (c) Each person then grabs a brail and lifts the net while swinging it into the
current and clear of the water in a scoop-like fashion. (d) Process the fish as per 4.1.6.4.

Biological Sample Collection: Freshwaters
Field Sampling Manual, 2013
156
Note: If the fish are too small to process in the field, they may have to be submitted as whole specimens (outlined in the project design). Non-target species should be enumerated, measured and sexed and returned to the water.
4.2.5.3 Set Lines A set line is an ideal option in faster flowing waters where nets are not feasible. They are best set in the main current.
PROTOCOL
(Set lines) (a) Bait each hook and load the line carefully into the bow of the boat. (b) The boat operator then orients the boat into the current and powers up to
maintain a stationary position. The person in the bow carefully deploys the anchor.
(c) The boat operator then powers down such that the boat starts to move
slowly backwards with the current while the other person plays out the line (use extreme caution with the hooks). The boat operator must be ready to power up to relieve tension on the line should a problem arise.
Note: Never wrap a line around your wrist, arm, or leg due to danger of the line snagging.
(d) Once the end of the line is reached (the other anchor is encountered), the
anchor is lowered using the flag (buoy) line. (e) Ensure that the buoy is labeled indicating a BC Environment study. (f) To retrieve the line (generally the next day - outlined in the project
design), the person on the bow hauls up the flag line until the first hook is reached, then the boat operator slowly powers up into the current while the remainder of the line is hauled up.
(g) Process the fish as per 4.1.6.4.
4.2.5.4 Electrofishing Electrofishing is potentially dangerous, consequently, BC Environment requires that all government employees be certified before using this technique (Electrofishing Policy and Procedures Course).

Biological Sample Collection: Freshwaters
Field Sampling Manual, 2013
157
Electrofishing is an ideal tool in smaller streams where the bottom is uneven or there are obstructions that make conventional collecting techniques difficult. It can be used either to stun the fish so that they can be collected with a dip net, or, to scare the fish ahead of the electrical field into a net (seine) that spans the width of the stream.
PROTOCOL
(Electrofishing) Note: All members of the sampling team must be certified through the
Electrofishing Policy and Procedures Course. (a) Follow the manufacture’s directions for storage, transport, operation, and
maintenance of the specific shocking device available to you. (b) Set a net the width of the creek downstream from where you begin
electrofishing. (c) Work toward the net until a sufficient number of fish have been trapped. (d) Collect and process as per 4.1.6.4.
Note: If the fish are too small to process in the field, they may have to be submitted as whole specimens (outlined in the project design).
(e) Note effort required to collect fish (as an index of catch per unit effort)
and the instrument settings for the stream conditions. (f) For the recorded notes, approximate fishing area (i.e., length and width of
stream).
5. Shipping The day’s sampling schedule must be designed to ensure that the samples arrive at the shipping agency’s terminal well before the end of business hours. Since some variables have very limited hold times (Appendices 2 and 3 of this chapter), every effort must be made to avoid delays in shipping. The following is the procedure to be followed to maintain the integrity of the samples during transit.
Note: Generally, all samples, except those for bacteriological and taxonomic identification, should be securely packed in large coolers. Bacteriological samples are typically packed in a smaller cooler. Taxonomy samples should be preserved and do not require cooling during shipment.

Biological Sample Collection: Freshwaters
Field Sampling Manual, 2013
158
PROTOCOL (shipping)
Note: Ice packs should be used as opposed to loose ice or bagged ice. When loose
ice melts, the contents of the cooler are free to shift, potentially allowing contamination of samples with melted ice water and/or breakage of glass bottles.
(a) Pack the samples upright in the cooler with at least 1 (winter) to 2 (spring, summer,
fall) times as much ice as the total volume of the samples. Ensure that the glass containers are separated from each other by ice packs, plastic bottles or clean packing material to prevent them from shifting, falling over and/or breaking. For some analyses, tissues need to be hard frozen - dry ice is needed.
(b) Complete the laboratory requisition forms, enclose them in a sealed plastic bag, and
place them in the cooler on top of the samples. The recommended minimum information that should accompany samples to the laboratory (on each requisition form) includes:
• Name of the source, • Site name • EMS site numbers • Date and time of collection • Name of collector • Field measurements • Comments on sample appearance, weather conditions, and any other
observations that may assist in interpreting data.
(c) Seal the cooler with heavy duty packing tape to reduce the possibility of it accidentally opening and to prevent tampering with the samples. Coolers arriving at the laboratory with torn or absent tape alert the lab staff that tampering might have occurred during transit.
(d) Attach a label prominently displaying the destination.
6. Sources of Further Information
American Public Health Association, American Water Works Association, Water Environment Federation. 1992. Standard Methods for the Examination of Water and Wastewater. 18th edition. Edited by: Greenberg, A.E., Clesceri, L.S., Eaton, A.D., and Franson, M.A.H. Published By: American Public Health Association.

Biological Sample Collection: Freshwaters
Field Sampling Manual, 2013
159
Clark, M.J.R., Shera, W.P. (Editors). 1985. Methods for Aquatic Data Collection in British Columbia: A Catalogue. BC Ministry of Environment, Victoria, BC.
EVS Consultants. 1993. Guidelines for Monitoring Benthos in Freshwater Environments.
Prepared for Environment Canada, North Vancouver. 81 p. Kerans, B.L., J.R. Karr, and S.A. Ahlstedt. 1992. Aquatic invertebrate assemblages:
Spatial and temporal differences among sampling protocols. J. North Am. Benth. Soc. 11: 377-390.
Klemm, D.J., P.A. Lewis, F. Fulk, and J.M. Lazorchak. 1990. Macroinvertebrate field
and laboratory methods for evaluating the biological integrity of surface waters. USEPA. EPA/600/4-90/030. 246 p.
Horner, R., Bloom, N., Crecelius E., and Brown, S. 1991. Recommended Protocols for
Measuring Conventional Water Quality Variables and Metals in Fresh Water of the Puget Sound Region. In: Puget Sound Estuary Program, Recommended Guidelines for Measuring Selected Environmental Variables in Puget Sound.
Koning, W. 1994. Stream Survey Manual. Ministry of Environment, Lands and Parks.
Government of British Columbia. Draft. Lenat, D.R. 1988. Water quality assessment of streams using a qualitative collection
method for benthic macroinvertebrates. J. North Am. Benth. Soc. 7:222-223. McDonald, L.E. 1991. Guidelines for sampling benthic invertebrates in streams. BC
Environment, Environmental Protection. Draft 4, 7p. Peden, A.E. 1976. Collecting and Preserving Fishes. Museum Methods Manual 3. British
Columbia Provincial Museum. Rosenberg, D.M. 1978. Practical sampling of freshwater macrozoobenthos: A
bibliography of useful texts, reviews, and recent papers. Fisheries and Marine Service, Western Region, Technical Report 790 18p.
Triton Environmental Consultants. 1993. Fish Collection, Preservation, Measurement and
Enumeration Manual. First Draft Edition. Prepared for AITF of the Resources Inventory Committee. 97 p.
U.S. Geological Survey. 1993a. Guidelines for the processing and quality assurance of
benthic invertebrate samples collected as part of the National Water-Quality Assessment Program. Open-File Report 93-407.

Biological Sample Collection: Freshwaters
Field Sampling Manual, 2013
160
U.S. Geological Survey. 1993b. Methods for sampling fish communities as part of the National Water-Quality Assessment Program. Open-File report 93-104
U.S. Geological Survey. 1993c. Methods for collecting benthic invertebrates as part of
the National Water-Quality Assessment Program. Open-file Report 93-406. U.S. Geological Survey. 1993d. Methods for collecting algal samples as part of the
National Water-Quality Assessment Program. Open-file Report 93-409. U.S. Geological Survey. 1993e. Methods for characterizing stream habitat as part of the
National Water-Quality Assessment Program. Open-file Report 93-408. Warrington, P. 1994. Collecting and Preserving Aquatic Plants. Water Quality Branch.
Environmental Protection Department. Ministry of Environment, Lands and Parks. Government of British Columbia.
Wetzel, R.G., and Likens, G.E. 1991. Limnological Analysis. Second edition. Springer -
Verlag, New York.
7. Revision History October 11, 2013: This section republished without change. Appendix 2 - Sample
containers, StorageTM, Preservation and Holding Times and Appendix 3 - Laboratory Sample Container, Preservation, and Hold Times for Fresh Water Biological Sampling updated.
February 28, 2001: This section republished without change. Note added to Appendix
2 requiring use of glass or Teflon™ containers for samples to be analyzed for mercury
November 1996: Initial publication.

Biological Sample Collection: Freshwaters
Field Sampling Manual, 2013
161
Appendix 1 Generic Field Checklist (including water, sediments, biota and effluents)
General: Log Books ____ Pencils ____ Cooler (with ice packs) ____ Felt Markers (waterproof) ____ Rope ____ Tape ____ Camera (film) ____ Requisition forms ____ Way bills ____ Shipping labels ____ De-ionized water (4L) ____ Squirt bottle ____ Resealable bags ____ Ice packs ____ Dry Ice ____ Labeled Sample Bottles: General chemistry (1 L) # ____ General chemistry (2 L) # ____ Dissolved Metals # ____ Total Metals # ____ Total Organic Carbon # ____ Low-level nutrients # ____ Coliforms # ____ Sediments # ____ Zooplankton # ____ Phytoplankton # ____ Periphyton # ____ Invertebrates # ____ Tissue cups # ____ Macrophytes ____ Extras - two of each Sampling Equipment (clean, in working order, batteries charged): DO Sampler (BOD bottle, Winkler reagents) ____ Thermometer ____ DO meter ____ pH meter ____ Conductivity meter ____ Hydrolab ____ Secchi disc ____ Van Dorn, rope ____ Through Ice Sampler ____ Auger (bit sharpened, skimmer) ___ Spare probe membranes (repair kit) ____ Sediment grab ____ Sediment corer ____ Sieves ____ Zooplankton tow nets ____ Benthic invertebrate sampler (Hess, drift net, Surber) ____ Periphyton kit (cup, denture brush, baster) ____ Macrophyte sample kit (buckets, garbage bags, float tray, plant press, blot paper, herbarium
sheets, newsprint, corrugated cardboard) ____ Electrofishing equipment ____ Fish nets ____

Biological Sample Collection: Freshwaters
Field Sampling Manual, 2013
162
Filtration and Preservation Equipment: Filter Pots ____ Syringe(s), Hose ____ Tweezers ____ 0.45 µ Sartorius filter papers ____ Preservative Vials ____ Disposal Container (for used vials) ____ 70% ethanol ____ Formalin _____ Lugol’s solution ____ Magnesium carbonate ____ Boat Equipment: Canoe (or boat) ____ Paddles ____ Motor ____ Fuel ____ Life jackets ____ Rope ____ Anchor ____ Tool kit ____ Personal Gear: Lunch ____ Survival suit ____ Rain gear ____ Gum boots ____ Waders (hip, chest) ____ Sun screen ____ Flash light ____ Safety: WHMIS guidelines ____ First Aid Kit ____ Goggles (or safety glasses) ____ Rubber gloves ____

Biological Sample Collection: Freshwaters
Field Sampling Manual, 2013
163
Appendix 2 Lab Sample Container, Preservation, and Hold Times for Sediments and Tissues
STORAGE CONTAINER MAXIMUM TYPE OF ANALYSIS TEMP(3) TYPE PRESERVATION HOLD TIME(4) SEDIMENTS, TISSUES INORGANIC Bromide / Chloride / Fluoride no req. P, G none unlimited Cyanide (WAD / SAD) ≤6ºC P, G store in dark, 14 d field moist Hexavalent Chromium ≤6ºC P, G store field moist 30 / 7 d Metals, Total no req. P, G none 180 d Mercury, Total no req. P, G none 28 dMoisture ≤6ºC P, G none 14 d pH no req. P, G none 365 d Sulfide ≤6ºC P, G store field moist 7 d TCLP - Mercury no req. P, G none 28 / 28 dTCLP – Metals no req. P, G none 180/180d ORGANICS Carbon (TC, TOC) ≤6ºC P, G none 28 d no req. P, G dried stage unlimited Chlorinated and ≤6ºC G none 14 / 40 Non-chlorinated phenolics Dioxins / Furans ≤6ºC G none unlimited Extractable Hydrocarbons ≤6ºC G none 14 / 40 (LEPH, HEPH, EPH) Glycols ≤6ºC G none 14 / 40 Herbicides, Acid Extractable ≤6ºC G none 14 / 40 Oil and Grease / Mineral Oil and ≤6ºC G none 28 d Grease / Waste Oil Content Pesticides (NP, OP, OC) ≤6ºC G none 14 / 40 Polychlorinated Biphenyls (PCBs) ≤6ºC G none unlimited Polycyclic Aromatic ≤6ºC G none 14 / 40 Hydrocarbons (PAHs)

Biological Sample Collection: Freshwaters
Field Sampling Manual, 2013
164
Resin Acids, Fatty Acids ≤6ºC G none 14 / 40 TCLP - Volatile Organic ≤6ºC G none 14 / 14 Compounds TCLP - Semi-Volatile Organic ≤6ºC G none 14 / 40 Compounds Volatile Organic Compounds ≤6ºC G none 7 (6) / 40 (VOC, BTEX, VH, THM) BIOTA INORGANICS Metals, Total freeze P, G none 2 years (≤ -18ºC) Mercury, Total freeze P, G none 1 years (≤ -18ºC) ORGANICS Semi-Volatile Organic freeze G, PTFE none 365 / 40 Compounds (≤ -18ºC) Volatile Organic Compounds freeze G, PTFE none 14 d (≤ -18ºC) LEGEND P = plastic G = glass Tf = Teflon(™) B = Baked T = Tissue Cup no req = no requirement Solv = solvent cleaned A = amber Fc = foil lined cap W = wide mouth *NOTE: glass or Teflon™ containers must be used if mercury is to be analyzed. 3 Storage temperature applies to storage at the laboratory. For all tests where refrigeration at ≤6°C is required at the
laboratory, samples should be packed with ice or cold packs to maintain a temperature of ≤10°C during transport to the laboratory. The storage of ≤8°C for microbiological samples applies during storage at the laboratory and during transport to the laboratory. To prevent breakage, water samples stored in glass should not be frozen. Except where indicated by "do not freeze", test results need not be qualified for frozen samples.
4 Hold Times: Single values refer to hold time from sampling to analysis. Where 2 values are given, the first is hold time from sampling to extraction, and the second is hold time from extraction to analysis.
6 Methanol extraction or freezing must be initiated within 48 hours of arrival at lab, to a maximum of 7 days from sample collection. Alternatively, samples may be frozen in the field if extracted within 14 days of sampling, or may be methanol extracted in the field.

Biological Sample Collection: Freshwaters
Field Sampling Manual, 2013
165
Appendix 3 Laboratory Sample Container, Preservation, and Hold Times for Fresh Water Biological Sampling
STORAGE CONTAINER MAXIMUM TYPE OF ANALYSIS TEMP(3) TYPE PRESERVATION HOLD TIME(4) MICROBIOLOGICAL PARAMETERS Coliforms, Total, Fecal <8ºC, do Ster P or G Na2S2O3 30 hours(5) and E. coli not freeze Cryptosporidium, Giardia <8ºC, do Ster P or G Na2S2O3 96 hours not freeze Enterococcus <8ºC, do Ster P or G Na2S2O3 30 hours(5)
not freeze Heteroprophic Plate Count <8ºC, do Ster P or G Na2S2O3 24 hours not freeze TOXICITY Daphnia, Chronic 21 day/ 4±2ºC P, G collect with no headspace 5 d Chronic EC25 (non-toxic) Daphnia, LC50 / LT50 4±2ºC P, G collect with no headspace 5 d (non-toxic) Microtox 4±2ºC P, G collect with no headspace 3 d (non-toxic) Trout, LC50 4±2ºC P, G collect with no headspace 5 d (non-toxic) Trout, LT50 4±2ºC P, G collect with no headspace 5 d (non-toxic) LEGEND P = plastic Ster = sterile W = wide mouth 3 Storage temperature applies to storage at the laboratory. For all tests where refrigeration at ≤6°C is required at the
laboratory, samples should be packed with ice or cold packs to maintain a temperature of ≤10°C during transport to the laboratory. The storage of ≤8°C for microbiological samples applies during storage at the laboratory and during transport to the laboratory. To prevent breakage, water samples stored in glass should not be frozen. Except where indicated by "do not freeze", test results need not be qualified for frozen samples.

Biological Sample Collection: Freshwaters
Field Sampling Manual, 2013
166
4 Hold Times: Single values refer to hold time from sampling to analysis. Where 2 values are given, the first is hold time from sampling to extraction, and the second is hold time from extraction to analysis.
5 Samples received from remote locations more than 48 hours after collection must not be tested.

PART D SOIL AND SEDIMENT SAMPLING
©Her Majesty the Queen in Right of the Province of British Columbia
2013 All Rights Reserved

COMPOSTED MATERIALS SAMPLING
©Her Majesty the Queen in Right of the Province of British Columbia
2013 All Rights Reserved

Composted Materials Sampling
Field Sampling Manual, 2013
167
Table of Contents
1. INTRODUCTION ................................................................................................. 168 2. SAMPLING AND ANALYSIS REQUIREMENTS ................................................ 168 3. TRACE ELEMENTS ........................................................................................... 169
3.1 Trace Element Concentration Codes .................................................................. 169
4. PH............... ........................................................................................................ 169 5. SAMPLING PROCEDURES ............................................................................... 169 6. PRODUCT MATURITY ....................................................................................... 170
6.1 Reheating Test ....................................................................................................... 170 6.2 Ratio Between Organic Solids and Mineral Solids ............................................ 170
7. FOREIGN MATTER CONTENT .......................................................................... 171 8. REVISION HISTORY .......................................................................................... 171

Composted Materials Sampling
Field Sampling Manual, 2013
168
1. Introduction This document sets out the sampling requirements for composted material, specified under terms of the
PRODUCTION AND USE OF COMPOST REGULATION B.C. Reg.334/93 Deposited September 30, 1993.
2. Sampling and Analysis Requirements The compost product must be sampled and analyzed as follows:
A sample of compost produced at each composting facility must be analyzed at intervals of at least every 1000 tonnes of compost produced or once in 3 months, whichever comes first, for: Parameter Unit Total Nitrogen % dry weight Total Phosphorus % dry weight Total Potassium % dry weight Organic Matter % dry weight Salinity (EC) mS cm-1 pH (does not have units) Foreign Matter % Arsenic mg/kg dry weight Cadmium mg/kg dry weight Chromium mg/kg dry weight Cobalt mg/kg dry weight Copper mg/kg dry weight Lead mg/kg dry weight Mercury mg/kg dry weight Molybdenum mg/kg dry weight Nickel mg/kg dry weight Selenium mg/kg dry weight Zinc mg/kg dry weight

Composted Materials Sampling
Field Sampling Manual, 2013
169
3. Trace Elements Heavy metal concentrations, expressed in mg/kg dry weight, determine the appropriate use classification code; if any one parameter falls in a higher concentration grouping, the code for that higher grouping will apply.
3.1 Trace Element Concentration Codes 1 2 3 4
Arsenic <13 >13-30 >30-50 >50 Cadmium <2.6 >2.6-5 >5-20 >20 Chromium <210 >210-250 >250-800 >800 Cobalt <26 >26-50 >50-300 >300 Copper <100 <100 >100-500 >500 Lead <150 >150-500 >500-1000 >1000 Mercury <0.8 >0.8-2 >2-10 >10 Molybdenum <5 >5-10 >10-40 >40 Nickel <50 >50-100 >100-500 >500 Selenium <2 >2-3 >3-10 >10 Zinc <315 >315-500 >500-1500 >1500
4. pH The pH must range between 5.0 and 8.0
5. Sampling Procedures A single composite sample needs to be representative of the compost being tested.
• At least 5 to 10 samples should be taken from different locations around the pile.
• Samples should be taken from a depth greater than 25 cm and not more than 1 metre.
• Composite samples must be thoroughly mixed in a large container to provide a representative sample of the pile.
Laboratory staff should be consulted to determine the amount of compost required to carry out analyses.

Composted Materials Sampling
Field Sampling Manual, 2013
170
6. Product Maturity Mature means material that is highly stabilized, has been exposed to a long period of decomposition, is brown to black in colour, and
• will not reheat upon standing to greater than 20 degrees C above ambient temperature, or
• has shown a reduction of organic matter of greater than 60% by weight.
The regulation requires that a measure of product maturity be determined. Two alternative methods are acceptable under this regulation as the measurement procedure.
6.1 Reheating Test A reheating test can be to used measure stability. Compost should be re-piled so it is at least 2 meters in diameter and 1.5 metres high. The pile should not be compressed and should be loose enough to allow the penetration of air. Moisture content of the pile should be somewhere between 35% and 60%. A dry pile will give the false impression that the compost is mature. Three days later the temperature of the compost should be measured at a point 60 cm into the pile. A comparison of this temperature with ambient air temperature gives a picture of the product maturity.
6.2 Ratio Between Organic Solids and Mineral Solids Reduction of organic matter content during the composting process increases the percentage of mineral solids present. This ratio between organic solids and mineral solids present provides a picture of how close to maturity a compost product is. Before and after composting the material is tested for the percent organic matter (volatile solids) on a dry weight basis. The calculation is:
% Reduction = [1- %A (100 - %B) ] X 100 %B (100 - %A) where %A = % organic matter content of dry matter after decomposition,
and %B = % organic matter content of dry matter before
decomposition.

Composted Materials Sampling
Field Sampling Manual, 2013
171
“Loss on ignition analysis” is used to determine the percentage organic matter content before and after decomposition. During composting the ratio of organic matter to inorganic matter changes due to decomposition and the mass of inorganic solids remains the same. Using this formula it is possible to calculate the percentage "reduction of organic matter content" in the final product necessary to meet the required level of reduction for compost classified as mature or fresh.
7. Foreign Matter Content Foreign matter content may be determined by passing a dried, weighed sample of the compost product through a 6 mm screen. The material remaining on the screen is visually inspected, and the foreign matter that can be clearly identified is separated and weighed. The weight of the separated foreign matter divided by the weight of the total sample multiplied by 100 is the percentage dry weight of the foreign matter content. Foreign matter content by dry weight must be classified within one of the following categories before being utilized on land:
(i) 1% (ii) >1% but ≤ 2% (iii) >2% but ≤ 10%
8. Revision History October 11, 2013: This section republished without change. Appendix 2 - Sample
containers, StorageTM, Preservation and Holding Times updated.
February 28, 2001: This section has been republished without change.

LAKE AND STREAM BOTTOM SEDIMENT SAMPLING
©Her Majesty the Queen in Right of the Province of British Columbia
2013 All Rights Reserved

Lake & Stream Bottom Sediment Sampling
Field Sampling Manual, 2013
173
Table of Contents 1. INTRODUCTION ................................................................................................. 174 2. GENERAL CONSIDERATIONS ......................................................................... 175
2.1 Preparing to Go to the Field ................................................................................. 175 2.2 Locating the Site in the Field ............................................................................... 175 2.3 Field Notes/Observations ..................................................................................... 176
3. QUALITY ASSURANCE/QUALITY CONTROL ................................................. 176 3.1 Field Quality Assurance ....................................................................................... 176 3.2 Field Quality Control ............................................................................................. 177
3.2.1 Replicate Samples ....................................................................................... 178 3.2.2 Reference Samples ..................................................................................... 178
4. SAMPLING EQUIPMENT ................................................................................... 178 4.1 Grab Samplers ....................................................................................................... 179
4.1.1 Ekman Grab ................................................................................................ 180 4.1.2 Petersen Grab ............................................................................................. 180 4.1.3 Ponar Grab .................................................................................................. 181
4.2 Core Samplers ....................................................................................................... 181 4.3 Sediment Particle Size Samplers ......................................................................... 182
5. COLLECTING SEDIMENT SAMPLES ............................................................... 183 5.1 Collecting Lake Sediment Samples ..................................................................... 183
5.1.1 Sampling from a Boat .................................................................................. 183 5.1.2 Winter Sampling .......................................................................................... 186
5.2 River/Stream .......................................................................................................... 187 5.2.1 Access from a bridge ................................................................................... 187 5.2.2 Sampling from a Boat .................................................................................. 189 5.2.3 Winter Sampling .......................................................................................... 189 5.2.4 Sampling for Sediment Particle Size ........................................................... 190
6. SHIPPING ........................................................................................................... 191 7. SOURCES OF FURTHER INFORMATION ........................................................ 192 8. REVISION HISTORY .......................................................................................... 193 APPENDIX 1 GENERIC FIELD CHECKLIST ........................................................... 194 APPENDIX 2 LAB SAMPLE CONTAINER, PRESERVATION, AND HOLD TIMES
FOR SEDIMENTS AND TISSUES ...................................................................... 196

Lake & Stream Bottom Sediment Sampling
Field Sampling Manual, 2013
174
1. Introduction This section covers the minimum requirements to ensure quality and consistency of the field aspects of lake and stream bottom sediment data collection. Sediments collected using the techniques outlined here will be analyzed for sediment chemistry and for physical characteristics such as particle size distribution. The essential tasks in sediment sampling are to collect representative, undisturbed samples that meet the requirements of the program, and to prevent deterioration and contamination of the samples before analyses. The procedures outlined in this manual are oriented primarily towards BC Environment employees, consultants, or those under a legal requirement to undertake a sampling program for the Ministry. Following the protocols outlined in this section will aid field staff in collecting reliable, representative samples. The protocols presented here are the most acceptable ones used at present. It should be emphasized that in unusual circumstances, or with development of new methods, experienced professional judgment is a necessary component of method choice and application. It is intended that this document will be updated as the need arises to reflect new knowledge. This section does not address the collection of samples for the purpose of providing legal evidence. For information regarding legal sampling, refer to Guidelines for the Collection and Analyses of Water and Wastewater Samples for Legal Evidence (Lynch and van Aggelen, 1993). This section does not address project design (site locations, frequency of sampling, duration, laboratory quality assurance program, etc.) or data interpretation. These topics are the subject of separate sections or other documents. The sample containers, preservatives and sampling procedures described in this manual reflect those most widely used by BC Environment. Shipping procedures and safety measures are also outlined. Different agencies or laboratories may have specifications which differ from those described here. It should be acknowledged that funding for the initial manuscript upon which this section is based was provided by the Aquatic Inventory Task Group of the Resource Inventory Committee.

Lake & Stream Bottom Sediment Sampling
Field Sampling Manual, 2013
175
2. General Considerations
2.1 Preparing to Go to the Field Preparation for each sampling trip is critical since oversights are not usually noticed until staff reach the first station. The most effective way to prepare for a sampling trip is with a checklist that is designed to meet the requirements of each project. Other than considering site-specific instructions, the checklist should identify the following needs:
• Type and number of (labeled) bottles and containers, including extras • Field equipment such as meters (with adequate trouble-shooting equipment for
small repairs), sampling tools (sediment grabs, corers), etc. • Preservatives • Appropriate quantity of ice packs and coolers • Log books • Personal gear (for all possible weather conditions, e.g., survival suits, raincoats,
protective footwear, etc.) • First aid kit and other safety equipment (life jackets, survival suits) • A section on the working status of equipment (i.e., properly loaded to avoid damage
during transport, batteries charged, probes not damaged or dried, etc.) • Camera or video equipment as required • Laboratory requisition forms (partially filled out) A general operating procedure is to have the key equipment in a box or plastic “tote” which is dedicated to this activity. See Appendix 1 of this chapter for an example of a generic checklist.
2.2 Locating the Site in the Field It is the responsibility of the field staff to locate all sampling stations accurately. Only if the same location is consistently sampled can temporal changes in the sediment quality be interpreted with confidence. Therefore, accurately written station location descriptions (that identify key landmarks) must be prepared on the first visit to every sampling site. Good photographic documentation is the best way of ensuring that each site is easily recognized. A map that labels the sample sites should accompany the site identification log book. This log book can be in the form of a 3-ring binder with a 1:50 000 map. The basic site location data (latitudes, longitudes, map sheet number, site identification number, etc.) should be incorporated into the database (EMS in the case of BC Environment).

Lake & Stream Bottom Sediment Sampling
Field Sampling Manual, 2013
176
2.3 Field Notes/Observations Good sampling practice always involves the use of detailed field notes. Specific information about seemingly unimportant facts such as the time of day or weather conditions are often important when interpreting data. A field log book (3-ring binder with water proof paper) for each project is mandatory. All field measurements should be entered (by date) directly into this field log book. The following list emphasizes those observations that should be recorded:
• Site name and EMS code • Date and time • Station depth • Names of all personnel on sampling crew • Gross characteristics of sediment - Texture - Colour - Biological structure (e.g., shells, tubes, macrophytes) - Debris (e.g., wood chips, plant fibers) - Presence of oily sheen - Obvious odour • Gross characteristics of vertical profile (distinct layers, depth of layer changes) • Penetration depth of sediment sampler All information recorded in the log book should be entered into the database as soon as possible upon return from the field.
3. Quality Assurance/Quality Control
3.1 Field Quality Assurance The field quality assurance program is a systematic process which, together with the laboratory and data storage quality assurance programs, ensures a specified degree of confidence in the data collected for an environmental survey. The field quality assurance program involves a series of steps, procedures, and practices which are described below.
The quality of data generated in a laboratory depends, to a large degree, on the integrity of the samples that arrive at the laboratory. Consequently, the field investigator must take the necessary precautions to protect samples from contamination and deterioration.

Lake & Stream Bottom Sediment Sampling
Field Sampling Manual, 2013
177
There are many sources of contamination; the following are some basic precautions to consider: • Sample containers, new or used, must be cleaned according to the recommended
methods and certified by the issuing laboratory as ‘contamination free’ (if pre-cleaned by the laboratory).
• Only the recommended type of sample container for each analysis should be used
(Appendix 2 of this chapter). • The inner portion of sample container and caps must not be touched with anything
(e.g., bare hands, gloves, etc.) other than the sample itself. • Sample containers must be kept in a clean environment, away from dust, dirt,
fumes and grime. Containers must be capped at all times and stored in clean shipping containers (coolers) both before and after the collection of the sample. Vehicle cleanliness is an important factor in eliminating contamination problems.
• Petroleum products (gasoline, oil, exhaust fumes) are prime sources of
contamination. Spills or drippings (which are apt to occur in boats) must be removed immediately. Exhaust fumes and cigarette smoke can contaminate samples with lead and other heavy metals. Air conditioning units are also a source of trace metal contamination.
• Samples must never be permitted to get warm; they should be stored in a cool
place; coolers packed with ice packs are recommended (most samples must be cooled to 4°C during transit to the laboratory). Conversely, samples must not be permitted to freeze unless freezing is part of the preservation protocol (see Appendix 2 of this chapter).
• The sample collectors should keep their hands clean and refrain from smoking or
eating while working with samples.
3.2 Field Quality Control Quality control is an essential element of a field quality assurance program. In addition to standardized field procedures, field quality control requires the submission of replicate and reference samples. Replicate samples detect heterogeneity within the environment, allow the precision of the measurement process to be estimated, and provide a check that the sample is reproducible.

Lake & Stream Bottom Sediment Sampling
Field Sampling Manual, 2013
178
Reference samples are used primarily to document the bias of the analytical (laboratory) process, however, any influence or contamination introduced during sample preparation, handling, or during lab analysis will be reflected. The timing and the frequency of replicate and reference samples are established in the project design and will vary with each project.
3.2.1 Replicate Samples To determine the degree of heterogeneity within the sediments, it is necessary to take replicate samples. These replicates can consist of multiple samples (grabs) from the same general area (to measure site heterogeneity), or portions of a single grab (to measure more localized heterogeneity). Grab samples that are homogenized (physically stirred) in the field and then sub-sampled into replicates serve as a tool to estimate the analytical (laboratory) precision. Refer to section 5.1 for the protocol to collect the samples.
3.2.2 Reference Samples Laboratory tested and preserved reference sediment samples have been prepared and certified by a national, international or standards agency such as the National Research Council of Canada. These reference samples have been subjected to a large number of analyses performed by independent laboratories using several different analytical techniques. Consequently, the laboratory supplying the reference material provides mean values and confidence intervals for these substances. These reference samples should be submitted to the analyzing laboratory along with the samples collected during a field trip. Reference sediment samples are distributed as a dry dust, therefore, the analyzing laboratory will be aware that they are reference samples. Nevertheless, they should be transferred to a regular, coded sample container so the lab does not know which reference sample it is dealing with.
4. Sampling Equipment Generally, there are two types of samplers used for collecting bottom sediments: (1) grab samplers for collecting surface sediments, thereby providing material for the determination of horizontal distribution of variables; and (2) core samplers for collecting a depth profile of sediments, thereby providing material for determination of vertical distribution of variables. Grab samplers, due to their ease of use and large quantity of sample obtained, are ideal for assessing recent inputs of pollutants. The core samplers are better suited for assessing long-term (historical) inputs. The type of sampler used at particular sites will vary depending on the purpose of the study and will be dictated by the project design.

Lake & Stream Bottom Sediment Sampling
Field Sampling Manual, 2013
179
4.1 Grab Samplers Simplified drawings of grab samplers with their essential components are shown in Figure 1. The grab samplers commonly used by BC Environment are of designs that use a set of jaws which shut when lowered to the sediment. In the case of the Ekman and Ponar grabs, vented or hinged tops allow water to flow freely through the device during descent, thereby reducing sediment disturbance that would otherwise be created by a shock wave in front of the sampler. The advantages associated with these grab samplers are that they are easy to use and obtain relatively large volumes of sediment. A disadvantage is that upon retrieval, fine surface particulates can be carried away by outflowing water. Several designs, other than those illustrated or mentioned here for sediment samples, are available and may be appropriate in certain conditions. Other designs include the mini-Ponar and the Van Veen.

Lake & Stream Bottom Sediment Sampling
Field Sampling Manual, 2013
180
Figure 1. Common Sediment Grab Samplers
4.1.1 Ekman Grab Ekman grabs are variable in size with larger models requiring the use of a winch or crane hoist for operation. Typically the 15 x 15 cm size is used. These have historically been fabricated in brass, but stainless steel is now used and is more desirable (fewer problems with corrosion and less likelihood of effecting metal concentrations in sediment sample). The spring-tensioned, scoop-like jaws are mounted on pivot points and are set with a trigger assembly which is activated from the surface by a messenger. Flaps on the top of the grab open during descent to allow water to flow freely through, and close during ascent to reduce loss of sample during retrieval. The sediment can either be sub-sampled through the top flaps or can be dumped into a tray and treated as a bulk sample. The Ekman sampler is suitable for collecting soft, fine-grained sediments (silt and sand). Larger substrate particles (i.e., gravel) and objects such as shells and wood tend to prevent the jaws from fully closing which results in loss of sample material. NOTE: If the jaws are not fully closed, then the sample must be discarded.
4.1.2 Petersen Grab The Petersen grab consists of a pair of weighted semi-cylindrical jaws which are held open by a catch bar. Upon impact with the sediment (slackening of the rope), the tension on the catch bar is reduced allowing the jaws to close. Auxiliary weights can be added to the jaws to improve penetration into harder, more compacted sediments. There is no access to the sample through the top of the grab, consequently the sediments must be dumped into a tray and treated as a bulk sample. The Petersen grab is suited to the collection of hard bottom material such as sand, marl, gravel, and firm clay.

Lake & Stream Bottom Sediment Sampling
4.1.3 Ponar Grab The Ponar grab consists of a pair of weighted, tapered jaws which are held open by a catch bar. It is triggered to close in much the same fashion as the Petersen grab. The upper portion of the jaws is covered with a mesh screen which allows water to flow freely during descent, consequently reducing the shock wave that precedes the sampler. Upon recovery, the mesh can be removed to allow access to the sediment for sub-sampling purposes. The Ponar grab is suitable for collecting fine-grained to coarse material.
4.2 Core Samplers Core samplers penetrate the sediment more deeply than grab samplers. Consequently, they provide a cross-sectional slice of sediment layers and thus, information about the sediment deposition. The core samplers commonly used by BC Environment consist of a tube that enters the sediment by free falling from a sufficient height (usually 3-5 metres). Alternatively, in soft organic sediments, the weight of the core sampler is sufficient to fully penetrate the sediments without allowing it to free fall. A valve at the top of the sampler closes by messenger, creating a vacuum seal that prevents the sediments from washing out. The most common core sampler used by BC Environment is the Kajak-Brinkhurst sampler (Figure 2). Variations on this design are available from several commercial suppliers.
Figure 2. Kajak-Brinkhurst Sediment Core Sampler
Field Sampling Manual, 2013 181

Lake & Stream Bottom Sediment Sampling
Field Sampling Manual, 2013
182
4.3 Sediment Particle Size Samplers Although the previously mentioned samplers can be used for the purpose of determining the distribution of streambed particle sizes, they are not ideal. Much of the very fine sediments are lost as a result of the pressure wave that precedes these samplers, and washout as the samplers are retrieved. Better estimates of particle size distribution can be obtained through the use of sediment traps (over a prescribed time frame), or samplers that collect an entire portion of the streambed (i.e., McNeil sampler and Freeze core sampler). The freeze core sampling technique is elaborate and cumbersome, consequently it will not be discussed here. Detailed descriptions of the use of this piece of equipment can be obtained from Ryan (1970) and Sookachoff (1974). Sediment traps are simply open buckets of a given volume that are filled with cleaned gravel and immersed in the streambed. They are collected at a later date and submitted for mechanical analysis of sediment particle size. The McNeil sampler (Figure 3) consists of a cylinder that defines the portion of the streambed to be sampled and an attached basin that is used to store the collected sediments and trap the suspended fines.
Figure 3. McNeil sediment size sampler

Lake & Stream Bottom Sediment Sampling
Field Sampling Manual, 2013
183
5. Collecting Sediment Samples Sediment samples are collected for either analysis of chemical and physical properties of the sediment, or to assess the benthic biotic community structure (biomass and/or taxonomy). A number of basic requirements must be met to obtain representative sediment samples:
• The sampling device must penetrate the sediment to a sufficient depth to measure the variables of concern accurately.
• The sampling device must enclose the same quantity of sediment each time. • The sampling device must close completely each time. • Care should be taken not to disturb the sediments prior to deployment of the sampling
device. Note: Since sediment samplers disturb overlying waters they should be used only
after the ambient water sampling has been completed at the site.
5.1 Collecting Lake Sediment Samples Regardless of the equipment chosen for the sample collection, it is necessary to know the water depth at each station before starting. If water depth information is unavailable, it is recommended that it first be measured. Measurement equipment can range from a weighted rope to an electronic depth sounder. The purpose is to ensure adequate cable (rope) length for operation of the equipment and to control the speed of entry of the sampler into the sediment. The speed of deployment of the sampler can be critical to good operation and sample recovery. Too rapid deployment generates and increases the shock wave advancing in front of the equipment. This shock wave can displace the soft unconsolidated surface sediments. Rapid deployment may also cause equipment malfunction, such as activating the trigger mechanism before the device reaches the sediment. In the case of core samplers, if the deployment is too slow, an insufficient quantity of sediment is obtained. Since the site-specific conditions will dictate the speed of sampler deployment, the specifics should be recorded in the field log book (i.e., the height from which the corer was allowed to free fall).
5.1.1 Sampling from a Boat The collection of deep water samples requires that at least one member of the sampling group be very familiar with boat operation and safety. If the sampling trip involves the use of a boat, then the weather forecast or marine conditions should be obtained prior to departure from home. If conditions are poor, then the sampling trip should be postponed.

Lake & Stream Bottom Sediment Sampling
Field Sampling Manual, 2013
184
PROTOCOL (sampling from a boat with a grab sampler)
(a) Set the grab sampling device with the jaws cocked open (see Figure 1).
Great care should be taken while handling the device while it is set; accidental closure can cause serious injuries.
(b) Ensure that the rope is securely fastened to the sampler and that the other end
is tied to the boat. (c) Lower the sampler until it is resting on the sediment (its own weight is
adequate to penetrate soft sediments). At this point the slackening of the line activates the mechanism to close the jaws of the Ponar and Petersen grabs.
(d) For the Ekman grab, send the messenger down to ‘trip’ the release
mechanism. (e) Retrieve the sampler slowly to minimize the effect of turbulence (that might
result in loss/disturbance of surface sediments). (f) Place a container (i.e., a shallow pan) beneath the sampler just as it breaks the
surface of the water. Note: If the jaws were not closed completely, the sample must be discarded.
Discard the sample into a bucket if the second collection attempt is made from the same general area. Dump the unwanted sample only after a sample has been successfully collected.
For replicate samples, proceed with instruction (g). For non-replicate samples proceed from instruction (h).
(g) If the sample is to be split into replicates (Ekman or Ponar grabs), then open
the top flaps and carefully divide the sample into the required number of replicates with a clean spatula. Scoop the replicates into pre-labeled bottles and store in a cooler. A selection can be made of the surface sediments (1 - 2 cm) by carefully scooping off the top undisturbed layers. In some lakes, a grab sample to a depth of 10 - 15 cm is typical and the vertical heterogeneity may represent many years of lake or watershed changes.
Note: For samples that are to be analyzed for organics, the spatula and
container must not be plastic (the container must be a glass bottle provided by the laboratory). For samples that are to analyzed for metals, the spatula must not be metallic.

Lake & Stream Bottom Sediment Sampling
Field Sampling Manual, 2013
185
(h) For sediments that are to be treated as bulk samples (one large sample), gently open the jaws and allow the sediments to empty into the container (shallow pan).
(i) Immediately record (in the field log book) observations regarding the
appearance of the sediment (i.e., texture, colour, odour, presence of biota, presence of detritus, and the depth of sediment sampled).
(j) With a clean spatula carefully stir the sediment to homogenize, then scoop an
aliquot into a pre-labeled sediment sample bottle (see Appendix 2 for appropriate container).
(k) Place the samples in a cooler with ice packs as soon as they are transferred to
the bottles. Note: Many lake sediment samples are anoxic and a number of chemical
changes will take place if the samples are exposed to atmospheric oxygen. If samples are to be retained with as low oxygen as possible, they will need to be packed inside multiple airtight containers and frozen to minimize the chemical and microbial transformations. Be warned that it may still have a strong odour even if sealed and frozen! If samples are frozen, allow sufficient head space for expansion of the sample. Otherwise, the container will split or break when the sample freezes.
PROTOCOL
(sampling from a boat with a core sampler)
(a) Open the valve and set the trigger mechanism (Figure 2). Ensure the rope is securely fastened to the corer and attach the other end of the rope to the boat.
(b) Lower the corer to approximately 5 m above an area of undisturbed sediments
and then allow it to fall freely into the sediments (drop depth may vary with sampler size, weight, and sediment type). Sufficiently heavy corers can be simply lowered into the sediments to avoid the disturbance caused by impact.
(c) Send the messenger down to release the trigger mechanism. (d) Carefully retrieve the sampler and place a stopper into the bottom opening
before removing from the water to prevent loss of the sample. (e) Remove the liner from the corer and stopper the upper end. Store erect.
Repeat this procedure to obtain replicate cores, each at least 0.5 m in length.

Lake & Stream Bottom Sediment Sampling
Field Sampling Manual, 2013
186
(f) Once on shore, carefully siphon off most of the water overlying the sediments in the core tube (leave a small amount at the sediment-water interface). Do not disturb the sediment-water interface.
(g) Make careful measurements of the total length of the core and precise points
(nearest mm) of any layers of sediment that appear to be different. Note any changes in stratigraphy, such as colour and texture.
(h) A rubber stopper of a size sufficient to fit inside the liner tube tightly to form a
watertight seal and mounted on a rod is inserted into the lower end. The core is then gently and slowly forced upward to the top of the tube. Some advanced corers come equipped with this stopper and the increment of each sediment slice can be adjusted.
(i) As the sediment core is extruded, carefully cut slices (one cm or more thick)
with clean spatulas and place into labeled sample bottles. A core slicer greatly assists this operation, but good samples can be obtained without this aid when done carefully.
Note: For samples that are to be analyzed for organics, the spatula and container must not be plastic (the container must be glass bottles provided by the laboratory). For samples that are to be analyzed for metals, the spatula must not be metallic.
(j) Place the samples in a cooler with ice packs as soon as they are transferred to
the labeled bottles.
5.1.2 Winter Sampling Sampling in winter presents extra elements of danger. Always proceed with caution over ice and do not jeopardize your safety. Check the ice for thickness with a rod or ice chisel every few steps (ice should be a minimum of 8 cm thick). Always have someone follow you, and carry a length of rope (with a harness tied around your waist) to use as a life line. If the ice is unsafe, do not take a sample. Never take unnecessary risks. Note: Ice near the outlet of a lake is often thin, therefore, caution should be
used when sampling this area of a lake. Ice may also be thin where a stream enters a lake or where groundwater enters a lake.

Lake & Stream Bottom Sediment Sampling
Field Sampling Manual, 2013
187
PROTOCOL (for sampling through ice)
(a) With safety considerations in mind, winter sampling locations should be as
close as possible to the summer locations. The sites should be chosen where the water is known to be deep enough to avoid stirring up bottom sediments while drilling the hole.
(b) Clear loose ice and snow from the sampling location, and drill through the ice
with a hand or motorized auger. Keep the area around the hole clear of potential contamination (dirt, fuel, oil, etc.). At least one member of the sampling team should be familiar with the operation and safety of both motorized and hand operated augers.
(c) Follow sample collection procedures outlined above for either grab or core
samplers (section 5.1.1 - sampling from a boat).
5.2 River/Stream Sediment sampling in deep sections of rivers and streams rarely involves the use of core samplers as these devices require that flow be minimal (very few rivers world-wide have sufficiently low flow). Alternatively, core samples can be collected in shallow, flowing waters by physically pushing the corer into the sediment by hand. It is useful to have some understanding of the currents at the sampling site. Strong near-bottom currents can lead to poor equipment deployment, deflect a grab sampler, or require a long cable/wire to be deployed. Care should be taken to ensure that the weight of the sampler is adequate for working in the particular current conditions and that the sampler collects sediment at or very near the desired sampling site.
5.2.1 Access from a bridge Some sample stations are designed to be sampled from a bridge. Consequently, samples can be collected from the center of the channel without the use of a boat.
PROTOCOL
(from bridge with a grab sampler) (a) Set the grab sampling device with the jaws cocked open (see Figure 1). Great
care should be taken while dealing with the device while it is set; accidental closure could cause serious injuries.
(b) Ensure that the rope is securely fastened to the sampler and that the other end
of the rope is tied to the bridge.

Lake & Stream Bottom Sediment Sampling
Field Sampling Manual, 2013
188
(c) Lower the sampler over the upstream side of the bridge until it is resting on the sediment (its own weight is adequate to penetrate soft sediments). At this point the slackening of the line activates the mechanism that releases the jaws of the Ponar and Petersen grabs.
(d) For the Ekman grab, send the messenger down to ‘trip’ the release
mechanism. (e) Retrieve the sampler slowly to minimize the effect of turbulence that might
result in loss of surface sediments. (f) Place a container (i.e., a shallow pan) beneath the sampler as soon as it is on
the bridge. Note: If the jaws were not closed completely, the sample must be discarded
(over the downstream side of the bridge or on shore if sensitive water uses exist immediately down stream. Dump the unwanted sample only after a sample has been successfully collected.
(g) If replicates are to be collected, then refer to Section 5.1.1 steps (g) and (h).
Otherwise, for a bulk sample, gently open the jaws and allow the sediments to empty into the container.
(h) Immediately record, in the field log book, observations regarding the
appearance of the sediment (i.e., texture, colour, odour, presence of biota, presence of detritus, and the depth of sediment sampled).
(i) With a clean spatula either remove the top portion of the sediment (when this
is outlined by the study design), or carefully stir the sediment to homogenize. Place an aliquot into a pre-labeled sediment sample bottle. Note: For samples that are to analyzed for organics, the spatula and
container must not be plastic (the container must be a glass bottle provided by the laboratory). For samples that are to analyzed for metals, the spatula must not be metallic.
(j) Place the samples in a cooler with ice packs as soon as they are transferred to
the bottles.

Lake & Stream Bottom Sediment Sampling
Field Sampling Manual, 2013
189
5.2.2 Sampling from a Boat Due to the fact that fast-flowing waters pose a serious threat, it is essential that the person operating the boat be very experienced with river boating. Ideally there should be three people involved in the sampling trip when it involves boating on a river. Two people are responsible for collecting the samples, taking field measurements and recording field notes. The remaining person is responsible for boat operation only. Sampling trips should start at the site that is most downstream and work upstream. If mechanical problems should arise, then the current will work to your advantage and assist you to return to the vehicle.
PROTOCOL
(in flowing waters)
(a) When a sample site is reached, the boat operator will idle into the current so as to maintain the boat in one location. Use reference points on shore to do this.
(b) The person in the bow is responsible for collecting the samples (water column
samples before sediment samples). (c) Collect the sediment with a grab sampler as outlined in the lake sampling section
(5.1.1).
5.2.3 Winter Sampling
Due to the fact that flow patterns in rivers and streams are generally more complex than in lakes, there are additional safety factors to consider. Honeycombed ice and areas over rapids should always be avoided. Be aware that ice downstream from bridge supports may be thin as a result of modified flow patterns and de-icing agents. Generally, winter sampling on rivers follows a similar protocol to sampling lakes in winter. The primary exception occurs when the ice is unsafe; when this is the case, sample stations that are accessible from a bridge are the only option.

Lake & Stream Bottom Sediment Sampling
Field Sampling Manual, 2013
190
PROTOCOL (for sampling when ice is safe)
(a) With safety considerations in mind, winter sampling locations should be as
close as possible to the summer locations. The sites should be chosen where the water is known to be deep enough to avoid stirring up bottom sediments while drilling the hole and to ensure that there is water movement under the ice at the selected spot.
(b) Clear loose ice and snow from the sampling location, and drill through the ice
with a hand or motorized auger. Keep the area around the hole clear of potential contamination (e.g., dirt, fuel, oil, etc.). At least one member of the sampling team should be familiar with the operation and safety of both motorized and hand operated augers.
(c) Follow procedures outlined above (section 5.1.1).
5.2.4 Sampling for Sediment Particle Size
PROTOCOL (McNeil sampler)
(a) Wade into the water downstream of the intended sample collection site. (b) Remove the cap from the sampling tube (see Figure 3). Ensure that you are in
sufficiently shallow water that the sampler will not be swamped when the tube portion is inserted in the sediment.
(c) Thrust the sampler through the water column and force the tube into the sediment
until the bottom of the collecting cylinder is on the streambed. (d) Reach in and remove all the streambed material that is in the tube. (e) Recap the tube and carefully withdraw the sampler from the sediment. Return to
shore and pour the contents of the sampler through a fine mesh sieve into a collecting pan.
(f) Transfer the water from the pan to a pre-labeled bottle. This bottle can either be
submitted for total suspended sediment analysis (non-filterable residue), or to a pre-determined lab for hydrometric particle size analysis (the Ministry of Agriculture, Food and Fisheries or the Ministry of Highways have the capability to conduct this sort of analysis). The larger materials that were trapped in the sieve must be submitted to one of the facilities capable of mechanical analysis for size. These can be transported in well labeled heavy duty plastic bags.

Lake & Stream Bottom Sediment Sampling
Field Sampling Manual, 2013
191
PROTOCOL (sediment traps)
(a) Prior to the sampling trip, gravel of fairly uniform size should be collected and
cleaned. Place the gravel in four litre buckets (fill each bucket to the rim). Replace the lids.
(c) Once in the field, dig a hole in the streambed large enough that the bucket will be
immersed in the sediment to the point that the top will be flush with the streambed. Wait until the disturbed fine sediments have cleared before you place the bucket in the hole.
(d) While the lid is still on, gently place the bucket in the hole and surround it with
streambed material until it is secure. Once again, wait until disturbed materials have cleared before removing the lid.
(e) Note: Never walk upstream of the buckets as this will disturb sediments
that will be captured in the sediment trap. (d) After the time outlined by the project design (usually 2 - 4 weeks), gently replace
the lid and remove the bucket from the streambed. (e) Submit the bucket(s) to a pre-determined lab for mechanical (particle size)
analysis (the Department of Agriculture Food and Fisheries or the Ministry of Highways have facilities that conduct this sort of analysis).
6. Shipping The day’s sampling schedule must be designed to ensure that the samples arrive at the shipping agency’s terminal well before the end of business hours. Since some variables have very limited hold times (see Appendix 2), every effort must be made to avoid delays in shipping. The following is the procedure to be followed to maintain the integrity of the samples during transit.
PROTOCOL (shipping)
Note: Ice packs should be used instead of loose ice or bagged ice. When loose ice melts,
the contents of the cooler are free to shift, potentially allowing contamination of samples with melted ice water and/or breakage of glass bottles.

Lake & Stream Bottom Sediment Sampling
Field Sampling Manual, 2013
192
(a) Pack the samples upright in the cooler with at least 1 (winter) to 2 (spring, summer, fall) times as much ice packs as the total volume of the samples. Ensure that the glass bottles are separated from each other by ice packs, plastic bottles or clean packing material to prevent them from shifting, falling over and/or breaking.
(b) Complete the laboratory requisition forms, enclose them in a sealed plastic bag, and
place them in the cooler on top of the samples. The recommended minimum information that should accompany samples to the laboratory (on each requisition form) includes: • Site name • EMS site numbers • Date and time of collection • Name of collector • Field measurements • Comments on sample appearance • Weather conditions • Any other observations that may assist in interpreting data.
(c) Seal the cooler with heavy duty packing tape to reduce the possibility of it accidentally
opening and to prevent tampering with the samples. Coolers arriving at the laboratory with torn or absent tape should be noted by lab staff and the sample submitter notified.
(d) Attach a label prominently displaying the destination.
7. Sources of Further Information
American Public Health Association, American Water Works Association, Water Environment Federation. 1992. Standard Methods for the Examination of Water and Wastewater. 18th edition. Edited by: Greenberg, A.E., Clesceri, L.S., Eaton, A.D., and Franson, M.A.H. Published By: American Public Health Association.
Clark, M.J.R., Shera, W.P. (Editors). 1985. Methods for Aquatic Data Collection in British
Columbia: A Catalogue. BC Ministry of Environment, Victoria, B.C. Environment Canada. 1983. Sampling for Water Quality. Water Quality Branch, Inland
Waters Directorate, Ottawa. McNeil, W.J., and Ahnell, W.H. 1964. Success of Pink Salmon Spawning Relative to Size
of Spawning Bed Materials. United States Fish and Wildlife Service. Special Scientific Report, Fisheries No. 469. Washington, District of Columbia. 15pp.

Lake & Stream Bottom Sediment Sampling
Field Sampling Manual, 2013
193
Mudroch, A., and MacKnight, S. 1991. Handbook of aquatic sediment sampling. CRC Press Inc.
Ryan, P. 1970. Design and Operation of an In Situ Frozen Core Gravel Sampler. Technical
Report No. 1970 - 12. Environment Canada. Department of Fisheries and Forestry, Fisheries Service, Pacific Region.
Sookachoff, P. 1974. The Modified In Situ Frozen Core Gravel Sampler. Technical Report
Series No. PAC/T - 74-16. Environment Canada. Fisheries and Marine Service Habitat Protection Unit, Southern Operations Branch, Pacific Region.
Wetzel, R.G., and Likens, G.E. 1991. Limnological Analysis. Second edition.
Springer - Verlag, New York.
8. Revision History October 11, 2013: This section republished without change. Appendix 2 - Sample
containers, StorageTM, Preservation and Holding Times updated. February 28, 2001: This section republished without change. Note added to Appendix 2
requiring use of glass or Teflon™ containers for samples to be analyzed for mercury
November 1996: Initial publication.

Lake & Stream Bottom Sediment Sampling
Field Sampling Manual, 2013
194
Appendix 1 Generic Field Checklist (including water, sediments, biota and effluents)
General: Log Books ____ Pencils ____ Cooler (with ice packs)____ Felt Markers (waterproof)____ Rope____ Tape____ Camera (film)____ Requisition forms ____ Way bills ____ Shipping labels ____ De-ionized water (4L)____ Squirt bottle____ Resealable bags ____
Labeled Sample Bottles: General chemistry (1 L) #____ General chemistry (2 L) #____ Dissolved Metals #____ Total Metals #____ Total Organic Carbon #____ Low-level nutrients #____ Coliforms #____ Sediments #____ Zooplankton #____ Phytoplankton #____ Periphyton #____ Invertebrates #____ Tissue cups #____ Macrophytes ____ +Extras - two of each
Sampling Equipment (clean, in working order, batteries charged): DO Sampler (BOD bottle, Winkler reagents)____ Thermometer____ DO meter____ pH meter____ Conductivity meter____ Hydrolab____ Secchi disc____ Van Dorn, rope____ messenger ____ Through Ice Sampler____ Auger (bit sharpened, skimmer)____ Spare probe membranes (repair kit)____ Sediment grab____ messenger ____ Sediment corer____ sample tubes ____ Sieves____ Zooplankton tow nets____ Benthic invertebrate sampler (Hess, drift net, Surber)____ Periphyton kit (cup, denture brush, baster)____ Macrophyte sample kit (buckets, garbage bags, float tray, plant press, blot paper, herbarium sheets, newsprint, corrugated cardboard)____
Filtration and Preservation Equipment: Filter Pots____ Syringe(s), Hose ____ Tweezers____ 0.45 µ membrane filters ____ Preservative Vials ____ Disposal Container (for used vials) ____ 70% ethanol ____ Formalin _____ Lugol’s solution ____ Magnesium carbonate____
Boat Equipment: Canoe (or boat) ____ Paddles ____ Motor ____ Fuel ____ Life jackets ____ Ropes ____ Anchor ____ Tool kit ____

Lake & Stream Bottom Sediment Sampling
Field Sampling Manual, 2013
195
Personal Gear: Lunch____ Survival suit ____ Rain gear____ Gum boots ____ Waders (hip, chest)____ Sun screen ____ Flash light____
Safety: WHMIS guidelines ____ First Aid Kit ____ Goggles (or safety glasses) ____ Rubber gloves ____

Lake & Stream Bottom Sediment Sampling
Field Sampling Manual, 2013
196
Appendix 2 Lab Sample Container, Preservation, and Hold Times for Sediments and Tissues
STORAGE CONTAINER MAXIMUM TYPE OF ANALYSIS TEMP(3) TYPE PRESERVATION HOLD TIME(4) SEDIMENTS AND TISSUES INORGANIC Bromide / Chloride / Fluoride no req. P, G none unlimited Cyanide (WAD / SAD) ≤6ºC P, G store in dark, 14 d field moist Hexavalent Chromium ≤6ºC P, G store field moist 30 / 7 d Metals, Total no req. P, G none 180 d Mercury, Total no req. P, G none 28 d Moisture ≤6ºC P, G none 14 d pH no req. P, G none 365 d Sulfide ≤6ºC P, G store field moist 7 d TCLP - Mercury no req. P, G none 28 / 28 dTCLP - Metals no req. P, G none 180/180d ORGANICS Carbon (TC, TOC) ≤6ºC P, G none 28 d no req. P, G dried stage unlimited Chlorinated and ≤6ºC G none 14 / 40 Non-chlorinated phenolics Dioxins / Furans ≤6ºC G none unlimited Extractable Hydrocarbons ≤6ºC G none 14 / 40 (LEPH, HEPH, EPH) Glycols ≤6ºC G none 14 / 40 Herbicides, Acid Extractable ≤6ºC G none 14 / 40 Oil and Grease / Mineral Oil and ≤6ºC G none 28 d Grease / Waste Oil Content Pesticides (NP, OP, OC) ≤6ºC G none 14 / 40 Polychlorinated Biphenyls (PCBs) ≤6ºC G none unlimited Polycyclic Aromatic ≤6ºC G none 14 / 40 Hydrocarbons (PAHs) Resin Acids, Fatty Acids ≤6ºC G none 14 / 40

Lake & Stream Bottom Sediment Sampling
Field Sampling Manual, 2013
197
TCLP - Volatile Organic ≤6ºC G none 14 / 14 Compounds TCLP - Semi-Volatile Organic ≤6ºC G none 14 / 40 Compounds Volatile Organic Compounds ≤6ºC G none 7 (6) / 40 (VOC, BTEX, VH, THM) LEGEND P = plastic G = glass Tf = Teflon(™) B = Baked T = Tissue Cup no req = no requirement Solv = solvent cleaned A = amber Fc = foil lined cap W = wide mouth These are general guidelines and different labs may have specific criteria. *NOTE: glass or Teflon™ containers must be used if mercury is to be analyzed 3 Storage temperature applies to storage at the laboratory. For all tests where refrigeration at ≤6°C is required at the
laboratory, samples should be packed with ice or cold packs to maintain a temperature of ≤10°C during transport to the laboratory. The storage of ≤8°C for microbiological samples applies during storage at the laboratory and during transport to the laboratory. To prevent breakage, water samples stored in glass should not be frozen. Except where indicated by "do not freeze", test results need not be qualified for frozen samples.
4 Hold Times: Single values refer to hold time from sampling to analysis. Where 2 values are given, the first is hold time from sampling to extraction, and the second is hold time from extraction to analysis.
6 Methanol extraction or freezing must be initiated within 48 hours of arrival at lab, to a maximum of 7 days from sample collection. Alternatively, samples may be frozen in the field if extracted within 14 days of sampling, or may be methanol extracted in the field.

PART E WATER AND WASTEWATER SAMPLING
Her Majesty the Queen in
Right of the Province of British Columbia
2013
All Rights Reserved

AMBIENT FRESHWATER AND EFFLUENT SAMPLING
Her Majesty the Queen in
Right of the Province of British Columbia
2013
All Rights Reserved

Ambient Freshwater and Effluent Sampling
Field Sampling Manual, 2013
199
Table of Contents
1. INTRODUCTION ................................................................................................. 202
2. GENERAL CONSIDERATIONS ......................................................................... 203 2.1 Preparing to Go to the Field ................................................................................ 203
2.2 Locating the Site in the Field .............................................................................. 203
2.3 Field Notes/Observations .................................................................................... 204
3. QUALITY ASSURANCE/QUALITY CONTROL (QA/QC) .................................. 205 3.1 Field Quality Assurance ...................................................................................... 205
3.2 Quality Control ..................................................................................................... 207
3.2.1 Blanks ........................................................................................................ 207
3.2.1.1 Trip Blanks ........................................................................................ 208
3.2.1.2 Field Blanks ....................................................................................... 208
3.2.1.3 Equipment Blanks (prepared prior to the field trip) ............................. 209
3.2.1.4 Filtration Blanks ................................................................................. 209
3.2.2 Replicate Samples ..................................................................................... 210
3.2.2.1 Co-located Samples (field duplicate, triplicate, etc.) .......................... 210
3.2.2.2 Split Samples .................................................................................... 210
3.2.3 Spiked Samples (Field) .............................................................................. 211
3.2.4 Reference Samples .................................................................................... 211
4. COLLECTING SAMPLES................................................................................... 212 4.1 Lake ............................................................................................................... 212
4.1.1 Shore Sample ............................................................................................ 213
4.1.2 Sampling from a Boat ................................................................................. 214
4.1.2.1 Site Identification ............................................................................... 214
4.1.2.2 Surface Water ................................................................................... 214
4.1.2.3 Deep Water ....................................................................................... 215
4.1.3 Winter Sampling ......................................................................................... 217
4.2 River/Stream ........................................................................................................ 218
4.2.1 Access from the Stream Bank .................................................................... 218
4.2.2 Access from a Bridge ................................................................................. 220
4.2.3 Sampling from a Boat ................................................................................. 222
4.2.4 Winter Sampling ......................................................................................... 222

Ambient Freshwater and Effluent Sampling
Field Sampling Manual, 2013
200
5. COLLECTING EFFLUENT AND RECEIVING WATER SAMPLES ................... 226 5.1 Effluent Stream .................................................................................................... 227
5.2 Receiving Waters ................................................................................................. 228
6. FIELD MEASUREMENTS .................................................................................. 229 6.1 Temperature ......................................................................................................... 229
6.2 Dissolved Oxygen (DO) ....................................................................................... 230
6.3 Conductivity/Salinity ........................................................................................... 233
6.4 pH ............................................................................................................... 234
6.5 Clarity ............................................................................................................... 235
6.6 ORP ............................................................................................................... 236 6.7 Stream Flow ......................................................................................................... 236
7. FIELD FILTRATION AND PRESERVATION ...................................................... 238 7.1 Filtration ............................................................................................................... 238
7.2 Preservation ......................................................................................................... 240
8. SHIPPING ........................................................................................................... 241
9. CLEANING EQUIPMENT ................................................................................... 242
10. SOURCES OF FURTHER INFORMATION ........................................................ 243
11. REVISION HISTORY .......................................................................................... 244
APPENDIX 1 GENERIC FIELD CHECKLIST ............................................................ 245
APPENDIX 2 SITE IDENTIFICATION ....................................................................... 247 Appendix 2.1 Site Identification Guide ....................................................................... 248 Appendix 2.2 Site Data Sheet (Lake) .......................................................................... 249
Appendix 2.3 Site Data Sheet (River) ......................................................................... 250
Appendix 2.4 Site Data Sheet (Effluent) ..................................................................... 251
APPENDIX 3 SAMPLING FOR THE MOST COMMON VARIABLES ....................... 252 Appendix 3.1 General Chemistry (including nutrients) ............................................. 253
Appendix 3.2 Metals .................................................................................................... 254
Appendix 3.3 Carbon ................................................................................................... 255
Appendix 3.4 Chlorophyll a ......................................................................................... 256
APPENDIX 4 SAMPLE CONTAINER, PRESERVATION, AND HOLD TIMES FOR WATER AND EFFLUENT SAMPLES ............................. 258 APPENDIX 5 EFFLUENT SAMPLING CHECKLIST GUIDE ..................................... 264

Ambient Freshwater and Effluent Sampling
Field Sampling Manual, 2013
201
Appendix 5.1 Effluent Sampling Checklist ................................................................ 265

Ambient Freshwater and Effluent Sampling
Field Sampling Manual, 2013
202
1. Introduction This section covers the minimum requirements to ensure quality and consistency of the field aspects of ambient water and effluent data collection. The essential tasks in water sampling are to obtain a sample that meets the requirements of the program, in terms of location and frequency, and to prevent deterioration and contamination of the sample before analysis. The procedures outlined in this section are oriented primarily towards BC Environment employees, consultants, or those under a legal requirement to undertake a sampling program for the Ministry. The protocols outlined in this section will aid field staff in collecting reliable, representative water samples.
The protocols presented here are the most acceptable ones used at present. It should be emphasized that in unusual circumstances, or with development of new methods, experienced professional judgment is a necessary component of method choice and application. It is intended that this document will be updated as the need arises to reflect new knowledge.
This section does not address the collection of samples for the purpose of providing legal evidence. For information regarding legal sampling, refer to Guidelines for the Collection and Analyses of Water and Wastewater Samples for Legal Evidence (Lynch and van Aggelen, 1994).
This section also does not address project design (site locations, frequency of sampling, duration, quality assurance program, etc.) or data interpretation. It also does not address the collection of groundwater samples. The protocols for the collection of ambient groundwater are documented in the Groundwater Sampling chapter of this manual.
The sample containers, preservatives and sampling procedures described in this section reflect those most widely used by BC Environment. Shipping procedures and safety measures are also outlined. Different agencies or laboratories may have specifications which differ from those described here.
It should be acknowledged that funding for the initial manuscript upon which this section is based was provided by the Aquatic Inventory Task Group of the Resource Inventory Committee.

Ambient Freshwater and Effluent Sampling
Field Sampling Manual, 2013
203
2. General Considerations
2.1 Preparing to Go to the Field Preparation for each sampling trip is critical since oversights are not usually noticed until staffs reach the first station. The most effective way to prepare for a sampling trip is with a checklist that is designed to meet the requirements of each project.
Other than considering site-specific instructions, the checklist should identify the following: • Type and number of (labeled) bottles, including extras • Field equipment such as meters (with adequate trouble-shooting equipment
for small repairs), sampling tools (multiple samplers, through ice samplers, Van Dorns, automatic composite samplers) and filtration apparatus
• Preservatives • Appropriate quantity of ice packs and coolers • Log books • Personal gear (for all possible weather conditions, e.g., survival suits,
raincoats, protective footwear, waders, gloves, etc.) • First aid kit • Equipment (checked and calibrated, properly loaded to avoid damage during
transport, batteries charged, probes not damaged or dried, etc.) • Camera or video equipment as required • Laboratory requisition forms (partially filled out)
Before going to the field: • Contact a qualified laboratory to arrange for the required analyses
A recommended operating procedure is to have the key equipment in a box or plastic “tote” which is dedicated to this activity. Appendix 1 of this chapter presents an example of a generic checklist.
2.2 Locating the Site in the Field It is the responsibility of the field staff to locate all sampling stations accurately. Only if the same location is consistently sampled can temporal changes in the water quality be interpreted with confidence. Therefore, accurately written station location descriptions (that identify key landmarks and give the site a simple and unambiguous name) must be prepared on the first visit to every sampling site (see Appendix 2.1 for an example of a site identification guide sheet). Good photographic documentation is the best way of ensuring that each site is easily recognized.

Ambient Freshwater and Effluent Sampling
Field Sampling Manual, 2013
204
A map that labels the sample sites should accompany the site identification log book. This can be in the form of a 3-ring binder with a 1:50 000 map. The basic site location data (see Appendix 2.1 - latitudes, longitudes, map sheet #, site identification #, etc.) should be incorporated into the Water Quality database (EMS in the case of BC Environment). In many cases, a detailed site map may be helpful in describing the station location. Global Positioning Systems (GPS) are becoming common tools for locating position of sites and are recommended for this purpose.
2.3 Field Notes/Observations Good sampling practice always involves the use of detailed field notes. Specific information about seemingly unimportant facts such as the time of day or weather conditions are often important when interpreting data. A field log book (3-ring binder with water proof paper) for each project is mandatory (see Appendices 2 and 3 of this chapter for examples of data sheets). All field measurements should be entered directly into this field log book while in the field. All information recorded in the log book should be entered into the database immediately upon return from the field.
In addition to documenting standard conditions and measurements, field staff are responsible for noting any unusual occurrences. Any deviations from standard protocols (e.g., samples taken from a different location due to safety or access considerations or procedures used that differ from those outlined here) must be recorded in the database. Upon observing an anomalous condition, such as an unusual colour or odour of the water, excessive algal growth, indications that foreign substances have entered the system (oil slicks, surface films, etc.), or fish kills, the field investigator should take samples in addition to those required by the project design. The type of samples and their preservation should be consistent with the type of analyses that the investigator thinks are warranted by the prevailing conditions. If additional samples are collected, but not exactly at an established station, a new site location description should be accurately recorded and transferred to the database (EMS) as soon as possible. This information and additional samples will prove useful during the interpretive aspects of the study. The field books are important documents and efforts should be made to ensure they are properly archived.

Ambient Freshwater and Effluent Sampling
Field Sampling Manual, 2013
205
3. Quality Assurance/Quality Control (QA/QC)
3.1 Field Quality Assurance The field quality assurance program is a systematic process which, together with the laboratory and data storage quality assurance programs, ensures a specified degree of confidence in the data collected for an environmental survey. The Field Quality Assurance program involves a series of steps, procedures and practices which are described below.
The quality of data generated in a laboratory depends, to a large degree, on the integrity of the samples that arrive at the laboratory. Consequently, the field investigator must take the necessary precautions to protect samples from contamination and deterioration.
There are many sources of contamination; the following are some basic precautions to heed:
• Field measurements should always be made using a separate sub-sample which is then discarded once the measurements have been made. They should never be made on a water sample which is returned to the analytical laboratory for further chemical analyses. For example, specific conductance should never be measured in sample water that was first used for pH measurements. Potassium chloride diffusing from the pH probe alters the conductivity of the sample. Similarly, pH should not be measured from a sample that will be analyzed for phosphorus, as some pH buffers contain phosphorus. Use a separate bottle for water temperature if not in-situ. Dissolved oxygen measurements (by DO probe) should be made in-situ rather than in a separate container.
• Sample bottles, including bottle caps, must be cleaned according to the recommended methods and certified by the issuing laboratory as ‘contamination free’ (if pre-cleaned by the laboratory), for the intended analysis. Sample bottles which are pre-cleaned by the laboratory must not be rinsed with the sample water being collected. Bottles must be supplied with cap in place. Note that cleaned re-used bottles are not suitable for some trace constituents. If you are using a mixture of pre-cleaned, not pre-cleaned, and/or re-used bottles, label each bottle type to avoid confusion.
• Use only the recommended type of sample bottle for each analysis (see Appendix 4 of this chapter).

Ambient Freshwater and Effluent Sampling
Field Sampling Manual, 2013
206
• Reagents and preservatives must be analytical grade and certified by the issuing laboratory to be contamination free (see Appendix 4). Containers holding chemical reagents and preservatives should be clearly labeled both as to contents and as to expiry date. No reagent or preservative should be used after the expiry date. Return expired reagents to the laboratory for proper disposal.
• If conditions dictate that samples from multiple sites be preserved at the same time (such as when returning to shore after sampling several deep stations), the possibility of adding the wrong preservative to a sample or cross-contaminating the preservative stocks should be minimized by preserving all the samples for a particular group of variables together. Colour-coded bottles and matching preservatives prevent mix-ups.
• The inner portion of sample (and preservative) bottles and caps must not be touched with anything (e.g., bare hands, gloves, thermometers, probes, preservative dispensers, etc.) other than the sample water and preservative. Remove caps only just before sampling and re-cap right away.
• Keep sample bottles in a clean environment, away from dust, dirt, fumes and grime. Bottles must be capped at all times and stored in clean shipping containers (coolers) both before and after the collection of the sample. Vehicle cleanliness is an important factor in eliminating contamination problems. During sample collection, store bottle caps in a clean, resealable plastic bag, not in pockets, etc.
• Petroleum products (gasoline, oil, exhaust fumes) are prime sources of contamination. Spills or drippings (which are apt to occur in boats) must be removed immediately. Exhaust fumes and cigarette smoke can contaminate samples with lead and other heavy metals. Air conditioning units are also a source of trace metal contamination.
• Filter units and related apparatus must be kept clean, using routine procedures such as acid washes and soakings in de-ionized water (see section 9). Store cleaned filter units in labelled, sealed plastic bags.
• Samples must never be permitted to get warm; they should be stored in a cool, dark place. Coolers packed with ice packs are recommended (most samples must be cooled to 4°C during transit to the laboratory). Conversely, samples must not be permitted to freeze unless freezing is part of the preservation protocol (Appendix 4). Cool samples as quickly as possible. A common mistake is to forget that a large volume of warm water soon melts a small amount of ice.

Ambient Freshwater and Effluent Sampling
Field Sampling Manual, 2013
207
• Samples must be shipped to the laboratory without delay so that they arrive within 24 hours of sampling. Certain analyses must be conducted within 48 hours or within specified time limits set out in Appendix 4.
• Sample collectors should keep their hands clean and refrain from eating or smoking while working with water samples.
• Sample equipment and shipping coolers must be cleaned after each sampling round (see Section 9). Field cleaning is often not as effective as cleaning equipment at a support facility. Depending upon the analyte and concentration (i.e., metals or organics), it may only be possible to conduct effective cleaning procedures at a support facility, rather than in the field. Avoid using bleaches and strong detergents; specialty cleaning compounds are available.
• De-ionized water should not be used after 6 months (shelf-life period), and the containers should be clearly labeled with both the filling date and disposal date.
Note: Bottle cap liners of composite materials such as Bakelite must not be used due to high potential for contamination.
3.2 Quality Control Quality control is an essential element of a field quality assurance program. In addition to standardized field procedures, field quality control requires the submission of blank samples to test: 1) the purity of chemical preservatives; 2) to check for contamination of sample containers, filter papers, filtering equipment or any other equipment that is used in sample collection, handling or transportation; and 3) to detect other systematic and random errors occurring from the time of the sampling to the time of analysis. Replicate samples must also be collected to check that the sample is reproducible. Replicate samples allow the precision of the sampling and measurement process to be estimated, and are an additional check on sample contamination. The timing and the frequency of blank and replicate samples are established in the project design and will vary with each project. A minimum level of effort would be the use of blanks and replicates consisting of 10% of the samples. Another aspect of quality control is the use of certified or standard reference materials (CRM’s or SRM’s) and of spiked samples to assess laboratory process.
3.2.1 Blanks Blanks are samples that do not contain the variable to be analyzed and are used to assess and control sample contamination. They are most often used to assess contamination of the trace measurements (metals and

Ambient Freshwater and Effluent Sampling
Field Sampling Manual, 2013
208
nutrients) but should also be used on occasion to test potential contamination of the other analyses (such as general ions). Most blanks are carried through the entire sample collection and handling process so that the blank is exposed to the same potential sources of contamination as actual samples. Ideally, blanks should be prepared by the analytical laboratory in the appropriate sample bottles under clean conditions. Some of the blanks remain in the laboratory for analysis (laboratory blanks), while the remainder travel to the field for use as trip, field, equipment, and filtration blanks. Alternatively, blanks may be prepared in the field as outlined below.
3.2.1.1 Trip Blanks Trip blanks are meant to detect any widespread contamination resulting from the container (including caps) and preservative during transport and storage. The recommended practice for organic parameters is to use carbon free de-ionized water for trip blanks.
PROTOCOL
(a) Prior to a field sampling trip, one or more sample bottles for each type being used during the trip are selected at random, filled with de-ionized water that is provided by an analytical lab (preferably one different from the one samples are being sent to) and preserved in the field in the same manner as field samples (see section 7.2).
(b) These bottles are capped and remain unopened throughout the sampling trip. They are transported to the field with the regular sample bottles and submitted with the field samples for the analysis of interest.
3.2.1.2 Field Blanks Field blanks mimic the extra sampling and preservative process but do not come in contact with ambient water. Field blanks are exposed to the sampling environment at the sample site. Consequently, they provide information on contamination resulting from the handling technique and through exposure to the atmosphere. They are processed in the same manner as the associate samples (i.e., they are exposed to all the same potential sources of contamination as the sample). This includes handling and, in some cases, filtration and/or preservation.

Ambient Freshwater and Effluent Sampling
Field Sampling Manual, 2013
209
PROTOCOL (field blanks)
(a) If the blank was prepared by the lab, then open the bottle to expose the de-ionized water to the air for as long as the sample was exposed when it was collected. Otherwise, when the blank is prepared in the field, pour de-ionized water into the pre-labeled field blank bottle and recap it (this simulates sample collection). Document whether it was a lab prepared or a field prepared blank.
(b) Filter the sample as per the protocol outlined in section 7.1 (only if the associate sample requires filtration).
(c) Add preservative as per section 7.2 (only if the associated sample requires preservation).
(d) Ship to the lab with the remaining samples.
3.2.1.3 Equipment Blanks (prepared prior to the field trip) A field equipment blank is a sample of de-ionized water that has been used to rinse sampling equipment. This blank (perhaps more properly described as a rinsate) is useful in documenting adequate decontamination of equipment. It is collected after completion of the decontamination process (washing) and prior to sampling.
PROTOCOL
(a) Pour the rinse (de-ionized) water that was used for the last rinsing into a pre-labeled bottle that identifies the piece of equipment that was cleaned.
(b) Submit the blank with the regular samples for analysis.
3.2.1.4 Filtration Blanks Filtration blanks (or rinsate blanks) are de-ionized water that is passed through the filtration apparatus in the same manner as the sample. Analysis of the filtrate provides an indication of the types of contaminants that may have been introduced through contact with the filtration apparatus. Filtration blanks are also used as a check for potential cross-contamination through inadequate field cleaning techniques (rinsing of the apparatus with de-ionized water between samples). It should be done both at the start and again at some point between samples (after the apparatus has been cleaned

Ambient Freshwater and Effluent Sampling
Field Sampling Manual, 2013
210
and immediately before the next ‘real’ sample is filtered). Each of these blanks is preserved in the same fashion as the associate samples.
PROTOCOL
(a) Follow procedure outlined in section 7.1 (filtration).
3.2.2 Replicate Samples
3.2.2.1 Co-located Samples (field duplicate, triplicate, etc.) Co-located samples are independent samples collected as close as possible to the same point in space and time and are intended to be identical. These samples are essential in documenting the precision of the entire sampling and analytical (laboratory) process.
For this procedure, simply follow (and repeat) the protocol outlined in section 4 (sample collection).
Note: Replicate samples have more information than either blanks or split samples, and are particularly recommended for QC studies.
3.2.2.2 Split Samples Split samples are aliquots taken from the same container and analyzed independently by one or more laboratories. They are used to obtain the magnitude of errors owing to contamination, random and systematic errors, and any other variability, which are introduced after the time of sampling through analysis at the laboratory(ies). Split samples are commonly used to compare two or more laboratories. Care must be taken to ensure that the samples are split in a way to ensure homogeneity (a sample splitter must be used for samples containing suspended solids or effluents).

Ambient Freshwater and Effluent Sampling
Field Sampling Manual, 2013
211
3.2.3 Spiked Samples (Field) Spiked samples for each variable being tested are prepared by spiking aliquots of a single water sample with known amounts of the variable of interest. The information gained from spiked samples is used to reveal any systematic errors (or bias) in the analytical method. The spike solution is prepared by an analytical laboratory (preferably) or it can be prepared by the field staff (far less desirable) prior to the sampling trip.
PROTOCOL (spiked samples)
(a) Collect the sample in a pre-labeled bottle as per section 4.
(b) Add the aliquot of spike solution, recap the bottle, mix and then treat the sample as if it were a regular sample (i.e., preserve and filter if required).
3.2.4 Reference Samples Reference samples are used to document the bias of the analytical (laboratory) process. There are two types of reference samples. The first, and simplest, is when an independent laboratory prepares a water sample with the addition of a known quantity of a variable of interest. In this case, the independent laboratory should provide calculated and measured concentrations on the variable.
The second type of reference material is a certified reference sample. It is obtained from a recognized national scientific body such as the National Research Council. The sample itself is an aliquot of a very large stabilized (may be preserved) batch sample that was collected from one place at one time. The batch sample has been subjected to a large number of analyses performed by independent laboratories using several different analytical techniques, but some reference materials are analyzed by different labs using the same methodology. Consequently, the distributing agency can provide a mean value and confidence interval for the variable of concern.
These samples are submitted blind to the analyzing laboratory along with the samples collected during a field trip. There is the option of submitting them blind (labeled as a regular sample) or non-blind with labeling that it is a certified reference material. The former is a more desirable QA tool.

Ambient Freshwater and Effluent Sampling
Field Sampling Manual, 2013
212
4. Collecting Samples Water samples are often obtained by filling a container held just beneath the surface of the water, commonly referred to as a dip or grab sample. Through the use of special depth samplers (such as a Van Dorn bottle), grab samples can also be obtained from deep waters. This is important as distinct thermal and chemical differences can occur throughout the water column. Composite samples are obtained by mixing equal volumes of discrete grab samples (collected at one point at regular time intervals or, collected from multiple points such as varying depths). A composite sample provides an estimate of average water quality conditions.
Note: If sample bottles have not been pre-cleaned by the laboratory, then they must be rinsed 3 times with either de-ionized water or sample water. The exceptions to this is when a sample is to be analyzed for suspended sediments, for contaminants likely associated with the suspended solids, or for oil and grease. In these cases, the bottles should not be rinsed with sample water as suspended particles or grease-like materials are retained on the interior surface of each bottle with each rinsing. For specialized analyses (trace metal, organics) and pre-cleaned bottles, containers should not be rinsed. Rinsing is not a recommended practice. Use of pre-cleaned bottles is recommended, where practical. Where bottles are rinsed, the rinsate should be discarded.
Special sampling and handling techniques known as “clean” and “ultra clean” methods are needed to achieve accurate results when measuring low-level trace metals in ambient waters. Clean methods are needed to quantify trace metals accurately when the concentrations are less than about 20 mg/L and down to 0.1 mg/L. Ultra clean methods are needed when the metal concentrations are less than 0.1 mg/L, as might be required for trace metals such as mercury, cadmium, or silver (Hunt et al., 1995). These methods are not in general use in British Columbia at this time, and detailed guidance on the methods has only recently become available. We expect that guidance on clean and ultra clean techniques will be added to the next edition of this field manual. In the interim, sample collectors should refer to the recent US Environmental Protection Agency report of the subject (USEPA, 1995).
4.1 Lake Sample stations can be located either near-shore or in deeper waters (deeper sites are typically located over the deepest point of the lake). In general, the near-shore sites detect those effects that are associated with influences such as groundwater and run-off. Deep stations provide information about the water column, such as conditions associated with stratification (depth profiles). Additionally, near-shore sites tend to provide information on a relatively short time scale (days or weeks). The deeper sites allow for documentation on a seasonal or longer time frame.

Ambient Freshwater and Effluent Sampling
Field Sampling Manual, 2013
213
4.1.1 Shore Sample Sample collection at near-shore stations generally consists of grab samples at a specified location. It is critical that there be no deviation in location unless conditions at the site (e.g., severe weather, physical changes of the site, etc.) pose a threat to the sampler’s safety. If safety is threatened, then search for an alternative location nearby, or simply do not attempt to take the sample. If an alternative location is found, then all details regarding the new site and the reasons why the alternative was necessary must be recorded in the field log book. This information should be entered into the database as soon as possible after returning from the field.
To avoid contamination from suspended sediments, the sample collector should preferably sample from a boat or a dock or, if that is not possible, should wade out past the point where wave action affects the lake bottom. In most cases, this distance is not far from shore. But, in any case, the sampler should not exceed a depth where there exists a reasonable possibility that water might enter the gum-boot or hip-wader. This is particularly important during colder periods of the year when getting wet poses a health risk (such as hypothermia).
PROTOCOL (for collecting shore samples)
(a) Obtain labeled bottles and wade into the lake at the most accessible point.
(b) Once you reach a sufficient depth (where bottom material will not interfere with the sample), stop and orient yourself towards the center of the lake.
If rinsing is required (see section 4, Collecting Samples), proceed from step (c), otherwise start at step (h).
(c) Remove the lid and hold it aside without touching the inner surface.
(d) With your other hand, grasp the bottle well below the neck. Lean out towards the center of the lake and, in one continuous motion, plunge the bottle beneath the surface and slowly force it through the water until it is partly full. This motion creates a current over the mouth of the bottle (such that water entering the bottle has not come in contact with your hand).
(e) Replace the lid and shake the bottle vigorously.
Ambient Freshwater and Effluent Sampling
Field Sampling Manual, 2013
214
(f) Remove the lid and reach back towards shore to pour the water out.
(g) Repeat steps (c) through (f) twice more before collecting the sample.
(h) Remove the lid (without touching the inner surface) and grasp the bottle well below the neck. Lean out towards the center of the lake and, in one continuous motion, plunge the bottle beneath the surface and slowly force it through the water until it is full.
(j) Return to shore and pack the sample(s) in a cooler until time and conditions permit for other necessary procedures (filtration and/or preservation, which should be done as soon as possible after the samples are collected).
4.1.2 Sampling from a Boat
The collection of deep water samples requires that at least one member of the sampling group be very familiar with boat operation and safety. If the sampling trip involves the use of a boat, then the weather forecast or marine conditions should be obtained prior to departure from home. If conditions are poor, then the sampling trip should be postponed.
4.1.2.1 Site Identification Deep water sampling sites are marked with a buoy or referenced by easily identifiable features (preferably two) on shore. Reference points should be described (both in writing and with photographs) in the site identification log book. Once at the site, and if it is not too deep, anchor the boat (or tie it to the buoy) and wait until it settles with the bow (front) facing into the current (wind) before collecting the sample. If the water is too deep to anchor, then one person will have to maintain the location (with either the motor or with paddles) while the other person collects the samples and takes the field measurements.
4.1.2.2 Surface Water PROTOCOL
(for collecting surface water)
(a) The person at the bow (front) should always collect the samples. This is because the bow is the anchor point and, even in a slow moving water, the boat will drift so that the bow is upstream. In quiescent water the samples should be collected prior to anchoring and while the boat is slowly moving forward. These precautions reduce the potential of

Ambient Freshwater and Effluent Sampling
Field Sampling Manual, 2013
215
contamination from the boat or motor. The person in the stern (rear) can be responsible for holding the boat’s position (when not anchored), taking the field measurements (see section 6) and field notes. Contamination is not as much of a concern for field measurements.
(b) Obtain a labeled sample bottle and remove the lid without touching the inside of the lid (or bottle!). If rinsing is required for the type of bottle, fill and rinse three times [see 4.1.1 (c) to (g)].
(c) Reach out an arm length from the boat to take the sample. Ensure that the person in the stern is providing counterbalance (working over the opposite side of the boat).
(d) Plunge the bottle under the surface and move it slowly towards the current (the direction the boat is facing). This should be done at a depth of approximately 0.5 meters.
(e) Recap the bottle immediately and proceed with the next sample.
(f) Samples requiring filtration and/or preservation (see sections 7.1 and 7.2) should be dealt with as soon as possible after returning to shore.
4.1.2.3 Deep Water Lake water samples may be collected from any desired depth through the use of a Van Dorn (or similar) sampler (Figure 1). The Van Dorn bottle is designed for sampling at a depth of 2 metres or greater. A drain valve is provided for sample removal. Note that Van Dorn samplers are available in both horizontal and vertical configurations. The advantage of the vertical configuration is that the water within the open bottle is flushed out as the bottle is lowered, so one can be guaranteed the water collected was collected from the indicated depth. The advantage of the horizontal configuration is that a very narrow depth range is sampled. Vertical configurations are most commonly used. The horizontal configuration should be used when samples are taken near bottom at the sediment-water interface, or when samples are required from a narrow band of the depth profile (i.e., chemocline, thermocline).

Ambient Freshwater and Effluent Sampling
Field Sampling Manual, 2013
216
The sampling sequence recommended is to obtain the field measurements first (temperature, DO, conductivity - see section 6). These are often necessary prerequisite for locating the depths from which the water samples should be taken (i.e., if three deep samples are required at a site then it might be necessary to know the depths of the major stratified zones - epilimnion, thermocline, hypolimnion).
Although operation of the Van Dorn bottle varies slightly depending on its size and style, the basic procedure is the same.
PROTOCOL
(for collecting deep water)
(a) Ensure the sampling bottle is clean.
(b) Open the sampler by raising the end seals.
(c) Set the trip mechanism.
(d) Lower the sampler to the desired depth.
(e) Send the messenger down to “trip” the mechanism that closes the end seals.

Ambient Freshwater and Effluent Sampling
Field Sampling Manual, 2013
217
(f) Raise the sampler to the surface.
(g) Transfer the water sample from the Van Dorn bottle to individual sample containers via the drain valve. Take care to avoid contact with the drain spout as contamination at this stage often occurs.
(h) Rinse bottles 3 times (if they have not been pre-washed), and collect sample (see section 4.1.1).
(i) Filter and/or preserve the samples as required once at shore.
4.1.3 Winter Sampling Sampling in winter presents extra elements of danger. Always proceed with caution over ice and do not jeopardize your safety. Check the ice for thickness with a rod or ice chisel every few steps (ice should be a minimum of 3 to 4 inches thick). Ice over moving water can be of varying thickness, and the strength of the ice cannot be estimated from its apparent thickness near the shore. Always have someone accompany (follow) you, wear a life jacket, and carry a length of rope (tied around your waist) to use as a life line. If the ice is unsafe, do not take a sample. Never take unnecessary risks.
Note: Ice near the outlet of a lake is often thin, therefore, caution should be used when sampling this area of a lake. Additionally, ice thickness on reservoirs, where water levels fluctuate, can be variable.
In springtime, ice can be thick, but not strong enough to walk on (often called “Frazzle” or “corded” ice).
PROTOCOL (for sampling through ice)
(a) With safety considerations in mind, winter sampling locations should be as close as possible to the summer locations. The sites should be chosen where the water is known to be deep enough to avoid stirring up bottom sediments and to ensure that there is water movement under the ice at your selected spot. It is preferable to select a site where the ice is sagging rather than bulging.
(b) Clear loose ice and snow from the sampling location, and drill through the ice with a hand or motorized auger. Keep the area around the hole clear of potential contamination (e.g., dirt, fuel,

Ambient Freshwater and Effluent Sampling
Field Sampling Manual, 2013
218
oil, etc.). At least one member of the sampling team should be familiar with the operation and safety of both motorized and hand operated augers.
(c) Remove all ice chips and slush from the hole, using a plastic sieve.
(d) Use a Van Dorn (or similar) sampler to collect the sample (see section 4.1.2.3).
(e) Do not allow samples to freeze.
Note: An alternative to this method would be to use the Through-Ice sampler described in section 4.2.4 - Winter Sampling on rivers (this technique does not allow the collection of samples that are deeper than 2 metres). Any deviations from the above protocol must be noted in the field log book.
4.2 River/Stream The majority of samples collected from streams and rivers in British Columbia are grab samples taken near the surface at one point in the cross section of the flow. On rare, special occasions, more sophisticated multi-point sampling techniques known as equal-discharge-increment (EDI) or equal-width-increment (EWI) methods are used. Since these techniques are infrequently used they will not be discussed here, but further information about the protocols can be obtained from Clark and Shera, 1985.
Note: The collection of samples for the purpose of assessing the suspended sediment load in fast flowing waters requires specialized techniques/equipment. The equipment is not readily available, therefore, the protocols will not be discussed here. For information regarding the equipment and techniques, refer to Guy and Norman (1970) or Stichling and Smith (1968).
4.2.1 Access from the Stream Bank Wherever practical, samples should be collected at mid-stream rather than near-shore. Samples collected from mid-stream reduce the possibilities of contamination (i.e., shore effects - back eddies, seepage from near shore soils, atmospheric components such as pollen concentrating in slow moving water, etc.). Samples should not be taken in back eddies or brackish waters unless required by the monitoring program objectives. The most important issue to consider when deciding where the sample should be collected from is SAFETY. If the flow is sufficiently slow that the collector can wade into the stream without risk, then the sample can be

Ambient Freshwater and Effluent Sampling
Field Sampling Manual, 2013
219
collected at a depth that does not pose a threat (discretion is the key - never wade into water that appears deep or fast flowing). When conditions dictate that the sample be taken from the stream bank, deviations from the standard protocol should be accurately documented in the field log book and transferred to the database as soon as possible. Samplers must be wary of non-visible bottom under turbid conditions.
PROTOCOL (for wading into flow)
(a) Obtain labeled bottles and wade into the river downstream from the point at which you will collect the samples, then wade upstream to the sample site. This ensures that you will not disturb sediments upstream of the sample point. Attach safety line if conditions have any significant risk.
(b) Stand perpendicular to the flow and face upstream.
(c) Remove the lid and hold it aside without touching the inner surface. If rinsing is required for the type of bottle, fill and rinse three times (see section 4).
(d) With your other hand, grasp the bottle well below the neck. Plunge it beneath the surface in front of you with the opening facing directly down, then immediately orient the bottle into the current. Avoid collecting surface scum and film.
(e) Once the bottle is full, remove it from the water by forcing it forward (into the current) and upwards.
(f) Replace the cap immediately.

Ambient Freshwater and Effluent Sampling
Field Sampling Manual, 2013
220
PROTOCOL (for sampling from the stream bank)
(when the current is too strong, water is too deep, or ice is too thin)
(a) Secure yourself to a solid object on shore (with a safety harness and line if necessary). As a safety precaution, the second person must remain nearby while the first is collecting the samples.
(b) Remove lid from a labeled bottle and place into a clean resealable bag (e.g., Zip Lock) so both hands can be used to take sample. If rinsing is required for the type of bottle, rinse three times.
(c) Hold the bottle well below the neck or secure it to a pole sampler.
(d) Reach out (arm length only) and plunge the bottle under the water with the opening facing directly down and immediately orient it into the current.
(e) When the bottle is full, pull it up through the water while forcing into the current.
(f) Immediately recap the bottle.
4.2.2 Access from a Bridge Some sample stations are designed to be sampled from a bridge. This allows the collection of samples from the central flow of rivers where wading is not an option. The samples can be collected using an apparatus called a multiple sampler (Figure 2) that is lowered over the side of the bridge. Since the multiple sampler holds more than one bottle, it has the advantage of allowing all containers (therefore, all variables) to be sampled at the same time and at the same place. This allows for more precise cross-referencing among the variables. Other pieces of equipment for single bottles are also available and can be used in situations that are appropriate.
The precise location at which the sampling device is lowered from the bridge should be marked to ensure that the same section of the river is sampled each time.

Ambient Freshwater and Effluent Sampling
Field Sampling Manual, 2013
221
Figure 2. Generalized multiple sampler
PROTOCOL (from bridge with multiple sampler)
(a) Remove the lid (with handle) from the multiple sampler.
(b) Secure all sample bottles (lids on) into the multiple sampler (as in Figure 2).
(c) Refit the lid to the sampler.
(d) Secure the free end of the sampler’s rope to bridge before attempting to take the sample.
(e) Remove lids from the sample bottles and place in a clean resealable bag (e.g., Zip Lock).
(f) Whenever possible lower the multiple sampler over the upstream side of the bridge (side the that the water reaches first), being careful not to disturb bridge surfaces with the rope or sampler. This avoids
Ambient Freshwater and Effluent Sampling
Field Sampling Manual, 2013
222
contamination of the sample from the bridge itself or substances falling into the water or into the open bottles from the bridge (e.g., fuel, oil, dust, wood chips, etc.).
(g) Allow the sampler to submerge to the point that all the bottle openings are below the surface.
(h) After a sufficient period has elapsed to fill all bottles, haul the sampler up, add preservatives where required, and recap each bottle before disassembling the sampler.
4.2.3 Sampling from a Boat Due to the fact that fast-flowing waters pose a serious threat, it is essential that the person operating the boat be very experienced with river boating. Ideally, there should be three people along on the sampling trip when it involves boating on a river. Two people are responsible for collecting the samples, taking field measurements and recording field notes. The remaining person is responsible for boat operation only.
Sampling trips should start at the site that is most downstream and work upstream. If mechanical problems should arise then the current will work to your advantage and assist you to return to the vehicle.
PROTOCOL (in flowing waters)
(a) When a sample site is reached the boat operator idles into the current so as to maintain the boat in one location. Use a reference point on shore to do this.
(b) The person in the bow is responsible for collecting the water samples (see section 4.1.2).
(c) The third person is responsible for the field measurements (see section 6).
4.2.4 Winter Sampling Due to the fact that flow patterns in rivers and streams are generally more complex than in lakes, there are additional safety factors to consider. Honeycombed ice and areas over rapids should always be avoided. Be aware that ice downstream from bridge supports may be thin as a result of
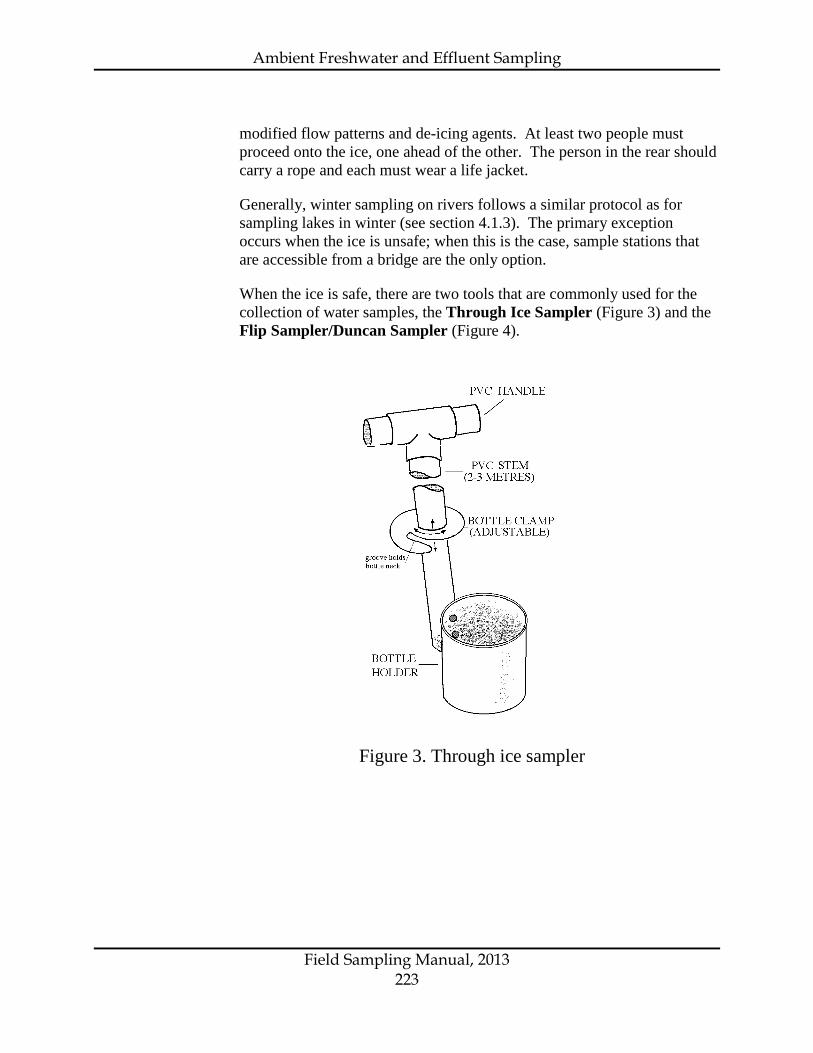
Ambient Freshwater and Effluent Sampling
Field Sampling Manual, 2013
223
modified flow patterns and de-icing agents. At least two people must proceed onto the ice, one ahead of the other. The person in the rear should carry a rope and each must wear a life jacket.
Generally, winter sampling on rivers follows a similar protocol as for sampling lakes in winter (see section 4.1.3). The primary exception occurs when the ice is unsafe; when this is the case, sample stations that are accessible from a bridge are the only option.
When the ice is safe, there are two tools that are commonly used for the collection of water samples, the Through Ice Sampler (Figure 3) and the Flip Sampler/Duncan Sampler (Figure 4).
Figure 3. Through ice sampler

Ambient Freshwater and Effluent Sampling
Field Sampling Manual, 2013
224
PROTOCOL (Through Ice Sampler)
(a) Clear loose ice and snow from the sampling location, and drill through the ice with a hand or motorized auger. Keep the area around the hole clear of potential contamination (e.g., dirt, fuel, oil, etc.). At least one member of the sampling team should be familiar with the operation and safety of both motorized and hand operated augers.
(b) Remove all ice chips and slush from the hole, using a plastic sieve.
(c) Load a pre-labeled bottle into the bottle holder of the Through Ice Sampler (Figure 3). Remove the bottle cap and insert stopper (with attached cord) into the bottle opening.
(d) Lower the sampler and bottle through the hole until it is clear of the bottom of the ice surface, and into freely moving water.
(e) Remove the stopper by pulling the cord, and allow the bottle to fill. For the bottle to fill in fast flowing water the sampler may have to be held at different angles.
(f) Bring bottle back up and decant water into the appropriate sample bottles (rinsing if required). For low-level metals analysis, a separate pre-cleaned (acid-washed) collection bottle must be used in the through ice sampler.
There are a variety of unusual conditions that may be encountered in sampling through ice. There may be meltwater below the snow on the ice surface, or there may be a slushy stratum within the ice itself. If these or other conditions occur, they should be noted in the field book and a judgment made as to whether the sample is worth taking.
Note: In streams where the ice is not too thick (20 -50 cm), it may be possible to sample with shoulder length gloves and reach below the ice into the flowing water.

Ambient Freshwater and Effluent Sampling
Field Sampling Manual, 2013
225
Figure 4. Flip sampler (Duncan sampler)
PROTOCOL (Flip/Duncan sampler)
(a) Clear loose ice and snow from the sampling location, and drill through the ice with a hand or motorized auger. Keep the area around the hole clear of potential contamination (e.g., dirt, fuel, oil, etc.). At least one member of the sampling team should be familiar with the operation and safety of both motorized and hand operated augers.
(b) Remove all ice chips and slush from the hole, using a plastic sieve.
(c) Load a pre-labeled bottle upright into the bottle holder (tygontubing) and rotate it so the mouth is facing down (Figure 4). Slip the noose over the bottom of the bottle.

Ambient Freshwater and Effluent Sampling
Field Sampling Manual, 2013
226
(d) Hold the rope and pole at the top while you lower the sampler through the hole to the desired depth.
(e) Pull the rope to pivot the bottle so that the mouth faces upwards. Allow the bottle to fill and return it to the surface. Cap it immediately.
PROTOCOL (from a bridge when ice is dangerous)
(a) When river ice is thin, a hole of sufficient size to collect a sample may be produced by dropping a weight attached to a hand line.
(b) Once the current has cleared the hole of debris, the protocol for sampling from a bridge (see section 4.2.2) should be followed.
Note: Extra care must be taken to avoid contamination in winter. De-icing agents such as salt can be easily transferred to the sample (particularly when working from a bridge).
5. Collecting Effluent and Receiving Water Samples Effluent sampling has a particular series of protocols associated with it and this type of sampling is usually conducted by the waste discharge permittees. The conditions of sampling (frequency, site locations, etc.) are determined through consultation between BC Environment and the permit holder. These conditions are then outlined in the permit itself. The sampling site must conform to Workers’ Compensation Board Regulations and other applicable safety requirements, and be readily accessible under all expected weather conditions.
An overview of the types of sampling and flow measurement procedures are presented in “Field Criteria for Sampling Effluents and Receiving Waters” (Bollans, et. al., 1989). The following protocols outline the steps required to ensure that the samples that arrive at the laboratory are representative of the true conditions in both the effluent and the receiving waters.
Blanks, as discussed in section 3.2.1, also apply to effluent sampling programs.
Appendix 4 of this chapter lists the container size and type, and preservation technique required for the individual parameters.

Ambient Freshwater and Effluent Sampling
Field Sampling Manual, 2013
227
5.1 Effluent Stream The sample must always be collected at the same location within the effluent stream to ensure that each is representative. Representative sampling locations occur where the effluent is well mixed in the river or stream (i.e., typically near the centre of the effluent stream in order to avoid boundary effects and biasing due to material which has a strong tendency to sink or float). Grab samples are generally specified when the concentration of a parameter under consideration is not expected to vary significantly with time; or when values associated with extreme events are desired or when the analyte is such that the procedure of compositing would destroy the sample integrity or representativeness (VOC’s, oil and grease) where the sample must be shipped for the lab in the original sample bottles. Composite samples are generally specified when the concentration of the parameter under consideration is expected to vary with time (or location). The individual samples that make up the composite may be of equal volume or be proportional to the flow at the time of sampling. The compositing period is defined according to the terms of the Permit (i.e., daily, over a four-hour period, etc.).
Note: When sampling effluents or receiving waters, the collector must wear protective gear (gloves, goggles, waders, etc.).
When variability in effluent flow rates exists, flow proportional composite sampling is a technique that must be used. In order to accomplish this, accurate (preferably continuous) flow measurements must be made. Automatic sampling devices (to collect grab or composite samples) are acceptable providing that the sample is in contact with only components made of acceptable materials (stainless steel, glass, plastic or Teflon). Plastic is acceptable except where samples are taken for organic analyses. Automatic sampling devices must be equipped with a purge mechanism to enable the sample line to be evacuated prior to sample extraction. The velocity in the sampling line should be a minimum of 0.75 m/s to prevent the settling of solid material.
PROTOCOL (grab samples)
(a) Obtain a pre-labeled sample bottle and remove the lid without touching the inner surface of either.
(b) Grasp the bottle well below the neck and plunge it into the effluent. Ensure that your hand is always downstream of the bottle opening.

Ambient Freshwater and Effluent Sampling
Field Sampling Manual, 2013
228
(c) Recap the bottle and place it in a cooler containing a sufficient quantity of ice packs (twice the volume of ice to sample in the summer, one to one in the winter).
(d) Once all the samples have been collected, process accordingly (see Appendix 3 of this chapter) and ship to the laboratory without delay (see section 8).
PROTOCOL (composite sampling - flow proportional)
Note: Flow proportional composite sampling is necessary when effluent flow rates vary significantly (variations exceeding +15% of the daily mean more than 10% of the time) and will normally be specified as a condition of the Permit.
Follow the protocol outlined above for the actual acquisition of the sample. The only variable will be the quantity collected each time. The following is a hypothetical example of calculations for quantity collected:
If you are required to collect 1% of the effluent discharge (expressed per second) and the discharge is 10 L/sec then you would collect 100 mL. If the discharge doubles to 20 L/sec then in order to collect the required 1% you would have to collect a 200 mL sample.
It will be necessary to store component samples in an interim storage container over the prescribed composite period. This container must be made of acceptable materials, and the procedures for cleaning and re-use must conform to the protocols outlined in section 9. The sample must be kept cool (4°C) throughout the collection process.
Interim discrete samples should be preserved if required after they are taken, rather than waiting until the end of the composite period for adding preservative.
It is important to maintain a record or the volume and time of collection of the discrete subsample.
5.2 Receiving Waters The sampling of receiving waters consists primarily of the same protocols and safety considerations as those discussed for ambient water sampling (see section 4). The possibility of elevated levels of contaminants at some locations warrants further safety practices (see WHMIS and Workers’ Compensation Board Regulations).

Ambient Freshwater and Effluent Sampling
Field Sampling Manual, 2013
229
The ambient conditions at each effluent discharge location dictate which sites are ideal as sampling stations. These sites, for testing the impacts of effluents on the receiving waters, are determined through consultation with the permittee. They will include the following considerations:
• A control site (receiving water in a location not affected by the discharge); • A site intended to monitor discharge impacts after complete mixing with the
receiving water; • A site intended to monitor outside a defined initial dilution zone.
Refer to Bollans et al., (1989) for a description of dilution zones.
Refer to section 4 (Collecting Samples) for the protocols required for the acquisition of receiving water samples. Samples can be collected as either grab or composites. The rationale for composite sampling provided for effluents also applies to receiving waters. Receiving water flow variations are not usually significant over the sampling period, therefore, a flow proportional composite is not necessary.
6. Field Measurements Field measurements involve the use of specialized equipment. Since different models are available for each variable, this section will discuss their use from a general perspective only. Field staffs are directed to the reference documentation provided by the instrument manufacturers. An equipment log book that documents instrument calibration, operation, and maintenance (yearly, at a service shop) records must be carried by the sampling staff at all times. This log book must contain information about each instrument available to the sampling group.
All field data are to be recorded in the field log book and entered into the database (e.g., EMS for BC Environment) as soon as possible upon return from the field.
6.1 Temperature Temperature can be measured with an alcohol-filled thermometer or with an electronic thermometer that has been calibrated against a certified thermometer. All thermometers must be checked against a reference thermometer by a laboratory before use and annually thereafter. Thermometers that do not meet the data quality objective of the project (e.g., ± 0.5°C of the true temperature) must be discarded.

Ambient Freshwater and Effluent Sampling
Field Sampling Manual, 2013
230
PROTOCOL (thermometer)
(a) Measure surface water temperatures directly in the water, allowing the thermometer to come to equilibrium before recording the value.
(b) For deep waters, collect a grab sample (e.g., with a Van Dorn - section 4.1.2.3) and decant some water into a 1 litre “field bottle” (never measure the temperature in a sample bottle that is being submitted to the laboratory for other analysis). Measure the temperature immediately, allowing the thermometer to come to equilibrium before recording the value.
Note: Ensure that the corresponding depth is identified for each temperature recorded in the field log book.
PROTOCOL (temperature using meters)
Note: Many meters have the capacity to measure temperature. Typically, though, temperature is measured with a combined temperature-dissolved oxygen meter. Temperature changes that occur with depth strongly influence the solubility of oxygen and therefore, the two need to be correlated (% saturation of dissolved oxygen).
(a) Calibrate the meter as per the operating instructions issued for each model.
(b) Check meter temperature readings, both in air and in water, against a thermometer of known accuracy as a quality control measure. If the measures do not agree, the meter can be adjusted to the thermometer reading. This check should be repeated throughout the day to determine if the meter is “wandering”. All adjustments must be recorded in the field log book. Temperature data are typically recorded to the nearest 0.5 degree.
(c) For depth profiles, record readings for increments of 1 - 2 metres. As a quality control measure, record the readings twice, once as the probe descends, and then again as it ascends.
6.2 Dissolved Oxygen (DO)
Dissolved oxygen can be measured by either chemical titration (Winkler method) or the membrane electrode method. Both have the potential of being accurate and reliable, but both methods require some training so that accurate measurements can be made. Meters provide a convenient and inexpensive way of measurement and are the most commonly used method. A well-calibrated oxygen meter membrane electrode system is preferred for obtaining a depth-profile of DO in a

Ambient Freshwater and Effluent Sampling
Field Sampling Manual, 2013
231
lake or deep river. Sampling for DO measurements requires particular care, since any contact between the sample and the air will modify the results. If percent saturation is to be determined, then the water temperature must be measured at the same time and location. Additionally, barometric pressure or altitude are required to accurately determine percent saturation.
Figure 5. Dissolved Oxygen sampler
PROTOCOL (Winkler method)
(a) If a DO sampler (Figure 5) is available the sample can be collected directly into a BOD (biochemical oxygen demand) bottle which is used for DO sampling. This sampler flushes 3 volumes of water through the bottle before it is filled (minimizing air-water contact). If this sampler is used, then proceed directly to step (c) after acquisition of the sample. Otherwise, a Van Dorn bottle can be used to collect water samples for DO analysis. In shallow waters (where a water-bottle sampler cannot be used), use a hand pump or a bucket with a clamped drain tube installed at the bottom.

Ambient Freshwater and Effluent Sampling
Field Sampling Manual, 2013
232
(b) When the sample has been collected with a Van Dorn bottle or into a bucket, then transfer the sample to a 250 or 300 mL BOD bottle immediately. Allow the water to flow continuously through a delivery tube placed to the bottom of the bottle, taking care to prevent turbulence and bubble formation. Wait until at least 3 times the capacity of the sample bottle has overflowed before gently removing the tube (count the number of seconds for the bottle to fill initially then repeat twice).
(c) Immediately and gently add the flocculating agent (typically a pre-measured powder pillow containing manganous sulfate and alkali-iodide-azide, available from HACH*). Insert stopper, being sure that no air becomes trapped in the bottle. Mix vigorously by inversion. Allow the precipitate to settle and shake vigorously again. At this point analysis can be suspended for up to 8 hours (when samples from all sites can be processed at the same time). Care must be taken to ensure that the samples are not exposed to light during the interim. Place in a cooler for transport to shore or laboratory. * If pre-packaged chemicals are not available, directions for preparation of the chemicals are given in Standard Methods.
(d) Add 1 mL of concentrated sulfuric acid (H2SO4) with an automatic pipette by inserting the tip just below the surface of the sample. Carefully insert the stopper and shake the bottle until all of the precipitate has dissolved.
(e) Measure 100 mL of the sample with a volumetric pipette and then transfer to a 250 mL Erlenmeyer flask. Touch the tip of the pipette to the side of the flask during delivery.
(f) Titrate with 0.005M standardized sodium thiosulfate solution. Mix the sample during titration until a very pale yellow is observed.
(g) Add 2 drops of stabilized starch solution, mix to get a uniform blue color, and titrate carefully but rapidly to a colourless end point. Record the volume of the titrant used in mL to two decimal places.
(h) Calculate the concentration of dissolved oxygen in the sample as follows:
mgO2/L = (mL titrant)(molarity of thiosulfate)(8000) (mL sample titrated)(mL of bottle - 2/mL of bottle)

Ambient Freshwater and Effluent Sampling
Field Sampling Manual, 2013
233
PROTOCOL (DO meter - most common model YSI 57)
(a) Follow instructions as per the manufacturer directions for storage, transportation, calibration, and use.
(b) Obtain DO readings for increments of 1 - 2 metres both during the descent and the ascent of the probe. Allow probe to equilibrate (a steady reading on the meter) at each depth before recording the value. When passing through a zone of rapid temperature or DO change (a lake thermocline for instance), two to five minutes may be required for equilibration.
Notes: 1. When membrane function deteriorates, it should be changed to avoid
contamination of the sensing element. Air bubbles must not be trapped under the membrane.
2. When measuring DO in lake hypolimnia, do not allow the probe to remain in waters of low DO (<0.5 mg/L) as the probe will become damaged.
Use high sensitivity membranes where possible. Service meters annually. Meters should never be stored for long periods with batteries inside. Probes need cleaning too. Attach tag indicating service date and battery change date. Always carry spare parts, including batteries.
A simplified but thorough set of instructions for operating and calibrating a DO meter should accompany the meter - preferably laminated in plastic.
6.3 Conductivity/Salinity Conductivity and salinity can be measured with a specific conductance meter or a multi-purpose meter (e.g., a Hydrolab).
PROTOCOL (a) Follow instructions as per the manufacturer directions for storage,
transportation, and use. Check the accuracy of the meter against a conductivity standard.
(b) Obtain readings for increments of 1 - 2 metres both during the descent and the ascent of the probe. Allow probe to equilibrate at each depth before recording value.

Ambient Freshwater and Effluent Sampling
Field Sampling Manual, 2013
234
(c) Check readings periodically by having water samples measured in a laboratory.
Notes: 1. Conductivity is a numerical expression of the ability of matter to carry
an electric current. If the matter is an aqueous solution the term conductance is synonymous with conductivity. Either term is correct.
2. Since the conductance of solutions changes with temperature, a correction is made (usually an internal automatic correction by the instrument) to estimate the conductance at 25 C, called the ‘specific conductance.’ Note that not all meters have temperature compensation. Also meters having temperature compensation can be damaged such that the temperature compensation is not working. Therefore instrument maintenance checks should include evaluation of the temperature compensation.
6.4 pH Either an electronic pH meter or a multi-purpose meter is used to measure pH. Most pH meters require that the sample be brought to the surface, while the Hydrolab can be lowered through the water column. This measurement is accurate for the current conditions only in a fresh sample. Rapid pH changes that occur as a result of gas diffusion, biological activity, and chemical reactions dictate that the measurements be performed immediately.
pH electrodes are available for specific measurement of pH in waters of low ionic strength and high ionic strength. It is imperative when measuring pH in water of low ionic strength that an electrode designed for measurement in solutions of low conductivity or dissolved solids be used. Caution should also be taken that the pH electrodes are functioning correctly - ones in long term use or storage can lose the internal electrolyte and provide inaccurate data.
pH is a deceptively easy measurement to make but without understanding of how to use the equipment correctly, the risk of inaccurate data is very high.
PROTOCOL (pH meter)
(a) Follow the pH meter manufacturer’s instructions for storage and preparation of the electrodes.
(b) Remove electrodes from the storage solution and rinse with distilled water. Electrode fill plug, if present, should be removed before taking readings.

Ambient Freshwater and Effluent Sampling
Field Sampling Manual, 2013
235
(c) In the field, calibrate the pH meter using two buffer solutions which will bracket the pH range of the samples [one at pH 7, one at acidic pH (4.0 or 5.0), or one at alkaline pH (8.0 or 9.0)]. Place the electrode in each solution for at least 1 minute (rinse well with distilled water between buffer solutions). If the reading does not correspond to the value of the buffer solution, adjust the meter and record the discrepancy in the field log book. Repeat this process before the end of the sampling day. Samples should be at or near the temperature of the buffers used for calibration or the meter be equipped with a temperature compensation probe.
Note: Never calibrate with just a single buffer solution.
d) Immerse the electrode directly into the surface water or into the field bottle (for samples collected from depth). Allow it to equilibrate before recording the value. Values are typically recorded to the nearest 0.1 pH unit.
(e) Check the field readings by having water samples measured periodically in a laboratory.
PROTOCOL (pH using a multi-purpose meter)
Note: These meters have automated internal calibration mechanisms that must be checked at time of overhaul maintenance, and the probes must be calibrated for each parameter.
(a) Follow instructions as per the manufacturer’s directions for calibration, storage, transportation, and use.
(b) Obtain readings for increments of 1 - 2 metres both during the descent and the ascent of the probe. Allow probe to equilibrate at each depth before recording value.
6.5 Clarity Water clarity in lakes is most commonly measured with a Secchi disc. The Secchi disc is a weighted disc, 20 cm in diameter, that is divided into black and white quadrants. The measurement is called the ‘extinction depth’.
PROTOCOL
(a) Lower the Secchi disc over the shaded side of the boat.
(b) Record the depth at which the pattern of the disc is no longer observable. The disc should then be lowered beyond this depth to determine, when it

Ambient Freshwater and Effluent Sampling
Field Sampling Manual, 2013
236
ascends, the depth at which it reappears. Average the two depth readings to calculate the extinction depth.
(c) Record the value in the field log book along with the weather and water surface conditions (e.g., cloudy, sunny, windy, surface chop, etc.). Measurements should be to the nearest 0.1 meter.
Note: Secchi disc readings should only be taken from 2 hours after dawn to 2 hours before dusk. During winter months, readings should only be taken between 10 A.M. and 2 P.M. Sunglasses should not be worn while taking the measurement.
6.6 ORP Oxidation-Reduction potential (ORP) is most commonly measured with a multi-purpose meter (e.g., Hydrolab).
PROTOCOL
(a) Follow instructions as per the manufacturer’s directions for storage, transportation, calibration and use.
(b) Obtain readings for increments of 1 - 2 metres both during the descent and the ascent of the probe. Allow probe to equilibrate at each depth before recording value.
(c) As the meter approaches the lake bottom (use bathymetric maps or a depth sounder to assess depth), the readings may drop rapidly. At this point, take care that the probe does not contact the sediment.
6.7 Stream Flow The most accurate measure of stream flow is achieved with a current meter used at multiple points along the cross section of the stream. However, simpler methods may be used if the flow estimates need only be approximate (cross-sectional area, a roughness factor, and floating object provide a very gross estimate of flow).
PROTOCOL (current meter)
(a) Follow flow meter instructions as per the manufacturer’s directions for storage, transportation, calibration, and use.
(b) Extend a measuring tape at right angles to the direction of flow and measure

Ambient Freshwater and Effluent Sampling
Field Sampling Manual, 2013
237
the width of the cross section. Record measurements on a data sheet. Leave the tape strung across the stream.
(c) Divide the width into segments using at least 20 points of measurement. If previous flow measurements have shown uniform depth and velocity, fewer points may be used. Smaller streams may also require fewer points. Measuring points should be closer together where depths or velocities are more variable. Cross sections with uniform depth and velocity can have equal spacing.
(d) Record the distance (from the initial starting bank) and the depth of each point.
(e) Record the current velocity at each measuring point.
Note: Horizontal and vertical variation of stream velocity may influence stream-flow measurements. To correct for vertical differences, hydrologists have determined depths that can yield acceptable estimates of the mean velocity over a vertical profile. If the depth exceeds 0.8 m, it is recommended that velocities be measured at 20 percent and 80 percent of full depth and averaged to estimate mean velocity. In the depth range 0.1-0.8 m, take the velocity at 60 percent of the full depth (measured from the surface) as an estimate of the mean over the profile.
(f) Calculate flow as a summation of flows in partial areas using the following equation:
qn = vn dn (bn+1 + bn-1) 2
where: q = discharge in partial area n (m3/sec) v = average current velocity in partial area n (m/sec) d = mean depth of partial area n (m)
bn+1 = distance from point to the following point (m) bn-1 = distance from point to the preceding point (m)
PROTOCOL (floating object)
(a) Measure stream width (w in meters) and average depth (d in meters). Width is width of the water exclusive of dry stream bed. The average depth must be estimated, but is typically 0.4 - 0.6 of maximum depth (for shallow streams and deep streams respectively).
Ambient Freshwater and Effluent Sampling
Field Sampling Manual, 2013
238
(b) Measure a three meter strip (l) along the stream bank that bisects the area measured in step (a) (very fast streams will require a strip longer than 3 m). Choose a location where both flow and substrate are fairly uniform and representative of the stream reach. Curved areas should be avoided.
(c) Toss a floating object (e.g., cork, twig, etc.) into the flow upstream of the three meter measure area. Time the float as it travels the three meter segment. Repeat this step five times to obtain a mean of the time interval (t expressed in seconds). It is recommended that you re-measure until you get 3 measurements very nearly the same.
(d) Discharge is then calculated as follows:
q = wdla/t
where:
q = discharge (in m3/second) a = roughness coefficient (0.8 if rough [boulders], 0.9 if smooth
[mud, sand])
7. Field Filtration and Preservation When the sampling objective is to determine concentrations of dissolved metals, low-level nutrients (e.g., phosphorus), or chlorophyll a in a water system, the sample must be filtered through a non-metallic 0.45 µm membrane immediately after collection. The guiding principle is to filter and preserve as soon as possible.
7.1 Filtration The field filtration apparatus recommended is a portable vacuum system designed for ease of use in the field, thereby minimizing the time between sample collection and filtration (Figure 6). When filtering more than one sample, always filter the samples in the order of lowest expected variable levels to the highest. This minimizes the risk of cross-contamination between samples.

Ambient Freshwater and Effluent Sampling
Field Sampling Manual, 2013
239
Figure 6. Filtration apparatus
PROTOCOL
(a) Rinse filtration apparatus with de-ionized water.
(b) With a pair of clean, non-metallic tweezers, place a filter paper on the surface of the mid-section of the filter apparatus. Assemble the apparatus as per Figure 6.
(c) Pour 250 mL of de-ionized water in the top section of the apparatus.
(d) Generate a partial vacuum by withdrawing the plunger of the syringe. Reject the initial filtrate (50 mL), then filter the remaining water through to the lower section of the apparatus.
(e) Disassemble the apparatus and pour the filtrate into a labeled sample bottle. This is the first filter blank.
(f) Reassemble the apparatus and filter first sample (as per instruction [d]) and pour the filtrate into a new labeled bottle. Always use standard amount of sample water (i.e., 250 mL) unless otherwise noted.

Ambient Freshwater and Effluent Sampling
Field Sampling Manual, 2013
240
(g) Rinse the entire apparatus twice with de-ionized water and proceed to next sample. Always rinse the apparatus thoroughly between sites.
(h) At some point between samples (or after the last sample - if not filtering many samples), rinse the apparatus twice, change the filter paper, and filter 250 mL of de-ionized water. Transfer the filtrate to a labeled ‘blank’ bottle (e.g., 2nd filter blank or final filter blank).
Note: Other filtration techniques are also available and acceptable (e.g., Nalgene hand operated vacuum pump, disposable luer-lok syringes, etc.). Dedicate different sets of filtering apparatus for ambient, receiving water and effluent.
Note: The apparatus should be cleaned in a lab between field uses by soaking in dilute nitric acid solution followed by de-ionized water rinse and placing the dry and clean apparatus in a resealable bag (e.g., Zip Lock) for transportation.
7.2 Preservation Many preservatives are considered hazardous materials and, therefore, the regulations outlined by WHMIS (Workplace Hazardous Materials Information System) must be adhered to. Read safety instructions and WHMIS material safety data sheets supplied for each preservative.
Deteriorated samples negate all the efforts and cost expended in obtaining representative samples. In general, the shorter the elapsed time between collection and analysis, the more reliable the analytical results.
Bulk dispensers for preservatives are not recommended due to the risk of contamination and deterioration over time. Preservatives should be pre-packaged in the laboratory in single-sample vials or ampoules to reduce the risk of contamination. Each of these ampoules should be labeled and have an expiry date beyond which they must be discarded in accordance with WHMIS regulations.
Note: Never use vials having Bakelite, or like material, as filler behind the cap liner of the lid.
Refer to Appendix 4 of this chapter for the quantity and type of preservative required for each individual analysis. Avoid pouring preservative down inside surface of sample bottle.

Ambient Freshwater and Effluent Sampling
Field Sampling Manual, 2013
241
PROTOCOL
(a) Before beginning, put on latex gloves and safety glasses or goggles.
(b) Add preservatives to those samples which need preservation, being sure to match each preservative with its similarly labeled sample bottle. Preservative containers must not come in contact with the sample or inside of the sample bottle/lid. Minimize the length of time that the sample or preservative is exposed to the atmosphere.
(c) Recap sample bottles tightly and invert twice to mix.
(d) Recap the preservative bottles/vials tightly and place into a protective container. Ship these and latex gloves back to the lab with the samples for disposal.
Note: Consult WHMIS for recommended procedures for spill cleanup. Samplers should become familiar with WHMIS procedures before going into the field.
8. Shipping The day’s sampling schedule must be designed to ensure that the samples arrive at the shipping agency’s terminal well before the end of business hours. Since some variables have very limited hold times (see Appendix 4), every effort must be made to avoid delays in shipping. The following is the procedure to be followed to maintain the integrity of the samples during transit.
PROTOCOL
Note: Ice packs should be used as opposed to loose ice or bagged ice. When loose ice melts, the contents of the cooler are free to shift, potentially allowing contamination of samples with melted ice water and/or breakage of glass bottles.
(a) Pack the samples upright in the cooler with at least 1 (winter) to 2 (spring, summer, fall) times as much ice as the total volume of the samples. Ensure that the samples that are most likely to deteriorate are closest to the ice packs (i.e., those that are not chemically preserved). Also, ensure that the glass bottles are separated from each other by ice packs, plastic bottles, or clean packing material to prevent them from shifting, falling over and/or breaking.

Ambient Freshwater and Effluent Sampling
Field Sampling Manual, 2013
242
(b) Complete the laboratory requisition forms, enclose them in a sealed plastic bag, and then tape them to the inside lid of the cooler or place them in the cooler on top of the samples. The recommended minimum information that should accompany samples to the laboratory (on each requisition form) includes:
• Name of the source • Site name • EMS site numbers • Date and time of collection • Name of collector • Field measurements • Comments on sample appearance, weather conditions, and any other
observations that may assist in interpreting water quality data
Additionally, a request should be made to the laboratory that they record the time and temperature of the samples at arrival (whenever samples requiring preservation by cooling to 4°C are shipped).
(c) Seal the cooler with heavy duty packing tape to reduce the possibility of it accidentally opening and to prevent tampering with the samples. Coolers arriving at the laboratory with torn or absent tape alert the lab staff that tampering might have occurred during transit.
(d) Attach a label prominently displaying the destination.
Note: If data on temperature on arrival is requested (to document that samples arrived at the laboratory at proper temperatures), a separate labeled bottle with water in it should be shipped in each cooler.
9. Cleaning Equipment
Equipment cleanness is an essential factor in ensuring that samples remain contaminant-free. All sampling devices (Van Dorn, multiple sampler, through ice sampler, tow nets, etc.) must be thoroughly cleaned and scrubbed with de-ionized water after each sampling trip. This process should be followed by two or three rinses with de-ionized water. The last rinsate should be collected and shipped for analysis as an equipment blank (see section 3.2.1.3).
Note: The Van Dorn sampler should be stored in the open position to prevent moisture from being trapped (might promote fungal or bacterial growth).

Ambient Freshwater and Effluent Sampling
Field Sampling Manual, 2013
243
General cleanliness considerations include:
• Shipping containers (coolers) wiped free of dirt and rinsed with de-ionized water • Vehicle neat and tidy • Trailer, boat and motor free of aquatic plants before use on another body of water
The filtration apparatus must be soaked in an acid bath (10% HCl) and rinsed three times with de-ionized water. The final rinsate should be submitted periodically as an equipment blank.
Equipment used for ambient sampling should not be used for effluent sampling. Each type of sampling should have equipment dedicated to that use.
10. Sources of Further Information American Public Health Association, American Water Works Association, Water
Environment Federation. Standard Methods for the Examination of Water and Wastewater. 1992. 18th edition. Edited by: Greenberg, A.E., Clesceri, L.S., Eaton, A.D., and Franson, M.A.H. Published By: American Public Health Association.
Bollans, R.A., Crozier, R., and McQuaker, N.R. 1989. Field Criteria for Sampling Effluents and Receiving Waters. Waste Management Branch, Ministry of Environment, Lands and Parks.
Clark, M.J.R. and Shera, W.P. (Editors). 1985. Methods for Aquatic Data Collection in Environment Canada. 1983. Sampling for Water Quality. Water Quality Branch, Inland Waters Directorate, Ottawa.
Guy, H.P. and Norman, V.W. 1970. Field Methods for Measurement of Fluvial Sediment. U.S. Department of the Interior.
Horner, R., Bloom, N., Crecelius, E., and Brown, S. 1991. Recommended Protocols for Measuring Conventional Water Quality Variables and Metals in Fresh Water of the Puget Sound Region. In: Puget Sound Estuary Program, Recommended Guidelines for Measuring Selected Environmental Variables in Puget Sound.
Hunt, C.D., Lewis, D.A., and Lasorsa, B. 1995. Trace Metal Clean Sample Collection, Handling, and Analysis. A Short Course. Second SETAC World Congress, Vancouver BC, November 5, 1995. Batelle Ocean Sciences and Batelle Marine Sciences Laboratory.

Ambient Freshwater and Effluent Sampling
Field Sampling Manual, 2013
244
Lynch, A.J. and van Aggelen, G. 1994. Guidelines for the Collection and Analyses of Water and Wastewater Samples for Legal Evidence. Laboratory Services, Environmental Protection Department. Ministry of Environment, Lands and Parks. 12p. + appendices.
Ontario Ministry of Environment. 1991. Draft Protocol for the Sampling and Analysis of Industrial/Municipal Wastewater, ISBN 0-7729-8970-2. Laboratory Services Branch, Ontario Ministry of Environment, ON.
Ryan, A.L., Wade, N.L., Thorp, A.C., and Webber, T.N. 1991. Water Sampling Field Operation and Safety. British Columbia and Canada Water Quality Monitoring Agreement.
Stichling, W. and Smith, T.F. 1968. Sediment Surveys in Canada. Inland Waters Branch. Department of Energy, Mines and Resources. Ottawa.
United States EPA. 1986. Puget Sound Protocols. Prepared by Tetra Tech Inc. for the USEPA and the U.S. Army Corps of Engineers, Seattle, WA.
United States EPA. April 1995. Method 1669: Sampling Ambient Water for Trace Metals at EPA Water Quality Criteria Levels. Office of Water. EPA 821-R-95-034.
USEPA. Handbook for Sampling and Sample Preservation of Water and Wastewater. Report No. EPA-600/4-82-029 (or most recent edition).
Water Pollution Control Federation. 1980. Wastewater Sampling for Process and Quality Control, Manual of Practice No. OM-1, Task Force on Plant Operational Control, WPCF, Washington, DC.
Wetzel, R.G. and Likens, G.E. 1991. Limnological Analyses. Second edition. Springer - Verlag, New York.
11. Revision History October 10, 2013: This section republished without change. Notes added to
Appendix 4: Sample Container, Preservation, and Hold Times for Water and Effluent Samples updated.

Ambient Freshwater and Effluent Sampling
Field Sampling Manual, 2013
245
Appendix 1 Generic Field Checklist (including water, sediments, biota and effluents)
General: Log Books____ Pencils____ Cooler (with ice packs)____ Felt Markers (waterproof)____ Rope____ Tape____ Camera (film)____ Requisition forms____ Way bills____ Shipping labels____ De-ionized water (4L)____ Squirt bottle____ Resealable bags____ maps____
Labeled Sample Bottles: General chemistry (1 L) #____ General chemistry (2 L) #____ Dissolved Metals #____ Total Metals #____ Total Organic Carbon #____ Low-level nutrients #____ Coliforms #____ Sediments #____ Zooplankton #____ Phytoplankton #____ Periphyton #____ Invertebrates #____ Tissue cups #____ Macrophytes____ Extras - two of each
Sampling Equipment (clean, in working order, batteries charged): DO Sampler (BOD bottle, Winkler reagents)____ Thermometer____ DO meter____ pH meter____ Conductivity meter____ Hydrolab____ Secchi disc____ Van Dorn, rope____ Through Ice Sampler____ Auger (bit sharpened, skimmer)____ Spare probe membranes (repair kit)____ Sediment grab____ Sediment corer____ Sieves____ Zooplankton tow nets____ Benthic invertebrate sampler (Hess, drift net, Surber)____ Periphyton kit (cup, denture brush, baster)____ Macrophyte sample kit (buckets, garbage bags, float tray, plant press, blot paper, herbarium sheets, newsprint, corrugated cardboard)____

Ambient Freshwater and Effluent Sampling
Field Sampling Manual, 2013
246
Filtration and Preservation Equipment: Filter Pots____ Syringe(s), Hose____ Tweezers____ 0.45/1.0 µ membrane filters____ Preservative Vials with acid____ Disposal Container (for used vials)____ 70% ethanol____ Formalin_____ Lugol’s solution____ Magnesium carbonate____ Boat Equipment: Canoe (or boat)____ Paddles____ Motor____ Fuel____ Life jackets____ Rope____ Anchor____ Tool kit____
Personal Gear: Lunch____ Survival suit____ Rain gear____ Gum boots____ Waders (hip, chest)____ Sun screen____
Safety: WHMIS guidelines____ First Aid Kit____ Goggles (or safety glasses)____ Rubber gloves____ Hard Hat (for industrial sites)_____

Ambient Freshwater and Effluent Sampling
Field Sampling Manual, 2013
247
Appendix 2 Site Identification Appendix 2.1 Site Identification Guide
Appendix 2.2 Site Data Sheet (Lake)
Appendix 2.3 Site Data Sheet (River)
Appendix 2.4 Site Data Sheet (Effluent)

Ambient Freshwater and Effluent Sampling
Field Sampling Manual, 2013
248
Appendix 2.1 Site Identification Guide
Lake / river name ______________________________
EMS site number ____________________
Latitude ___________________
Longitude __________________
Map sheet number ___________________ Elevation _____________
Access road names or numbers ____________________________________________
NOTES:
Distinguishing features ________________________________________________________________________________________________________________________________________________________________________________________________________________________________________________________________________________________________
Best access point to water
________________________________________________________________________________________________________________________________________________
Photograph/Access map

Ambient Freshwater and Effluent Sampling
Field Sampling Manual, 2013
249
Appendix 2.2 Site Data Sheet (Lake)
EMS site number ___________ Date ____________ Time ____________ Weather ________________________________________________________ Air temperature __________
Field Measurements:
Secchi depth _________
Depth (m)
Temp D.O. pH Cond ORP down up down up 0 2 4 6 8 10 12 14 16 18 20 22 24 26 28 30 (or depths appr. to lake)

Ambient Freshwater and Effluent Sampling
Field Sampling Manual, 2013
250
Appendix 2.3 Site Data Sheet (River)
Site number ___________
Date ____________
Time ____________
Weather ________________________________________________________
Air temperature __________
Field Measurements:
Water temperature __________
D.O. ____________
pH ___________
Conductivity ___________
Flow / discharge ____________
Stage (rising / falling) _______________
Substrate type ______________________
Flow Data Measurements for Cross-Sections:

Ambient Freshwater and Effluent Sampling
Field Sampling Manual, 2013
251
Appendix 2.4 Site Data Sheet (Effluent)
Site number_______________
Date_______________
Time_______________
Weather_______________
Site Observations
Effluent description_______________
Site observation_____________________
Maintenance/process considerations_______________

Ambient Freshwater and Effluent Sampling
Field Sampling Manual, 2013
252
Appendix 3 Sampling For The Most Common Variables
Appendix 3.1 General Chemistry (including nutrients)
Appendix 3.2 Metals
Appendix 3.3 Carbon
Appendix 3.4 Chlorophyll a

Ambient Freshwater and Effluent Sampling
Field Sampling Manual, 2013
253
Appendix 3.1 General Chemistry (including nutrients)
3.1.1 General chemistry (including acidity, alkalinity, chloride, colour, fluoride, hardness, nitrogen, pH, phosphorus, potassium, silica, sodium, specific conductance, sulfate and turbidity)
PROTOCOL
(a) Collect sample for all nutrients (as per sections 4 & 5) in a pre-labeled, plastic bottle (250mL to 2L depending on how many tests needed).
(b) Secure lid tightly and place in cooler with ice packs immediately.
(c) Do not field filter or preserve.
3.1.2 Low-level nutrients (phosphorus and nitrogen)
PROTOCOL
(a) Collect sample (as per sections 4 & 5) in a pre-cleaned (do not rinse), pre-labeled 250 mL brown glass bottle.
(b) Field filter all low-level nutrient samples. Always return filtered sample to a new (clean) pre-labeled bottle.
(c) Secure lid tightly and place in cooler immediately.
(d) Do not field preserve.

Ambient Freshwater and Effluent Sampling
Field Sampling Manual, 2013
254
Appendix 3.2 Metals
3.2.1 Total metals
PROTOCOL
(a) Collect sample (as per sections 4 & 5) in a pre-cleaned (do not rinse), pre-labeled 500 mL plastic bottle.
(b) Preserve the total metals samples with nitric acid (HNO3 provided by the analytical laboratory in individual ampules).
(c) Secure lid tightly and place in cooler immediately.
(d) Do not field filter.
3.2.2 Dissolved metals
PROTOCOL
(a) Collect sample (as per sections 4 & 5) in a pre-cleaned (do not rinse), pre-labeled 500 mL plastic bottle.
(b) Field filter all dissolved metal samples. Always transfer the filtered sample to a new (clean) pre-labeled bottle. Field filtration is a procedure where contamination often occurs. Extreme caution should be exercised.
(c) Once the sample has been field filtered and transferred to a new bottle, then preserve with nitric acid (HNO3 provided by the analytical laboratory in individual ampules).
Secure lid tightly and place in cooler immediately.

Ambient Freshwater and Effluent Sampling
Field Sampling Manual, 2013
255
Appendix 3.3 Carbon
3.3.1 Total organic/inorganic carbon
PROTOCOL
(a) Collect sample (as per sections 4 & 5) in a pre-labeled 250 mL plastic bottle.
(b) Secure lid tightly, ensuring that no air is trapped in the bottle, and place in cooler with ice packs immediately.
(c) Do not field filter or preserve.
3.3.2 Dissolved organic/inorganic carbon
(a) Collect sample (as per sections 4 & 5) in a pre-labeled 250 mL plastic bottle.
(b) Field filter each dissolved carbon sample. Always transfer filtered sample to a new (clean) pre-labeled bottle.
(c) Secure lid tightly, ensuring that no air is trapped in the bottle, and place in cooler with ice packs immediately.
(d) Do not field preserve.
Ambient Freshwater and Effluent Sampling
Field Sampling Manual, 2013
256
Appendix 3.4 Chlorophyll a
PROTOCOL
(a) Collect sample (as per section 4) into a pre-labeled plastic bottle.
(b) Secure lid tightly and immediately place in cooler with ice packs.
(c) When all samples for the day are collected, filter (using a .45 micron membrane filter) an appropriate portion of the chlorophyll a sample. This can be done in the field or in the lab within a few hours of collection if the samples are kept dark and cool. The filtration should be done in cool temperature and subdued light (not on the tailgate at the boat ramp!). The amount of sample filtered depends on the density of the algae present (productive lakes may require only 50 mL, unproductive lakes may require 1 L to be filtered). Always record the volume of sample that was filtered (both in the field log book and on the Laboratory Requisition Form).
(d) As the water sample is filtered, observe the filtration pressure or vacuum (<5psi) and the water level. When all but the last few mLs of water are drawn through the filter, rinse the top holding cup with de-ionized water and continue to filter. Before the rinse water is fully filtered, add 2-3 drops of MgCO3 suspension (1g magnesium carbonate / 100 mL de-ionized water) and gently swirl the apparatus to distribute the MgCO3. Magnesium carbonate is a buffer to stabilize the pH of the algal cells above 7. The cells are very sensitive to acid pH as the chlorophyll will then be degraded to other pigments like phaeophytins.
(e) With clean tweezers, carefully remove the filter and place it in the center of a larger (9 cm) ‘Whatman’ filter paper. Fold the two papers in half and then in half again (with the smaller filter paper inside the larger). Secure the filter papers shut with a plastic paper clip. With a pencil, label the ‘Whatman’ filter paper as a chlorophyll sample. Also, for each sample, identify the date, site number and the volume of water filtered directly onto the ‘Whatman’ filter paper.
Note: Some brands of filter papers have throw-away plastic separators. On occasion, it has happened that people have confused these plastic separators with membrane filters separated by throw-away paper. Be sure you know which is the filter and which is the throw-away!
Ambient Freshwater and Effluent Sampling
Field Sampling Manual, 2013
257
(f) Place the filter paper in a pre-cooled dark bottle (amber glass, wrapped with aluminum foil and black tape - chlorophyll is very sensitive to degradation by light) that contains a desiccating agent (i.e., silica gel).
Note: Silica gel will take up water until it is saturated, at which point it must be rejuvenated by heating it in an oven for several hours. Ordinary silica gel is white, whether fresh or saturated. However, dye is often added to warn you when the gel has been saturated. Usually fresh silica gel is blue and completely saturated gel is pink. Partially saturated gel is both blue and pink (i.e., purple). Note that some brands of silica gel use other colours so be sure what color change you should expect. This is readily done by wetting a gel crystal to check the colour for saturated silica gel. Never use saturated silica gel.
Two common errors by untrained staff are to use saturated gel, or to attach the gel outside the bottle.
(g) Pack the bottle containing all chlorophyll a samples in a cooler with ice packs (or dry ice) so that they remain frozen until they reach the analyzing laboratory.
(h) Filters stored inside a dark bottle with dessicant can be stored in a deep freeze for a week or two but it is far preferable to ship them to the lab immediately.

Ambient Freshwater and Effluent Sampling
Field Sampling Manual, 2013
258
Appendix 4 Sample Container, Preservation, and Hold Times for Water and Effluent Samples
TYPE OF ANALYSIS STORAGE
TEMP(3) CONTAINER
TYPE PRESERVATION
HOLD TIME(4)
(days) PHYSICAL & AGGREGATE PROPERTIES Acidity ≤6ºC P, G none 14 Alkalinity ≤6ºC P, G none 14 Colour ≤6ºC P, G none 3 Conductivity ≤6ºC P, G none 28 pH ≤6ºC P, G none 15 min. Solids (Total, TSS, TDS, Fixed, Volatile, etc.)
6ºC P, G none 7
Turbidity ≤6ºC P, G store in the dark 3 WATER - INORGANIC ANALYSIS Bromide no req. P, G none 28 Chloride no req. P, G none 28 Chlorate, Bromate ≤6ºC P, G 50 mg/L EDA 28 Chlorine, Total Residual (Free Chlorine)
none P, G none 15 min.
Chlorite ≤6ºC P, A, G 50 mg/L EDA 14 Cyanide, SAD and/or WAD ≤6ºC P, G field NaOH, store in
dark none
14 1
Dissolved Oxygen (Winkler Method)
≤6ºC G, BOD bottle Winkler kit, store in dark
8 hours
Fluoride no req. P none 28 Nitrogen, Nitrate + Nitrite ≤6ºC P, G H2SO4
none (BC MOE) 28 3
Nitrogen, Ammonia ≤6ºC P, G H2SO4
none (BC MOE) 28 3
Nitrogen, Nitrate ≤6ºC, do not
freeze P, G none 3
Nitrogen, Nitrite ≤6ºC, do not freeze
P, G none 3

Ambient Freshwater and Effluent Sampling
Field Sampling Manual, 2013
259
Nitrogen, Total Kjeldahl ≤6ºC P, G H2SO4 none (BC MOE)
28 3
Nitrogen, Total, Persulfate Method
≤6ºC P, G H2SO4 none (BC MOE)
28 3
Nitrogen, Total, Combustion Method
≤6ºC P, G HCl none (BC MOE)
28 3
Phosphorus, Dissolved (Orthophosphate)
≤6ºC P, G filter (field or lab) 3
Phosphorus, Total Reactive (Orthophosphate)
≤6ºC P, G none 3
Phosphorus, Total Dissolved ≤6ºC P, G filter, H2SO4
none 28 3
Phosphorus, Total ≤6ºC P, G H2SO4
none (BC MOE) 28 3
Silica, Reactive ≤6ºC,
do not freeze P none 28
Sulfate ≤6ºC P, G none 28 Sulfide ≤6ºC P or G ZnAc / NaOH to pH >9 7 METALS Hexavalent Chominum ≤6ºC P, G 1ml 50% NaOH per
125ml none
30 1
Metals, Total ≤6ºC P, G HNO3
(7) 180 Metals, Dissolved no req. P, G field filter 0.45um +
HNO3, qualify if lab-filtered (7)
180
Mercury, Total no req. G, PTFE HCL or BrCL(8) 28 Mercury, dissolved no req. G, PTFE field filter 0.45 um +
HCL or BrCL, qualify if lab-filtered (7)
28

Ambient Freshwater and Effluent Sampling
Field Sampling Manual, 2013
260
AGGREGATE ORGANIC ANALYSIS AOX (Absorbable Organic Halides)
≤6ºC A, G HNO3, store in dark sodium sulfite if chlorinated, collect with no headspace
14
Biochemical Oxygen Demand (BOD)
≤6ºC, do not freeze
P, G none 3
Carbonaceous Biochemical Oxygen Demand (CBOD)
≤6ºC, do not freeze
P, G none 3
Carbon, Dissolved Organic ≤6ºC P, G filter, H2SO4 or HCl
none (BC MOE) 28 3
Carbon, Dissolved Inorganic ≤6ºC P, G field filter 14 Carbon, Total Organic ≤6ºC P, G H2SO4 or HCl 28 Carbon, Total Inorganic ≤6ºC P, G none 14 Chemical Oxygen Demand (COD)
≤6ºC P, G H2SO4 (field or lab) none (BC MOE)
28 3
Chlorophyll a Filters:
freeze ≤6ºC
Filter P, A, G
field filter, store in dark unfiltered, store in dark
Filters: 28 2
Phaeophytin Filters:
freeze Filter field filter, store in dark Filters:
28 Surfactants (Methylene Blue Active Substances)
≤6ºC P, G none 3
Total Phenols (4AAP) ≤6ºC P, G H2SO4 28 EXTRACTABLE HYDROCARBONS Extractable Hydrocarbons (LEPH, HEPH, EPH)
≤6ºC A, G HCl, H2SO4 or Sodium Bisulfate none
14/40 7/40
Oil & Grease / Mineral Oil and Grease
≤6ºC A, G HCL or H2SO4 28
Waste Oil Content ≤6ºC A, G none 28

Ambient Freshwater and Effluent Sampling
Field Sampling Manual, 2013
261
INDIVIDUAL ORGANIC COMPOUNDS Carbamate Pesticides ≤6ºC A, G Potassium Dihydrogen
Citrate (solid), ~pH 3.8, 9.2-9.5 g/L, + 100 mg/L Na2S2O3 if chlorinated ChlorAC buffer, ~pH 3, 1.8mL/60 mL sample + 100 mg/L Na2S2O3 if chlorinated
28 28
Chlorinated and Non- chlorinated Phenolics
≤6ºC A, G 0.5g Ascorbic Acid / L + H2SO4 or Sodium Bisulfate none
14/40 7/40
Dioxins / Furans ≤6ºC G, A none un-
limited Glyphosate / AMPA ≤6ºC A, G or Poly-
propylene 100 mg/L Na2S2O3 if chlorinated
14
Glycols ≤6ºC G HCL or H2SO4 or
Sodium Bisulfate none
14/40 7/40
Halogenated Hydrocarbons (Semi-Volatile)
≤6ºC A, G 100 mg/L Na2S2O3 if chlorinated
7/40
Herbicides, Acid Extractable ≤6ºC A, G HCL (optional), store in
dark, 50 mg/L Na2S2O3 if chlorinated
14/21
Paraquat / Diquat ≤6ºC A, G 100 mg/L Na2S2O3 if
chlorinated 7/21
Pesticides (NP, OP, OC) ≤6ºC A, G none 7/40 Polychlorinated Biphenyls (PCBs)
≤6ºC A, G none un-limited
Polycyclic Aromatic Hydrocarbons (PAHs)
≤6ºC A, G HCL, H2SO4 or Sodium Bisulfate none
14/40 7/40

Ambient Freshwater and Effluent Sampling
Field Sampling Manual, 2013
262
Resin Acids, Fatty Acids ≤6ºC A, G (0.5g Ascorbic Acid + 0.4g NaOH) / L none
14/40 7/40
Volatiles Organic Compounds (Trihalomethanes)
≤6ºC 43ml G VOC Vials(2-3)
3 mg Na2S2O3 (see BC Lab Manual method for more details)
14
Volatiles Organic Compounds
≤6ºC 43ml G VOC Vials(2-3)
200 mg NaHSO4, or 3 mg Na2S2O3 Id chlorinated (see BC Lab Manual method for other options and details)
14
LEGEND
P = plastic Ster = sterilized no req = no requirement G = glass Solv = solvent cleaned P&T = purge and trap vials A = amber Fc = foil-lined cap W = wide mouth R = acid rinsed T = tissue cup B = baked Note: The preservation acids/bases specify a pH endpoint (pH²2 or pH³12). The appropriate amount of preservative for a set of samples should be determined by titration on water samples collected specifically for that purpose. The amount of preservative needed should never be arrived at by titrating and measuring the pH of the actual sample!!! All preservatives should be high purity, lab approved materials.
The preservatives used should be supplied from the analytical lab in ampules. The lab will verify their purity and provide an expiration date, beyond which they should not be used.
Note: These are the preservation and hold times for the present (2013) BC MOE sample preservation & holding time requirements (1, 2) contract laboratory for the Ministry. Different labs, organizations and protocols may differ, as may future laboratory procedures.
1 A Director or an Environmental Management Act permit may specify alternate requirements.
2 Refer to applicable BC Environmental Laboratory Manual methods for additional detail. Where differences exist between Lab Manual methods and this table, this table takes precedence. 7 If not field-preserved, water samples for metals analysis must be acidified at the lab in their original containers by addition of HNO3 (within 14 days of sampling), then equilibrated at least 16 hours prior to sub-sampling or analysis (otherwise, qualify as "received unpreserved"). This approach is also applicable to dissolved metals if field filtered. Not applicable to mercury.
3 Storage temperature applies to storage at the laboratory. For all tests where refrigeration at ≤6°C is required at the laboratory, samples should be packed with ice or cold packs to maintain a temperature of ≤10°C during transport to the laboratory. The storage of ≤8°C for microbiological samples applies during storage at the laboratory and during transport to the laboratory. To prevent breakage, water samples stored in glass should not be frozen. Except where indicated by "do not freeze", test results need not be qualified for frozen samples.
4 Hold Times: Single values refer to hold time from sampling to analysis. Where 2 values are given, the first is hold time from sampling to extraction, and the second is hold time from extraction to analysis.

Ambient Freshwater and Effluent Sampling
Field Sampling Manual, 2013
263
5 Samples received from remote locations more than 48 hours after collection must not be tested. 7 If not field-preserved, water samples for metals analysis must be acidified at the lab in their original containers by addition of HNO3 (within 14 days of sampling), then equilibrated at least 16 hours prior to sub-sampling or analysis (otherwise, qualify as "received unpreserved"). This approach is also applicable to dissolved metals if field filtered. Not applicable to mercury.
8 Use only glass or PTFE containers to collect water samples for total or dissolved mercury. For total mercury, field-preserve with HCl or BrCl. For dissolved mercury, field filter and then preserve with HCl or BrCl. Adding BrCl to original sample container at the laboratory within 28 days of sampling is an acceptable alternative for total mercury and for dissolved mercury (if field-filtered) if samples are oxidized for 24 hours prior to sub-sampling or analysis. Dissolved mercury should not be lab-filtered. Qualify lab-filtered results for dissolved mercury as "lab-filtered".

Ambient Freshwater and Effluent Sampling
Field Sampling Manual, 2013
264
Appendix 5 Effluent Sampling Checklist Guide Location ___________________________________________
Sample point _______________________________________
Date ______________________________________________
NOTE: Ensure sampling point is agreeable to MELP and Permittee for determining compliance and in compliance to WCB regulations and safety requirements. Take samples for what is allowed by permit, or for what is requested. All sampling bottles should be clearly labelled and dated; and shipped to the designated lab immediately.
TEST PARAMETERS OF SAMPLE
Test Parameter Sample Frequency and Type Allowable Level
A. SAMPLE POINT YES NO
Is the sample point:
1. accessible under all weather and tide conditions? ___ ___
2. near the centre of the stream? ___ ___
3. in a turbulent mixing zone (immediately downstream from a flow disturbance such as a pipe constriction, bend or flow control device)? (describe disturbance in Comments) ___ ___
4. at least 6 pipe diameters downstream from where two separate pipe streams combine (point of confluence)? ___ ___
Comments: ___________________________________________________________________
______________________________________________________________________________
______________________________________________________________________________

Ambient Freshwater and Effluent Sampling
Field Sampling Manual, 2013
265
Appendix 5.1 Effluent Sampling Checklist B. TYPE OF SAMPLE YES NO
1.Grab Sample ___ ___ a) Does permit allow grab sample? ___ ___ b) Is volume collected ≥ 1 litre? ___ ___ c) Is collection time ≤ 15 minutes? ___ ___
2.Composite Sample ___ ___
a) Does permit allow composite sample? ___ ___ b) Compositing period: _______________________________ c) Is sampling frequency > 4x / hour? ___ ___ d) Are individual grabs of equal volume? ___ ___ e) Is flow variation less than ± 15% of daily mean more than
10% of the time? ___ ___ f) Is flow proportional sampling performed? ___ ___
3.Automatic Sampling Device (Grab or Composite) ___ ___
a) Type: _____________________________________________ _____________________________________________
b) Is the automatic sampling device equipped with a purge
___ ___ mechanism?
d) Is the velocity in the sampling line at least 0.75 m/s?
___ ___ f) Do the components of the sampling device consist of
acceptable materials for the parameter being sampled? (plastic for BOD and TSS analysis)
___ ___
4.Continuous Sampling ___ ___
a) Parameters sampled: _________________________________ _________________________________
5.Split Sampling ___ ___
a) Is the sample splitting device appropriate? ___ ___ b) Has it been approved? ___ ___ c) Was the splitter cleaned, as prescribed, prior to use? ___ ___ d) Was the entire sample directed through splitter? ___ ___
Comments: ___________________________________________________________________
______________________________________________________________________________
______________________________________________________________________________

Ambient Freshwater and Effluent Sampling
Field Sampling Manual, 2013
266
Effluent Sampling Checklist C. SAMPLER DESIGN AND OPERATION
YES NO
1. Are sample bottles lab pre-cleaned? ___ ___ 2. Are components of storage container compatible with effluent
parameter to be tested? (e.g. plastic for BOD, TSS; glass for oil) ___ ___ 3. Are all parts that come in contact with effluent cleaned regularly? ___ ___ 4. Are buckets, storage vessels, etc. that are reused
a) rinsed 3 times with de-ionised water (W) or sample (S)? (if YES, specify whether (W) or (S) was used) ___ ___
b) rinsed 3 times with acetone and once with de-ionised water, if organic parameters are sampled? ___ ___
Comments:____________________________________________________________________
______________________________________________________________________________
______________________________________________________________________________
______________________________________________________________________________
D. SAMPLE PRESERVATION AND STORAGE YES NO
1. Is sample immediately cooled to 4°C (± 2°C), if required? ___ ___ 2. Is elapsed time for testing sensitive parameters ≤ 48 hours?
(elapsed time for composite sample begins with the last sample collected)
___ ___ 3. Is sample filtered prior to preservation? (dissolved metals and
nutrients) ___ ___ 4. Is preservation required? ___ ___ 5. Are blanks submitted with samples? ___ ___ 6. Parameters to be analysed:_____________________________
_____________________________
___ ___
Comments: ___________________________________________________________________
______________________________________________________________________________
______________________________________________________________________________
______________________________________________________________________________

GROUNDWATER POLLUTION MONITORING
Her Majesty the Queen in
Right of the Province of British Columbia
2013
All Rights Reserved

Ground Pollution Monitoring
Field Sampling Manual, 2013
268
Table of Contents 1. INTRODUCTION ................................................................................................. 270
2. PRELIMINARY ASSESSMENT .......................................................................... 270 2.1 Potential Contaminants ....................................................................................... 270
2.2 Hydrogeological Studies ..................................................................................... 271
3. MONITORING SYSTEM DESIGN ...................................................................... 271
4. MONITORING WELL SPECIFICATIONS ........................................................... 272 4.1 Well Design and Dimensions .............................................................................. 272
4.2 Materials ............................................................................................................... 273
5. WELL CONSTRUCTION .................................................................................... 274 5.1 Drilling Techniques ............................................................................................. 274
5.2 Monitoring Well Development ............................................................................. 275
5.3 Hydraulic Assessment and Documentation ...................................................... 275
6. SAMPLING PROGRAM ..................................................................................... 276 6.1 Sampling Schedule .............................................................................................. 276
6.2 Piezometric Records ........................................................................................... 276
6.3 Field Measurements ............................................................................................ 276
7. QUALITY ASSURANCE AND QUALITY CONTROL ......................................... 277
8. SAMPLE COLLECTION ..................................................................................... 278 8.1 Sampling and Measuring Methods ..................................................................... 278
8.2 Immiscible Layers ................................................................................................ 279
8.3 Purging ............................................................................................................... 279
8.4 Sample Extraction ............................................................................................... 280
8.4.1 Organic Contaminant Sampling .................................................................. 280
8.4.1.1 Volatile Organic Compounds ............................................................. 280
8.4.1.2 Extractable Organic Compounds ....................................................... 281
8.4.2 Inorganic Contaminant Sampling ............................................................... 281
8.4.2.1 Specific Conductivity ......................................................................... 281
8.4.2.2 Metal Compounds ............................................................................. 281
8.5 Sample Preservation ........................................................................................... 282
9. SOURCES OF FURTHER INFORMATION ........................................................ 283
10. REVISION HISTORY .......................................................................................... 285
Ground Pollution Monitoring
Field Sampling Manual, 2013
269
APPENDIX 1 RECOMMENDATIONS FOR SCREEN AND CASING MATERIALS IN SAMPLING APPLICATIONS .................................... 286 APPENDIX 2 DRILLING METHODS MATRIX .......................................................... 289
APPENDIX 3 TYPICAL MONITORING WELL DESIGN ............................................ 290
APPENDIX 4 SAMPLING EQUIPMENT .................................................................... 291
APPENDIX 5 SAMPLE CONTAINER AND PRESERVATION CRITERIA ................ 292
APPENDIX 6 GENERALIZED FLOW DIAGRAM OF GROUNDWATER SAMPLING STEPS ............................................................................. 299

Ground Pollution Monitoring
Field Sampling Manual, 2013
270
1. Introduction The Environmental Protection Department (EPD) of the British Columbia Ministry of Environment, Lands and Parks (MELP) has, as part of its mandate, the regulation of permits related to industrial and domestic effluents, storage and transportation of special wastes, and refuse discharge sites. The ministry must also respond to unregulated discharges, whether accidental or intentional, that could result in contaminant loadings to groundwater.
These guidelines are intended to provide appropriate and effective methods to assess the extent of groundwater contamination and the potential for impact on human health and the environment.
Groundwater monitoring programs must be designed and implemented by qualified personnel to ensure consistent and representative sampling. All monitoring and sampling equipment must be operated and maintained in such a manner as to perform to design specifications for the duration of the monitoring program.
2. Preliminary Assessment Groundwater monitoring at a site under investigation is intended to detect unacceptable groundwater contamination whether this results from a permitted operation or from an accidental or intentional discharge of contaminants (a spill). Acceptable contaminant levels are specified by the Manager and will generally be in accordance with the Approved and Working Criteria for Water Quality - 1994, published by the Water Quality Branch of the BC Ministry of Environment, Lands and Parks. The type of activity at the permitted site or the nature of the material spilled will dictate the parameters sampled for, and the hydrogeology of the area concerned will govern the sampling location(s), methods, and frequency.
2.1 Potential Contaminants For a site under permit or regulation, the list of regulated parameters and site activities will provide the basis for requested analyses. For non-regulated activities and spill scenarios, investigation may be required to determine what contaminants and parameters need to be determined. This may entail, for example, analysis of the spilled material or tracking of the material through shipping or commercial documentation (e.g., TDG and WHMIS).

Ground Pollution Monitoring
Field Sampling Manual, 2013
271
2.2 Hydrogeological Studies The location and number of monitoring wells (piezometers) required to adequately describe hydrogeologic conditions will depend upon the site-specific geology, soil, and groundwater regime as well as the suspected character and quantity of the contaminant. Networks of monitoring wells are often developed in phases, with data reviewed at the end of each phase to determine if the hydraulics of the site are being adequately defined. A groundwater monitoring well network will consist of a sufficient number of wells, installed at appropriate locations and depths, to yield samples that represent the quality of both ambient groundwater and leachate which has passed under or through the affected area of the site.
A groundwater monitoring program for a permitted site is a long term project. For example, a landfill groundwater monitoring program may extend through the entire post-closure period (a minimum period of 25 years) as well as during the operational period of the landfill. Nonpermitted sites may also require extended monitoring depending on the type of contamination (solubility, etc.) and the potential for impact on human health and the environment. As a consequence, planning for the location and installation of monitoring wells in and around the sites should include consideration of both existing and anticipated site development as well as the type of contaminant plume involved and address any predicted changes in groundwater flow.
3. Monitoring System Design Hydrogeological investigations are required to determine the appropriate location and depth of monitoring wells. Nearly all hydrogeological investigations include a subsurface boring program which is necessary to define the hydrogeology and local geological conditions of the site. For boreholes that will be completed as monitoring wells, generally at least one groundwater sample should be collected from each lithological zone. (If drilling in contaminated materials, care should be taken to prevent contaminants from migrating vertically into clean strata). Boreholes that will not be completed as monitoring wells must be properly decommissioned (e.g., back filled with impervious material if necessary).
The number of boreholes required to delineate hydrogeological conditions will vary from site to site. On average, seven holes are drilled for sites with a relatively uniform lithology. There are exceptions; for example, some sites in British Columbia (former Expo lands and a dichloroethane spill near Fort Langley) have required over two hundred test holes, but these would generally be installed over a multi-phase program.
Considerations for selecting drilling sites should include (Piteau, ‘90):
• Bore holes located both up and down gradient with respect to groundwater flow from the suspected contaminated source

Ground Pollution Monitoring
Field Sampling Manual, 2013
272
• Bore holes drilled in both permeable zones and zones where low permeable material is expected
• Networks of holes to construct hydrogeologic and contaminant plume profiles.
• Completion of test holes as permanent monitoring wells. The uppermost aquifer and confining layers should be characterized by installing piezometers to determine:
• The direction and rate of groundwater flow (both horizontal and vertical)
• Seasonal/temporal, natural, and artificially induced short-term and long-term variations in groundwater elevations and flow patterns, contaminant concentrations and free product thicknesses.
• The hydraulic conductivity of the stratigraphic units at the site
• The lateral and vertical extent of contamination.
4. Monitoring Well Specifications Groundwater monitoring wells are installed in and around a site to allow measurement of water level and sampling of groundwater for contaminants. Monitoring well construction materials are discussed in section 4.2. Although well construction is not, strictly speaking, part of the sampling protocol, improper drilling techniques and screen slot selection may bias subsequent analyses regardless of the care taken to avoid contamination during collection of the sample.
4.1 Well Design and Dimensions Monitoring wells must include a protective casing that preserves the integrity of the borehole and if required, be monitored to meet design specifications. This casing must be screened and packed with a filter to enable the collection of sediment-free groundwater samples. Well screen slot size should be based on hydrologic characteristics and on the grain-size distribution of the aquifer being monitored. The primary filter pack material should be a chemically inert material, well rounded, and uniform in size. The most common filter packs are made of sand or gravel. At least two inches of filter pack material should be installed in the annular space and sealed above the sampling depth to prevent contamination of samples. The seals and grout are generally constructed of bentonite and/or cement, as appropriate. Refer to Appendix 3 of this chapter for typical monitoring well design.
Monitoring wells can range in diameter from 25mm-150mm, with a 50mm diameter the most common. The diameter of a monitoring well should be the minimum practical size which will allow for proper development of the well
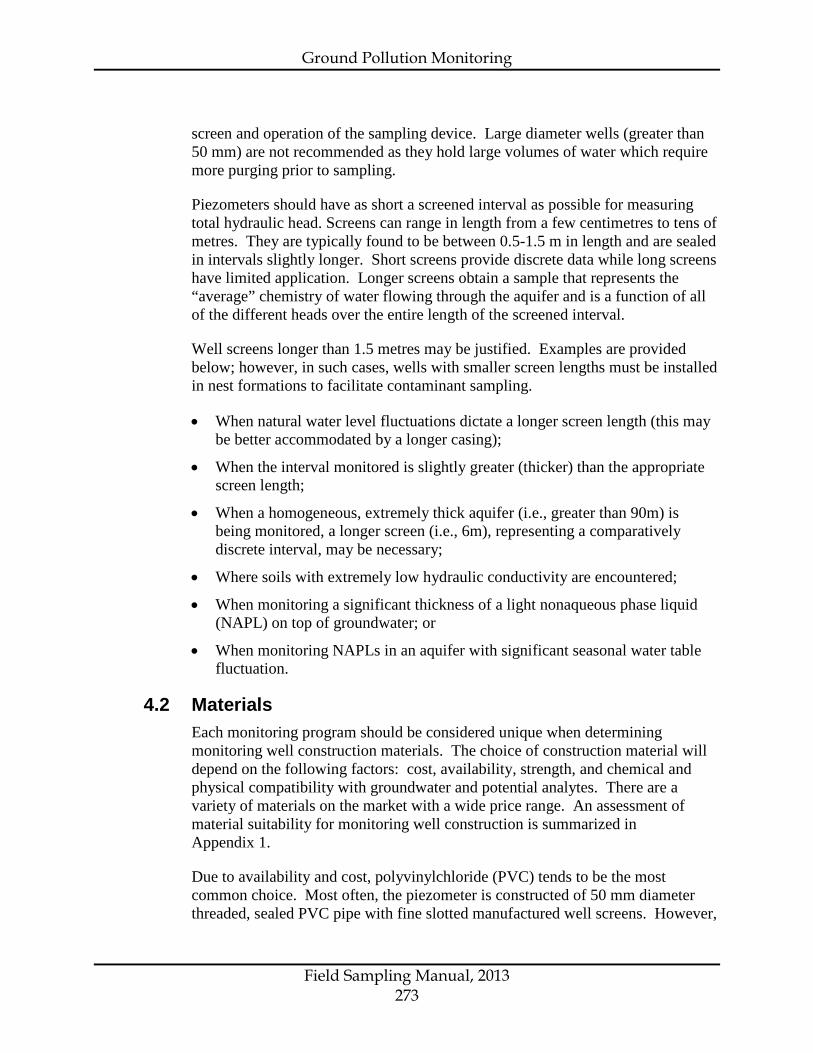
Ground Pollution Monitoring
Field Sampling Manual, 2013
273
screen and operation of the sampling device. Large diameter wells (greater than 50 mm) are not recommended as they hold large volumes of water which require more purging prior to sampling.
Piezometers should have as short a screened interval as possible for measuring total hydraulic head. Screens can range in length from a few centimetres to tens of metres. They are typically found to be between 0.5-1.5 m in length and are sealed in intervals slightly longer. Short screens provide discrete data while long screens have limited application. Longer screens obtain a sample that represents the “average” chemistry of water flowing through the aquifer and is a function of all of the different heads over the entire length of the screened interval.
Well screens longer than 1.5 metres may be justified. Examples are provided below; however, in such cases, wells with smaller screen lengths must be installed in nest formations to facilitate contaminant sampling.
• When natural water level fluctuations dictate a longer screen length (this may be better accommodated by a longer casing);
• When the interval monitored is slightly greater (thicker) than the appropriate screen length;
• When a homogeneous, extremely thick aquifer (i.e., greater than 90m) is being monitored, a longer screen (i.e., 6m), representing a comparatively discrete interval, may be necessary;
• Where soils with extremely low hydraulic conductivity are encountered;
• When monitoring a significant thickness of a light nonaqueous phase liquid (NAPL) on top of groundwater; or
• When monitoring NAPLs in an aquifer with significant seasonal water table fluctuation.
4.2 Materials Each monitoring program should be considered unique when determining monitoring well construction materials. The choice of construction material will depend on the following factors: cost, availability, strength, and chemical and physical compatibility with groundwater and potential analytes. There are a variety of materials on the market with a wide price range. An assessment of material suitability for monitoring well construction is summarized in Appendix 1.
Due to availability and cost, polyvinylchloride (PVC) tends to be the most common choice. Most often, the piezometer is constructed of 50 mm diameter threaded, sealed PVC pipe with fine slotted manufactured well screens. However,

Ground Pollution Monitoring
Field Sampling Manual, 2013
274
recent studies investigating the absorption and release of organic compounds by rigid PVC have led the EPA to recommend, for EPA protocol sites, the use of well construction materials made of (PTFE) or stainless steel as opposed to PVC. Unfortunately, the costs of stainless steel and PTFE are considerably more expensive than PVC (see Appendix 1). In certain cases it may be advantageous to design a well using more than one type of material. For example, where stainless steel may be preferred in a specific chemical environment, costs may be saved by using PVC in non-critical portions of the well.
Additional components required for the monitoring well (e.g., primary filter pack, riser, etc.), including joints/couplings, should be comprised of material that will not alter the quality of water samples for the constituents of concern. With the exception of the primary filter pack, the additional components are commonly fabricated from PVC, stainless steel, fibreglass, or fluoropolymer. Materials recommended to prevent joints from leaking include PTFE tape for tapered thread joints and o-rings with a known chemistry for flush joint threads. Glued or solvent joints of any type are not recommended, especially where analysis for organic contaminants is anticipated, since glues and solvents may alter the chemistry of water samples (ASTM D5092-90). For further information regarding size specifications and/or installation procedures, refer to ASTM Designations: D5092-90.
5. Well Construction
5.1 Drilling Techniques Well drilling methods commonly used in BC include air rotary, sonic drilling, cable tool, hollow stem auger, and Becker hammer. The method selection is usually dictated by the anticipated ground conditions and the availability of equipment.
Whenever feasible, drilling procedures should be utilized that do not require the injection of water or drilling fluids into the borehole, and that optimize cuttings control at ground surface. Where the use of drilling fluids is unavoidable, the selected fluid should have as little impact as possible on the water samples for the constituents of interest (ASTM D5092-90). Preliminary laboratory testing of the fluid may be useful in determining potential for contamination. Furthermore, extreme care must be exercised when drilling at or near a geo technical liner (a punctured liner would severely impact the effectiveness of a leachate collection system). It is the responsibility of both the driller and the permittee to ensure that the monitoring well is installed correctly and the integrity of the liner is maintained.

Ground Pollution Monitoring
Field Sampling Manual, 2013
275
A matrix of appropriate drilling methods for use in British Columbia is presented in Appendix 2. A further reference of greater scope and detail is The Handbook of Suggested Practices for the Design and Installation of Ground-Water Monitoring Wells (Aller et al., 1989). It provides a matrix that uses a rating system to establish the desirability of a drilling method based on the general hydrogeologic conditions and well design requirements.
5.2 Monitoring Well Development Monitoring well development is intended to correct any clogging or compaction that may interfere with water quality analysis, to improve hydraulic characteristics and to restore ground water properties disturbed during the drilling process. Monitoring well development should follow the installation process and continue until the water is representative and free of the drilling fluid cuttings, or other materials introduced during the drilling process. Representative water is assumed to have been obtained when pH, temperature, and specific conductivity readings have stabilized and the water is virtually clear of suspended solids (ASTM D5092-90). Methods of development include mechanical surging, over pumping, air lift pumping, and well jetting.
The combined use of a jetting tool with air-lift pumping is a particularly effective development method. Mechanical surging, as with a surge block or large bailer, can also be used but is less effective (Sabel and Clark, ‘85). A well recovery test should be carried out immediately after and in conjunction with well development.
5.3 Hydraulic Assessment and Documentation All constructed piezometers should be tested to determine the hydraulic conductivity of the formation, and to determine if they are sufficiently responsive to the hydraulic flow system to provide reliable monitoring data. The local groundwater flow system can be determined by installing piezometers to measure the hydraulic heads at various points in the system.
At least three piezometers in a triangular array are needed to define the horizontal hydraulic gradient and direction of groundwater flow in simple flow systems. Vertical gradients are determined with nested piezometers. (Nested piezometers are also needed to deliminate vertical contaminant concentration gradients.) In areas of complex geology, additional piezometers are needed since the flow medium will be heterogeneous and will result in a distorted hydraulic head distribution (Piteau, 1990).
Hydraulic head measurements should be collected at different depths, as well as at different locations on the site. Contours of the hydraulic heads will indicate which areas are located downgradient of the site and are, therefore, at risk of becoming contaminated, and which areas are located upgradient of the site and

Ground Pollution Monitoring
Field Sampling Manual, 2013
276
could thus provide background data. This information is useful for selecting appropriate monitoring sites.
6. Sampling Program
6.1 Sampling Schedule Sampling frequency is based on the potential human health and environmental impact and on the rate of contaminant movement. Groundwater velocities are usually much less than those of surface waters and, therefore, sampling intervals may be longer. Monitoring parameters and frequency of sampling are site specific.
Water levels should be monitored on at least the same frequency as the regular chemical monitoring. Quarterly monitoring of water levels in all monitoring wells is commonly required to determine seasonal variations in groundwater flow.
A sampling schedule should be developed that takes into consideration the various conditions that influence the extent and direction of groundwater flow and the rate at which potential contaminants migrate into and with the groundwater. Some conditions that influence contaminant transport to the water table are precipitation, temperature, soil permeability, and soil type(s).
6.2 Piezometric Records It is generally assumed that the flow system of a groundwater system is a steady state situation and that fluctuations in head are minor in comparison to total head drop from recharge to discharge. However, for localized aspects of a system it may be important to quantify and document groundwater level variation. In these cases, piezometric measurements should be recorded on a regular basis to characterize seasonal fluctuations. For wells located near the ocean, tidal effects may be significant and, as well, there is the potential for salt water intrusion to cause variation in chemical composition.
6.3 Field Measurements Regular monitoring of traditional “field parameters” such as odour, colour, pH, conductance, redox potential, and temperature, may provide an indication that a change in groundwater quality has occurred and that sampling for more extensive analysis is warranted.

Ground Pollution Monitoring
Field Sampling Manual, 2013
277
7. Quality Assurance and Quality Control Monitoring programs should include a quality assurance (QA) and quality control (QC) component in their design in order to provide confidence in the data obtained. Refer to the manual Quality Assurance in Water Quality Monitoring produced by Environment Canada, the Quality Control and Quality Assurance chapter of this manual (Part A), or the Quality Assurance section of Ministry Methods Manual - Permittee Edition -1994, produced by the EPD of BC MELP for the development and implementation of acceptable water monitoring programs. Laboratories generally have their own internal QC program consisting of regular testing of blanks, spikes, and laboratory duplicates.
A field QA protocol is necessary to verify the reliability and accuracy of the combined field sampling/handling and laboratory procedures and should include the following (Piteau, ‘90):
• Blind replicate samples: identical field samples are submitted under different sample identities to test for reproducibility of the sampling and analytical procedure (precision)
• Blind reference samples: reference samples (may be certified) are prepared to mimic authentic samples and are submitted under fictitious sample identities to test for analytical bias (accuracy)
• Spiked samples: a field sample is split and a known concentration of a contaminant is added to one-half of the sample to check for systematic errors (bias)
• Blank samples: laboratory reagent (distilled or deionized) water is carried through sample collection and handling (including preservation) to check for contamination, purity of preservatives and other systematic errors occurring from time of sampling
The contaminant concentrations in blanks should be recorded, and if concentrations are more than an order of magnitude greater than the detection limit for the parameter and the sample result is less than 5 times detection limit, the groundwater should be resampled to ensure QA and QC standards have been satisfied.
The laboratory should be contacted prior to sampling to ensure that sample handling, preservation, and shipping methods are appropriate. Sample storage time prior to laboratory analysis must not exceed allowable limits. Refer to Appendix 6 for a generalized flow diagram of groundwater sampling steps.
The calibration and maintenance of field equipment is also an integral component of QA/QC. All equipment must be kept clean and in good working condition, using the techniques described by the manufacturer. Calibrations, prior to the sampling event, should be performed under the same instrumental and chemical conditions as those that will exist at the sampling site. The frequency of calibration will depend on the accuracy requirements of the investigation and the stability of the instrument. To ensure a high standard of QA/QC, monitoring personnel must be adequately trained and supervised.

Ground Pollution Monitoring
Field Sampling Manual, 2013
278
Where a series of samples is to be collected using common equipment, sampling should begin with the (assumed) lesser contaminated sites and progress to sites with higher anticipated levels of contamination.
A log should be kept for each item of equipment to document calibration, exposure, maintenance, and service.
8. Sample Collection
8.1 Sampling and Measuring Methods A sampling device is chosen based on the parameters that are to be monitored, the compatibility of the rate of well purging with well yield, the diameter of the well, and the depth from which the sample must be collected. The cost, transportability and ease of use of the sampling device are also important considerations.
Appropriate measures are required to prevent cross contamination between wells during the sample collection procedure. For example, drilling equipment must be decontaminated between boreholes; sampling equipment must be decontaminated between each sampling event and, where appropriate, between specific parameter groups such as organic contaminants. Sampling equipment (including automated models) must be made of materials that are compatible with the type of contaminated groundwater being sampled and must not contribute or remove (e.g., by adsorption) any parameter of interest.
The routine parameters monitored in groundwater include pH, redox potential (Eh), dissolved oxygen (DO), specific conductivity, metals, ammonia nitrogen, chloride, and chemical oxygen demand (COD); other parameters may be added to this list on a site specific basis. The standard industry practice is to use a flow through cell to measure the DO, pH, and conductivity. Other parameters are measured with static probes or parameter specific test kits. Routine quarterly sampling and in-situ monitoring will establish the presence of any trends, identify any statistically significant changes, locate contaminant plumes and, most importantly, identify those parameters with values that fail to meet the applicable criteria.
Statistically significant refers to a statistically significant increase or decrease from background values or exceedance of a compliance level for each parameter or constituent being monitored. It is the responsibility of the owner/operator or his agent to choose an appropriate statistical method consistent with the number of samples collected, and distribution pattern of the parameter. Examples of

Ground Pollution Monitoring
Field Sampling Manual, 2013
279
appropriate statistical methods and performance standards are outlined in the EPA document Criteria For Municipal Solid Waste Landfills, Subpart E section 258.53 paragraphs (g) & (h).
8.2 Immiscible Layers Immiscible layers may be either light nonaqueous phase liquids (LNAPLs) or dense nonaqueous phase liquids (DNAPLs). LNAPL layers must be sampled before a well is purged. To determine the presence of an immiscible layer, an interface probe should be used to measure the first fluid level in a well. Once this has been recorded, it should be lowered until the immiscible water interface is encountered. The depth interval, or thickness, of a floating immiscible layer can then be established.
8.3 Purging Water which has resided in a well casing for an extended period of time has the opportunity to exchange gases with the atmosphere and to interact with the well casing. Water standing in the columns inside the well casing must, therefore, be purged prior to sampling so that a representative sample can be obtained. To adequately purge a well, monitor the pH, temperature, and conductance of the water during the purging process, and assume purging is complete when these measurements stabilize. While 3 to 4 purge volumes are common industry practice, it is recommended that the appropriate number be determined on a site specific basis according to the number required to reach equilibrium.
Purging should be accomplished by removing groundwater from the well at low flow rates using a pump. Because they can operate at variable speeds, pumps such as the submersible and bladder variety are considered particularly useful for purging stagnant water from a well. The use of bailers should generally be avoided as the ‘plunger’ effect of their use can result in the continual development or overdevelopment of the well. A description of six different kinds of pumps is presented in Appendix 4.
Wells should be purged at rates lower than those used to develop the well. A low purge rate will reduce the possibility of stripping VOCs from the water and reduce the likelihood of mobilizing colloids in the subsurface that are immobile under natural flow conditions. For further reference, refer to the designation guide ASTM D4448-85a.
If contaminants are suspected in the groundwater prior to purging, then appropriate disposal measures should be performed. The purged groundwater should be collected and tested and disposed of in accordance with established sanitary/stormwater sewer use criteria and other applicable regulatory requirements.

Ground Pollution Monitoring
Field Sampling Manual, 2013
280
8.4 Sample Extraction The rate at which a well is sampled should not exceed the rate at which the well was purged. Low sampling rates, approximately 0.1 L/min, are suggested. Pumps should be operated at rates less than 0.1 L/min when collecting samples for volatile organic compound analysis.
Sample withdrawal methods include the use of pumps, compressed air, syringe sampler, and bailers. The selection of the sampling method must be based on the parameters that are to be monitored, the depth from which the sample is collected, and the diameter of the well (Piteau ‘90). The primary consideration is to obtain a representative sample of the groundwater body by guarding against mixing the sample with stagnant water in the well casing. This is avoided through adequate purging prior to collecting the sample. Refer to Appendix 4 for a description of a number of different sampling devices that are available to extract water from a variety of monitoring well diameters.
8.4.1 Organic Contaminant Sampling Groundwater samples collected for analyzing organic constituents should not be field-filtered prior to laboratory analysis. The recommended container for collection is a solvent rinsed, amber coloured glass with an aluminum foil or Teflon liner cap. An emerging technology that promises to provide an alternative to collecting and shipping large samples of water involves a technique called solid phase extraction (SPE). In this technique, a volume of water is passed through a solid phase that adsorbs the organic contaminants. The adsorbent material is sent to the laboratory for extraction and analysis. Consult the manufacturer’s literature for further information on this technique. For additional QA details refer to Appendix 5.
8.4.1.1 Volatile Organic Compounds Volatile organic compounds (VOCs) must be sampled in a manner which does not cause agitation of the sample or exposure of the sample to air. Pumps which induce suction pressure, such as peristaltic pumps, or which have lift devices, may aerate the sample and are not recommended for sampling VOCs. Positive displacement bladder pumps or bailers constructed entirely of fluorocarbon resin or stainless steel are preferred. VOCs should be the first sample that is collected following the purging process (EPA, Sept ‘88).
During sampling, the pumping rate should be kept to a rate of less than 0.1 L/min. Samples should be placed directly in glass bottles with no air space left and capped with a Teflon septum cap.
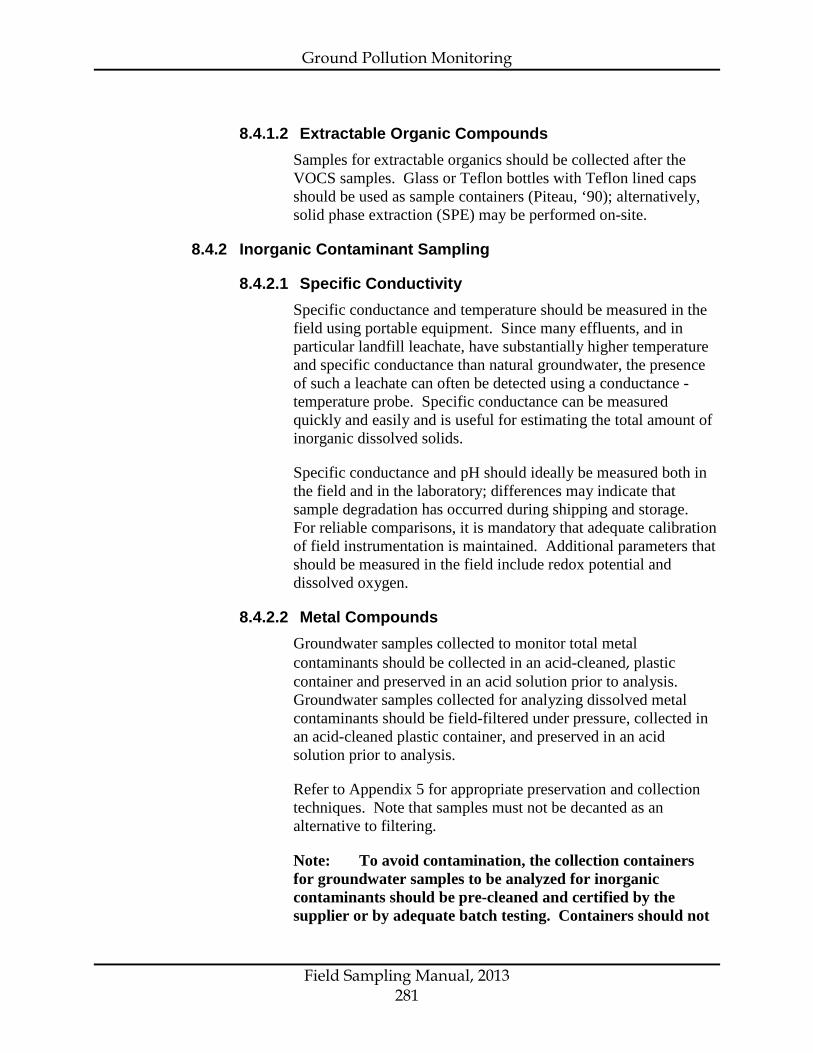
Ground Pollution Monitoring
Field Sampling Manual, 2013
281
8.4.1.2 Extractable Organic Compounds Samples for extractable organics should be collected after the
VOCS samples. Glass or Teflon bottles with Teflon lined caps should be used as sample containers (Piteau, ‘90); alternatively, solid phase extraction (SPE) may be performed on-site.
8.4.2 Inorganic Contaminant Sampling
8.4.2.1 Specific Conductivity Specific conductance and temperature should be measured in the field using portable equipment. Since many effluents, and in particular landfill leachate, have substantially higher temperature and specific conductance than natural groundwater, the presence of such a leachate can often be detected using a conductance - temperature probe. Specific conductance can be measured quickly and easily and is useful for estimating the total amount of inorganic dissolved solids.
Specific conductance and pH should ideally be measured both in the field and in the laboratory; differences may indicate that sample degradation has occurred during shipping and storage. For reliable comparisons, it is mandatory that adequate calibration of field instrumentation is maintained. Additional parameters that should be measured in the field include redox potential and dissolved oxygen.
8.4.2.2 Metal Compounds Groundwater samples collected to monitor total metal contaminants should be collected in an acid-cleaned, plastic container and preserved in an acid solution prior to analysis. Groundwater samples collected for analyzing dissolved metal contaminants should be field-filtered under pressure, collected in an acid-cleaned plastic container, and preserved in an acid solution prior to analysis.
Refer to Appendix 5 for appropriate preservation and collection techniques. Note that samples must not be decanted as an alternative to filtering.
Note: To avoid contamination, the collection containers for groundwater samples to be analyzed for inorganic contaminants should be pre-cleaned and certified by the supplier or by adequate batch testing. Containers should not

Ground Pollution Monitoring
Field Sampling Manual, 2013
282
be rinsed with sample prior to sample collection as surface concentration effects may occur. For appropriate container and rinsing agents refer to Appendix 5.
8.5 Sample Preservation To assist in maintaining the natural chemistry of the samples, it is necessary to preserve the sample. Methods of sample preservation are relatively limited and are intended to reduce the effects of chemical reactions, the effects of sorption and to arrest biological actions. Preservation methods are generally limited to pH control, refrigeration, and protection from light. Selected parameters or groups of parameters (e.g., metals) may be preserved by addition of a reagent (e.g., acid) that stabilizes their concentration but may preclude the analysis of that sample for other parameters.
Glass, stainless steel, Teflon, or plastic (polyethylene and polypropylene) are the types of containers acceptable for most kinds of sample collection. There are some exceptions to this general rule; for example, plastic is not acceptable for organics and stainless steel is not acceptable for metals. Containers should be kept full until samples are analyzed to maintain anaerobic conditions. The sample container material should be non-reactive with the sample and especially with the particular analytical parameter to be tested. Sample containers used to transport samples to the lab must undergo pre-treatment procedures. Pre-treated containers may be purchased commercially; however, pre-treatment must be repeated if they are re-used. For appropriate sample containers and preservation methods, refer to Appendix 5.
Samples should be placed in bottles immediately upon collection and, where preservation of the sample is required, it should be carried out immediately. Handling of the sample and contact with the atmosphere should be kept to a minimum. The samples should be properly packaged so as to prevent breakage and should generally be kept at 4oC plus/minus 2oC until analyzed by the laboratory. It is recommended that the sampler consult with the laboratory to discuss sampling protocols and sample treatment options prior to sample collection.

Ground Pollution Monitoring
Field Sampling Manual, 2013
283
9. Sources of Further Information Aller, Linda et al. Handbook of Suggested Practices for the Design and Installation of
Ground-Water Monitoring Wells. Appendix B, pg 324-366. National Water Well Association, 1989.
American Standards for Testing and Materials. Annual Book of ASTM Standards. Volume 11.01, Water and Environmental Technology. Designation: D3370-82. Philadelphia, PA. 1991.
American Standards for Testing and Materials. Annual Book of ASTM Standards. Volume 11.04, Water and Environmental Technology. Designation: D5088-90. Philadelphia, PA. 1991.
American Standards for Testing and Materials. Annual Book of ASTM Standards. Volume 11.04, Water and Environmental Technology. Designation: D4448-85a. Philadelphia, PA. 1992.
Barcelona, M.J. et al, September 1985. Practical Guide for Ground-Water Sampling. EPA/600/2-85/104, US EPA, Roberts S. Kerr Environmental Research Laboratory, Ada, Oklahoma.
Environmental Protection Agency. Solid Waste Disposal Facility Criteria - Technical Manual. EPA530-R-93-017 US EPA, November 1993.
Gartner Lee Limited. Leachate Assessment Field Manual. Prepared for Ministry of Environment, Lands and Parks. Skeena Region. February 1993.
Henry, Glynn and Prasad, Durga. Anaerobic Treatment of Leachate. Paper presented at a seminar on leachate treatment and disposal, sponsored by the Pollution Control Association of Ontario and the Ontario Ministry of Environment. Toronto, Ontario. 1991.
Kent, Robert and Payne, Katherine. “Sampling Groundwater Monitoring Wells: Special Quality Assurance and Quality Control Considerations”. Principles of Environmental Sampling. Chapter 15. Lawrence Keith, Editor. 1988.
Everett, Lorne G., Ph. D. Groundwater Monitoring. Guidelines and Methodology for Developing and Implementing a Groundwater Quality Monitoring Program. Genium Publishing Corporation. 1984.
Lu, James C.S., Eichenberger, Bert, and Sterns, Robert J. Leachate from Municipal Landfills: Production and Management. Noyes Publications. 1985.
Nagpal, N.K. and Pommen, L.W. Approved and Working Criteria for Water Quality. B.C. Environment Water Quality Branch. November 1993.

Ground Pollution Monitoring
Field Sampling Manual, 2013
284
National Association of Waste Disposal Contractors. NAWDC: Creating a Better Environment. NAWDC Codes of Practice for Landfill. August 1989.
Ontario Ministry of Environment and Energy. Guidelines for the Establishment, Operation, Management, Maintenance and Closure of Landfilling Sites in Ontario.
Ontario Ministry of Environment and Energy. Guideline for Assessing Methane Hazards from Landfill Sites. November 1987.
Piteau Associates Engineering Limited. Groundwater Quality Monitoring Manual. Prepared for BC Ministry of Environment, Environmental Protection Division. March 1990.
Province of British Columbia. Approved and Working Criteria for Water Quality. Ministry of Environment, Lands and Parks. Environmental Protection Department, Water Quality Branch. 1995.
Province of British Columbia. Criteria for Managing Contaminated Sites in British Columbia. Ministry of Environment, Lands and Parks. Environmental Protection Department, Water Quality Branch. July 1995.
Province of British Columbia. Landfill Criteria for Municipal Solid Waste. Ministry of Environment, Lands, and Parks. Environmental Protection Division, Municipal Waste Reduction Branch. 1993.
Sabel, G. and Clark, T. Procedures for Ground Water Monitoring. Minnesota Pollution Control Agency Guidelines. April 1985.
Solid Waste Association of North America. Manager of Landfill Operations Training Course. Course manual. Publication # MSW-D 2360 GMISC 0005. Silver Spring, Maryland. Revised June 1991.
State of Washington. Criteria for Municipal Solid Waste Landfills. Washington Administration Code. Chapter 173-351. OTS Version.
State of Washington. Minimum Functional Standards for Solid Waste Handling. Chapter 173-304 WAC.
United States. Federal Register. Vol. 56, No.104. May, 1991. Proposed Rules. Environmental Protection Agency.
United States. Procedures Manual for Ground Water Monitoring at Solid Waste Disposal Facilities. Environmental Protection Agency. 1977.

Ground Pollution Monitoring
Field Sampling Manual, 2013
285
United States. RCRA Ground-Water Monitoring Technical Enforcement Guidance Document. Environmental Protection Agency. NWWA/EPA Series. Printed by NWWA. Dublin, Ohio. September 1986.
United States. Solid Waste Disposal Facility Criteria. Environmental Protection Agency. Technical Manual. November 1993.
Waste Age. University of Wisconsin/Waste Age. Landfill Course. January 1986.
10. Revision History October 10, 2013: This section republished without change. Notes added to
Appendix 5. Sample Container and Preservation Criteria table updated.
February 28, 2001: This section republished without change. Bottle types adjusted for mercury in Appendix 5.
November 1996: Initial publication.

Ground Pollution Monitoring
Field Sampling Manual, 2013
286
Appendix 1 Recommendations for Screen and Casing Materials in Sampling Applications
(in decreasing order of preference)
Material Applications Other
Considerations
Approximate Cost (Relative
to PVC)*
Fluorinated Ethylene Propylene (FEP)
Recommended for most monitoring situations where corrosive environments are anticipated. Also offers good chemical resistance to volatile organics.
Lower strength than steel and iron. Not available in British Columbia. > 20 x
Polytetra florethylene (PTFE) or Teflon (R)
Recommended for most monitoring situations with detailed organic analytical needs, particularly for aggressive, organic leachate impacted hydrogeologic conditions.
Virtually an ideal material for corrosive situations where inorganic contaminants are of interest.
Low strength, not readily available in British Columbia (- 10 days for delivery).
21 x
Kynar Strong material that is resistant to most chemicals and solvents.
Poor chemical resistance to ketones and acetone. Not commonly available.
Fibreglass Historically, fibreglass has not been used for monitoring wells due to potential leaching of epoxy resins. Recent advances in fibreglass technology have created a material that is equivalent to or more inert that Teflon, but is also very strong.
High strength, not readily available in British Columbia. Not available as 50 mm casing.
2 to 5 x
Stainless Steel 316 (flush threaded)
Recommended for most monitoring situations with detailed organic analytical needs, particularly for aggressive, organic leachate impacted hydrogeologic conditions.
High strength, reasonable availability. May be source of Cr, Fe and Ni in low pH environments.
10 x
Stainless steel 304 (flush threaded)
May be prone to slow pitting corrosion in contact with acidic, high TDS aqueous solutions. Corrosion products limited mainly to Fe and possibly Cr and Ni.
High strength, good availability. May be source of Cr, Fe and Ni in low pH environments.
7.5 x

Ground Pollution Monitoring
Field Sampling Manual, 2013
287
PVC (flush threaded or other noncemented connections)
Recommended for monitoring situations where inorganic contaminants are of interest and it is known that aggressive organic leachate mixtures will not be contacted. Cemented installations have caused documented interferences.
The potential for interaction and interferences from PVC well casing in contact with aggressive aqueous organic mixtures is difficult to predict. PVC is not recommended where ppb or corrosive concentrations of organic contaminants are expected.
PVC can be used as casing with stainless steel screens for composite well. Moderate strength, good availability.
Deteriorates when in contact with ketones, esters and aromatic hydrocarbons.
1 x
Materials below this line are not recommended as they cost more than PVC while rated as inferior.
Acrylonitrile Butadiene Styrene (ABS)
Not commonly used for groundwater monitoring.
Lower strength than steel and iron. Not readily available other than in domestic plumbing format which is not generally suitable for piezometer applications.
2 x
Polypropylene Resistance to mineral acids and moderate resistance to alkalis, alcohols, ketones and esters make polypropylene a suitable material for many applications. It deteriorates when in contact with oxidizing acids, aliphatic and aromatic hydrocarbons.
Low strength, not readily available in British Columbia.
Polyethylene: High Density
Polyethylene is less reactive then PVC but more reactive than PTFE.
Low strength. Not commonly available in format other than flexible water line. Not threadable.
1 x
Low Carbon Steel May be superior to PVC for exposures to aggressive aqueous organic mixtures. These materials must be very carefully cleaned to remove oily manufacturing residues.
Prone to rusting.

Ground Pollution Monitoring
Field Sampling Manual, 2013
288
Galvanized Steel Corrosion is likely in acidic, high TDS environments, particularly when sulfides are present. Products of corrosion are mainly Fe and Mn, except for galvanized steel which may release Zn and Cd.
High strength, good availability. Prone to rusting.
1.25 to 3 x
Carbon Steel Weathered steel surfaces present very active absorption sites for trace organic and inorganic chemical species.
Prone to rusting.
(Piteau March 1990. Table 5.2)
* Source of availability and relative cost: CPI Equipment, the largest supplier of drilling equipment in B.C.

Ground Pollution Monitoring
Field Sampling Manual, 2013
289
Appendix 2 Drilling Methods Matrix
DRILLING METHODS
Air Rotary
Cable Tool
Hollow Stem Auger
Sonic Drilling
Becket Hammer
Mud Rotary
Bucket Auger
Backhoe Excavation
Applicable Geology
Unconsolidated Overburden X X X X X X X X
Fine Grained Sediments X X X X X X X X
Soft Rock X X X
Cohesive Sediments X X X X
Unconsolidated Sediments X X X X X X X X
Bedrock X X X
Surficial Sediments X X X X X X X X
Soft to Mod. Dense Sediments
X X X X X X
Maximum Depth (m) >300 >200 50 50 >300 10 8
Avg. Hole Diameter (mm) 150 150 125 150 150 800 1,000
(After Piteau, 1990)

Ground Pollution Monitoring
Field Sampling Manual, 2013
290
Appendix 3 Typical Monitoring Well Design
Protective cover with locking cap
Well identification labeledinside and outside the cap
6 in (152 mm) clearance for sampler
Top of riser 3 ft.(1.0 m)above grade
Slope bentonite/soilmixture or 4 in (101 mm) thickconcrete pad away from casing
Slope grout away from casing or riser toprevent infiltration, but do not create amushroom for grout which will be sujectto frost heave
Dry bentonite pellets
Minimum 2 in (50mm) ID riser with flushthreaded connections wrappedwith PTFE tape or with o-rings(varies with riser material)
centrallizers as necessary
Borehole
Centralizer(s) as necessary
PlugSediment sump (as appropriate)
Well screen length varies
* Reprint with permission, from the Annual Book of ASTM Standards, copyrightAmerican Society for Testing and Materials, 1916 Race Street, Philadelphia, PA 19103.Figure redrawn for legibility.
Vented cap
Protective casingWashed pea gravel or coarse sand mixture
1/4 in (6.3 mm) weep holeat 6 in above ground level
3 ft. - 5 ft. (1.0 to 1.5 m) extend protectivecasing depth to below frost line
Grout length varies
6 in - 1 ft. (152 mm to 304 mm) Final secondary filter pac
3 ft. - 5 ft. (1.0 m to 1.5 m) Bentonite seal
1ft. - 2 ft. (303 mm to 608 mm), first secondaryfilter pack where conditions warrantextend primary filter pack 20% of screenlength or 2 ft. (608 mm) above slotted wellscreen, unless conditions warrant less

Ground Pollution Monitoring
Field Sampling Manual, 2013
291
Appendix 4 Sampling Equipment Sampling Devices How the Sampling Device Operates Pumping Rates Characteristics Disadvantages Air Lift Pump An air lift pump collects a water sample
by bubbling a gas at depth in the well or tube.
Pumping rates depend on the size of the pump being used and how many pumps are used for each well.
Air lift sampling can be useful in monitoring wells that need to be pumped only at periodic intervals.
Air lift methods result in considerable sample agitation and mixing in the well.
Submersible Pump
Water is transported to the surface by centrifugal action through an access tube.
Vary from 26.5-53.0 Lpm depending upon the depth of the pump.
A submersible pump provides higher extraction rates than most other methods.
Considerable sample agitation and the potential introduction of trace metals into the sample from pump materials results.
Suction Lift Pump
Suction lift can be categorized as direct line, centrifugal and peristaltic.
Vary from 19-151 Lpm for direct line method. Approximately 3.7 Lpm for peristaltic pump method.
Suction lift approaches offer a simple retrieval method for shallow monitoring.
Degassing and agitation occur as a result of suction lift.
Bladder Pump Water enters the flexible membrane through the lower check valve; compressed gas is injected into the cavity between the stainless steel housing and the bladder.
The 4.4 cm pump is capable of providing samples (Approx. 2.6 - 5.6 Lpm) from depths in excess of 76m.
Bladder pumps prevent contact between the gas and water sample and can be fabricated entirely of Teflon and stainless steel.
The large gas volumes required, especially at depth, potential bladder rupture, and the difficulty in disassembling the unit for thorough cleaning. Piezometers must be developed with no fines inside casing.
Gas Displacement Pump
A column of water under linear flow conditions is forced to the surface without extensive mixing of the pressurized gas and water.
Flow rates of about 2.8 Lpm at 36.5m are possible with a standard 3.7 cm inner diameter by 4.57 cm long pump.
Gas displacement pumps provide a reliable means for obtaining a highly representative ground water sample.
Possibility of gas water interface, a degree of mixing, and sample degassing can occur during transport.
Gas Piston Pump
A double piston pump utilizes compressed air to force a piston to raise the sample to the surface.
Pumping rates of 0.5 Lpm have been reported from 30.5 m; sampling depth of 152 m are possible.
The gas piston pump provides continuos sample withdrawal at depths greater than is possible with most other approaches.
Contribution of trace elements from the stainless steel and brass is a potential problem.
Packer Pump The hydraulic activated packers are wedged against the casing wall or screen, the sampling unit collects water samples only from the isolated portion of the well.
Vertical movement of water outside the well casing during sampling is possible with packer pumps but depends upon the pumping rate and subsequent disturbance.
A packer assembly allows the isolation of sampling points within a well.
Deterioration of the expandable material will occur with time thereby increasing the possibility of undesirable organic contaminants entering the water sample.
Inertial Lift Pump
The operating principle of the pump is based on the inertia of a column of water contained within a riser tubing.
Pumping rates of between 0.05 to 10.0 Lpm have been recorded.
The inertial pump is inexpensive and offers multiple uses for ground water monitoring wells.
The tubing coils, though reasonably lightweight, are stiff and may be awkward to transfer from well to well.
* Text extracted from Appendix D, Piteau (1990), from R.D. Morrison (1983).

Ground Pollution Monitoring
Field Sampling Manual, 2013
292
Appendix 5 Sample Container and Preservation Criteria
TYPE OF ANALYSIS
STORAGE MAXIMUM
TEMP(3) CONTAINER
TYPE PRESERVATION
HOLD TIME(4)
(days) WATER- BACTERIOLOGY PARAMETERS Coliforms, Total, Fecal and E. coli
<8ºC, do not freeze
Ster P or G Na2S2O3 30 hours(5)
Cryptosporidium, Giardia <8ºC, do not freeze
Ster P or G Na2S2O3 96 hours
Enterococcus <8ºC, do not freeze
Ster P or G Na2S2O3 30 hours(5)
Heteroprophic Plate Count <8ºC, do not freeze
Ster P or G Na2S2O3 24 hours
TOXICITY Daphnia, Chronic 21 day/ Chronic EC25
4±2ºC P, G (non-toxic)
collect with no headspace
5
Daphnia, LC50 / LT50 4±2ºC P, G (non-toxic)
collect with no headspace
5
Microtox 4±2ºC P, G (non-toxic)
collect with no headspace
3
Trout, LC50 4±2ºC P, G (non-toxic)
collect with no headspace
5
Trout, LT50 4±2ºC P, G (non-toxic)
collect with no headspace
5
PHYSICAL & AGGREGATE PROPERTIES Acidity ≤6ºC P, G none 14 Alkalinity ≤6ºC P, G none 14 Colour ≤6ºC P, G none 3 Conductivity ≤6ºC P, G none 28 pH ≤6ºC P, G none 15 minutes Solids (Total, TSS, TDS, Fixed, Volatile, etc.)
6ºC P, G none 7
Turbidity ≤6ºC P, G store in the dark 3

Ground Pollution Monitoring
Field Sampling Manual, 2013
293
WATER - INORGANIC ANALYSIS Bromide no req. P, G none 28 Chloride no req. P, G none 28 Chlorate, Bromate ≤6ºC P, G 50 mg/L EDA 28 Chlorine, Total Residual (Free Chlorine)
none P, G none 15 minutes
Chlorite ≤6ºC P, A, G 50 mg/L EDA 14
Cyanide, SAD and/or WAD ≤6ºC P, G field NaOH, store in dark none
14 1
Dissolved Oxygen (Winkler Method)
≤6ºC G, BOD bottle
Winkler kit, store in dark
8 hours
Fluoride no req. P none 28
Nitrogen, Nitrate + Nitrite ≤6ºC P, G H2SO4 none (BC MOE)
28 3
Nitrogen, Ammonia ≤6ºC P, G H2SO4 none (BC MOE)
28 3
Nitrogen, Nitrate ≤6ºC, do not freeze
P, G none 3
Nitrogen, Nitrite ≤6ºC, do not freeze
P, G none 3
Nitrogen, Total Kjeldahl ≤6ºC P, G H2SO4 none (BC MOE)
28 3
Nitrogen, Total, Persulfate Method
≤6ºC P, G H2SO4 none (BC MOE)
28 3
Nitrogen, Total, Combustion Method
≤6ºC P, G HCl none(BCMOE)
28 3
Phosphorus, Dissolved (Orthophosphate)
≤6ºC P, G filter (field or lab) 3
Phosphorus, Total Reactive (Orthophosphate)
≤6ºC P, G none 3
Phosphorus, Total Dissolved ≤6ºC P, G filter, H2SO4 none
28 3

Ground Pollution Monitoring
Field Sampling Manual, 2013
294
Phosphorus, Total ≤6ºC P, G H2SO4 none (BC MOE)
28 3
Silica, Reactive ≤6ºC, do not freeze
P none 28
Sulfate ≤6ºC P, G none 28 Sulfide ≤6ºC P or G ZnAc/NaOH to
pH >9 7
METALS Hexavalent Chominum ≤6ºC P, G 1 ml 50% NaOH per
125 ml none
30 1
Metals, Total ≤6ºC P, G HNO3(7) 180
Metals, Dissolved no req. P, G field filter 0.45 um + HNO3, qualify if lab-filtered (7)
180
Mercury, Total no req. G, PTFE HCL or BrCL(8) 28 Mercury, dissolved no req. G, PTFE field filter 0.45 um +
HCL or BrCL, qualify if lab-filtered (7)
28
AGGREGATE ORGANIC ANALYSIS AOX (Absorbable Organic Halides)
≤6ºC A, G HNO3, store in dark sodium sulfite if chlorinated, collect with no headspace
14
Biochemical Oxygen Demand (BOD)
≤6ºC, do not freeze
P, G none 3
Carbonaceous Biochemical Oxygen Demand (CBOD)
≤6ºC, do not freeze
P, G none 3
Carbon, Dissolved Organic ≤6ºC P, G filter, H2SO4 or HCl none (BC MOE)
28 3
Carbon, Dissolved Inorganic ≤6ºC P, G field filter 14 Carbon, Total Organic ≤6ºC P, G H2SO4 or HCl 28 Carbon, Total Inorganic ≤6ºC P, G none 14 Chemical Oxygen Demand (COD)
≤6ºC P, G H2SO4 (field or lab) none (BC MOE)
28 3

Ground Pollution Monitoring
Field Sampling Manual, 2013
295
Chlorophyll a Filters: freeze ≤6ºC
Filter P, A, G
field filter, store in dark unfiltered, store in dark
Filters: 28 2
Phaeophytin Filters: freeze Filter field filter, store in dark
Filters: 28
Surfactants (Methylene Blue Active Substances)
≤6ºC P, G none 3
Total Phenols (4AAP) ≤6ºC P, G H2SO4 28
EXTRACTABLE HYDROCARBONS Extractable Hydrocarbons ≤6ºC A, G HCl, H2SO4 or
Sodium Bisulfate none
14/40 7/40
Oil & Grease / Mineral Oil and Grease
≤6ºC A, G HCL OR H2SO4 28
Waste Oil Content ≤6ºC A, G none 28
INDIVIDUAL ORGANIC COMPOUNDS Carbamate Pesticides ≤6ºC A, G Potassium Dihydrogen
Citrate(solid), ~pH 3.8, 9.2-9.5 g/L, + 100 mg/L Na2S2O3 if chlorinated ChlorAC buffer, ~pH 3, 1.8mL/60 mL sample+ 100 mg/L Na2S2O3 if chlorinated
28 28
Chlorinated and Non- chlorinated Phenolics
≤6ºC A, G 0.5g Ascorbic Acid / L + H2SO4 or Sodium Bisulfate none
14/40 7/40
Dioxins / Furans ≤6ºC G, A none unlimited
Glyphosate / AMPA ≤6ºC A, G or Poly- Propylene
100 mg/L Na2S2O3 if chlorinated
14
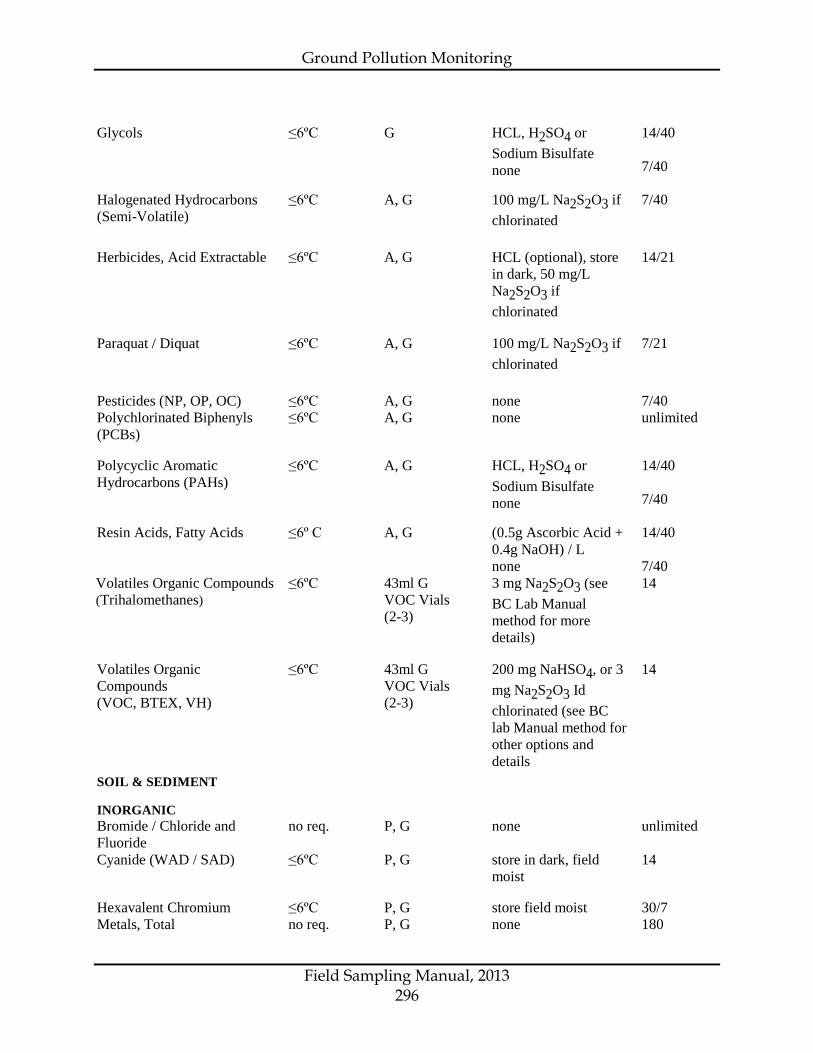
Ground Pollution Monitoring
Field Sampling Manual, 2013
296
Glycols ≤6ºC G HCL, H2SO4 or Sodium Bisulfate none
14/40 7/40
Halogenated Hydrocarbons (Semi-Volatile)
≤6ºC A, G 100 mg/L Na2S2O3 if chlorinated
7/40
Herbicides, Acid Extractable ≤6ºC A, G HCL (optional), store in dark, 50 mg/L Na2S2O3 if chlorinated
14/21
Paraquat / Diquat ≤6ºC A, G 100 mg/L Na2S2O3 if chlorinated
7/21
Pesticides (NP, OP, OC) ≤6ºC A, G none 7/40 Polychlorinated Biphenyls (PCBs)
≤6ºC A, G none unlimited
Polycyclic Aromatic Hydrocarbons (PAHs)
≤6ºC A, G HCL, H2SO4 or Sodium Bisulfate none
14/40 7/40
Resin Acids, Fatty Acids ≤6º C A, G (0.5g Ascorbic Acid + 0.4g NaOH) / L none
14/40 7/40
Volatiles Organic Compounds (Trihalomethanes)
≤6ºC 43ml G VOC Vials (2-3)
3 mg Na2S2O3 (see BC Lab Manual method for more details)
14
Volatiles Organic Compounds (VOC, BTEX, VH)
≤6ºC 43ml G VOC Vials (2-3)
200 mg NaHSO4, or 3 mg Na2S2O3 Id chlorinated (see BC lab Manual method for other options and details
14
SOIL & SEDIMENT
INORGANIC Bromide / Chloride and Fluoride
no req. P, G none unlimited
Cyanide (WAD / SAD) ≤6ºC P, G store in dark, field moist
14
Hexavalent Chromium ≤6ºC P, G store field moist 30/7 Metals, Total no req. P, G none 180

Ground Pollution Monitoring
Field Sampling Manual, 2013
297
Mercury, Total no req. P, G none none 28 Moisture ≤6ºC P, G none 14 pH no req. P, G none 365 Sulfide ≤6ºC P, G store field moist 7 TCLP - Mercury no req. P, G none 28/28 TCLP - Metals no req. P, G none 180/180
ORGANICS Carbon (TC, TOC) ≤6ºC
no req. P, G P, G
none dried stage
28 unlimited
Chlorinated and Non-chlorinated phenolics
≤6ºC G none 14/40
Dioxins / Furans ≤6ºC G none unlimited Extractable Hydrocarbons (LEPH, HEPH, EPH)
≤6ºC G none 14/40
Glycols ≤6ºC G none 14/40 Herbicides, Acid Extractable ≤6ºC G none 14/40 Oil and Grease/Mineral Oil and Grease/Waste Oil Content
≤6ºC G none 28
Pesticides (NP, OP, OC) ≤6ºC G none 14/40 Polychlorinated Biphenyls (PCBs)
≤6ºC G none unlimited
Polycyclic Aromatic Hydrocarbons (PAHs)
≤6ºC G none 14/40
Resin Acids, Fatty Acids ≤6ºC G none 14/40 TCLP - Volatile Organic Compounds
≤6ºC G none 14/14
TCLP - Semi-Volatile Organic Compounds
≤6ºC G none 14/40
Volatile Organic Compounds (VOC, BTEX, VH, THM)
≤6ºC G none 7 (6)/40
LEGEND
P = plastic Ster = sterilized T = tissue cup G = glass Solv = solvent cleaned B = baked A = amber Fc = foil-lined cap P&T = purge and trap vials W = wide mouth R = acid rinsed no req = no requirement

Ground Pollution Monitoring
Field Sampling Manual, 2013
298
1 A Director or an Environmental Management Act permit may specify alternate requirements.
2 Refer to applicable BC Environmental Laboratory Manual methods for additional detail. Where differences exist between Lab Manual methods and this table, this table takes precedence. 7 If not field-preserved, water samples for metals analysis must be acidified at the lab in their original containers by addition of HNO3 (within 14 days of sampling), then equilibrated at least 16 hours prior to sub-sampling or analysis (otherwise, qualify as "received unpreserved"). This approach is also applicable to dissolved metals if field filtered. Not applicable to mercury.
3 Storage temperature applies to storage at the laboratory. For all tests where refrigeration at ≤6°C is required at the laboratory, samples should be packed with ice or cold packs to maintain a temperature of ≤10°C during transport to the laboratory. The storage of ≤8°C for microbiological samples applies during storage at the laboratory and during transport to the laboratory. To prevent breakage, water samples stored in glass should not be frozen. Except where indicated by "do not freeze", test results need not be qualified for frozen samples.
4 Hold Times: Single values refer to hold time from sampling to analysis. Where 2 values are given, the first is hold time from sampling to extraction, and the second is hold time from extraction to analysis.
5 Samples received from remote locations more than 48 hours after collection must not be tested. 7 If not field-preserved, water samples for metals analysis must be acidified at the lab in their original
containers by addition of HNO3 (within 14 days of sampling), then equilibrated at least 16 hours prior to sub-sampling or analysis (otherwise, qualify as "received unpreserved"). This approach is also applicable to dissolved metals if field filtered. Not applicable to mercury.
8 Use only glass or PTFE containers to collect water samples for total or dissolved mercury. For total mercury, field-preserve with HCl or BrCl. For dissolved mercury, field filter and then preserve with HCl or BrCl. Adding BrCl to original sample container at the laboratory within 28 days of sampling is an acceptable alternative for total mercury and for dissolved mercury (if field-filtered) if samples are oxidized for 24 hours prior to sub-sampling or analysis. Dissolved mercury should not be lab-filtered. Qualify lab-filtered results for dissolved mercury as "lab-filtered".

Ground Pollution Monitoring
Field Sampling Manual, 2013
299
Appendix 6 Generalized Flow Diagram of Groundwater Sampling Steps
Step Procedure Essential Elements
Well Inspection
Well Purging
Field Determinations
• Dissolved Gases• Alkalinity/Acidity
• pH, Eh, Temperature, Specific Conductance
Unfiltered
• Total Metal (acidify in field) Volatile Organics, TOX• TOC• Large Volume Samples for Organic Compound Determinations• Assorted Sensitive Inorganic Species NO2 -, NH4+, Fe(II)
Field Filtered(45 µm)
• Soluble Trace Metal Samples (Filter and Acidify in the field)• S-, Sensitive Inorganics• Major Cations and Anions
Hydrologic MeasurementsVisual Inspection
Removal or Isolation of Stagnant Water(3-4 standing volumes)
Determination of Well-Purging Parameters(pH, ORP, T, Conductance)
• Water-Level Measurements• Check wellhead integrity
• Represents Water Access
• Verification Samples are Representative Water
• Sample Collection By Appropriate Mechanism• Minimal Sample Handling
• Head-Space Free Samples• Minimal Aeration or Depressurization• Minimal Air Contact• Adequate Equipment Rinsing against Contamination• Sample Preservation
• Minimal Loss of Sample• Integrity Prior to AnalysisStorage/Transport
Filtration should be accomplished preferably with in-line filters and pump pressure or by N2 pressure methods.Samples for dissolved gases or volatile organics should not be filtered. In instances where well development proceduresdo not allow for turbitity-free samples and may bias analytical results, split samples should be spiked with standardsbefore filtration.Both spiked samples and regular samples should be analyzed to determine recoveries from both types of handling.Assorted Field Blanks and Standards: as needed for good QA/QC.
(Modified Piteau 1990, Fig. 5.7)
Laboratory Determination
Sample Collection

EFFLUENT FLOW MEASUREMENT
Her Majesty the Queen in
Right of the Province of British Columbia
2013
All Rights Reserved
NOTE: The section on Effluent Flow Measurement was prepared for the Ministry by NovaTec Consultants Ltd.

Effluent Flow Measurement
Field Sampling Manual, 2013
301
Table of Contents 1. INTRODUCTION ................................................................................................. 303
2. OPEN CHANNEL FLOW .................................................................................... 303 2.1 Primary Devices (Weirs and Flumes) ................................................................. 303
2.1.1 Weirs .......................................................................................................... 305
2.1.1.2 Flow Conditions ................................................................................. 305
2.1.1.3 Application ......................................................................................... 307
2.1.1.4 Common Weir Types ......................................................................... 307
2.1.2 Flumes ....................................................................................................... 315
2.1.2.1 Definition and Description .................................................................. 315
2.1.2.2 Flow Conditions ................................................................................. 315
2.1.2.3 Application ......................................................................................... 316
2.1.2.4 Common Flume Types ...................................................................... 316
2.1.3 Installation and Design of Primary Flow Measurement Devices ................. 323
2.1.3.1 Weir Installation ................................................................................. 323
2.1.3.2 Flume Installation .............................................................................. 325
2.1.4 Calibration of Primary Flow Measurement Devices .................................... 325
2.1.4.1 Volumetric Method ............................................................................ 325
2.1.4.2 Dilution (dye) Method ........................................................................ 326
2.1.4.3 Point Method ..................................................................................... 326
2.1.5 Maintenance of Primary Flow Measurement Devices ................................. 326
2.2. Secondary Measuring Devices (Flow Meters) ................................................... 326
2.2.1 Floats ......................................................................................................... 326
2.2.2 Electrical (Capacitance Probe) ................................................................... 327
2.2.3 Ultrasonic Level Sensors ............................................................................ 329
2.2.4 Bubblers ..................................................................................................... 329
2.3 Selection Criteria for Secondary Measuring Devices ........................................ 330
2.4 Installation of Secondary Flow Measurement Devices .................................... 330
2.5 Calibration of Secondary Flow Measurement Devices ..................................... 331
2.6 Maintenance of Secondary Flow Measurement Devices .................................. 331
3. CLOSED CHANNEL FLOW MEASUREMENT .................................................. 332 3.1 Orifice Flow Meter ................................................................................................ 332

Effluent Flow Measurement
Field Sampling Manual, 2013
302
3.2 Venturi Flow Meter ............................................................................................... 333
3.3 Electromagnetic Flow Meter ............................................................................... 336
3.4 Doppler Flow Meter ............................................................................................. 337
3.5 Pressure Transducers ......................................................................................... 337
3.5.1. Selection of Pressure Transducers ............................................................. 338
3.6 Area Velocity ........................................................................................................ 338
4. FLOW RECORDERS .......................................................................................... 339 4.1 Flow Transmitters ................................................................................................ 340
4.2 Chart Recorders and Data Loggers .................................................................... 340
4.2.1 Charts vs Data Loggers .............................................................................. 341
4.2.2 Selection Criteria of Recorders and Data Loggers ...................................... 341
5. SOURCES OF FURTHER INFORMATION ........................................................ 342
6. REVISION HISTORY .......................................................................................... 342
APPENDIX 1 EFFLUENT FLOW MEASUREMENT CHECKLIST ............................ 343

Effluent Flow Measurement
Field Sampling Manual, 2013
303
1. Introduction The accurate measurement of wastewater flows is critical to the successful performance of a wastewater treatment plant. Flow measurement is of interest from an operations perspective at various stages of the treatment process including process flow streams within the plant, and effluent leaving the plant. The primary factor in the selection of the measurement device is whether the wastewater or effluent is being transported under open channel (e.g. open trough or partially filled pipes) or under full pipe conditions.
2. Open Channel Flow Open channel flow is defined as the flow in a conduit, in which the upper surface of the liquid is in contact with the atmosphere (free surface), such as in the case of an open trough, or a partially filled pipe (see Figure 1). Open channel flow measurement devices are traditionally the most common method of flow measurement in wastewater treatment plants but as the use of metering increases, this is changing. The flow in an open channel is measured using a combination of a primary device ( a structure restricting flow and causing the liquid level to vary proportionately with flow), and a secondary device (which measures the variation in liquid level caused by the primary device) (Kirkpatrick and Shelley [1]).
2.1 Primary Devices (Weirs and Flumes) Primary devices are calibrated restrictions (structures) which are inserted into the channel, and which cause the upstream liquid level to vary proportionately with channel flow. A secondary device is used to measure variations in the liquid level.
Wastewater systems typically use two broad categories of primary devices: 1) weirs, and 2) flumes (see Figure 2). The relationship between liquid depth and flow rate depends upon the shape and dimensions of the restriction (primary device), and is calculated using a known equation called the head/flow or stage/discharge relationship.
The selection of whether to use a weir or a flume as a primary measuring device is based on a number of factors, including:
• Installation cost; • Upkeep and maintenance cost; • Expected head loss; • Site configuration; • Location configuration (i.e. space availability, slop, channel size); • Rate of expected flow; • Wastewater characteristics (i.e. suspended solids).

Effluent Flow Measurement
Field Sampling Manual, 2013
304
Figure 1. Closed Channel and Open Channel Flow
Pressure Conduit Completely Filled
Open Channel Flow
Uncovered Canal
Closed Channel Flow
Partially Full Pipe
Effluent Flow Measurement
Field Sampling Manual, 2013
305
Measurement accuracy is generally not a factor in choosing between weirs and flumes as most types of weirs and flumes have a relative accuracy range of +/- 10% (Kirkpatrick and Shelley [1]).
The selection of the size of a primary device depends on the minimum and maximum flow rate expected for the location. The primary device must have a useful measurement range, which encompasses the minimum and maximum expected flow rates. It should be sized such that an appreciable change in liquid level occurs for the transition from the minimum to maximum flow.
A detailed discussion on the relative advantages and disadvantages of weirs and flumes can be found in the Channel Flow Measurement Handbook (Grant and Dawson [2]).
2.1.1 Weirs Definitions and Description
A weir is a calibrated obstruction or dam built across an open channel over which the liquid flows, often through a specially shaped opening or notch
(see Figure 2). Weirs are the simplest, least expensive, and most common form of primary measuring device. They are typically made of aluminum or fiberglass. Definitions for two related terms are:
1. Crest: the edge or surface over which the liquid passes; 2. Nappe: the stream of water leaving the crest.
2.1.1.2 Flow Conditions There are two possible flow conditions through a weir.
1. Free (critical) Flow Condition: This condition occurs when the water surface downstream from the weir is far enough below the weir crest so that air flows freely below the nappe (the nappe is aerated), and only the head upstream of the weir is needed to determine the flow rate. The head of the weir is the vertical distance from the crest to the liquid surface in the upstream channel, and the measuring point should be upstream of the weir at a distance of at least three or four times the maximum head expected over the weir (see Figure 2).

Effluent Flow Measurement
Field Sampling Manual, 2013
306
Figure 2. General Sharp-crested Weir Configuration
Head Measuring
Throat section
General Flume Configuration
Minimum
Maximum Head, H
Crest Height
Head Point Measurement
Maximum 2-H 3-4H
Converging section
Points
Flow
or
Nappe Ventilation Weir plate Channel floor
Drawdown
Crest
K=Approx. 1/8 in.
Diverging section
K K
Minimum
45°
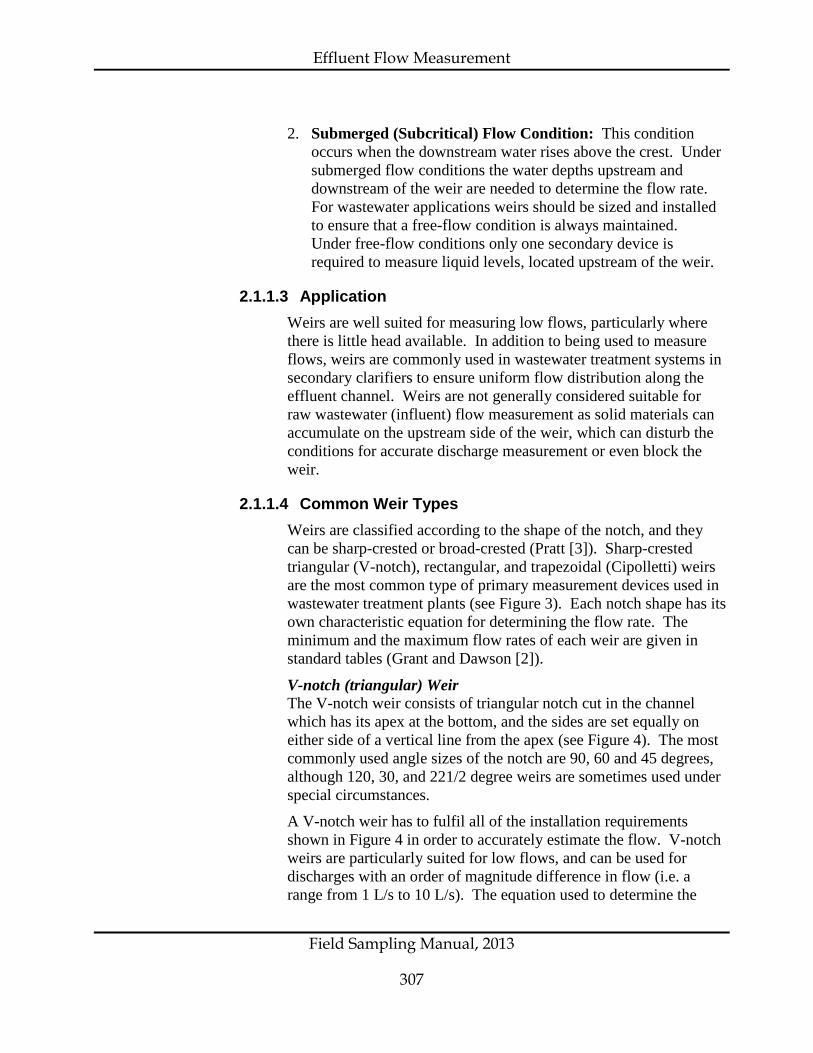
Effluent Flow Measurement
Field Sampling Manual, 2013
307
2. Submerged (Subcritical) Flow Condition: This condition occurs when the downstream water rises above the crest. Under submerged flow conditions the water depths upstream and downstream of the weir are needed to determine the flow rate. For wastewater applications weirs should be sized and installed to ensure that a free-flow condition is always maintained. Under free-flow conditions only one secondary device is required to measure liquid levels, located upstream of the weir.
2.1.1.3 Application Weirs are well suited for measuring low flows, particularly where there is little head available. In addition to being used to measure flows, weirs are commonly used in wastewater treatment systems in secondary clarifiers to ensure uniform flow distribution along the effluent channel. Weirs are not generally considered suitable for raw wastewater (influent) flow measurement as solid materials can accumulate on the upstream side of the weir, which can disturb the conditions for accurate discharge measurement or even block the weir.
2.1.1.4 Common Weir Types Weirs are classified according to the shape of the notch, and they can be sharp-crested or broad-crested (Pratt [3]). Sharp-crested triangular (V-notch), rectangular, and trapezoidal (Cipolletti) weirs are the most common type of primary measurement devices used in wastewater treatment plants (see Figure 3). Each notch shape has its own characteristic equation for determining the flow rate. The minimum and the maximum flow rates of each weir are given in standard tables (Grant and Dawson [2]).
V-notch (triangular) Weir The V-notch weir consists of triangular notch cut in the channel which has its apex at the bottom, and the sides are set equally on either side of a vertical line from the apex (see Figure 4). The most commonly used angle sizes of the notch are 90, 60 and 45 degrees, although 120, 30, and 221/2 degree weirs are sometimes used under special circumstances.
A V-notch weir has to fulfil all of the installation requirements shown in Figure 4 in order to accurately estimate the flow. V-notch weirs are particularly suited for low flows, and can be used for discharges with an order of magnitude difference in flow (i.e. a range from 1 L/s to 10 L/s). The equation used to determine the

Effluent Flow Measurement
Field Sampling Manual, 2013
308
discharge (head/flow) for a free-flowing V-notch weir is as follows (Grant and Dawson [2]):
Figure 3. Various Sharp-crested Weir Profiles
C. V-notch (or triangular) weir
A. Rectangular weir without end constractions
D. Trapezoidal (or Cipolletti) weir
B. Rectangular weir with end constractions

Effluent Flow Measurement
Field Sampling Manual, 2013
309
Figure 4. V-notch (triangular) Sharp-crested Weir
2Hmax minimum
Hmax
2Hmax minimum

Effluent Flow Measurement
Field Sampling Manual, 2013
310
Q = K H 2.5 Where: Q = flow rate H = head on the weir
K = a constant which is a function of the angle of the weir and the unit of measurement
Rectangular (Contracted and Suppressed) Weir The rectangular sharp-crested weir can be used in two different configurations:
1. Rectangular Contracted Weir: Consists of a rectangular notch cut in the channel to produce a box-like opening, where the horizontal distance from the end of the weir to the side walls of the channel are called the end contractions (see Figure 5a), and are used to:
• Reduce the channel width; • Speed up the channel flow; • Provide the needed ventilation as the flow passes over the weir.
2. Suppressed Rectangular Weir: When the end contractions are totally suppressed, and the channel’s sides become weir’s sides the weir is called a suppressed rectangular weir (see Figure 5b). Experience has shown that when constructing a rectangular weir a crest length of 30 cm (12 inches) is the minimum that should be considered, and 15 cm (six inches) increments are used to increase the crest length up to 90 cm (36 inches). Beyond the 90 cm a 30 cm (12 inches) increment is used to suit a particular installation. Installation requirements should be as shown in Figure 5b, and 5a. Special care often needs to be taken to ensure proper ventilation of the nappe - usually through the placement of vent pipes in the side walls to allow air to reach under the nappe.
The minimum head should be at least 5 cm (2 inches) to prevent the nappe from clinging to the crest, and generally the maximum head is recommended not to be more than one half the crest length.
The equation below is used to determine the discharges (head versus flow rate) of a free flowing rectangular weir with two end contractions:
Q = K (L-0.2H) H 1.5

Effluent Flow Measurement
Field Sampling Manual, 2013
311
Q = 1838 (L-0.2H) H 1.5 (l/s), L (m) Q = 6618 (L-0.2H) H 1.5 (m3/h), L (m)
Where: Q= flow rate H= head on the weir L = crest length of the weir K = constant dependent on measurement units
Trapezoidal (Cipolletti) Weir A trapezoidal weir is a rectangular weir with an end contraction, which has its sides inclined outwardly, producing a trapezoidal opening as shown in Figure 6. When the sides are inclined in the ratio of four vertical to one horizontal the weir is known as Cipolletti weir. To be able to measure the flow rates accurately, trapezoidal weirs have to fulfill the installation requirements shown in Figure 6. The minimum head should be at least 5 cm (2 inches) to prevent the nappe from clinging, and the maximum head is recommended not to be more than one half the crest length. The discharge (head versus flow rate) equation of a free flowing Cipolletti weir is as follows:
Q= K L H 1.5 Q = 1859 L H 1.5 (l/s), L (m) Q = 6692 L H 1.5 (m3/h), L (m)
Where: Q= flow rate H = head on the weir L = crest length of the weir K = a constant dependent on the measurement units
Other Weirs The most commonly used weir types in the wastewater flow measurements are the one discussed above. But there are other special profiles, and less-common types of primary devices classified as weirs, such as broad-crested weirs, and compound weirs, which are used in particular site configurations or to achieve a certain head/discharge relationship (see Figure 7). The most common of these special designed devices is the proportional weir or Sutro weir. Please refer to Pratt [3] for more details on alternative weirs.

Effluent Flow Measurement
Field Sampling Manual, 2013
312
Figure 5. Rectangular Sharp-crested Weirs
B. Suppressed (without end contractions)
2Hmax
A. Contracted (with end constractions)
Crest Length L
minimum Hmax
Hmax
minimum 2Hmax
Crest Length L
minimum 2Hmax

Effluent Flow Measurement
Field Sampling Manual, 2013
313
Figure 6. Trapezoidal (Cipolletti) Sharp-crest Weir
Crest Length L minimum 2Hmax
minimum 2Hmax
Hmax 4 1

Effluent Flow Measurement
Field Sampling Manual, 2013
314
Figure 7. Special Sharp-crest Weir Profiles
Compound Weir (V-notch Weir with Contracted
C. Approximate exponential weir
A. Sutro or proportional weir
A. Low flow-acts as a V-notch
Rectangular Weir)
weir only
D. Poebing weir
B. Approximate linear weir
tion of V-notch and rectanglular weir B. High flow-acts as a combina-

Effluent Flow Measurement
Field Sampling Manual, 2013
315
2.1.2 Flumes
2.1.2.1 Definition and Description Flumes are the second class of commonly used primary measuring devices. They are specially shaped channel restrictions, which change the channel area, and slope. This change increases the velocity, and the level of the liquid, flowing through the flume (see Figure 2). They can be made from various construction materials such as fiberglass, and concrete, and their structure is composed of three main components:
1. Converging section used to restrict the flow; 2. Throat section; 3. Diverging section used to ensure a free flow condition.
The flume should be installed to ensure it operates under a free-flow condition. The flow rate in the channel is determined by measuring the liquid level at a specified point in the flume. For more detail on various flume design approaches refer to Kirkpatrick and Shelley [1].
2.1.2.2 Flow Conditions Flumes can be categorized into three main groups based on the flow-state through the flume:
1. Subcritical; 2. Critical; 3. Supercritical.
Similar to a weir, there are two flume discharge conditions, which can occur:
1. Free-flow condition, when there is insufficient backwater to reduce the flow rates. Under this condition only the upstream head is needed to determine the flow rate.
2. Submerged-flow condition, when backwater is high enough to reduce the discharge. Under this condition both the head upstream of the flume and in the throat are needed to determine the flow rate. The point at which the flow changes from free flow to submerged flow is called the submergency point.
It is expressed as a percentage, which is the ratio of downstream liquid depth/ upstream liquid depth and it varies from size to size being as low as 55% and as high as 80% through the range of throat sizes from 2.54 - 240 cm.

Effluent Flow Measurement
Field Sampling Manual, 2013
316
Flumes should be sized and installed to ensure that a free-flow condition is always maintained. Under free-flow conditions only one secondary device is required to measure liquid levels, located upstream of the flume.
2.1.2.3 Application Flumes are usually used to measure flow in open channels where higher flows are expected, and are better suited for use with flows containing sediment or solids than weirs. Flumes are self-cleaning, and require less maintenance in comparison to weirs, but they still need to be cleaned specially when used with sewage flows where more sediments are expected.
2.1.2.4 Common Flume Types Some of the commonly used flume types are:
Parshall Flume Parshall flumes (see Figure 8) are primarily used for permanent installations. Their design and sizes are dictated by the throat width, which for wastewater applications is usually a minimum of 25 mm (one inch). The throat width and all other dimensions must be strictly followed so that standard discharge tables can be used (Grant and Dawson [2]). Parshall flumes in turbulent flows are typically equipped with an integral floatwell to house the secondary-measuring device, and to ensure a correct liquid level reading. They are designed in a way to be able to withstand a high degree of submergence without affecting the rate of flow, and to have a self-cleaning capability as shown in Figure 8.
The flow rate in the Parshall flume is determined by measuring the liquid level one third of the way into the converging section, and the discharge rates are determined using the following head versus flow relationship:
Q = K H n
Where: Q = flow rate H = head measured at point Ha (Figure 8) K = constant, function of throat width and measurement
units n = constant (function of throat width)

Effluent Flow Measurement
Field Sampling Manual, 2013
317
Figure 8. Parshall Flume
Plan View
W D P Flow H C
H b a H
A
2/3 A
E
Elavation View
M B G T
Water surface
Level floor
Station 1 Slope 1/4
Submerged flow
Free flow K
Y X
N Zero reference level for H and H a
b
R
The parshall flume dimensions A,B,C,D,E,T,G,H,K,M,W,P,R,X,Y are given in special tables.

Effluent Flow Measurement
Field Sampling Manual, 2013
318
Palmer - Bowlus Flume The Palmer-Bowlus flume also produce a high velocity critical-flow in the throat by constricting the flow through the flume. The Palmer-Bowlus flume was designed to be installed in an existing channel, and its measurement accuracy is less sensitive to upstream flow disturbances (e.g. turbulent flow conditions) than the Parshall flume. It is often used in manholes or open round or rectangular bottom channels, or in channels with excessive slope and/or turbulence (see Figure 9a). The flume sizes are designated by the size of the pipe or conduit into which they fit, and the volume of expected flow, not by the throat width as is the case with the Parshall flumes. Palmer-Bowlus flumes are available from various manufacturers to fit pipe sizes ranging from 10 to 100 cm (4 - 42 inches), and larger sizes can be specially ordered.
The flow rate through a Palmer-Bowlus flume is determined by measuring the liquid depth at a point one-half pipe diameter upstream from the flume throat, and the most popular and preferred design for circular pipes and conduits is the Palmer-Bowlus flume which has a trapezoidal throat (see Figure 9b).
The Palmer-Bowlus flume main advantages comparing to Parshall flume are: • less energy loss; • minimal restriction to flow; • Easy installation in existing conduits.
Because of possible wide variation in Palmer-Bowlus design, and different manufacturers, it is very important to assure that the rating curve (head versus flow) being applied is the correct one for that particular flume. The rating curve should be the one provided by the manufacturer.

Effluent Flow Measurement
Field Sampling Manual, 2013
319
Figure 9A. Palmer-Bowlus Flow Measuring Flume
W
2:1
D
2:1
Preferred head measuring point
t
D- PIPE DIAMETER W = 5D t = D H- WATER DEPTH
12 6
Flow Upper transition Throat Lower
transition Small Jump should occur in this region Water surface
Depth Upstream Downstream Depth
D 2 D = Conduit diameter
Elevation View
Sectional View
D
H
H

Effluent Flow Measurement
Field Sampling Manual, 2013
320
Figure 9B. Palmer-Bowlus Flow Measuring Flume
D 2
Indicates the point of measurement
Flow
4 D + 1
Palmer-Bowlus with Integral Approach
D
D + 2 D/6
Dimensions are Inside

Effluent Flow Measurement
Field Sampling Manual, 2013
321
Other Flumes There are a number of other types of flumes, which can find application in effluent flow measurement. These are usually purchased prefabricated from one of the many flume manufacturers to meet special design criteria or to solve a specific problem. Some common types are:
• Leopold-Lagco Flume: a proprietary flume manufactured by the F.B. Leopold Company (see Figure 10). They are mainly used in the measurement of sewer flows, and their sizes are designated by the size of the conduit in which they are to be installed and the expected range of flows. They are available to fit pipe sizes ranging from 10 - 183 m (4 to 72 inches). They provide an accurate flow measurement when used on a minimum grade or grades up to 2%. The best location for the level measuring point is at a distance of 1/12 D or 25 mm (one inch) minimum upstream of the flume. The discharge equation is as follows:
Q = K D0.953 H1.547
Where: Q = flow rate H = head D = pipe diameter K = constant function of units
HS, H, and HL flumes were developed by the U.S. Department of Agriculture (USDA). They are capable of monitoring flows that vary over wide ranges (100:1) with a high degree of accuracy. As per Grant and Dawson [2] the maximum flow rates range from:
2.4 - 23.2 L/s 8.6 - 83.6 m3/hr for HS flume
9.5 - 2380 L/s 34 - 8580 m3/hr for H flumes
586 - 3290 L/s 2110 - 11,800 m3/hr for HL flumes
When installing an H-type flume it is recommended that the approach channel is rectangular, having the same depth and width as the flume, and a length three to five times the depth of the flume.

Effluent Flow Measurement
Field Sampling Manual, 2013
322
Figure 10. Leopold-Lagco Flume
Preferred head measuring point
Flow Upper transition Throat Lower
transition Small Jump should occur in this region Water surface
Depth Upstream Downstream Depth
D 12
D = Conduit diameter
Elevation View
H
or 1" (0.025 m) minimum
INSERT TYPE L=2D
SECTION B-B SECTION A-A
PLAN
A
D
A B
B
W=D
D
D = Conduit diameter W = Throat width

Effluent Flow Measurement
Field Sampling Manual, 2013
323
• Trapezoidal flumes have been used by the U.S. Department of Agriculture (USDA) to measure small flows. Its sloping sides permit a very wide range of measurable flow and cause a minimum backwater. Various trapezoidal flumes have been constructed to measure maximum flow rates ranging from 1- 2,650,000 m3/hr (0.010 to 26,000 cfs).
• Cutthroat flumes were developed by Utah State University Water Resources Laboratory and as the name indicates the flume does not have a throat section (see Figure11). The flume is a flat-bottomed device and its main advantage is extreme simplicity of form and construction. It is recommended that cutthroat flumes be used in channels where free and submerged flow conditions may be desired. For more detail on these types refer to Grant and Dawson [2].
2.1.3 Installation and Design of Primary Flow Measurement Devices The various flow-monitoring methods have distinct advantages or disadvantages under different conditions and, therefore, specific installation requirements. Prior to the device installation a field inspection is recommended to investigate hydraulic conditions in the conduit such as, flow direction, obstructions, expected flow rates, presence of debris, and flow regime. The manufacturer’s recommendations for installation always need to be followed.
2.1.3.1 Weir Installation To ensure accurate discharges measurement, there are certain general design requirements that apply to all weir types:
• The upstream face of the weir should be smooth and perpendicular to the axis of the channel;
• The connection to the channel should be waterproof; • The length of the weir or the notch angle must be accurately
determined; • The weir should be ventilated if necessary to prevent a vacuum
from forming below the nappe; • The height from the bottom of the channel should be at least 2
times the maximum expected head of the liquid above the crest;
• The approach section upstream of the weir should be straight for at least 20 times the maximum expected head of liquid. For more design requirements refer to Grant and Dawson [2];
• The weir should be made of a thin plate 3 - 6mm;
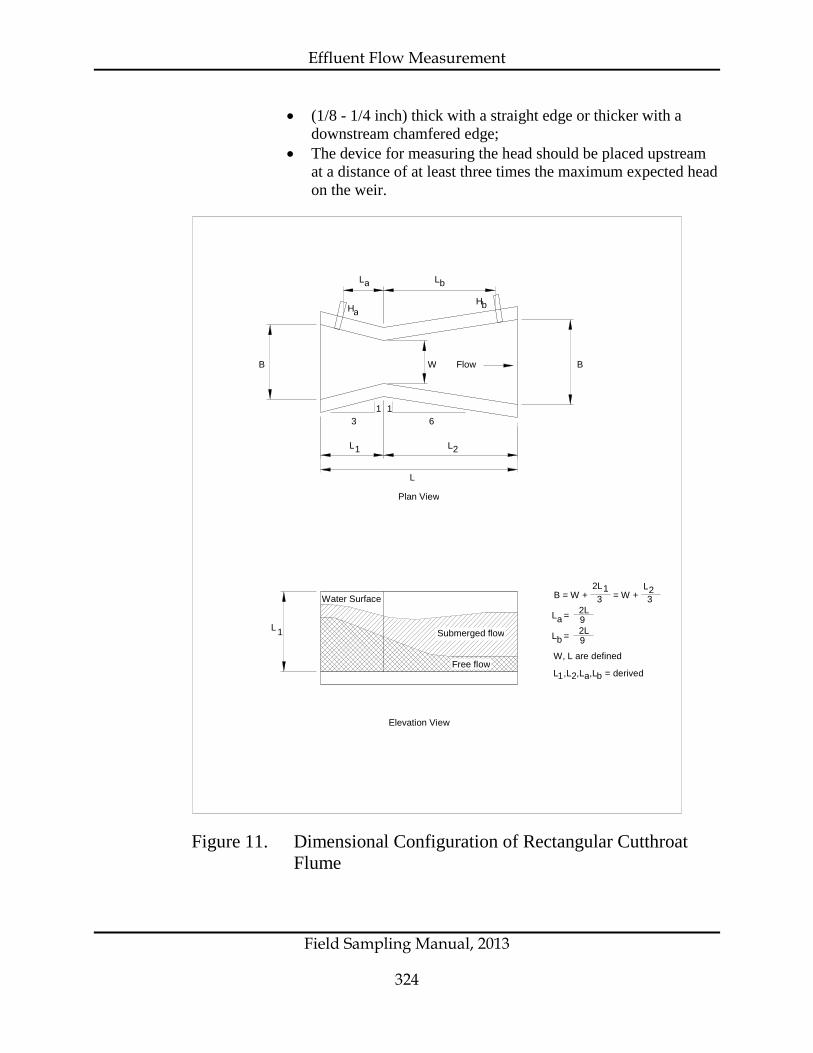
Effluent Flow Measurement
Field Sampling Manual, 2013
324
• (1/8 - 1/4 inch) thick with a straight edge or thicker with a downstream chamfered edge;
• The device for measuring the head should be placed upstream at a distance of at least three times the maximum expected head on the weir.
Figure 11. Dimensional Configuration of Rectangular Cutthroat Flume
Elevation View
L 1
Water Surface
Submerged flow
Free flow
Plan View
W Flow B B
L
L L 1 2
1 3 6
1
H a b H a L L b
B = W + = W + 2L 1 3
L 2 3
L a = 2L 9 2L 9 L b =
W, L are defined 1 L ,L ,L ,L = derived 2 a b

Effluent Flow Measurement
Field Sampling Manual, 2013
325
2.1.3.2 Flume Installation The following points need to be taken in consideration when selecting, and installing a particular type of flume:
• A flume should be located in a straight section of the open channel;
• The flume should be set on a solid foundation; • The approaching flow velocity should be free of turbulence,
and waves, and well distributed in the channel; • The upstream banks should be high enough to sustain the
increased liquid depth caused by the flume installation; • If possible always install the flume to obtain a free flowing
condition.
2.1.4 Calibration of Primary Flow Measurement Devices Some form of calibration method must be provided for in every field installation. To calibrate the complete measuring system there are three main methods commonly used:
1. Volumetric flow measurement; 2. Dilution (dye); 3. Point velocity and depth measurement.
2.1.4.1 Volumetric Method The volumetric method is considered to be one of the most accurate methods for obtaining liquid-flow relationships. This method is typically used for only small volumes of liquid, but can be applied to larger flows if suitably large enough basins are available. The volumetric method involves determining the amount of time to fill a tank or container of a known volume. The rate of flow is calculated by dividing the volume by the fill time.
The volumetric method requires only a sensor to monitor liquid level, or to determine when the tank volume is full. It can be applied to sewage pumping stations as a routine method of estimate sewage flows by recording the off-on times of the pumps through telemetry or SCADA systems. There is also a commercially available product, which uses this principal to estimate flow (Volumeter-Model 300 made by Marsh-McBirney, Inc.).

Effluent Flow Measurement
Field Sampling Manual, 2013
326
2.1.4.2 Dilution (dye) Method This method measures the flow rate by determining the dilution of a tracer solution. The dye is continuously injected at a constant rate, from a distance far enough upstream to ensure the dye is uniformly concentrated through the cross section at the point of measurement. The dye concentration change is proportional to the change in flow rate.
2.1.4.3 Point Method This method requires the collection of depth and velocity measurements at specific points across the channel cross section to determine the flow, which is equal to mean velocity x cross sectional flow area (VxA). The Two-point method can be used to determine the mean velocity.
2.1.5 Maintenance of Primary Flow Measurement Devices Proper function and accurate flow measurement are directly related to the level of maintenance of primary measuring devices.
A frequent inspection and maintenance of the devices is recommended on a bi-weekly basis to:
• Clean sediment and debris from the upstream channel; • Check the primary and secondary devices zero-setting.
2.2. Secondary Measuring Devices (Flow Meters) Secondary measuring devices are devices used to measure liquid level variations in conjunction with primary measuring devices (weir or flume). The liquid level is used to estimate the flow rate based on the known liquid-level flow-rate relationship of the primary measuring device.
2.2.1 Floats Historically, floats have been the most commonly used secondary devices used for monitoring liquid level variations, because of their relatively low cost, and availability. However, this has changed in recent years due to the decreased cost, increased availability, and improved reliability of electronic measuring devices such as ultrasonic sensors.
Floats are suspended in a stilling well area, located to the side of the flume. The stilling well is connected to the channel by a slot or port, such that the liquid level in the stilling well is the same as the critical hydraulic level in the flume. The stilling well is required for a float system, as a

Effluent Flow Measurement
Field Sampling Manual, 2013
327
float could not be placed in the flume channel without creating a hydraulic disturbance, which would interfere with the flume hydraulics and measurement accuracy. The stilling well also prevents the float from being affected by any hydraulic surges.
The float is usually connected by a cable to chart recorder pulley, and as the float rises and falls, the pen on the chart recorder moves correspondingly. A movable weight can be attached to the cable, which keeps it taut (see Figure 12). The cable will cause the rotating member to be angularly positioned proportional to the level of the liquid in the primary device. When the float is used in a combination with an electronic relay the level is read electronically. A system of gears enables the chart recorder to be calibrated and record information in specific units (i.e. inches of liquid, flow in gallons, etc.).
Floats include moving parts, which are subject to wear, and are subject to build-up of grease and solids. Thus they require periodic maintenance and repair. The accuracy of floats used as level measuring devices ranges from 1.5 mm – 6 mm (0.005 ft - 0.020 ft) (Irwin [4]).
2.2.2 Electrical (Capacitance Probe) The capacitance probe utilizes the electrical conductivity of the liquid to monitor variations in liquid level. Electrodes or probes are suspended vertically into the liquid being controlled, thus completing a circuit which actuates the control relay. The changing liquid level causes an electrical capacitance change, where the difference in capacitance indicates the depth of the liquid. Electrodes and holders should be selected according to the specific characteristics of the liquid involved, and the lengths required to monitor the potential range in liquid level. Electrode holders and electrodes are available for measuring liquid level in temperature up to 232 C0, and pressure of 13790 kpa pressure (MagneTek Controls [5]).
The changing liquid characteristics, or coatings of grease, hair, or solids can adversely affect the accuracy of the electrical system, and the plates are subject to damage by floating debris. Thus this method of measure-ment can be used to measure flow in raw sewage or in-process flows only if applied as a short-term installation. Capacitance probes are better suited to measuring effluent flows, which are less likely to contain materials which will interfere with measurement. Electrical type level measurement devices are available to measure the liquid level with 0.5 % to 1 % accuracy of full-scale level (Irwin [4]).

Effluent Flow Measurement
Field Sampling Manual, 2013
328
Figure 12. Float level measuring device
Opening Between Partial Flume and Stilling Well
Section AA
Plan View
Channel
section Converging
Float
Flow
A
Stilling Well
A
Opening Between Partial Flume and Stilling Well
Float
Well Stilling
Diverging Throat section section

Effluent Flow Measurement
Field Sampling Manual, 2013
329
2.2.3 Ultrasonic Level Sensors An ultrasonic sensor mounted above the flow stream transmits a sound pulse that is reflected by the surface of the liquid. The time required for a pulse to travel from the transmitter to the liquid surface and back to the receiver is used to determine the liquid level. Ultrasonic systems are available to monitor levels from a few centimeters and up to 61 meters (Milltronics Process Measurements [6]). There are various types of transducers used, and their selection depends on the material and application range to be monitored. The distance between the transducer and the transceiver depends on the type of the transducer used (available for distances up to 366 m [6]). They can operate under pressure up to 200 kPa, and temperature range –40C° to 150 C° [6] with range of accuracy 0.25%-0.5%. The selection of the proper transducer is based on:
• Maximum level to be measured; • Characteristics of the transducer (pressure, temperature, corrosivity,
etc); • Mounting configuration.
Since the ultrasonic level sensors are fixed above the flow stream, grease, suspended solids, silt, corrosive chemicals in the flow stream, and liquid temperature fluctuation do not affect the sensors. However, ultrasonic systems may be affected by wind, high humidity, air temperature, radio and electromagnetic waves, rain, shock waves, and floating foam and debris, and they are not suitable for use in very narrow channels.
2.2.4 Bubblers Bubblers consist of an air tube, which is anchored in the flow stream at a fixed depth along the side-wall of a primary device (flumes or weirs). Bubbler flow meters use an air compressor to force a metered amount of air through a line submerged in the flow channel. The pressure needed to force the air bubbles out of the line corresponds to the hydraulic head of the liquid above the tube. Thus the pressure in the tube is proportional to the liquid level in the primary device, and can be measured with a mechanical pressure sensor or an electronic pressure transducer.
Some bubblers have a built in plotter, flow conversion equations, telemetry capabilities, and data storage (ISCO 3230). This allow them to provide and transmit a time based level or flow rates and total flow.

Effluent Flow Measurement
Field Sampling Manual, 2013
330
Bubblers are highly velocity sensitive, and readings may be greatly influenced by the non-vertical installation of the tube, disturbance of the tube by floating debris, suspended solids, and rapidly rising and falling head levels. Thus periodic maintenance (cleaning) is required. To prevent the building-up of potentially clogging solids some bubblers have an exclusive automatic bubble line purge.
The purge can be set to occur at selected time interval or can be activated manually. Usually special software is used to sense the rising heads and automatically increase the bubble rate to maintain the maximum accuracy.
2.3 Selection Criteria for Secondary Measuring Devices The most important criteria to be considered in the selection of a secondary measuring device includes:
• Type of application; is the metering device appropriate for open or closed conduit flow?
• Proper sizing for range of depths to be measured; is the device appropriately sized for the range of flows that needs to be monitored?
• Fluid composition, does the device have the recommended minimum clear opening for the fluid being monitored, and is it compatible with the fluid?
• Accuracy and repeatability: is the stated accuracy of the component consistent with overall system accuracy?
• Installation requirements; is there enough length in front and behind of the device, and are measuring devices accessible for service?
• Ease of maintenance; how often the device needs to be cleaned, and are cleaning systems available?
• Operating environment; where necessary is the equipment resistant to moisture and corrosive gases?
• Head loss.
2.4 Installation of Secondary Flow Measurement Devices Proper installation of secondary flow measurement devices is directly related to the amount of information collected regarding the location, characteristics of the liquid to be monitored, operating environment (temperature, gases, moisture...), and flow conditions.
The manufacturer’s installation instructions should always be followed. The following recommendations should be taken in consideration when installing these devices:
• The upstream section should be cleared of debris and sediments (at least 15 diameters upstream from the sensor );

Effluent Flow Measurement
Field Sampling Manual, 2013
331
• The level sensor in an open channel should be housed in a stilling well; • When applicable, it should be ensured that the sensors are installed centered
and flat on the conduit bottom; • If the flow velocity is greater than 1.5 m/s, better results may be obtained by
mounting the sensor facing the downstream direction, if possible.
2.5 Calibration of Secondary Flow Measurement Devices Level sensors are pre-calibrated at the factory or are calibrated by the distributor upon installation using the equipment available from the meter manufacturer. The calibration of the level sensors is simply checked by comparing the sensor reading to the tape measurement of the depth. In open channel systems a known depth of flow is simulated, then verified if the sensor read and totalized correctly for that depth. If any discrepancies are discovered, the manufacturer’s instructions for re-calibration should be followed.
2.6 Maintenance of Secondary Flow Measurement Devices Regular site inspection and maintenance is recommended on a weekly or bi-weekly basis. Frequency is dependent on type of instrument – ultrasonic level sensors tend to be relatively maintenance free. The inspection should include:
• Clean the sensor and the instrument enclosure; • Remove sediment and debris from around the cable and sensor cables; • Check the accuracy of the time display; • Check the power availability; • Compare the depth reading to a manual measurement of the depth, before and
after clean-up, and if the difference in depth is greater than 5 cm (two inches) or 10% the effective range, the meter should be removed for re-calibration;
• Note any irregularities; • When devices are used to measure raw wastewater a flushing system should
be provided where appropriate. Self-cleaning electrodes are available for use with used with magnetic flow meters using either high frequency ultrasonic waves or heat;
• For long-term installations, complete maintenance is required every six months, and a record of all flow monitoring, cleaning, and maintenance activities must be kept. The maintenance record should describe the system condition before and after any work was undertaken.

Effluent Flow Measurement
Field Sampling Manual, 2013
332
The maintenance should include:
• Removal of sensors and cables for cleaning; • Cleaning of the pipes upstream for at least 15 pipe diameters upstream of the
sensor location.
3. Closed Channel Flow Measurement Closed channel flow is flow in completely filled pressure conduit (pipes) (see Figure 1). There are three main methods used to measure the flow rates in closed conduits.
1. Insertion of an obstruction to create a predictable head loss or pressure difference. 2. Measurement of the effect of the moving fluid (momentum change, magnetic field
shift, etc.). 3. Measurement of increment unit of fluid volume.
The most common devices used for flow measurement in closed channels are: Venturi meters, flow nozzles, Orifice meters, magnetic meters, Doppler meters, and Pitot tube flow meters. Not all these devices are suitable for specific waste-waters. These commercially available measuring devices use the Principe of Continuity, and one of several equations that define flow motion such as the energy equation or the momentum equation. Others use physical principals such as Faraday’s law of electromagnetic induction, used in magnetic flow meter, and Ohm’s law utilized in hot wire anemometers measuring the rate of cooling by flow of fluid past an electrically heated resistance wire.
The simplest way to measure pressure and pressure differential in a closed pipe is to use a vertical standpipe called a Piezometer tube connected to a tap on the pipe in which the pressure is to be measured. If the piezometer tube has a U-shape the instrument than is called a manometer. To produce uniform conditions in the closed pipe it is recommended that at least a length of 6 times the pipe diameter be straight in front of the measuring device (Simon and Korom [8]). A straight run of about 5 times the pipe diameter is desirable after the measuring device (Simon and Korom [8]). The most commonly used methods are described in the following sections.
3.1 Orifice Flow Meter It should be noted that the orifice flow meter is not considered suitable for wastewater flow measurement, due to the solids content of the flow. An orifice is a cylindrical or prismatic opening through which fluid flows.

Effluent Flow Measurement
Field Sampling Manual, 2013
333
The size of the opening is accurately calculated and bored to produce the required differential pressure for the specified flow condition (see Figure 15). Usually pressures and differential pressures are determined using one of the above, discussed instruments. Most of commercially available orifice meters are supplied with a calibration chart.
Because of its simplicity, low cost, ease of installation, and high accuracy, orifice plates are commonly used to determine the flow rates based on the deferential pressure readings, and in order to measure flow rates accurately it is necessary that the interior of the pipe be smooth and round. Two main types of orifices are available:
1. Thin plate orifice, 2. Sharp-edged orifice.
Orifices can be made of various materials with different corrosion-resistant characteristics and can be assembled in two ways:
1. The orifice is completely welded in place and cannot be removed. Commercially available orifices can support up to 4137 kpa pressure and 371 C° operating condition ( Badger Meter [7]).
2. The orifice plate is retained in place with flanges.
Flow estimation is based on the following equation:
Q = KA√ (2gh) Where:
k = flow coefficient h = h1-h2 pressure head (m) g = 9.81(m/s2)
3.2 Venturi Flow Meter Venturi meters are used to measure the flow in closed conduits, and they consist of:
1. The inlet cone, where the diameter of the conduit is gradually reduced. 2. The throat or constricted section; in standard meters the throat has a size range
of 1/5 D - ¾ D the diameter of the pipe, and its length is equal to its diameter. 3. The outlet cone, in which the diameter increases gradually to that of the pipe
in which the meter is inserted.
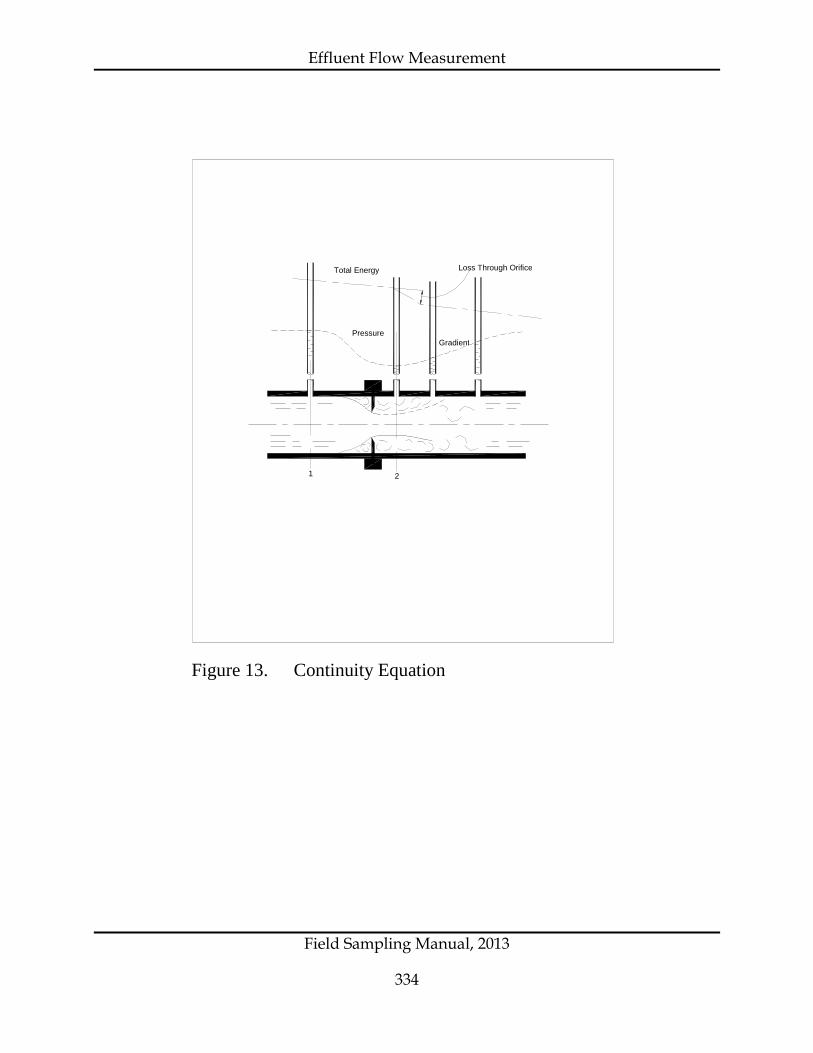
Effluent Flow Measurement
Field Sampling Manual, 2013
334
Figure 13. Continuity Equation
Gradient Pressure
1
Total Energy Loss Through Orifice
2

Effluent Flow Measurement
Field Sampling Manual, 2013
335
Figure 14. Typical Venturi meter
High-pressure pipe connection
Throat lining
Outlet cone
Throat
pipe connection Low-pressure
Inlet cone
d D
Pressure Sensing Holes

Effluent Flow Measurement
Field Sampling Manual, 2013
336
A Venturi meter operates on the same principle as the orifice but with a much smaller head loss (see Figure14). The flow rates through the meter are determined based on the difference between pressures indicated at the inlet and at the throat of the meter, and the equation used to determine the discharge is:
Q = CA√ (2gh) Where:
A = Area at throat of meter (m2) H = h1 - h2, pressure heads (m) g = 9.81 m/s2 C = Coefficient of energy losses
Venturi meters need to be cleaned periodically to remove solids, which may clog them, and affect the accuracy of the measurement. A flushing system is necessary for good performance, to keep the pressure sensors from clogging.
3.3 Electromagnetic Flow Meter The electromagnetic flow meter operation is based on Faraday’s law, which simply states that a voltage is generated in any conductive liquid as the liquid moves through a magnetic field. This voltage is sensed by electrodes embedded in the sensor, and is transmitted to the meter. The voltage is proportional to the velocity of the conductive liquid (conductor). Electrodes are made of various materials (e.g. stainless steel) depending on the fluid characteristics in which they are applied, and can be easily fouled by floating materials, oil, and grease, thus requiring frequent cleaning. The key disadvantages of electromagnetic flow meters are the high cost when used in large pipe diameters, high operational costs and maintenance, and their complex installation.
Electromagnetic flow meters for wastewater applications range in size from 15 - 2200 mm with a claimed accuracy in the range of +/- 0.15% under ideal conditions.
The following points should be taken into consideration when choosing and installing electromagnetic flow meters:
The meter and transmitter should be located a minimum of 6m (20ft) from EMI (Electro-Magnetic-Interference) generating machinery;
The installation should be downstream of a pump, and upstream of control valves (100 hp or larger);
The meter and the transmitter should not be installed after a double change in plane (i.e. elbows, or a tee and an elbow).

Effluent Flow Measurement
Field Sampling Manual, 2013
337
3.4 Doppler Flow Meter A Doppler flow meter (a type of area-velocity meter) operates by emitting into the flow ultrasonic waves of known frequency and duration from a transmitter located either on the channel invert or on the outside of the conduit in the 3 or 9 o’clock position. Suspended particles and air bubbles in the flow reflect the emitted waves.
The sensor receives and detects the deflected frequencies, and processes them to determine the average velocity.
The frequencies are proportional to the velocity of the points in the liquid flow at which the reflection occurred. The measurement accuracy is a function of the percent sound reflectors (solids and bubbles), their sizes, distribution, and the flow meter design features. For the appropriate selection and installation of this type of flow meter the following points should be considered:
Sonic reflectors (i.e. suspended solids, etc.) representative of fluid velocity must be present in the liquid;
The pipe should have a uniform cross section without abrupt changes in direction for a minimum of 10 pipe diameters upstream and 5 diameters downstream;
Manufacturers’ minimum distance requirements should be met;
If transducers are to be mounted on the outside, the pipe material should allow the penetration of the ultrasonic signal.
3.5 Pressure Transducers Transducers are devices that produce an electrical signal proportional to some physical phenomenon (pressure, temperature, humidity, flow, etc.). The main element of the pressure transducer is the sensing element, consisting of a membrane (diaphragm) which is able to respond to the applied process pressure and static pressure. The diaphragm is deformed by the pressure differential applied on it, and the deflection is transmitted to a gauge or meter, either electrically or magnetically. The change in measured voltage flowing through the electric strain gauge is proportional to the pressure of the fluid on the diaphragm.
The diaphragm is usually made of stainless steel, copper or silicon. Stainless steel diaphragms are well suited for high pressures and have superior corrosion resistance. Silicone diaphragms have greater accuracy, but are limited to use with lower pressure transducers.

Effluent Flow Measurement
Field Sampling Manual, 2013
338
Pressure transducers can be classified as: • Absolute pressure transducers; measure pressure in relation to zero pressure
(a vacuum on one side of the diaphragm) (PSIA). • Differential transducers; measure pressure difference between two points
(PSID). • Gage pressure transducers; a form of differential pressure measurement,
which takes atmospheric pressure as a reference (PSIG).
3.5.1. Selection of Pressure Transducers The following are the main considerations in selecting pressure transducers:
• The pressure requirements of the system, which means the normal working pressures should be below the maximum used range of the transducer. (As a guideline, select a transducer with a range of 125% of the normal working pressure and refer to the pressure strain and force (OMEGA Technologies Company [9]);
• Compatibility of the transducer with the fluid; • The maximum system temperature should not exceed the stated
maximum operating temperature of the transducer; • Durability within the pressure environment. Commercially available pressure transducers are able to measure pressures in a range of 0-2000 PSIG in operating temperatures (-55 - +125C°) with an accuracy range of * 0.1 - 1.5% (OMEGA Technologies Company [9]).
3.6 Area Velocity The Area-Velocity method consists of measuring both cross-sectional area of a flow stream at a certain point, and the average velocity of the flow in that cross section. The Area-velocity method can be used either with open channel or closed channel flows. In addition to measuring flow under free conditions it can also be used to measure flow under submerged, full pipe, and surcharged flow conditions. This method does not require the installation of a weir or flume and it is used usually for temporary flow monitoring applications such as inflow and infiltration studies.
The flow rate is calculated by multiplying the area of the flow by its average velocity Q=AxV (Figure15). The Area-Velocity method requires two separate measurements, one to determine the flow depth and the other the average velocity of the section. This method can be implemented in two ways: 1) The depth and velocity are measured manually and used to determine the area and flow rates in a particular time. 2) An Area-Velocity flow meter used to measure the liquid level and velocity and automatically calculate the flow rate.
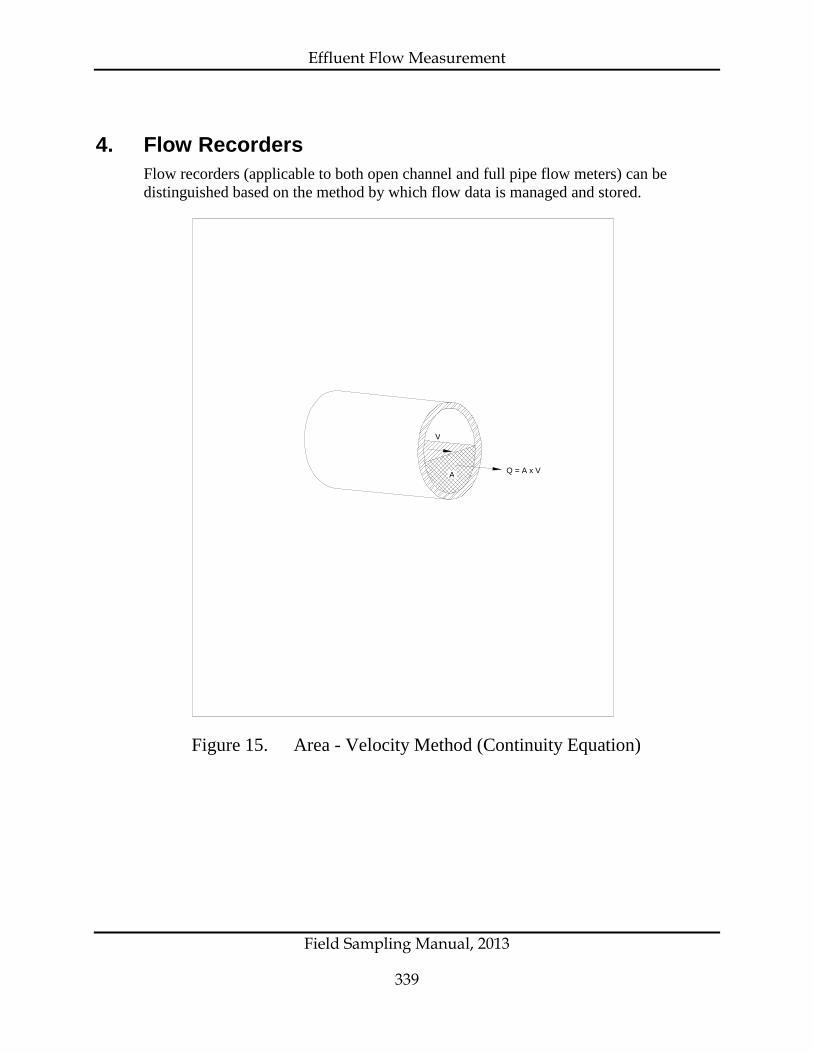
Effluent Flow Measurement
Field Sampling Manual, 2013
339
4. Flow Recorders Flow recorders (applicable to both open channel and full pipe flow meters) can be distinguished based on the method by which flow data is managed and stored.
Figure 15. Area - Velocity Method (Continuity Equation)
A
V
Q = A x V

Effluent Flow Measurement
Field Sampling Manual, 2013
340
4.1 Flow Transmitters Flow transmitters are used to calculate the flow based on secondary device level information and the primary device flow equation, and then transfer the flow data to other recording instruments, and computers. These devices also usually include a digital display, which can be set to display both flow and liquid level information. Flow transmitters usually output an analog signal (e.g. 4 to 20 mA), but may also produce a digital output (e.g. RS-232 serial output). Most data recorders and display devices will accept an analog signal, but this should be confirmed with the manufacturer. Many transmitters also incorporate limited data logging features.
4.2 Chart Recorders and Data Loggers Chart recorders offer immediate visual information, whereas data loggers usually allow the data to be stored in memory, and downloaded to a central computer for later data analysis.
Recorders and data loggers are used to record and store both analog and digital data by writing either an analog or digital trace, or actual numeric values, onto paper for a specific period of time. These devices can be programmed to take input directly from the secondary measuring device and convert the information to flow.
The resulting recording is a permanent analog and/or digital printout. Most of today’s recorders are able to record multiple variables such as pH, temperature, flow, velocity, etc. There are many types of recorders such as:
• Flatbed recorder; used where portability is a major factor (e.g. laboratory, field, etc.).
• Vertical recorder; used where permanent installation is required • (e.g. industrial applications). • X-Y recorder; used where two input signals need to be compared. • (e.g. recording temperature vs pressure instead of recording temperature vs
time). • Circular chart recorders; most often used in remote locations, computer rooms
for a permanent record over a long time of period, generally use wider chart paper (up to 250mm). Their key advantage lies in the ability to readily view the flow records to assist in operating tasks without having to analyze the recorded data. Charts are available to record for periods of 24 hours, 7 days, 30 days and 4 months.

Effluent Flow Measurement
Field Sampling Manual, 2013
341
Most of today’s recorders and data loggers use a 4-20 mA input circuit (industry standard) and can interface with other devices to record other parameters. Stored data can be downloaded to a computer through either a RS-232 serial port or via a standard or wireless modem. Depending on the type of input signal, recorders can have plug-in modules where the type of input signal can be changed by simply unplugging the old module and plugging in the new input module, or integrally selectable inputs where a selection of the desired input type for each channel in possible.
4.2.1 Charts vs Data Loggers The major difference between a data logger and a recorder is the way the data is recorded, stored and analyzed. In addition to a chart’s capability to offer immediate visual information, charts provide a continuous trend recording. Most recorders accept an input and compare it to the chart’s full scale value, which makes it easy to visually analyse the data (e.g. if the recorder has 1 volt full scale, then an input of 0.5 volts will move the recording pen to 0.5/1 or 50% of the distance across the recording width). Given that most small wastewater treatment plants do not have a central computer station; the use of a chart recorder is still considered one of the best approaches in assisting the operator in daily operations.
Most data loggers usually store the data in their own built in memory, to be retrieved at a later time for further data analysis.
To retrieve and analyse the stored data, other external and peripheral equipment are required such as a standard or wireless modem, central computer and a printer if a hard copy is needed.
4.2.2 Selection Criteria of Recorders and Data Loggers When choosing a recorder or a data logger the following should be taken into consideration:
• Determine the type or types of the input signals that need to be measured; • Determine how many inputs need to be fed to the device at one time, this will
determine the number of channels needed; • Determine the type of chart needed based on the period and accuracy of the
recording; • Determine the type of recorder and data logger based on factors such as
portability, permanent installation, application, data transfer, recording intervals, etc.

Effluent Flow Measurement
Field Sampling Manual, 2013
342
5. Sources of Further Information 1. Kirkpatrick, George A. and Shelley, Philip E. Sewer Flow Measurement – A State-of-
the Art Assessment. EPA Environmental Protection Technology Series, EPA-600/2-75-027, 1975.
2. Grant, Douglas M. and Dawson, Brian D. “ISCO”. Open Channel Flow Measurement Handbook, Fifth Edition.
3. Pratt, E.A. “Another Proportional-Flow Weir: Sutro Weir” Engineering News, Vol. 72 No. 9 (August 27,1914): 462-463.
4. Irwin, Lafayett K. “Proceedings of the Symposium on Flow Measurement in Open Channels and Closed Conduits.” Volume 1. Institute for Basic Standards, Washington.
5. MagneTek Controls. “Liquid Level Control and Gauging Systems”. 6. Milltronics Process Measurements. “Ultrasonic Transducers”. 7. Badger Meter. “Flow meters and Instrumentation”. Industrial Division. 8. Simon, Andrew L. and Korom, Scott F. “Hydraulics” (Fourth Edition). Prentice Hall. 9. OMEGA Technologies Company. “The pressure strain and force handbook”.
6. Revision History February 28, 2001: Re-publication. Figures enhanced by Bert Brazier. Appendix 1
added.
March 2000: NovaTec replaced figures since CAD format was not compatible with Ministry software.
1999: Draft manual prepared by NovaTec Consultants Inc. under contract to the Ministry (NovaTec Project 1231.14). Method vetted and approved by BCLQAAC.
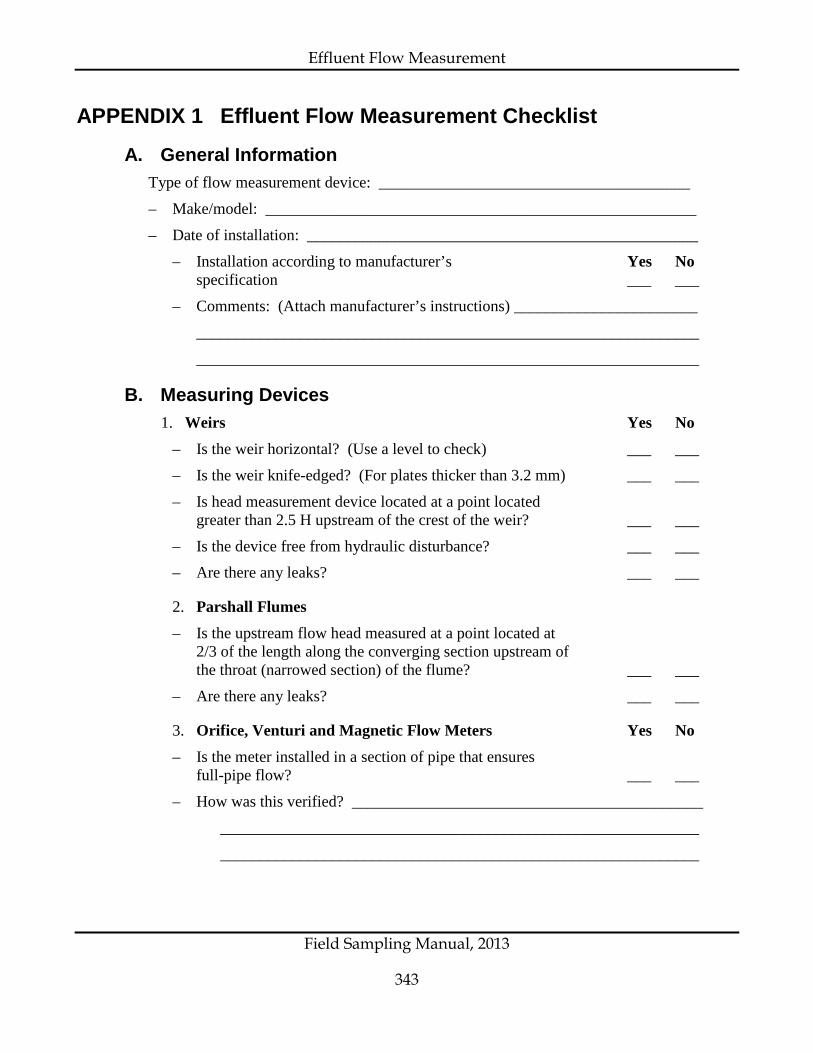
Effluent Flow Measurement
Field Sampling Manual, 2013
343
APPENDIX 1 Effluent Flow Measurement Checklist
A. General Information Type of flow measurement device: _______________________________________
– Make/model: ______________________________________________________
– Date of installation: _________________________________________________
– Installation according to manufacturer’s Yes No specification ___ ___
– Comments: (Attach manufacturer’s instructions) _______________________
_______________________________________________________________
_______________________________________________________________
B. Measuring Devices 1. Weirs Yes No
– Is the weir horizontal? (Use a level to check) ___ ___
– Is the weir knife-edged? (For plates thicker than 3.2 mm) ___ ___
– Is head measurement device located at a point located greater than 2.5 H upstream of the crest of the weir? ___ ___
– Is the device free from hydraulic disturbance? ___ ___ – Are there any leaks? ___ ___
2. Parshall Flumes
– Is the upstream flow head measured at a point located at 2/3 of the length along the converging section upstream of the throat (narrowed section) of the flume? ___ ___
– Are there any leaks? ___ ___
3. Orifice, Venturi and Magnetic Flow Meters Yes No
– Is the meter installed in a section of pipe that ensures full-pipe flow? ___ ___
– How was this verified? ____________________________________________
____________________________________________________________
____________________________________________________________

Effluent Flow Measurement
Field Sampling Manual, 2013
344
C. Maintenance Yes No
– Is the meter installed in a section of pipe that ensures full-pipe flow? ___ ___
– How was this verified? _____________________________________________
________________________________________________________________
________________________________________________________________
D. Calibration Frequency of calibration of measuring system: _____________________________ (Should be at least annually)
– Method of calibration: _____________________________________________ (Attach latest calibration calculations)
– Accuracy + _____ %
Yes No – Is recorder service required regularly? ___ ___
– Is gauge zeroed? ___ ___
– Comments: ______________________________________________________
________________________________________________________________
________________________________________________________________
Inspector: ___________________________________
Date: ___________________________________