basics of cost-volume-profit analysis cm is used first to cover fixed expenses. any remaining cm...
TRANSCRIPT

Basics of Cost-Volume-Profit Analysis
CM is used first to cover fixed expenses. Any remaining CM contributes to net operating income.
CM is used first to cover fixed expenses. Any remaining CM contributes to net operating income.
Sales (500 bicycles) 250,000$ Less: Variable expenses 150,000 Contribution margin 100,000 Less: Fixed expenses 80,000 Net operating income 20,000$
Racing Bicycle CompanyContribution Income Statement
For the Month of June
6-1
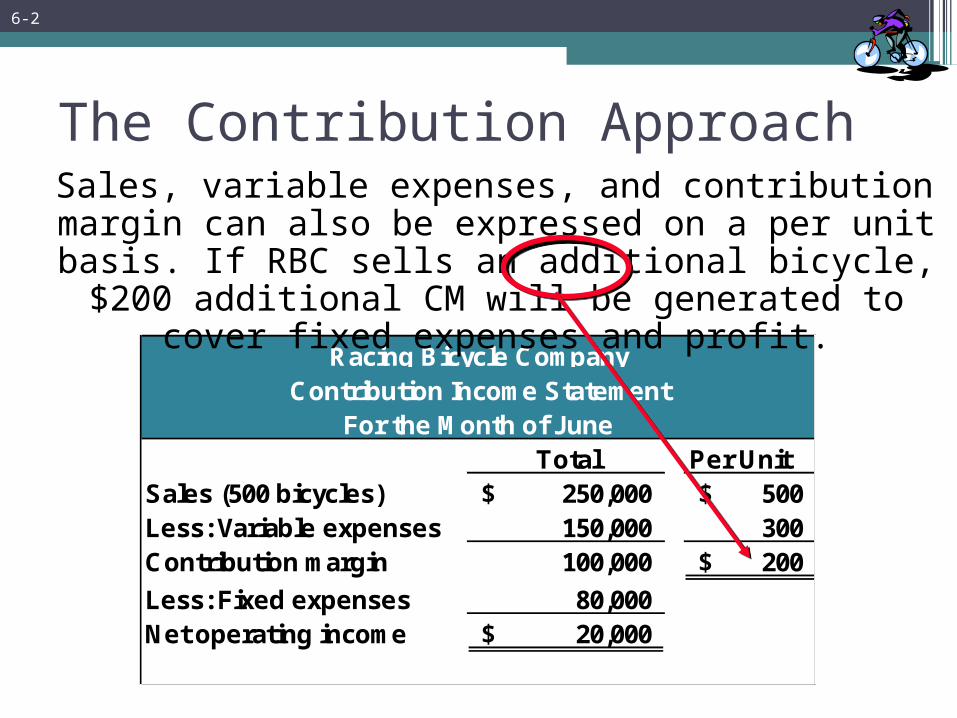
Total Per UnitSales (500 bicycles) 250,000$ 500$ Less: Variable expenses 150,000 300 Contribution margin 100,000 200$
Less: Fixed expenses 80,000 Net operating income 20,000$
Racing Bicycle CompanyContribution Income Statement
For the Month of June
The Contribution Approach Sales, variable expenses, and contribution margin
can also be expressed on a per unit basis. If RBC sells an additional bicycle, $200 additional CM will be generated to cover fixed expenses and profit.
6-2

CVP Relationships in Graphic Form
The relationships among revenue, cost, profit, and volume can be expressed graphically by preparing a
CVP graph. RBC developed contribution margin income statements at 0, 200, 400, and 600 units sold. We will
use this information to prepare the CVP graph.
0 200 400 600
Sales -$ 100,000$ 200,000$ 300,000$
Total variable expenses - 60,000 120,000 180,000
Contribution margin - 40,000 80,000 120,000
Fixed expenses 80,000 80,000 80,000 80,000
Net operating income (loss) (80,000)$ (40,000)$ -$ 40,000$
Units Sold
6-3

Preparing the CVP GraphBreak-even pointBreak-even point
(400 units or $200,000 in sales)(400 units or $200,000 in sales)Break-even pointBreak-even point
(400 units or $200,000 in sales)(400 units or $200,000 in sales)
Units
Do
llar
s
Loss AreaLoss Area
Profit AreaProfit Area
6-4

Contribution Margin Ratio (CM Ratio)
The contribution margin ratio at Racing Bicycle Company is:
The CM ratio can also be calculated by dividing the contribution margin per unit by
the selling price per unit.
The CM ratio can also be calculated by dividing the contribution margin per unit by
the selling price per unit.
CM per unitSP per unit
CM Ratio = = 40%$200$500
=
6-5

400 Units 500 UnitsSales 200,000$ 250,000$ Less: variable expenses 120,000 150,000 Contribution margin 80,000 100,000 Less: fixed expenses 80,000 80,000 Net operating income -$ 20,000$
400 Units 500 UnitsSales 200,000$ 250,000$ Less: variable expenses 120,000 150,000 Contribution margin 80,000 100,000 Less: fixed expenses 80,000 80,000 Net operating income -$ 20,000$
Contribution Margin Ratio (CM Ratio)
A $50,000 increase in sales revenue results in a $20,000 increase in CM. ($50,000 × 40% = $20,000)
A $50,000 increase in sales revenue results in a $20,000 increase in CM. ($50,000 × 40% = $20,000)
If RBC increases sales by $50,000, contributionmargin will increase by $20,000 ($50,000 × 40%).
Here is the proof:
6-6

Changes in Fixed Costs and Sales Volume
What is the profit impact if RBC can increase unit sales from 500 to 540
by increasing the monthly advertising budget by $10,000?
6-7
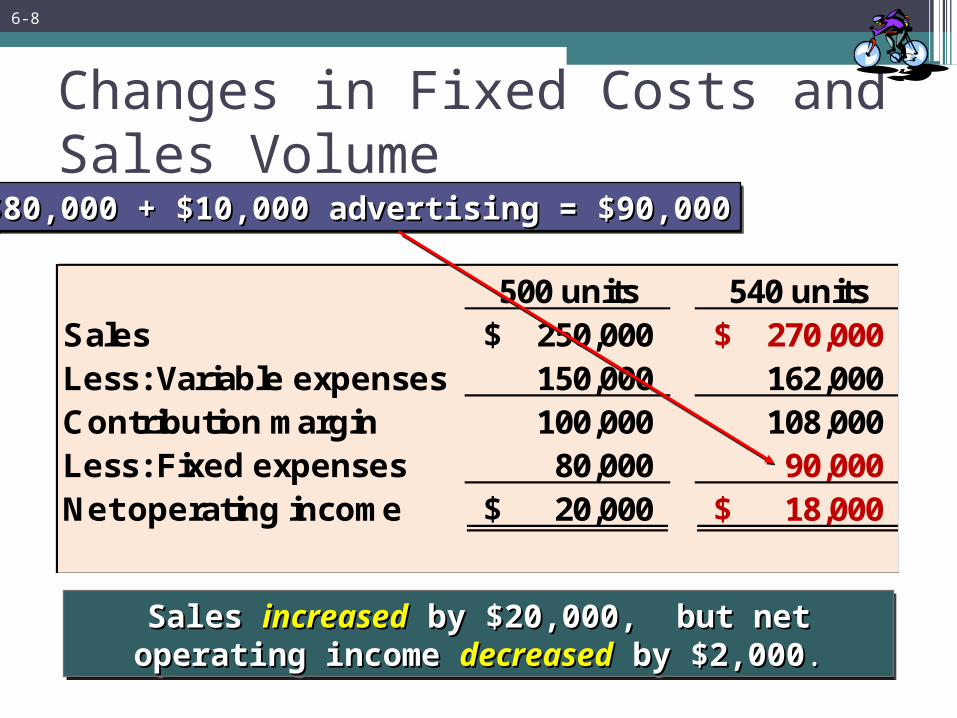
500 units 540 unitsSales 250,000$ 270,000$ Less: Variable expenses 150,000 162,000 Contribution margin 100,000 108,000 Less: Fixed expenses 80,000 90,000 Net operating income 20,000$ 18,000$
Changes in Fixed Costs and Sales Volume$80,000 + $10,000 advertising = $90,000$80,000 + $10,000 advertising = $90,000$80,000 + $10,000 advertising = $90,000$80,000 + $10,000 advertising = $90,000
Sales Sales increasedincreased by $20,000, but net operating by $20,000, but net operating income income decreaseddecreased by $2,000 by $2,000..
Sales Sales increasedincreased by $20,000, but net operating by $20,000, but net operating income income decreaseddecreased by $2,000 by $2,000..
6-8

Changes in Fixed Costs and Sales Volume
A shortcut solution using incremental analysis
Increase in CM (40 units X $200) 8,000$ Increase in advertising expenses 10,000 Decrease in net operating income (2,000)$
Increase in CM (40 units X $200) 8,000$ Increase in advertising expenses 10,000 Decrease in net operating income (2,000)$
6-9
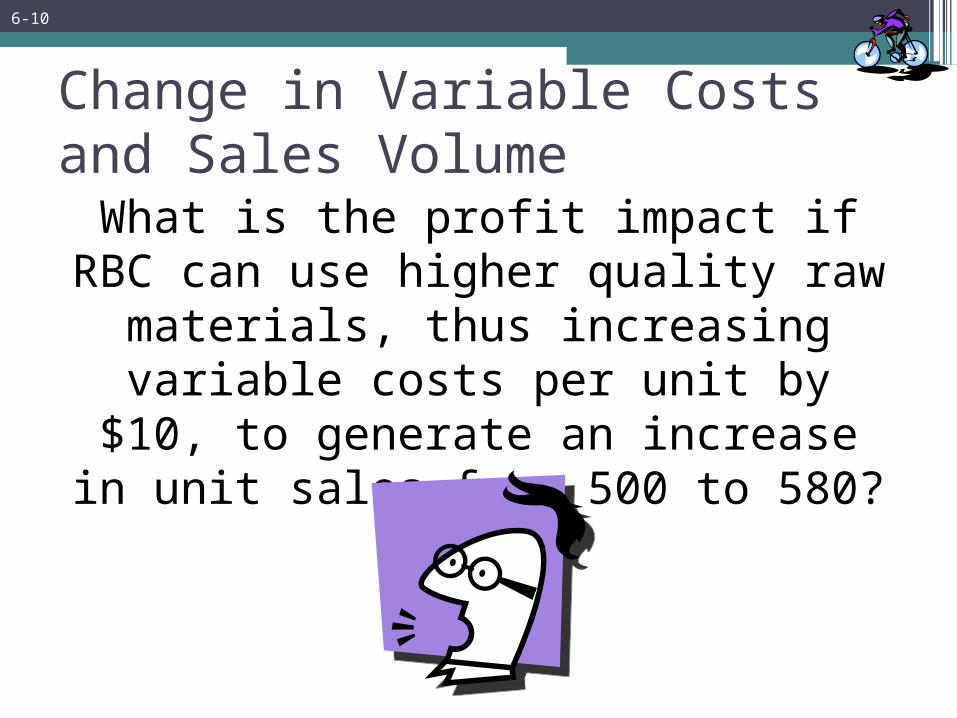
Change in Variable Costs and Sales VolumeWhat is the profit impact if RBC can use
higher quality raw materials, thus increasing variable costs per unit by $10,
to generate an increase in unit sales from 500 to 580?
6-10

500 units 580 unitsSales 250,000$ 290,000$ Less: Variable expenses 150,000 179,800 Contribution margin 100,000 110,200 Less: Fixed expenses 80,000 80,000 Net operating income 20,000$ 30,200$
Change in Variable Costs and Sales Volume
580 units 580 units ×× $310 variable cost/unit = $179,800 $310 variable cost/unit = $179,800580 units 580 units ×× $310 variable cost/unit = $179,800 $310 variable cost/unit = $179,800
Sales Sales increaseincrease by $40,000, and net operating income by $40,000, and net operating income increasesincreases by $10,200 by $10,200..
Sales Sales increaseincrease by $40,000, and net operating income by $40,000, and net operating income increasesincreases by $10,200 by $10,200..
6-11

Change in Variable Cost, Fixed Cost, and Sales VolumeWhat is the profit impact if RBC: (1) pays a $15 sales commission per bike sold instead
of paying salespersons flat salaries that currently total $6,000 per month, and (2)
increases unit sales from 500 to 575 bikes?
6-12

Change in Variable Cost, Fixed Cost, and Sales Volume
Sales Sales increaseincrease by $37,500, fixed expenses by $37,500, fixed expenses decreasedecrease by by $6,000$6,000. . Net operating income Net operating income increasesincreases by $12,375. by $12,375.
Sales Sales increaseincrease by $37,500, fixed expenses by $37,500, fixed expenses decreasedecrease by by $6,000$6,000. . Net operating income Net operating income increasesincreases by $12,375. by $12,375.
500 units 575 unitsSales 250,000$ 287,500$ Less: Variable expenses 150,000 181,125 Contribution margin 100,000 106,375 Less: Fixed expenses 80,000 74,000 Net operating income 20,000$ 32,375$
575 units 575 units ×× $315 = $181,125 $315 = $181,125575 units 575 units ×× $315 = $181,125 $315 = $181,125
6-13

Change in Regular Sales PriceIf RBC has an opportunity to sell 150
bikes to a wholesaler without disturbing sales to other customers or fixed
expenses, what price would it quote to the wholesaler if it wants to increase
monthly profits by $3,000?
6-14

Change in Regular Sales Price
3,000$ ÷ 150 bikes = 20$ per bikeVariable cost per bike = 300 per bikeSelling price required = 320$ per bike
3,000$ ÷ 150 bikes = 20$ per bikeVariable cost per bike = 300 per bikeSelling price required = 320$ per bike
150 bikes × $320 per bike = 48,000$ Total variable costs = 45,000 Increase in net operating income = 3,000$
150 bikes × $320 per bike = 48,000$ Total variable costs = 45,000 Increase in net operating income = 3,000$
6-15

Equation Method
Profits = (Sales – Variable expenses) – Fixed expenses
Sales = Variable expenses + Fixed expenses + Profits
OR
At the break-even point At the break-even point profits equal zeroprofits equal zero

Contribution Margin Method
The contribution margin methodhas two key equations.
The contribution margin methodhas two key equations.
Fixed expensesCM per unit
=Break-even point
in units sold
Fixed expenses CM ratio
=Break-even point intotal sales dollars

The Margin of Safety in Dollars
The margin of safety in dollars is the excess of budgeted (or actual) sales over
the break-even volume of sales.
Margin of safety in dollars = Total sales - Break-even salesMargin of safety in dollars = Total sales - Break-even sales
Let’s look at Racing Bicycle Company and determine the margin of safety.
6-18

The Margin of Safety in DollarsIf we assume that RBC has actual sales of $250,000, given that we have already determined the break-even sales to be $200,000, the
margin of safety is $50,000 as shown.
Break-even sales
400 unitsActual sales
500 unitsSales 200,000$ 250,000$ Less: variable expenses 120,000 150,000 Contribution margin 80,000 100,000 Less: fixed expenses 80,000 80,000 Net operating income -$ 20,000$
Break-even sales
400 unitsActual sales
500 unitsSales 200,000$ 250,000$ Less: variable expenses 120,000 150,000 Contribution margin 80,000 100,000 Less: fixed expenses 80,000 80,000 Net operating income -$ 20,000$
6-19
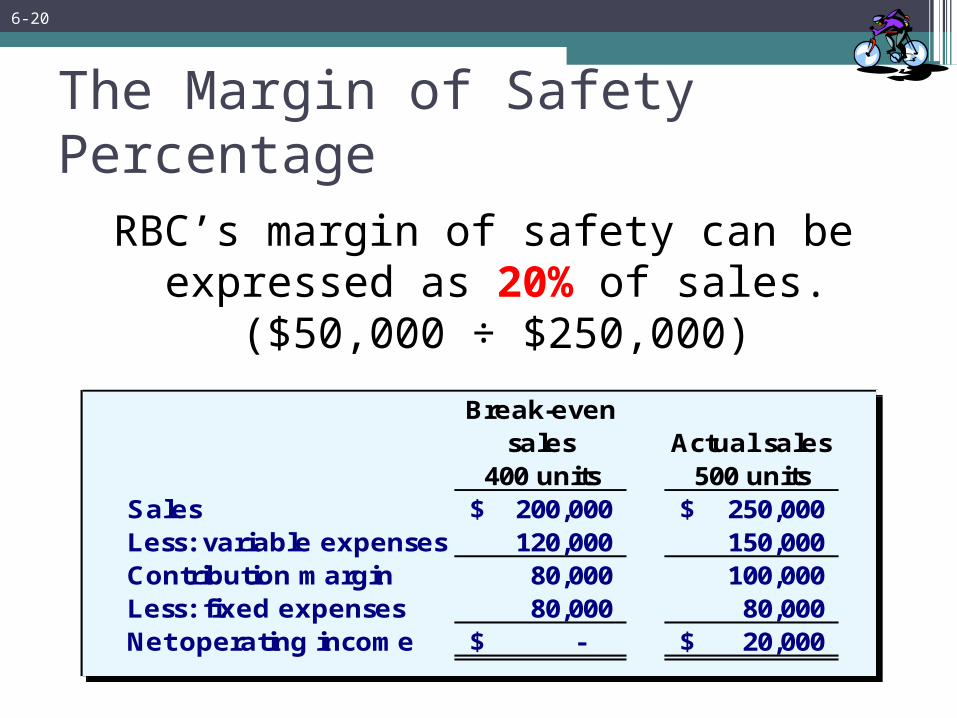
The Margin of Safety PercentageRBC’s margin of safety can be expressed as
20% of sales.($50,000 ÷ $250,000)
Break-even sales
400 unitsActual sales
500 unitsSales 200,000$ 250,000$ Less: variable expenses 120,000 150,000 Contribution margin 80,000 100,000 Less: fixed expenses 80,000 80,000 Net operating income -$ 20,000$
Break-even sales
400 unitsActual sales
500 unitsSales 200,000$ 250,000$ Less: variable expenses 120,000 150,000 Contribution margin 80,000 100,000 Less: fixed expenses 80,000 80,000 Net operating income -$ 20,000$
6-20

The Margin of Safety
The margin of safety can be expressed in terms of the number of units sold. The margin of safety at
RBC is $50,000, and each bike sells for $500; hence, RBC’s margin of safety is 100 bikes.
Margin ofSafety in units = = 100 bikes
$50,000$500
6-21

Cost Structure and Profit Stability
There are advantages and disadvantages to high fixed cost (or low variable cost) and low fixed cost (or high variable
cost) structures.
An advantage of a high fixedcost structure is that incomewill be higher in good years
compared to companieswith lower proportion of
fixed costs.
An advantage of a high fixedcost structure is that incomewill be higher in good years
compared to companieswith lower proportion of
fixed costs.
A disadvantage of a high fixedcost structure is that income
will be lower in bad yearscompared to companieswith lower proportion of
fixed costs.
A disadvantage of a high fixedcost structure is that income
will be lower in bad yearscompared to companieswith lower proportion of
fixed costs.
Companies with low fixed cost structures enjoy greater stability in income across good and bad years.
6-22

Operating Leverage
Operating leverage is a measure of how sensitive net operating income is to percentage changes in sales. It is a measure, at any given level of sales, of how a percentage change in sales volume will affect profits.
Contribution marginNet operating income
Degree ofoperating leverage =
6-23

Structuring Sales CommissionsPipeline Unlimited produces two types of surfboards, the XR7 and the Turbo. The XR7 sells for $100 and generates a contribution margin per unit of $25. The Turbo sells for $150 and earns a contribution margin
per unit of $18.
The sales force at Pipeline Unlimited is compensated based on sales commissions.
6-24
Structuring Sales Commissions
If you were on the sales force at Pipeline, you would push hard to sell the Turbo even though the XR7
earns a higher contribution margin per unit.
To eliminate this type of conflict, commissions can be based on contribution margin rather than on
selling price alone.
6-25

The Concept of Sales Mix•Sales mix is the relative proportion in which a
company’s products are sold.•Different products have different selling prices,
cost structures, and contribution margins.•When a company sells more than one product,
break-even analysis becomes more complex as the following example illustrates.
Let’s assume Racing Bicycle Company sells bikes and carts and that the sales mix between
the two products remains the same.
6-26

Key Assumptions of CVP Analysis Selling price is constant. Costs are linear and can be accurately divided
into variable (constant per unit) and fixed (constant in total) elements.
In multiproduct companies, the sales mix is constant.
In manufacturing companies, inventories do not change (units produced = units sold).
6-27