baselines for improving stem participation: ethnicity stem
TRANSCRIPT
Baselines for Improving STEM Participation: Executive summary 1
Baselines for Improving STEM
Participation:
Ethnicity STEM data for students and
academic staff in higher education
2007/08 to 2018/19
Will Joice and Andy Tetlow
15 October 2020
Conducted on behalf of the Royal Society

Ethnicity STEM data for students and academic staff in higher education 2007/08 to 2018/19 Executive summary 2
Contents Executive summary ...................................................................................................................................................... 4
Students .................................................................................................................................................................... 4
Staff ........................................................................................................................................................................... 5
Introduction ................................................................................................................................................................... 6
Student data .............................................................................................................................................................. 6
Staff data ................................................................................................................................................................... 7
Students ........................................................................................................................................................................ 8
Contextual overview .................................................................................................................................................. 8
Chart 1 Percentage of ethnic minority group UK domiciled entrants by level of study and STEM marker
2007/08 to 2018/19 ............................................................................................................................................... 8
Chart 2 Number of UK domiciled STEM entrants by level of study and ethnicity marker 2007/08 to 2018/19 .. 10
Chart 3 Percentage of UK domiciled STEM entrants within each ethnic group by level of study 2007/08 to
2018/19 ................................................................................................................................................................ 11
Chart 4 Proportion by sex for UK domiciled STEM entrants by level of study and ethnicity marker 2007/08 to
2018/19 ................................................................................................................................................................ 12
Chart 5 Percentage of UK domiciled STEM entrants that were aged 20 and under at first degree level and
aged 24 and under at postgraduate level on 31 August by level of study and ethnicity 2007/08 to 2018/19 .... 13
Chart 6 Percentage of UK domiciled ethnic minority group STEM entrants by level of study and Russell Group
marker 2007/08 to 2018/19 ................................................................................................................................. 14
Chart 7 Percentage of UK domiciled STEM entrants from low participation neighbourhoods by ethnicity and
level of study 2007/08 to 2018/19 ....................................................................................................................... 15
Chart 8 Percentage of UK domiciled ethnic minority group STEM entrants within each subject area by level of
study 2007/08 to 2018/19 .................................................................................................................................... 16
Outcomes data ........................................................................................................................................................ 17
Non-completion ....................................................................................................................................................... 17
Chart 9 Percentage of UK domiciled STEM students that left with no award by level of study, first year marker
and ethnicity marker 2007/08 to 2017/18 ............................................................................................................ 17
Chart 10 Percentage of UK domiciled STEM students that left with no award by level of study, POLAR 4 and
ethnicity marker 2007/08 to 2017/18 ................................................................................................................... 18
Chart 11 Percentage of UK domiciled STEM first degree students that left with no award by Russell Group
marker and ethnicity marker 2007/08 to 2017/18 ............................................................................................... 19
Chart 12 Percentage of UK domiciled STEM students that left with no award by ethnicity and level of study
2007/08 to 2017/18 ............................................................................................................................................. 20
Chart 13 Percentage of UK domiciled STEM first degree students that left with no award by ethnicity and sex
2007/08 to 2017/18 ............................................................................................................................................. 21
Class of first degree ................................................................................................................................................ 22
Chart 14 Percentage of UK domiciled STEM first degree qualifiers that achieved first class or upper second
class honours by ethnicity marker 2007/08 to 2018/19....................................................................................... 22
Chart 15 Percentage of UK domiciled STEM first degree qualifiers that achieved first or upper second class
honours by ethnicity and sex 2007/08 to 2018/19 .............................................................................................. 23
Chart 16 Percentage of UK domiciled STEM first degree qualifiers that achieved first class or upper second
class honours by ethnicity and age at 31 July 2007/08 to 2018/19 .................................................................... 24
Chart 17 Percentage of UK domiciled STEM first degree qualifiers that achieved first or upper second class
honours by ethnicity and POLAR4 marker 2007/08 to 2018/19 ......................................................................... 25
Chart 18 Percentage of UK domiciled STEM first degree qualifiers that achieved first class or upper second
class honours by ethnicity and Russell Group marker 2007/08 to 2018/19 ....................................................... 26

Ethnicity STEM data for students and academic staff in higher education 2007/08 to 2018/19 Executive summary 3
Chart 19 Proportion by class of first degree for UK domiciled STEM first degree qualifiers by ethnicity 2018/19
............................................................................................................................................................................. 27
Chart 20 Proportion by class of first degree for UK domiciled STEM first degree qualifiers by ethnicity and
Russell Group marker 2018/19 ........................................................................................................................... 27
Employment ............................................................................................................................................................ 28
Chart 21 Percentage of UK domiciled STEM leavers that were unemployed by level of qualification and
ethnicity marker 2011/12 to 2016/17 ................................................................................................................... 28
Chart 22 Percentage of UK domiciled STEM leavers that were unemployed by level of qualification and
ethnicity 2011/12 to 2016/17 ............................................................................................................................... 29
Staff ............................................................................................................................................................................. 30
Chart 23 Percentage of ethnic minority group academic staff by STEM marker 2007/08 to 2018/19 ............... 30
Chart 24 Percentage of STEM academic staff by ethnicity 2007/08 to 2018/19 ................................................ 31
Chart 25 Percentage of STEM academic staff by ethnicity within each age group 2007/08 to 2018/19............ 32
Chart 26 Percentage of ethnic minority group STEM academic staff by sex 2007/08 to 2018/19 ..................... 33
Chart 27 Percentage of ethnic minority group STEM academic staff by mode of employment 2007/08 to
2018/19 ................................................................................................................................................................ 34
Chart 28 Percentage of ethnic minority group STEM academic staff by Russell Group marker 2007/08 to
2018/19 ................................................................................................................................................................ 34
Chart 29 Percentage of ethnic minority group STEM academic staff by age 2007/08 to 2018/19 ..................... 35
Chart 30 Percentage of ethnic minority group STEM academic staff by current academic discipline 1 2012/13
to 2018/19 ............................................................................................................................................................ 36
Chart 31 Percentage of ethnic minority group STEM academic staff by academic employment function 2007/08
to 2018/19 ............................................................................................................................................................ 37
Chart 32 Percentage of ethnic minority group STEM academic staff by terms of employment 2007/08 to
2018/19 ................................................................................................................................................................ 38
Chart 33 Proportion of STEM academic staff within terms of employment by age and ethnicity marker 2018/19
............................................................................................................................................................................. 39
Chart 34 Percentage of ethnic minority group STEM academic staff by contract level 2012/13 to 2018/19 ..... 40
Chart 35 Percentage of STEM academic staff working at F1 Professor level by ethnicity 2018/19 .................. 41
Chart 36 Proportion of STEM academic staff within contract groups by sex and ethnicity 2018/19 .................. 42
Chart 37 Proportion of STEM academic staff within contract groups by ethnicity and age group 2018/19 ....... 43
Further research ......................................................................................................................................................... 44
Annex .......................................................................................................................................................................... 45
Annex 1 Percentage by ethnic group and age from the 2011 England and Wales census ............................... 45
Annex 2 Russell Group universities .................................................................................................................... 46
Annex 3 Ethnicity definition ................................................................................................................................. 46
Annex 4 Number and percentage of UK domiciled STEM entrants with known ethnicity by level of study,
ethnicity marker and ethnicity 2007/08 to 2018/19 ............................................................................................. 47
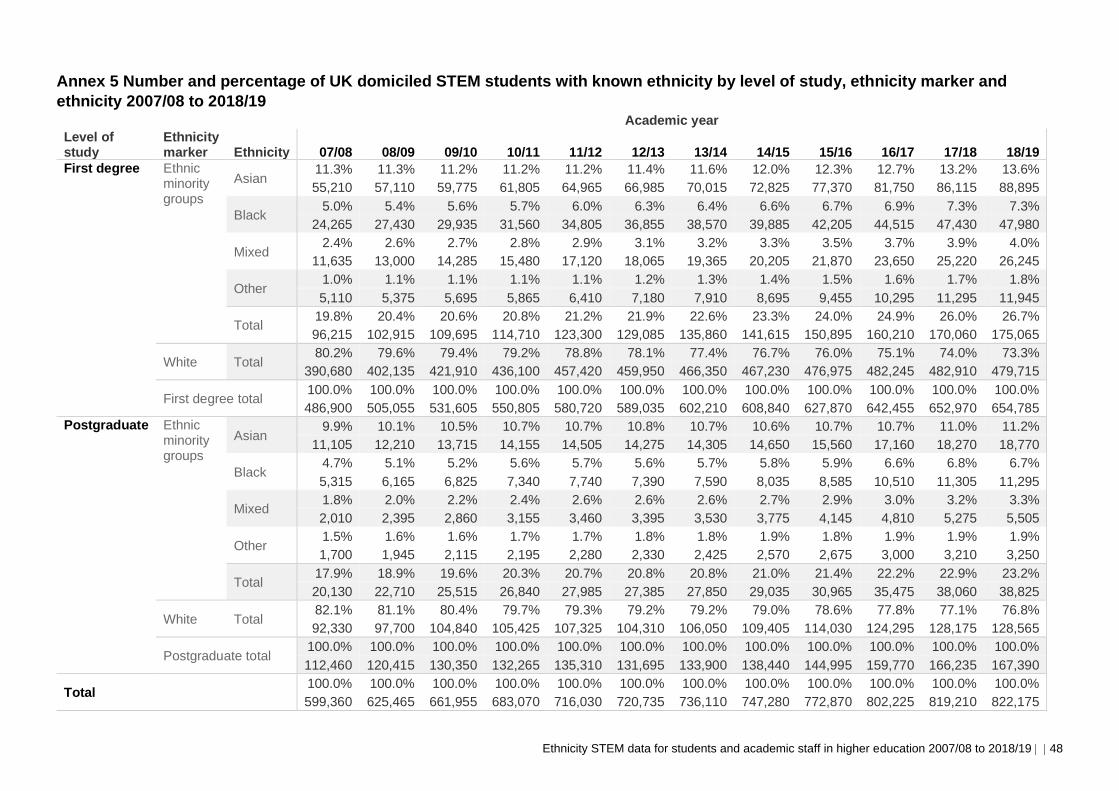
Annex 5 Number and percentage of UK domiciled STEM students with known ethnicity by level of study,
ethnicity marker and ethnicity 2007/08 to 2018/19 ............................................................................................. 48
Annex 6 Number and percentage of UK domiciled STEM qualifiers with known ethnicity by level of study,
ethnicity marker and ethnicity 2007/08 to 2018/19 ............................................................................................. 49
Annex 7 Number and percentage of UK domiciled STEM DLHE respondents with known ethnicity by level of
study, ethnicity marker and ethnicity 2011/12 to 2016/17 ................................................................................... 50
Annex 8 Number and percentage of STEM academic staff with known ethnicity by ethnicity marker and
ethnicity 2007/08 to 2018/19 ............................................................................................................................... 51

Ethnicity STEM data for students and academic staff in higher education 2007/08 to 2018/19 Executive summary 4
Executive summary
Students
Entrance rates
The percentage of ethnic minority group entrants is higher for students studying STEM subjects compared to non-
STEM subjects at both first degree and postgraduate level. The percentage of ethnic minority group STEM entrants
is rising year on year at both first degree and postgraduate level.
Postgraduate continuation
Ethnic minority group STEM students at first degree level are continuing into STEM postgraduate level study in
roughly the same proportion. There does not appear to be a sizable drop-off of ethnic minority group STEM
students continuing into postgraduate level STEM study.
Subject choice
There is large variation in the subject areas that ethnic minority group STEM entrants are choosing to study at first
degree and postgraduate level. In 2018/19 43.5 per cent of first degree entrants studying Medicine and dentistry
are from ethnic minority groups compared with 6.7 per cent studying Agriculture and related subjects.
Non-completion
The non-completion rate is higher for ethnic minority group STEM first degree students than for white STEM first
degree students. When you adjust for students domiciled from lowest geographical areas (POLAR4) in terms of
participation in higher education, there is very little difference in non-completion rates between ethnic minority
group STEM students and white STEM students at first degree level.
Black STEM first degree students have the highest non-completion rate of any ethnic group, and Black STEM male
first degree students have the highest non-completion rate when comparing ethnicity and sex.
Qualification
A lower percentage of ethnic minority group STEM qualifiers achieve first or upper second-class honours compared
to white STEM qualifiers. Black male STEM qualifiers achieve the lowest percentage when comparing ethnicity and
sex.
Employment
A higher percentage of ethnic minority group STEM leavers are unemployed six months after graduation compared
to white STEM leavers.

Ethnicity STEM data for students and academic staff in higher education 2007/08 to 2018/19 Executive summary 5
Staff
Subject areas
The percentage of ethnic minority groups academic staff is higher for staff working in STEM than non-STEM
subjects.
There is large variation in the subject areas that STEM ethnic minority group academic staff work in. In 2018/19
33.1 per cent of academic staff working in Engineering and technology are from ethnic minority groups vs 7.5 per
cent working in Veterinary science.
Age
The age group ‘34 and under’ has the highest percentage of ethnic minority group STEM academic staff. The
percentage decreases as age increases.
There is disparity between the percentage of STEM academic staff aged 34 and under by ethnic group. In 2018/19
19.2 per cent of STEM academic staff aged 34 and under are Asian compared to 1.8 per cent who are Black.
Unless this changes there will be unbalanced representation of STEM academic staff between ethnic groups
working in higher education in comparison to the ethnic breakdown of the general population.
Contract
STEM ethnic minority group academic staff are more likely to have a contract that is research only compared to
white academic staff. They are also more likely to be on a fixed term contract.
STEM ethnic minority group academic staff are less represented in more senior contract levels. They are less likely
to hold a senior position than white STEM staff. This holds true when taking age into account.
Black STEM academic staff are the least represented ethnic group working at professor level. 3.5 per cent of Black
STEM academic staff work at the professor level compared to 11.9 per cent of white STEM academic staff.
Progression to academic employment
In 2018/19 there are more than twice as many Asian STEM academic staff as there are Black, mixed and other
ethnicity STEM academic staff combined.
There appears to be a drop-off of Black and mixed ethnicity STEM postgraduate students entering STEM academic
employment at universities. Their representation in STEM academic employment is lower than at postgraduate
level suggesting a lower proportion enter STEM academic employment compared to Asian and other ethnicity.
Ethnicity STEM data for students and academic staff in higher education 2007/08 to 2018/19 Introduction 6
Introduction This report contains analysis on UK domiciled students, graduates and leavers studying Science, Technology,
Engineering and Mathematics (STEM) subjects1, and academic staff2 working in STEM at UK higher education
providers from 2007/08 to 2018/19. Data is sourced from the HESA Student and Staff records.
It analyses contextual and outcomes data comparing those who are from ethnic minority groups (Black, Asian,
other and mixed) with those who are white. It also provides further analysis broken down by ethnic group3.
The report uses descriptive statistics to compare cohorts and not all differences have been statistically validated. It
is important to understand that observed differences between ethnic minority group and white cohorts may be
caused by other underlying factors such as socio-economic background, achievement prior to starting higher
education, student age etc. Further statistical analysis is recommended to identify the underlying factors influencing
the differences observed between cohorts.
Student data
The student data is restricted to UK domiciled first degree and postgraduate students. The analysis focusses on
students studying STEM subjects, but comparison with students studying non-STEM subjects is included for
context. It includes time series comparisons based on ethnic minority groups marker, ethnicity, sex, level of study,
low participation neighbourhoods (POLAR 4), Russell Group and other universities, subject area, class of first
degree, non-completion and activity after graduation.
• ‘Entrants’ refers to first year students only. This is used for time series analysis to avoid double counting of
students.
• ‘Students’ refers to students irrespective of which year of study they are participating in. This is normally used
when looking at a single year of data or non-completion time series analysis.
• ‘Qualifiers’ refers to those graduates who achieved a qualification whilst at university.
• ‘Leavers’ refers to those graduates who completed the Destination of Leavers from Higher Education survey
after graduation.
• Ethnicity data is only mandatory for UK domiciled students, so data is restricted to these students. See Annex 3
for a breakdown of ethnicity.
• UK domiciled refers to those students who were living in the UK three months before they commenced their
studies. All student data in the report is restricted to UK domiciled students.
• Those students whose ethnicity is unknown are excluded from the analysis.
• Analysis is restricted to first degree and postgraduate students. Other undergraduate students have not been
included.
• All numbers are rounded to the nearest 5. Percentages are based on unrounded figures to 1.d.p. Percentage
point differences between figures are calculated based on unrounded percentages. All percentages are based
on a denominator of 22.5 or more.
• In 2018/19 data for Falmouth University, London South Bank University and the University of Worcester is not
included as they did not opt-in to Category 3 Permitted Purpose.
• For additional context, cohort sizes can be viewed in Annex 4, Annex 5, Annex 6 and Annex 7.
1 Students studying Medicine & dentistry; Subjects allied to medicine; Biological sciences; Veterinary science; Agriculture & related subjects;
Physical sciences; Mathematical sciences; Computer science; Engineering & technology; Architecture, building & planning. 2 Those staff with an academic contract that is either research only, teaching only, both teaching and research, or neither teaching nor research. 3 Black, Asian, Mixed and Other.
Ethnicity STEM data for students and academic staff in higher education 2007/08 to 2018/19 Introduction 7
Staff data
The staff data is restricted to academic staff. The analysis is focussed on staff working in STEM subjects, but
comparison with staff working in non-STEM subjects is included for context. It includes time series comparisons
based on ethnic minority group markers, ethnicity, sex, mode of employment, Russell Group and other universities,
age, subject area, academic employment function, contract level and terms of employment.
• From 2007/08 to 2011/12 data was collected on what academic subject the member of staff studied. Each
member of staff could have up to 2 subjects. From 2012/13 onwards data was collected on their current
academic discipline. Each member of staff could have up to two subjects from 2012/13 to 2013/14, and three
subjects from 2014/15 onwards.
• Each member of staff has been assigned to the working in STEM category if their first academic discipline or
current academic discipline is a STEM subject. Further analysis was carried out to determine whether including
academic discipline 2, and current academic disciplines 2 and 3 affected the analysis. It did not, so for
simplicity and ease of reporting it was restricted to the first discipline returned in the data.
• Analysis is restricted to academic staff and excludes atypical staff4.
• Those academic staff whose ethnicity is unknown are excluded from the analysis.
• All numbers are rounded to the nearest 5. Percentages are based on unrounded figures to 1.d.p. Percentage
point differences between figures are calculated based on unrounded percentages. All percentages are based
on a denominator of 22.5 or more.
• In 2018/19 data for Falmouth University, London South Bank University and the University of Worcester is not
included as they did not opt-in to Category 3 Permitted Purpose.
• For additional context, cohort sizes can be viewed in Annex 8.
4 Atypical staff are those members of staff whose contracts involve working arrangements that are not permanent, involve complex employment relationships and/or involve work away from the supervision of the normal work provider.

Ethnicity STEM data for students and academic staff in higher education 2007/08 to 2018/19 Students 8
Students
Contextual overview
STEM subjects attract a higher percentage of ethnic minority group entrants than non-STEM subjects at both first
degree and postgraduate level.
The overall trend shows an increase in representation of ethnic minority group entrants over the past 12 years of
data for both STEM and non-STEM subjects.
Ethnic minority group STEM first degree entrants are continuing into postgraduate study. Although the percentage
of ethnic minority group entrants appears lower at postgraduate level, there is normally a three to four year time lag
from when a first degree student starts their study and when they could potentially start postgraduate study.
In 2015/16 25.5 per cent (53,395) of STEM first degree entrants are from ethnic minority groups. The first year this
cohort could typically start postgraduate study would be 2018/19, where 24.3 per cent (22,395) of STEM
postgraduate entrants are from ethnic minority groups. Although there are other factors to consider, this suggests
STEM ethnic minority group first degree students continue to postgraduate level study at roughly the same
proportion. There does not appear to be a sizable drop-off.
Chart 1 Percentage of ethnic minority group UK domiciled entrants by level of study and
STEM marker 2007/08 to 2018/19

Ethnicity STEM data for students and academic staff in higher education 2007/08 to 2018/19 Students 9
From the 2011 England and Wales census data5, 18.5 per cent of people aged 18-24 were from ethnic minority
groups (see Annex 1), yet in 2011/12, 24.4 per cent of STEM first degree entrants domiciled from England and
Wales aged 18 to 24 were from ethnic minority groups. The participation ratio of these representation percentages
is 1.32.
In 2017/18 a fair comparison would be those aged 10-17 from the census data in 2011 (to take into account the
age they would be in 2017/18), where 18.8 per cent were from ethnic minority groups. This compares with 31.1 per
cent (48,970) of ethnic minority group STEM first degree entrants from England and Wales aged 18-24 in 2017/18.
This gives a participation ratio of 1.70 which is a notable increase from 2011/12.
White STEM first degree entrants from England and Wales aged 18-24 compared to the general white population
in England and Wales of a similar age is 0.84 in 2017/18 compared with 0.93 in 2011/12.6
This shows that representation of ethnic minority group students from England and Wales studying STEM subjects
in higher education is high and has grown since 2011/12. A higher percentage of ethnic minority group young
adults are choosing to enter higher education in comparison with white young adults.
A similar trend may be observed for Scotland and Northern Ireland, but their census data was not analysed. Please
note that apart from the census analysis, the rest of the report does include data on students domiciled from
Scotland and Northern Ireland (unless noted otherwise).
5 https://www.ethnicity-facts-figures.service.gov.uk/uk-population-by-ethnicity/demographics/age-groups/latest 6 A value of 1 would show percentage of a particular cohort in the HESA student record is the same as the percentage of that cohort in the
general population. A value above 1 shows higher representation in comparison to the general population and a value below 1 shows lower representation.

Ethnicity STEM data for students and academic staff in higher education 2007/08 to 2018/19 Students 10
Much of the growth in entrants since 2013/14 at first degree level in STEM subjects can be attributed to the
increase in ethnic minority group entrants. Between 2013/14 and 2018/19 white first degree entrants have
increased by just 1.1 per cent (1,745), including a decrease of 0.6 per cent between 2017/18 and 2018/197. Ethnic
minority group entrants have increased year on year since 2013/14 with a 27.9 per cent (13,005) increase during
this period.
In 2011/12 the forthcoming raising of tuitions fees saw many entrants choosing not to defer entry in order to avoid
the higher tuition fees that came into effect in 2012/138. This helps explain the increase in 2011/12 and the
decrease in 2012/13.
At postgraduate level there has been steady growth of ethnic minority group and white entrants across most years.
The introduction of postgraduate student loans in 2016/17 appears to have had a positive influence on numbers
initially9. However, this growth has slowed more recently.
From 2015/16 to 2016/17 ethnic minority group STEM postgraduate entrants increased by 21.5 per cent (3,675) vs
13.0 per cent (7,800) of white STEM postgraduate entrants, whereas in the previous year the increase was 11.9
per cent (1,820) and 6.5 per cent (3,665) respectively. The numbers have plateaued in 2018/19, with a slight
increase in ethnic minority group entrants (1.0 per cent, 230) and a slight decrease (0.0 per cent, 20) in white
entrants7.
Chart 2 Number of UK domiciled STEM entrants by level of study and ethnicity marker
2007/08 to 2018/19
7 Please note that data for three universities has not been included for 2018/19 and this will have an impact on the figures. Please see the student introduction for more detail. 8 https://www.gov.uk/government/statistics/participation-rates-in-higher-education-2006-to-2013 9 https://www.officeforstudents.org.uk/data-and-analysis/the-effect-of-postgraduate-loans/

Ethnicity STEM data for students and academic staff in higher education 2007/08 to 2018/19 Students 11
Chart 3 shows the percentage of STEM entrants broken down by ethnic group. It shows that all ethnic groups have
seen an increase since 2007/08 as a percentage of all students at both levels of study. For comparison Annex 1
shows the percentage broken down by ethnic group and age from the 2011 England and Wales census10.
At postgraduate level there is a large increase (in relation to other ethnic groups) in the percentage of Black STEM
entrants between 2015/16 and 2016/17 (6.4 per cent, 4,920 to 7.5 per cent, 6,650). Black STEM entrants increased
by 35.1 per cent (1,725) over this period. This trend is also observed in non-STEM subjects where Black
postgraduate entrants increased by 47.3 per cent (2,905) from 2015/16 to 2016/17. The introduction of student
loans in 2016/17 may have contributed to this increase11.
However, since 2016/17 the number of Black STEM entrants has decreased by 2.0 per cent (135) at postgraduate
level (the same trend is seen for non-STEM subjects).
Chart 3 Percentage of UK domiciled STEM entrants within each ethnic group by level of
study 2007/08 to 2018/19
10 Please note that data included in this chart and all other student charts (unless noted otherwise) containsdata for all students domiciled from the UK, not just England and Wales. Please compare with caution as census data from Scotland and Northern Ireland may differ. 11 https://www.officeforstudents.org.uk/data-and-analysis/the-effect-of-postgraduate-loans/

Ethnicity STEM data for students and academic staff in higher education 2007/08 to 2018/19 Students 12
Overall, the proportion of female STEM entrants at first degree level has increased from 49.8 per cent (83,045) in
2007/08 to 52.3 per cent (113,095) in 2018/19. The corresponding figures for female STEM postgraduate entrants
show an increase from 54.3 per cent (30,160) in 2007/08 to 61.4 per cent (58,010) in 2018/19.
Chart 4 shows the proportion of ethnic minority group STEM female entrants is increasing for both first degree and
postgraduate entrants, and ethnic minority group STEM female entrants outnumber ethnic minority group STEM
male entrants at both levels of study in 2018/19. This contrasts with 2007/08 when ethnic minority group STEM
female entrants were in the minority at both levels of study.
Postgraduate level has seen the biggest increase with the proportion of ethnic minority group STEM female
entrants increasing by 11.2 percentage points between 2007/08 and 2018/19.
The increase in the proportion of female STEM entrants has naturally led to a decline in the proportion of male
STEM entrants. However, it is important to note that Nursing is the largest principal subject within STEM at both
first degree and postgraduate level, and it is dominated by female entrants. In 2018/19 there were 46,375 entrants
studying Nursing (14.9 per cent out of a total cohort of 310,615) at both levels of study, and 87.7 per cent (40,655)
were female.
Chart 4 Proportion by sex for UK domiciled STEM entrants by level of study and ethnicity
marker 2007/08 to 2018/1912
12 Due to extremely small numbers, those entrants with a sex classified as ‘Other’ are included in the percentage calculations, but not shown.
Ethnicity STEM data for students and academic staff in higher education 2007/08 to 2018/19 Students 13
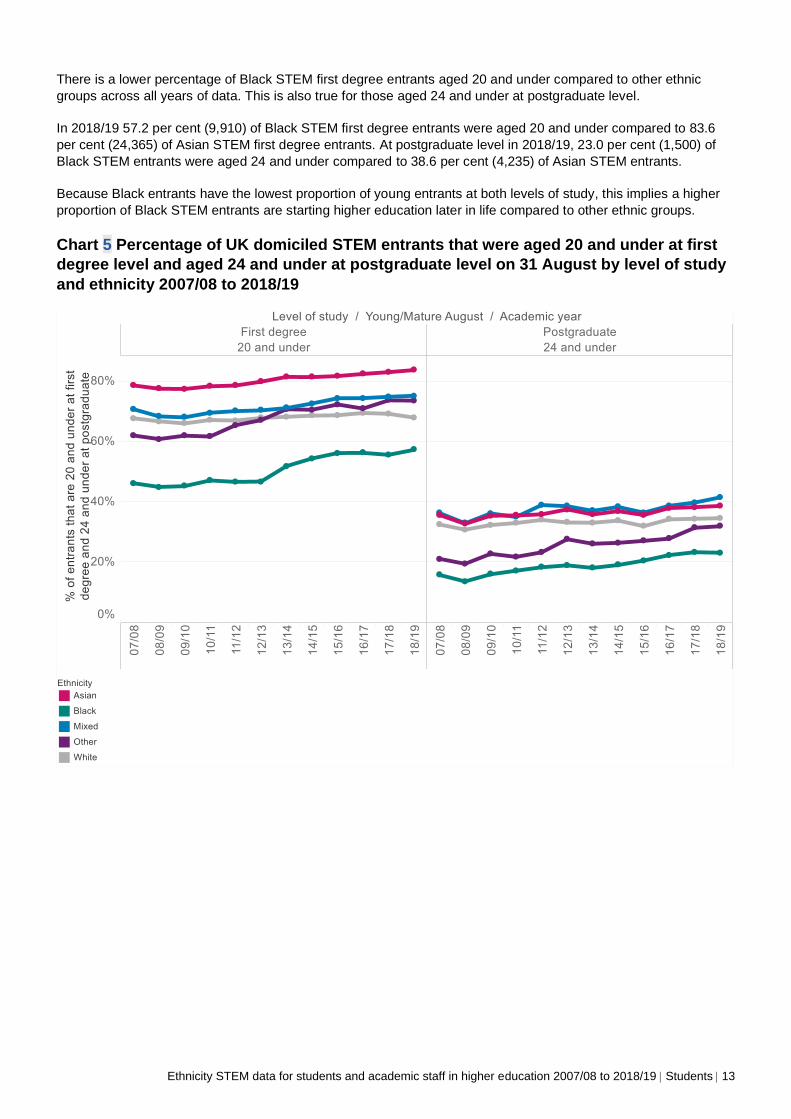
There is a lower percentage of Black STEM first degree entrants aged 20 and under compared to other ethnic
groups across all years of data. This is also true for those aged 24 and under at postgraduate level.
In 2018/19 57.2 per cent (9,910) of Black STEM first degree entrants were aged 20 and under compared to 83.6
per cent (24,365) of Asian STEM first degree entrants. At postgraduate level in 2018/19, 23.0 per cent (1,500) of
Black STEM entrants were aged 24 and under compared to 38.6 per cent (4,235) of Asian STEM entrants.
Because Black entrants have the lowest proportion of young entrants at both levels of study, this implies a higher
proportion of Black STEM entrants are starting higher education later in life compared to other ethnic groups.
Chart 5 Percentage of UK domiciled STEM entrants that were aged 20 and under at first
degree level and aged 24 and under at postgraduate level on 31 August by level of study
and ethnicity 2007/08 to 2018/19
Ethnicity STEM data for students and academic staff in higher education 2007/08 to 2018/19 Students 14
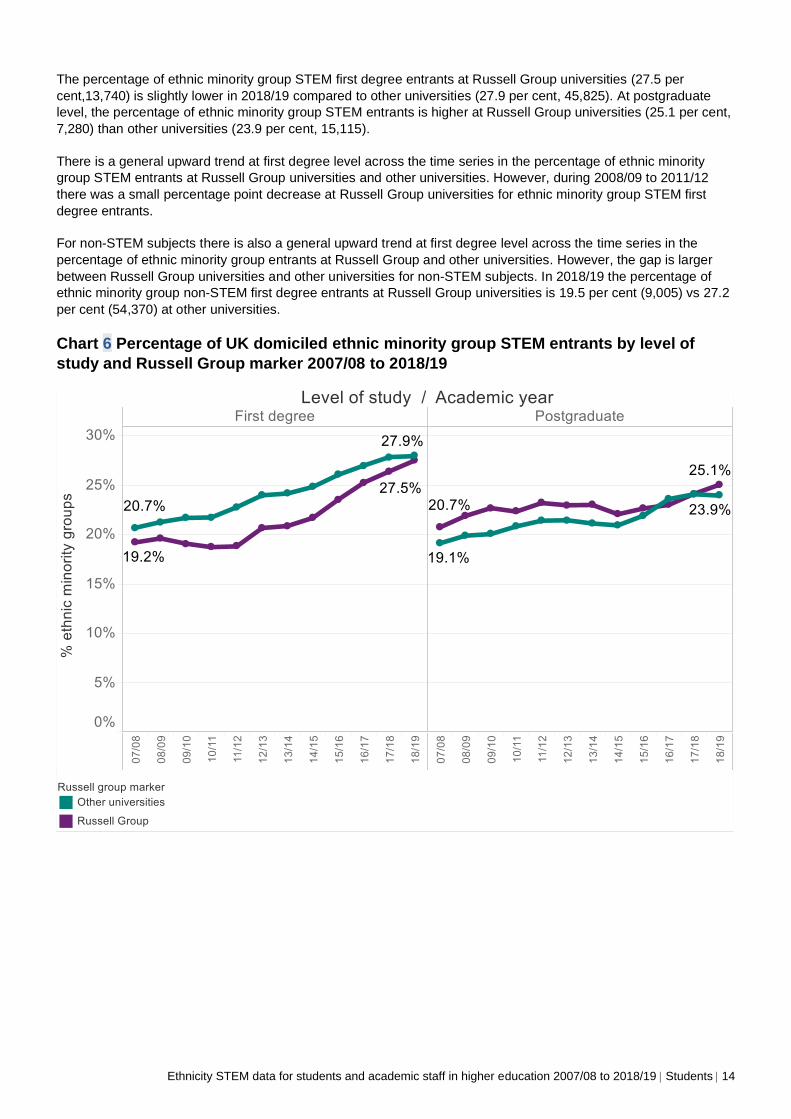
The percentage of ethnic minority group STEM first degree entrants at Russell Group universities (27.5 per
cent,13,740) is slightly lower in 2018/19 compared to other universities (27.9 per cent, 45,825). At postgraduate
level, the percentage of ethnic minority group STEM entrants is higher at Russell Group universities (25.1 per cent,
7,280) than other universities (23.9 per cent, 15,115).
There is a general upward trend at first degree level across the time series in the percentage of ethnic minority
group STEM entrants at Russell Group universities and other universities. However, during 2008/09 to 2011/12
there was a small percentage point decrease at Russell Group universities for ethnic minority group STEM first
degree entrants.
For non-STEM subjects there is also a general upward trend at first degree level across the time series in the
percentage of ethnic minority group entrants at Russell Group and other universities. However, the gap is larger
between Russell Group universities and other universities for non-STEM subjects. In 2018/19 the percentage of
ethnic minority group non-STEM first degree entrants at Russell Group universities is 19.5 per cent (9,005) vs 27.2
per cent (54,370) at other universities.
Chart 6 Percentage of UK domiciled ethnic minority group STEM entrants by level of
study and Russell Group marker 2007/08 to 2018/19

Ethnicity STEM data for students and academic staff in higher education 2007/08 to 2018/19 Students 15
POLAR 4 is a measure of participation rates of young people in higher education by local areas based on the
student’s domicile postcode. Low participation neighbourhood shows data for students from the lowest areas in
terms of participation in higher education.
POLAR4 data shows that overall, 12.2 per cent (7,185) of ethnic minority group STEM first degree entrants were
from low participation neighbourhoods in 2018/19 vs 14.2 per cent (20,700) of white STEM entrants.
Chart 7 shows a higher percentage of white STEM entrants at both first degree and postgraduate level come from
a low participation neighbourhood in 2018/19 compared to Asian, mixed and other ethnicities. This is also true for
non-STEM subjects at postgraduate level. However, at first degree level for non-STEM subjects, a higher
percentage of white non-STEM entrants come from a low participation neighbourhood in 2018/19 compared to all
other ethnic groups.
Broken down by ethnicity, Chart 7 shows that first degree Black STEM entrants have the highest percentage from
low participation neighbourhoods (17.9 per cent, 3,080) in 2018/19. This has risen by 6.6 percentage points since
2007/08, the biggest rise of any ethnic group over this period. This also holds true for non-STEM subjects although
the increase is only 3.1 percentage points, rising from 9.7 per cent in 2007/08 to 12.8 per cent in 2018/19.
At postgraduate level Black STEM entrants also have the highest percentage from low participation
neighbourhoods in 2018/19 (16.6 per cent, 1,065). This trend is also observed for non-STEM subjects.
It is important to understand that the low participation neighbourhood marker is determined by the student’s
postcode of domicile. For the majority at first degree level this is likely to be their parent/guardian’s home address.
Whilst at postgraduate level this may still be the case, they are more likely than first degree entrants to be living in
different accommodation before they commence postgraduate level study. It therefore may not be as accurate in
measuring students from low participation neighbourhoods at postgraduate level.
Chart 7 Percentage of UK domiciled STEM entrants from low participation
neighbourhoods by ethnicity and level of study 2007/08 to 2018/1915
15 Excludes students domiciled from Northern Ireland and those with an unknown POLAR 4 quintile.
Ethnicity STEM data for students and academic staff in higher education 2007/08 to 2018/19 Students 16
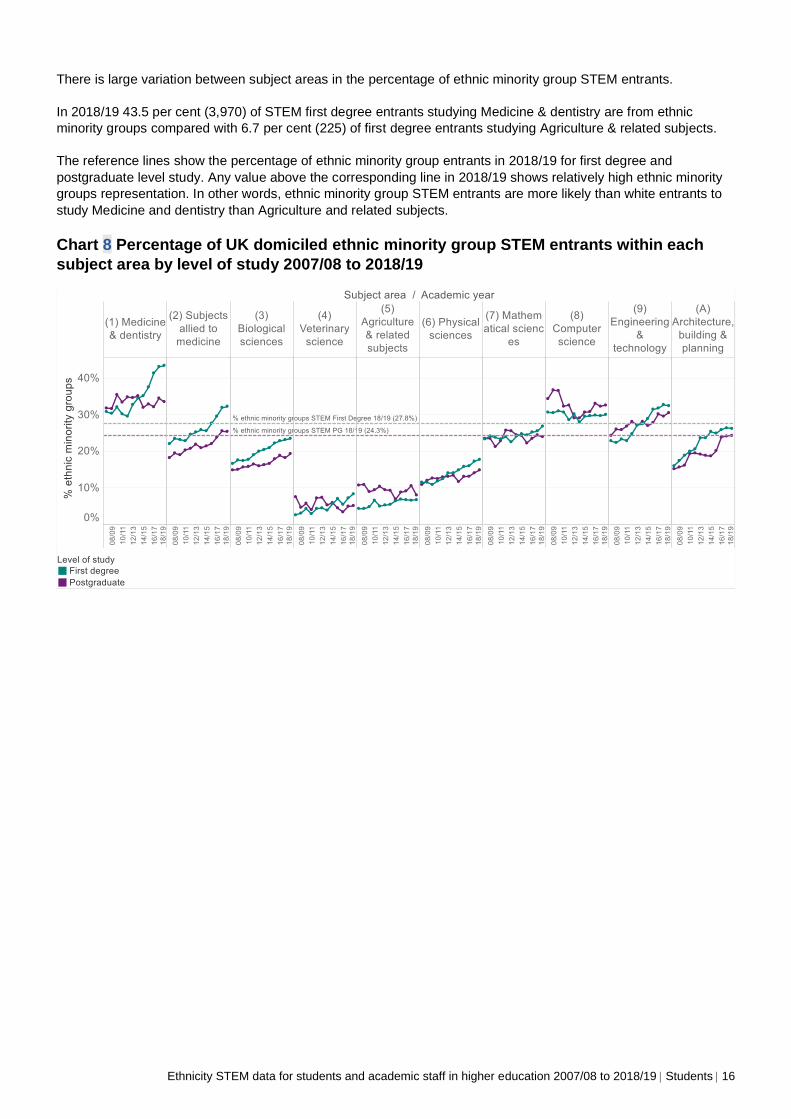
There is large variation between subject areas in the percentage of ethnic minority group STEM entrants.
In 2018/19 43.5 per cent (3,970) of STEM first degree entrants studying Medicine & dentistry are from ethnic
minority groups compared with 6.7 per cent (225) of first degree entrants studying Agriculture & related subjects.
The reference lines show the percentage of ethnic minority group entrants in 2018/19 for first degree and
postgraduate level study. Any value above the corresponding line in 2018/19 shows relatively high ethnic minority
groups representation. In other words, ethnic minority group STEM entrants are more likely than white entrants to
study Medicine and dentistry than Agriculture and related subjects.
Chart 8 Percentage of UK domiciled ethnic minority group STEM entrants within each
subject area by level of study 2007/08 to 2018/19
Ethnicity STEM data for students and academic staff in higher education 2007/08 to 2018/19 Students 17
Outcomes data
Non-completion
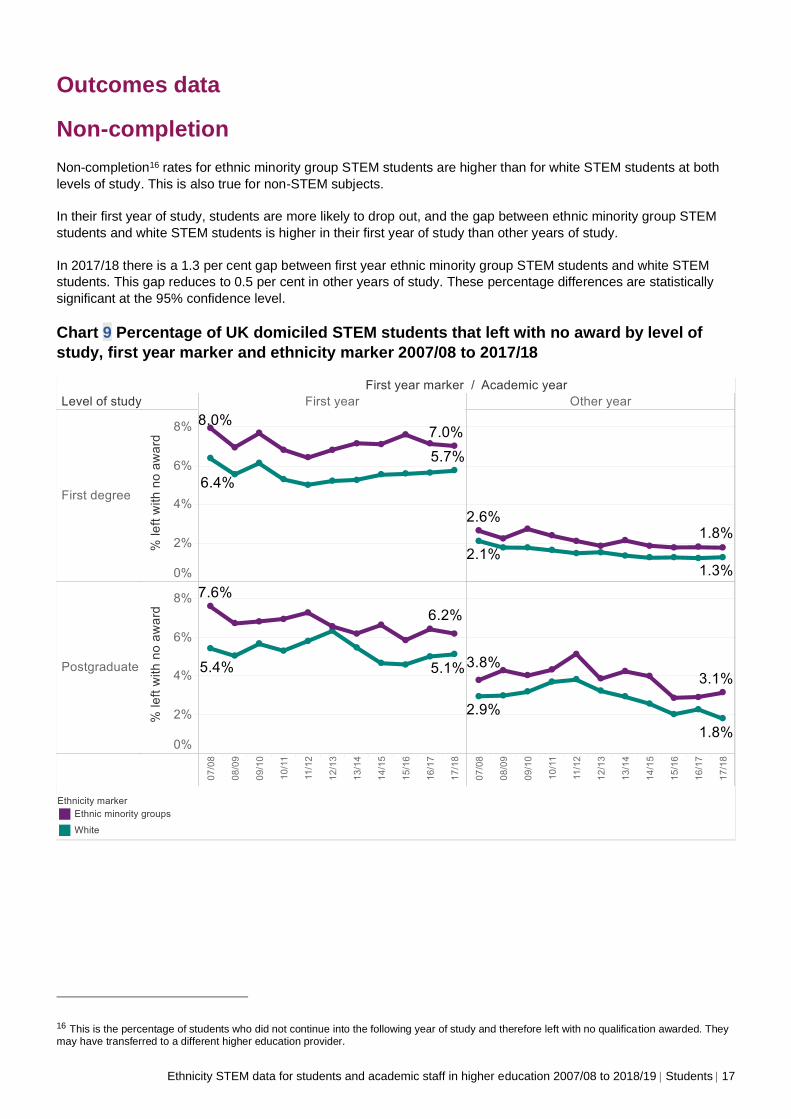
Non-completion16 rates for ethnic minority group STEM students are higher than for white STEM students at both
levels of study. This is also true for non-STEM subjects.
In their first year of study, students are more likely to drop out, and the gap between ethnic minority group STEM
students and white STEM students is higher in their first year of study than other years of study.
In 2017/18 there is a 1.3 per cent gap between first year ethnic minority group STEM students and white STEM
students. This gap reduces to 0.5 per cent in other years of study. These percentage differences are statistically
significant at the 95% confidence level.
Chart 9 Percentage of UK domiciled STEM students that left with no award by level of
study, first year marker and ethnicity marker 2007/08 to 2017/18
16 This is the percentage of students who did not continue into the following year of study and therefore left with no qualification awarded. They may have transferred to a different higher education provider.

Ethnicity STEM data for students and academic staff in higher education 2007/08 to 2018/19 Students 18
Whilst the non-completion rates are higher overall for STEM students from a low participation neighbourhood
compared to other neighbourhoods, there is very little difference between ethnic minority group STEM and white
STEM first degree students from a low participation neighbourhood. This similarity is also observed when analysing
first year and other years of study.
Although the trend is similar for non-STEM subjects, with ethnic minority group students from low participation
neighbourhoods having higher non-completion rates, the gap between ethnic minority group and white students in
2017/18 is higher (0.7 per cent for non-STEM vs 0.1 per cent for STEM).
Although POLAR 4 is not in itself a measure of socio-economic disadvantage17, the data suggests that being
domiciled from a low participation neighbourhood may be linked to non-completion rates at first degree level.
Further statistical analysis would help determine the extent, along with examining other possible factors which
influence non-completion rates.
Chart 10 Percentage of UK domiciled STEM students that left with no award by level of
study, POLAR 4 and ethnicity marker 2007/08 to 2017/1818
17 https://www.officeforstudents.org.uk/media/3f1479d3-d144-4adb-b3c7-a6df6f996b27/polar-and-tundra-faqs-september-2019.pdf 18 Excludes students domiciled from Northern Ireland and those with an unknown POLAR 4 quintile.

Ethnicity STEM data for students and academic staff in higher education 2007/08 to 2018/19 Students 19
Non-completion rates are lower for first degree and postgraduate STEM students studying at Russell Group
universities compared to other universities. This is also observed for non-STEM subjects.
At first degree level there continues to be very small differences in the non-completion rates between ethnic
minority group STEM students and white STEM students at Russell Group universities (0.2 per cent in 2017/18). At
other universities at first degree level, non-completion rates continue to differ (1.2 per cent in 2017/18). This
similarity is also observed when analysing first year and other years of study.
At postgraduate level there are differences in the non-completion rates between ethnic minority group STEM
students and white STEM students, and this is observed at both Russell Group universities and other universities.
Chart 11 Percentage of UK domiciled STEM first degree students that left with no award
by Russell Group marker and ethnicity marker 2007/08 to 2017/18

Ethnicity STEM data for students and academic staff in higher education 2007/08 to 2018/19 Students 20
Black STEM students have the highest non-completion rates in 2017/18 at both first degree and postgraduate
level. 4.7 per cent (2,230) of Black STEM first degree students, and 6.3 per cent (610) of Black STEM postgraduate
students did not complete their studies. This trend is also observed for non-STEM subjects.
This compares with 2.9 per cent (2,540) of Asian STEM first degree and 4.4 per cent (620) of Asian STEM
postgraduate students, and 2.7 per cent (13,030) of white STEM first degree and 3.8 per cent (3,515) of white
STEM postgraduate students.
Non-completion rates increased in 2016/17 for STEM postgraduate students for all cohorts except mixed ethnicity
students. This trend has not continued in 2017/18 as non-completion rates for Black, other and white ethnicities
show a decline in 2017/18.
Chart 12 Percentage of UK domiciled STEM students that left with no award by ethnicity
and level of study 2007/08 to 2017/18

Ethnicity STEM data for students and academic staff in higher education 2007/08 to 2018/19 Students 21
Non-completion rates are higher for STEM first degree male students compared to STEM first degree female
students. This is also true for non-STEM subjects.
Non-completion rates are also higher for STEM postgraduate male students compared to STEM postgraduate
female students, but the gap is smaller.
In 2017/18 10.9 per cent (840) of Black STEM male first year first degree students did not complete their studies
compared to 6.7 per cent (5,025) of white STEM male first year students.
In 2017/18 the gap between males and females is also highest for Black STEM first year students (4.7 per cent)
compared to other STEM ethnic groups (Asian - 3.9 per cent, mixed - 2.5 per cent, other - 4.5 per cent and white -
1.9 per cent).
Chart 13 Percentage of UK domiciled STEM first degree students that left with no award
by ethnicity and sex 2007/08 to 2017/1819
19 Due to extremely small numbers, those students with a sex classified as ‘Other’ are not shown.

Ethnicity STEM data for students and academic staff in higher education 2007/08 to 2018/19 Students 22
Class of first degree
Ethnic minority group STEM first degree qualifiers achieve a lower percentage of ‘good honours’ in comparison
with white STEM first degree qualifiers.
In 2018/19 69.5 per cent (23,555) of ethnic minority group STEM first degree qualifiers achieved ‘good honours’
compared to 80.4 per cent (84,220) of white STEM first degree qualifiers. The gap has narrowed from 16.2 per cent
in 2007/08 to 10.9 per cent in 2018/19. These percentage differences are statistically significant at the 95%
confidence level. A similar trend is observed for non-STEM subjects, yet the gap is wider (15.3 per cent in
2018/19).
However, the gap between STEM ethnic minority group and white first degree qualifiers achieving ‘good honours’
has increased from 10.3% in 2017/18 to 10.9% in 2018/19. This is caused by the rate of growth in the percentage
achieving ‘good honours’ from 2017/18 to 2018/19 being lower for ethnic minority group STEM qualifiers than white
STEM qualifiers.
When analysing the data by sex, ethnic minority group and white female STEM first degree qualifiers achieve a
higher percentage of ‘good honours’ than ethnic minority group and white male STEM first degree qualifiers. This is
consistent across all years of data.
The year on year increase across both cohorts reflects the trend across the sector of an increasing percentage of
qualifiers achieving ‘good honours’.
Chart 14 Percentage of UK domiciled STEM first degree qualifiers that achieved first
class or upper second class honours by ethnicity marker 2007/08 to 2018/19

Ethnicity STEM data for students and academic staff in higher education 2007/08 to 2018/19 Students 23
The data shows that Black STEM male first degree qualifiers achieve the lowest percentage of ‘good honours’
compared with other ethnicities, and this has consistently been the case across all years of data. In 2018/19 55.9
per cent (2,020) of Black STEM male first degree qualifiers achieved ‘good honours’ compared with 78.0 per cent
(38,350) of white STEM male first degree qualifiers.
Although STEM females outperform STEM males, Black STEM female first degree qualifiers (despite increases in
recent years) achieved lower in 2018/19 (64.0 per cent - 3,470) than STEM male first degree qualifiers from all
other ethnic backgrounds.
These trends are also observed for non-STEM subjects, although the difference between females and males is
smaller.
Chart 15 Percentage of UK domiciled STEM first degree qualifiers that achieved first or
upper second class honours by ethnicity and sex 2007/08 to 2018/1920
20 Due to extremely small numbers, those qualifiers with a sex classified as ‘Other’ are not shown.

Ethnicity STEM data for students and academic staff in higher education 2007/08 to 2018/19 Students 24
Chart 16 shows that STEM first degree qualifiers aged 25 and over across all ethnic groups achieve a lower
percentage of ‘good honours’ compared to STEM first degree qualifiers aged 24 and under. This trend is also
observed for non-STEM subjects.
In 2018/19 the widest gap between STEM first degree qualifiers aged 24 and under and 25 and over is for Asian
qualifiers where the gap is 15.5 per cent. This compares with 6.5 per cent for Black STEM first degree qualifiers,
11.0 per cent for mixed ethnicity STEM qualifiers, 14.2 per cent for other ethnic background STEM qualifiers, and
5.4 per cent for white STEM qualifiers.
In 2018/19 74.3 per cent (11,395) of Asian STEM qualifiers aged 24 and under achieve good honours compared
with 58.9 per cent (1,315) of Asian STEM qualifiers aged 25 and over.
Given that older STEM qualifiers are less likely to achieve ‘good honours’, we would expect a reduction in the
percentage achieving ‘good honours’ for those ethnic groups with a higher proportion of older students (see Chart 5
for context). However, this will not be the only factor affecting the likelihood of achieving ‘good honours’.
Chart 16 Percentage of UK domiciled STEM first degree qualifiers that achieved first
class or upper second class honours by ethnicity and age at 31 July 2007/08 to 2018/19

Ethnicity STEM data for students and academic staff in higher education 2007/08 to 2018/19 Students 25
When taking into account those first degree qualifiers from the lowest areas in terms of participation in higher
education, a lower percentage of Black first degree STEM qualifiers achieve ‘good honours’ in comparison to other
ethnic groups.
58.2 per cent (870) of Black STEM qualifiers from low participation neighbourhoods achieve ‘good honours’
compared to 74.3 per cent (9,195) of white STEM qualifiers from low participation neighbourhoods.
It is important to note that the low participation neighbourhood represents the lowest 20 per cent in terms of the
participation rate in higher education. Qualifiers from other ethnic groups will not be distributed evenly across the
other four (higher participation) quintiles. This may help explain the gap size (or lack of) for particular ethnic groups
between achievement of low and other neighbourhood participation qualifiers.
Chart 17 Percentage of UK domiciled STEM first degree qualifiers that achieved first or
upper second class honours by ethnicity and POLAR4 marker 2007/08 to 2018/1921
21 Excludes students domiciled from Northern Ireland and those with an unknown POLAR 4 quintile.

Ethnicity STEM data for students and academic staff in higher education 2007/08 to 2018/19 Students 26
The percentage of Black STEM first degree qualifiers achieving ‘good honours’ has decreased since 2016/17 at
Russell Group universities, reducing from 74.7 percent (710) in 2016/17 to 72.8 per cent (875) in 2018/19. This
contrasts with non-STEM subjects, where the figure has increased from 72.2 per cent (660) in 2016/17 to 78.2 per
cent (815) in 2018/19.
Despite this decrease, the gap between the percentage of Black and white STEM first degree qualifiers achieving
‘good honours’ remains lower at Russell Group universities compared to other universities. The gap between these
two cohorts at Russell Group universities is 14.8 per cent vs 18.6 per cent at other universities in 2018/19 (from
14.0 and 19.9 in 2017/18). These percentage differences are statistically significant at the 95% confidence level.
This trend is also observed for non-STEM subjects.
Chart 18 Percentage of UK domiciled STEM first degree qualifiers that achieved first
class or upper second class honours by ethnicity and Russell Group marker 2007/08 to
2018/19

Ethnicity STEM data for students and academic staff in higher education 2007/08 to 2018/19 Students 27
Chart 19 shows the breakdown by class of first degree and ethnicity. It shows there is small variation (3.8 per cent)
between ethnic groups of STEM qualifiers achieving upper second class honours. 45.8 per cent (2,360) of mixed
ethnicity STEM qualifiers achieved upper second class honours compared with 42.0 (895) per cent of other
ethnicity STEM qualifiers.
The largest variation by ethnic group is for those achieving first class honours, where the gap is 17.8 percentage
points between Black and white STEM qualifiers. This percentage difference is statistically significant at the 95%
confidence level. Around 1 in 3 white STEM qualifiers achieve first class honours compared with around 1 in 6
Black STEM qualifiers. Chart 20 shows further breakdown by Russell Group and other universities. The overall
pattern remains the same.
Chart 19 Proportion by class of first degree for UK domiciled STEM first degree qualifiers
by ethnicity 2018/19
Chart 20 Proportion by class of first degree for UK domiciled STEM first degree qualifiers
by ethnicity and Russell Group marker 2018/19
Ethnicity STEM data for students and academic staff in higher education 2007/08 to 2018/19 Students 28
Employment
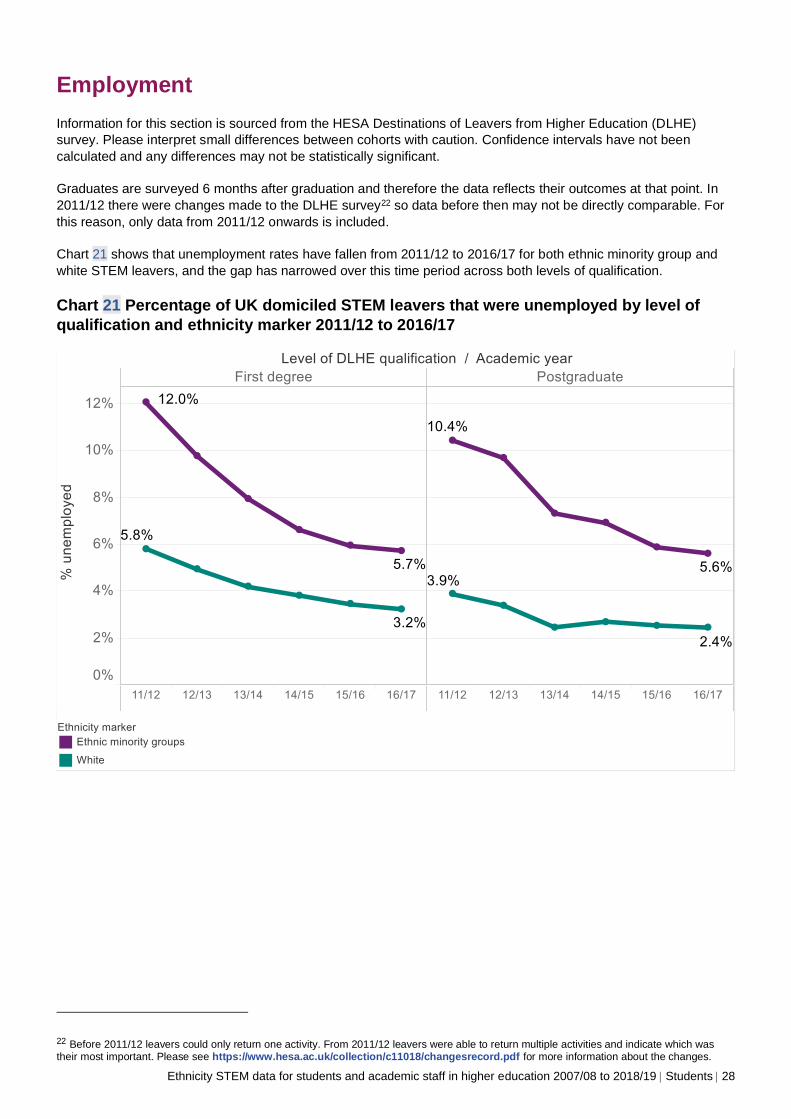
Information for this section is sourced from the HESA Destinations of Leavers from Higher Education (DLHE)
survey. Please interpret small differences between cohorts with caution. Confidence intervals have not been
calculated and any differences may not be statistically significant.
Graduates are surveyed 6 months after graduation and therefore the data reflects their outcomes at that point. In
2011/12 there were changes made to the DLHE survey22 so data before then may not be directly comparable. For
this reason, only data from 2011/12 onwards is included.
Chart 21 shows that unemployment rates have fallen from 2011/12 to 2016/17 for both ethnic minority group and
white STEM leavers, and the gap has narrowed over this time period across both levels of qualification.
Chart 21 Percentage of UK domiciled STEM leavers that were unemployed by level of
qualification and ethnicity marker 2011/12 to 2016/17
22 Before 2011/12 leavers could only return one activity. From 2011/12 leavers were able to return multiple activities and indicate which was their most important. Please see https://www.hesa.ac.uk/collection/c11018/changesrecord.pdf for more information about the changes.

Ethnicity STEM data for students and academic staff in higher education 2007/08 to 2018/19 Students 29
Chart 22 shows the percentage of STEM leavers that were unemployed broken down by ethnicity. The percentage
of Black STEM first degree unemployed leavers has dropped from 14.7 per cent (660) in 2011/12 to 5.2 per cent
(360) in 2016/17.
Chart 22 Percentage of UK domiciled STEM leavers that were unemployed by level of
qualification and ethnicity 2011/12 to 2016/17
Analysing the percentage in professional employment23 after graduation in 2016/17 shows there is no difference
between ethnic minority group STEM leavers (82.0 per cent, 15,490) and white STEM leaver (81.9 per cent,
57,045) at first degree level. At postgraduate level, 92.3 per cent (4,920) of ethnic minority group STEM leavers in
2016/17 are in professional employment compared with 94.1 (20,525) percent of white STEM leavers24.
23 ‘Professional employment’ means jobs coded 1, 2, or 3 in the Standard Occupational Classification (SOC) 2010. 24 Please interpret small differences between cohorts with caution. Confidence intervals have not been calculated and any differences may not be statistically significant.
Ethnicity STEM data for students and academic staff in higher education 2007/08 to 2018/19 Staff 30
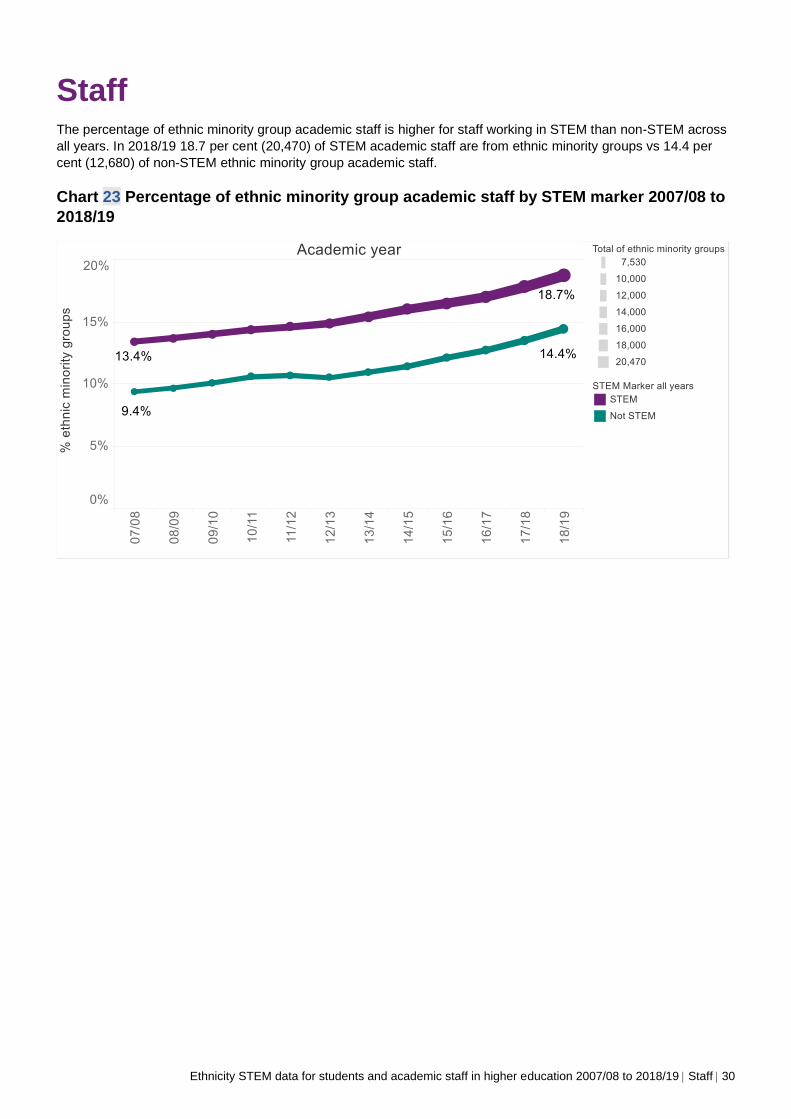
Staff The percentage of ethnic minority group academic staff is higher for staff working in STEM than non-STEM across
all years. In 2018/19 18.7 per cent (20,470) of STEM academic staff are from ethnic minority groups vs 14.4 per
cent (12,680) of non-STEM ethnic minority group academic staff.
Chart 23 Percentage of ethnic minority group academic staff by STEM marker 2007/08 to
2018/19
Ethnicity STEM data for students and academic staff in higher education 2007/08 to 2018/19 Staff 31
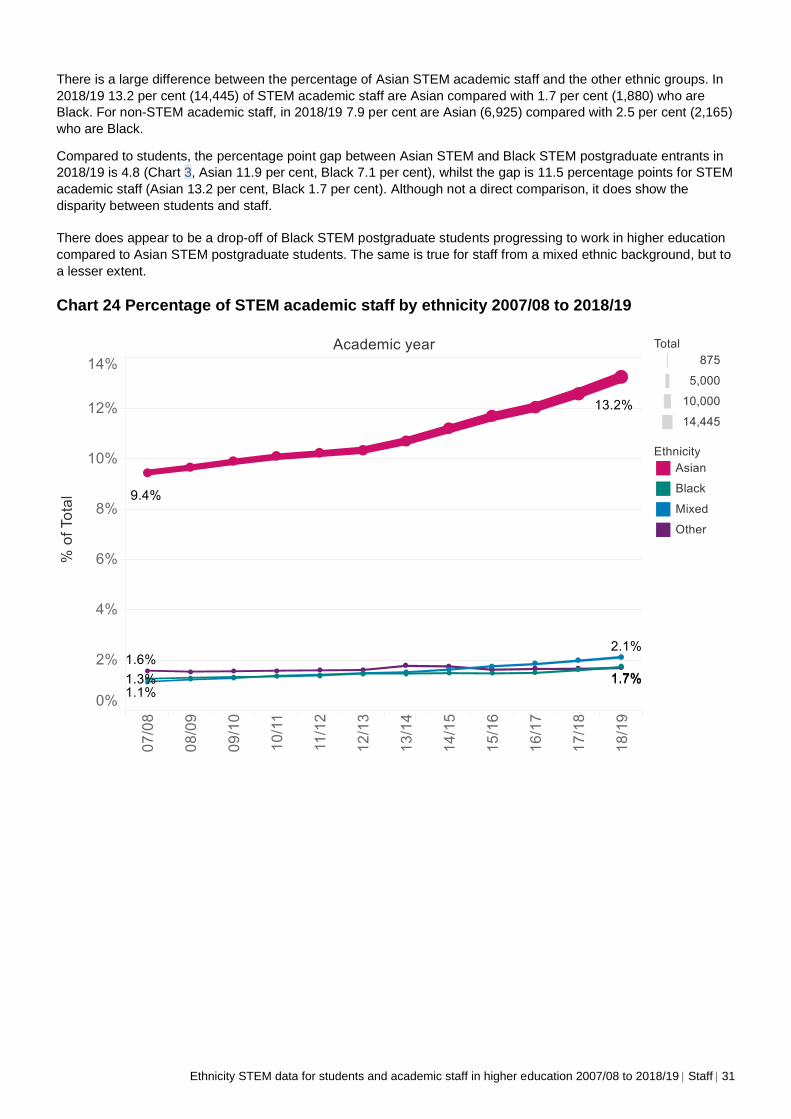
There is a large difference between the percentage of Asian STEM academic staff and the other ethnic groups. In
2018/19 13.2 per cent (14,445) of STEM academic staff are Asian compared with 1.7 per cent (1,880) who are
Black. For non-STEM academic staff, in 2018/19 7.9 per cent are Asian (6,925) compared with 2.5 per cent (2,165)
who are Black.
Compared to students, the percentage point gap between Asian STEM and Black STEM postgraduate entrants in
2018/19 is 4.8 (Chart 3, Asian 11.9 per cent, Black 7.1 per cent), whilst the gap is 11.5 percentage points for STEM
academic staff (Asian 13.2 per cent, Black 1.7 per cent). Although not a direct comparison, it does show the
disparity between students and staff.
There does appear to be a drop-off of Black STEM postgraduate students progressing to work in higher education
compared to Asian STEM postgraduate students. The same is true for staff from a mixed ethnic background, but to
a lesser extent.
Chart 24 Percentage of STEM academic staff by ethnicity 2007/08 to 2018/19

Ethnicity STEM data for students and academic staff in higher education 2007/08 to 2018/19 Staff 32
Chart 25 shows how the representation of each ethnic group differs by age. It shows that almost a fifth (19.2 per
cent, 6,360) of STEM academic staff aged 34 and under are Asian compared to around 1 in 55 (1.8 per cent, 595)
who are Black.
When analysing the data by sex, 21.6 (3,935) per cent of male STEM academic staff aged 34 and under are Asian
in 2018/19 compared with 16.3 per cent (2,425) of female STEM academic staff aged 34 and under who are Asian.
The same pattern is also observed in 2018/19 for Asian STEM academic staff who are 35-49 and 50-65.
The trend of a higher proportion of Asian STEM academic male staff to Asian STEM academic female staff is
observed across all years for these age groups. Black, mixed and other ethnicity STEM academic staff have a
more equal ratio of males to females.
Chart 25 Percentage of STEM academic staff by ethnicity within each age group 2007/08
to 2018/19
Ethnicity STEM data for students and academic staff in higher education 2007/08 to 2018/19 Staff 33
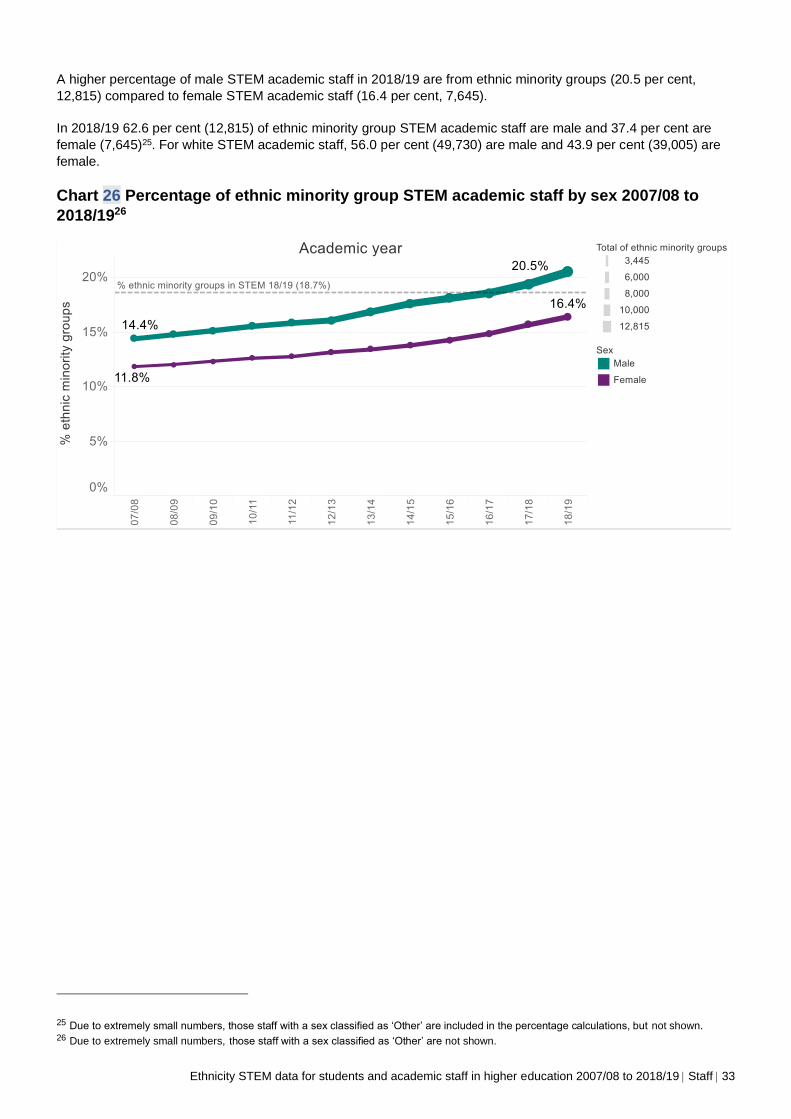
A higher percentage of male STEM academic staff in 2018/19 are from ethnic minority groups (20.5 per cent,
12,815) compared to female STEM academic staff (16.4 per cent, 7,645).
In 2018/19 62.6 per cent (12,815) of ethnic minority group STEM academic staff are male and 37.4 per cent are
female (7,645)25. For white STEM academic staff, 56.0 per cent (49,730) are male and 43.9 per cent (39,005) are
female.
Chart 26 Percentage of ethnic minority group STEM academic staff by sex 2007/08 to
2018/1926
25 Due to extremely small numbers, those staff with a sex classified as ‘Other’ are included in the percentage calculations, but not shown. 26 Due to extremely small numbers, those staff with a sex classified as ‘Other’ are not shown.

Ethnicity STEM data for students and academic staff in higher education 2007/08 to 2018/19 Staff 34
A higher percentage of full-time STEM academic staff in 2018/19 are from ethnic minority groups (20.2 per cent,
16,350) compared to part-time (14.5 per cent, 4,120).
The majority of ethnic minority group STEM academic staff work full-time (79.9 per cent, 16,350) compared to part-
time (20.1 per cent, 4,120) in 2018/19 (no change from 2017/18). For white STEM academic staff, 72.7 per cent
(64,515) work full-time and 27.3 per cent (24,235) work part time.
Chart 27 Percentage of ethnic minority group STEM academic staff by mode of
employment 2007/08 to 2018/19
A higher percentage of STEM academic staff working at Russell Group universities in 2018/19 are from ethnic
minority groups (20.6 per cent, 11,845) compared to other universities (16.7 per cent, 8,625).
In 2018/19 57.9 per cent (11,845) of ethnic minority group STEM academic staff work at a Russell Group university
and 42.1 per cent (8,625) work at other universities. For white STEM academic staff, 51.5 per cent (45,720) work at
a Russell Group university and 48.5 per cent (43,030) work at other universities.
Chart 28 Percentage of ethnic minority group STEM academic staff by Russell Group
marker 2007/08 to 2018/19

Ethnicity STEM data for students and academic staff in higher education 2007/08 to 2018/19 Staff 35
Chart 29 shows that as age increases, ethnic minority group representation decreases. 25.7 per cent (8,500) of
STEM academic staff aged 34 and under are from ethnic minority groups in 2018/19 compared to 11.6 per cent
(3,395) of STEM academic staff aged 50-65.
You would expect ethnic minority group representation within the overall staff population to increase over time as a
more diverse workforce enters the profession, especially given the increasing percentage of ethnic minority group
STEM students. With time you would expect the diversity of the staff population to approach parity with the diversity
of the postgraduate STEM student population if ethnic minority groups and white STEM students progressed to
academic employment in the same proportions.
However, as Chart 25 shows, this is not happening in equal proportions across the four ethnic groups. Unless this
changes there will be unbalanced representation of academic staff from ethnic groups working in higher education
in comparison to the ethnic breakdown of the general population.
Chart 29 Percentage of ethnic minority group STEM academic staff by age 2007/08 to
2018/19
Ethnicity STEM data for students and academic staff in higher education 2007/08 to 2018/19 Staff 36
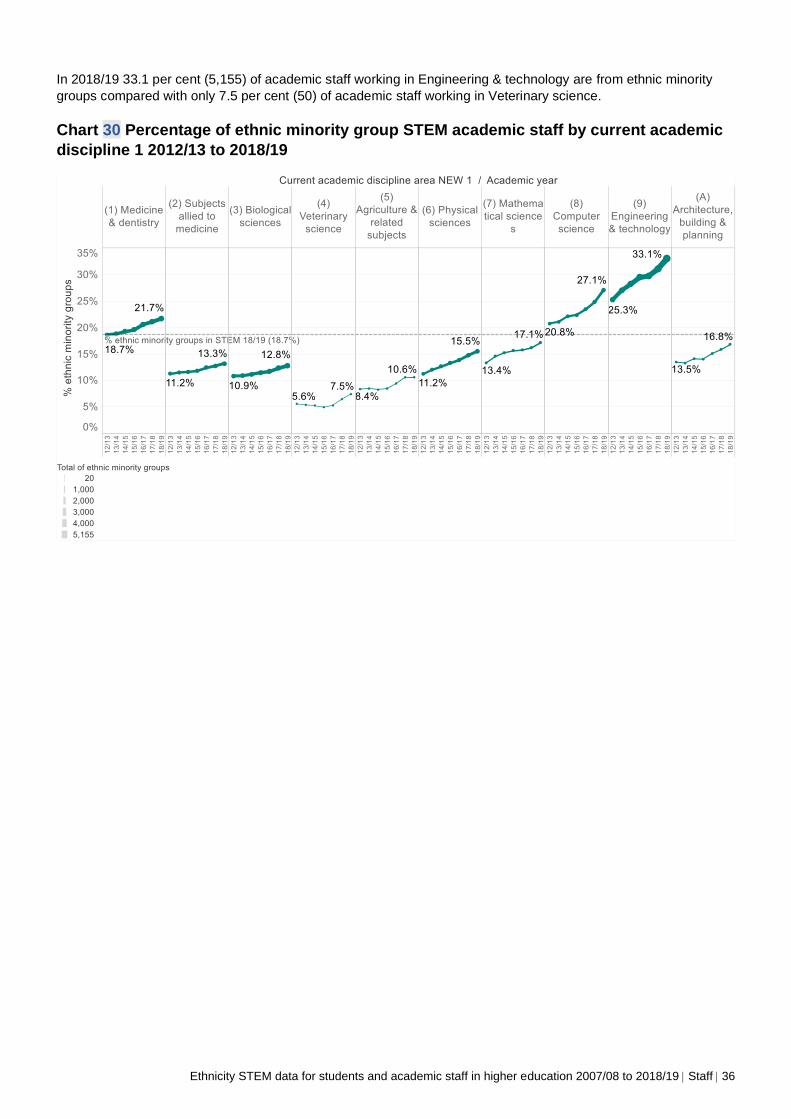
In 2018/19 33.1 per cent (5,155) of academic staff working in Engineering & technology are from ethnic minority
groups compared with only 7.5 per cent (50) of academic staff working in Veterinary science.
Chart 30 Percentage of ethnic minority group STEM academic staff by current academic
discipline 1 2012/13 to 2018/19

Ethnicity STEM data for students and academic staff in higher education 2007/08 to 2018/19 Staff 37
Chart 31 shows the representation of ethnic minority group STEM academic staff within each academic
employment function. In 2018/19 25.6 per cent (9,880) of staff with an academic contract that is research only are
from ethnic minority groups vs 15.5 per cent (3,675) with an academic contract that is teaching only.
It shows that ethnic minority group STEM research only academic staff are more highly represented compared to
both ethnic minority group STEM academic teaching only staff and ethnic minority group STEM academic teaching
and research staff.
In 2018/19 48.3 per cent (9,880) of ethnic minority group STEM academic staff have an academic contract that is
research only, 33.8 per cent (6,910) both teaching and research, and 18.0 per cent (3,675) teaching only. In
comparison 32.3 per cent (28,665) of white STEM academic staff have an academic contract that is research only,
45.2 per cent (40,050) both teaching and research, and 22.5 per cent (19,985) that is teaching only.
Chart 31 Percentage of ethnic minority group STEM academic staff by academic
employment function 2007/08 to 2018/19

Ethnicity STEM data for students and academic staff in higher education 2007/08 to 2018/19 Staff 38
In 2018/19 a higher percentage of STEM academic staff with a fixed-term contract (25 per cent, 9,925) are from
ethnic minority groups compared to an open-ended/permanent contract (15.2 per cent, 10,545). It shows that
ethnic minority group STEM academic staff are more likely to be on a fixed term contract than white STEM
academic staff.
In 2018/19 48.5 per cent of ethnic minority group STEM academic staff are employed on a fixed term contract and
51.5 per cent are employed on an open-ended/permanent contract. For white STEM academic staff, 33.5 per cent
(29,730) are employed on a fixed term contract and 66.5 per cent (59,020) are employed on an open-
ended/permanent contract.
Chart 32 Percentage of ethnic minority group STEM academic staff by terms of
employment 2007/08 to 2018/19

Ethnicity STEM data for students and academic staff in higher education 2007/08 to 2018/19 Staff 39
Age is important when analysing terms of employment, as those aged 50-65 have the highest proportion of STEM
academic staff employed on open-ended/permanent contracts. As shown in Chart 29, the percentage of ethnic
minority group STEM academic staff differs by age, so Chart 33 helps provide further context when looking at
terms of employment.
74.0 per cent (6,295) of ethnic minority group STEM academic staff aged 34 and under are on a fixed term contract
compared to 64.9 per cent (15,980) of white STEM academic staff.
Ethnic minority group STEM academic staff aged under 49 are more likely to be on a fixed term contract than white
STEM academic staff. Within the age group of 50-65 there is almost parity between ethnic minority groups and
white STEM academic staff.
Chart 33 Proportion of STEM academic staff within terms of employment by age and
ethnicity marker 2018/19

Ethnicity STEM data for students and academic staff in higher education 2007/08 to 2018/19 Staff 40
Chart 34 shows that ethnic minority group STEM academic staff become less represented the more senior the
contract group becomes. It also shows that the highest number of ethnic minority group STEM academic staff are
within K0 Senior Professional.
Between 2017/18 and 2018/19, the percentage of ethnic minority group STEM academic staff has increased for all
contract levels aside from the two most junior categories. The number of ethnic minority group STEM academic
staff within the most senior group has increased from 20 to 25. Please note that this is a small cohort, so year on
year fluctuations will be more common than the K0 Senior Professional group (8,350 in 2018/19).
Chart 34 Percentage of ethnic minority group STEM academic staff by contract level
2012/13 to 2018/19

Ethnicity STEM data for students and academic staff in higher education 2007/08 to 2018/19 Staff 41
Chart 35 shows that in 2018/19, 3.5 per cent (65) of Black STEM academic staff work at the F1 Professor level
compared to 11.9 per cent (10,560) of white STEM academic staff. A similar trend is observed for academic staff
working in non-STEM.
Chart 35 Percentage of STEM academic staff working at F1 Professor level by ethnicity
2018/19
It is to be expected that those working at professor level are more experienced, and therefore more likely to be
older. When restricting to those STEM academic staff aged 50 and over in 2018/19, 11.9 per cent (50) Black STEM
academic staff work at F1 Professor level compared to Asian (28.6 per cent, 675), mixed (26.2 per cent, 85), other
ethnicity (27.2 per cent, 125), and white (26.7 per cent, 7,615).

Ethnicity STEM data for students and academic staff in higher education 2007/08 to 2018/19 Staff 42
The following chart combines the various contract levels into three groups to aid comparison between ethnic
groups and sex. The data shows there is disparity between the sexes and ethnicity.
Chart 36 Proportion of STEM academic staff within contract groups by sex and ethnicity
2018/1927
27 Due to extremely small numbers, those staff with a sex classified as ‘Other’ are not shown.
More senior

Ethnicity STEM data for students and academic staff in higher education 2007/08 to 2018/19 Staff 43
As with terms of employment, age is also a factor that affects the percentage of STEM academic staff within
particular contract levels. The following chart combines the various contract levels into three groups to aid
comparison between ethnic groups and age. The data shows there is disparity within each age group and ethnicity.
Chart 37 Proportion of STEM academic staff within contract groups by ethnicity and age
group 2018/1928
28 Values for the most senior group aged 34 and under have been suppressed due to small numbers. All percentages are displayed to 0.d.p. for data protection. The age groups 50-65 and 66 and over have been combined due to small numbers in the older age group.
More senior

Ethnicity STEM data for students and academic staff in higher education 2007/08 to 2018/19 44
Further research Drafted jointly by Jisc and the Royal Society.
The following recommended research is intended to help build a robust evidence base for understanding some of
the disparities identified in the data.
Further research should be undertaken into:
1. Reasons for disparity in degree outcomes for Black students, in order to understand the possible reasons
that have been identified for this disparity.
2. Reasons for non-completion among Black STEM students in order to understand better the different
causes and determine any action that could be taken to address non-completion.
3. The diversity profile of grant applicants and awards from a range of funders, which should include
examining the proportion of applicants from different ethnic groups who obtain funding in their own name.
4. Regression modelling should be completed to understand which variables have the greatest impact on a
first degree student’s likelihood of achieving first or upper second class honours, and dropout rates at both
first degree and postgraduate level. Further research should then be carried out to compare statistically
similar cohorts to understand the impact ethnicity has on first degree achievement, and non-completion at
both first degree and postgraduate level.
5. Understanding the factors affecting progression rates of different ethnic groups in STEM study and STEM
academia.

Ethnicity STEM data for students and academic staff in higher education 2007/08 to 2018/19 Annex 45
Annex Annex 1 Percentage by ethnic group and age from the 2011 England and Wales census
Age Percentages
White
Ethnic minority groups
Asian Black Mixed Other
Age 0 to 4 76.8% 23.2% 10.4% 5.1% 6.3% 1.4%
Age 5 to 9 78.2% 21.8% 10.3% 5.0% 5.2% 1.3%
Age 10 to 14 81.2% 18.8% 8.9% 4.5% 4.3% 1.1%
Age 15 to 17 82.4% 17.6% 8.5% 4.2% 3.8% 1.1%
Age 18 to 24 81.5% 18.5% 10.3% 3.7% 3.2% 1.3%
Age 25 to 29 80.2% 19.8% 11.7% 3.8% 2.6% 1.7%
Age 30 to 34 79.6% 20.4% 12.2% 4.3% 2.2% 1.8%
Age 35 to 39 82.6% 17.4% 10.1% 4.1% 1.7% 1.5%
Age 40 to 44 86.1% 13.9% 7.3% 4.2% 1.4% 1.0%
Age 45 to 49 88.7% 11.3% 5.4% 3.9% 1.2% 0.8%
Age 50 to 54 90.0% 10.0% 5.5% 2.9% 0.9% 0.7%
Age 55 to 59 91.7% 8.3% 5.2% 1.8% 0.6% 0.6%
Age 60 to 64 94.7% 5.3% 3.4% 1.0% 0.4% 0.4%
Age 65 to 69 95.1% 4.9% 2.9% 1.2% 0.4% 0.3%
Age 70 to 74 94.4% 5.6% 3.3% 1.6% 0.4% 0.3%
Age 75 to 79 95.1% 4.9% 2.8% 1.5% 0.4% 0.3%
Age 80 to 84 96.4% 3.6% 1.9% 1.1% 0.3% 0.2%
Age 85 and over 97.7% 2.3% 1.2% 0.6% 0.3% 0.2%
Ethnicity STEM data for students and academic staff in higher education 2007/08 to 2018/19 46
Annex 2 Russell Group universities Cardiff University Imperial College of Science, Technology and Medicine King's College London London School of Economics and Political Science Newcastle University Queen Mary University of London Queen's University Belfast The University of Birmingham The University of Bristol The University of Cambridge The University of Edinburgh The University of Exeter The University of Glasgow The University of Leeds The University of Liverpool The University of Manchester The University of Oxford The University of Sheffield The University of Southampton The University of Warwick The University of York University College London University of Durham University of Nottingham
Annex 3 Ethnicity definition White includes White, White - Scottish, Irish Traveller, Gypsy or Traveller, plus Other White background.
Black includes Black or Black British - Caribbean, Black or Black British - African, and other Black background.
Asian includes Asian or Asian British - Indian, Asian or Asian British - Pakistani, Asian or Asian British -
Bangladeshi, Chinese, and other Asian background.
Other includes Arab, plus other ethnic background.
Mixed includes mixed - White and Black Caribbean, mixed - White and Black African, mixed - White and Asian,
other mixed background
Not known includes not known and information refused. Ethnic minority groups include all non-white categories
excluding not known.

Ethnicity STEM data for students and academic staff in higher education 2007/08 to 2018/19 47
Annex 4 Number and percentage of UK domiciled STEM entrants with known ethnicity by level of study, ethnicity marker and
ethnicity 2007/08 to 2018/19
Academic year
Level of study
Ethnicity marker Ethnicity 07/08 08/09 09/10 10/11 11/12 12/13 13/14 14/15 15/16 16/17 17/18 18/19
First degree Ethnic minority groups
Asian 10.8% 10.7% 10.7% 10.8% 10.8% 11.3% 11.5% 11.8% 12.5% 13.0% 13.3% 13.6%
17,425 18,690 19,880 20,020 21,655 20,905 23,000 24,105 26,295 27,485 28,425 29,145
Black 5.8% 6.3% 6.4% 6.2% 6.8% 7.2% 7.0% 7.2% 7.6% 7.8% 8.3% 8.1%
9,390 11,060 11,800 11,605 13,705 13,315 14,030 14,775 15,900 16,465 17,760 17,340
Mixed 2.6% 2.8% 2.9% 3.0% 3.1% 3.2% 3.3% 3.5% 3.7% 4.0% 4.0% 4.2%
4,225 4,840 5,305 5,520 6,290 5,940 6,665 7,155 7,835 8,345 8,630 8,925
Other 1.1% 1.0% 1.1% 1.0% 1.1% 1.4% 1.4% 1.5% 1.6% 1.8% 1.9% 1.9%
1,715 1,780 2,005 1,925 2,200 2,625 2,865 3,160 3,365 3,740 4,080 4,155
Total 20.3% 20.8% 21.1% 21.0% 21.9% 23.2% 23.4% 24.1% 25.5% 26.6% 27.5% 27.8%
32,750 36,370 38,990 39,070 43,850 42,785 46,560 49,195 53,395 56,040 58,895 59,565
White Total 79.7% 79.2% 78.9% 79.0% 78.1% 76.8% 76.6% 75.9% 74.5% 73.4% 72.5% 72.2%
128,735 138,150 146,180 146,795 156,580 141,675 152,620 155,035 156,360 154,845 155,220 154,365
First degree total 100.0% 100.0% 100.0% 100.0% 100.0% 100.0% 100.0% 100.0% 100.0% 100.0% 100.0% 100.0%
161,485 174,520 185,170 185,860 200,425 184,460 199,180 204,230 209,755 210,885 214,115 213,930
Postgraduate Ethnic minority groups
Asian 10.8% 11.0% 11.2% 11.1% 11.3% 11.6% 11.0% 10.7% 11.0% 11.0% 11.6% 11.9%
5,545 6,475 7,315 6,930 7,385 7,375 7,435 7,725 8,515 9,775 10,655 10,980
Black 5.2% 5.8% 5.8% 6.1% 6.2% 5.9% 6.1% 6.0% 6.4% 7.5% 7.4% 7.1%
2,705 3,405 3,740 3,835 4,045 3,720 4,135 4,330 4,920 6,650 6,770 6,515
Mixed 2.0% 2.1% 2.4% 2.5% 2.8% 2.7% 2.8% 2.8% 2.9% 3.1% 3.3% 3.4%
1,030 1,240 1,545 1,565 1,800 1,695 1,860 2,000 2,270 2,750 2,995 3,145
Other 1.6% 1.6% 1.5% 1.6% 1.7% 1.8% 1.8% 1.7% 1.8% 1.8% 1.9% 1.9%
840 925 1,005 1,025 1,120 1,155 1,195 1,245 1,410 1,615 1,745 1,755
Total 19.6% 20.5% 20.9% 21.3% 22.0% 21.9% 21.7% 21.3% 22.1% 23.4% 24.1% 24.3%
10,120 12,050 13,605 13,350 14,350 13,950 14,630 15,300 17,115 20,790 22,165 22,395
White Total 80.4% 79.5% 79.1% 78.7% 78.0% 78.1% 78.3% 78.7% 77.9% 76.6% 75.9% 75.7%
41,425 46,620 51,435 49,205 50,860 49,605 52,655 56,550 60,210 68,010 69,820 69,795
Postgraduate total 100.0% 100.0% 100.0% 100.0% 100.0% 100.0% 100.0% 100.0% 100.0% 100.0% 100.0% 100.0%
51,550 58,665 65,040 62,555 65,210 63,550 67,280 71,845 77,330 88,800 91,980 92,195
Total 100.0% 100.0% 100.0% 100.0% 100.0% 100.0% 100.0% 100.0% 100.0% 100.0% 100.0% 100.0%
213,030 233,190 250,210 248,415 265,640 248,010 266,460 276,075 287,085 299,685 306,100 306,125
Ethnicity STEM data for students and academic staff in higher education 2007/08 to 2018/19 48
Annex 5 Number and percentage of UK domiciled STEM students with known ethnicity by level of study, ethnicity marker and
ethnicity 2007/08 to 2018/19
Academic year
Level of study
Ethnicity marker Ethnicity 07/08 08/09 09/10 10/11 11/12 12/13 13/14 14/15 15/16 16/17 17/18 18/19
First degree Ethnic minority groups
Asian 11.3% 11.3% 11.2% 11.2% 11.2% 11.4% 11.6% 12.0% 12.3% 12.7% 13.2% 13.6%
55,210 57,110 59,775 61,805 64,965 66,985 70,015 72,825 77,370 81,750 86,115 88,895
Black 5.0% 5.4% 5.6% 5.7% 6.0% 6.3% 6.4% 6.6% 6.7% 6.9% 7.3% 7.3%
24,265 27,430 29,935 31,560 34,805 36,855 38,570 39,885 42,205 44,515 47,430 47,980
Mixed 2.4% 2.6% 2.7% 2.8% 2.9% 3.1% 3.2% 3.3% 3.5% 3.7% 3.9% 4.0%
11,635 13,000 14,285 15,480 17,120 18,065 19,365 20,205 21,870 23,650 25,220 26,245
Other 1.0% 1.1% 1.1% 1.1% 1.1% 1.2% 1.3% 1.4% 1.5% 1.6% 1.7% 1.8%
5,110 5,375 5,695 5,865 6,410 7,180 7,910 8,695 9,455 10,295 11,295 11,945
Total 19.8% 20.4% 20.6% 20.8% 21.2% 21.9% 22.6% 23.3% 24.0% 24.9% 26.0% 26.7%
96,215 102,915 109,695 114,710 123,300 129,085 135,860 141,615 150,895 160,210 170,060 175,065
White Total 80.2% 79.6% 79.4% 79.2% 78.8% 78.1% 77.4% 76.7% 76.0% 75.1% 74.0% 73.3%
390,680 402,135 421,910 436,100 457,420 459,950 466,350 467,230 476,975 482,245 482,910 479,715
First degree total 100.0% 100.0% 100.0% 100.0% 100.0% 100.0% 100.0% 100.0% 100.0% 100.0% 100.0% 100.0%
486,900 505,055 531,605 550,805 580,720 589,035 602,210 608,840 627,870 642,455 652,970 654,785
Postgraduate Ethnic minority groups
Asian 9.9% 10.1% 10.5% 10.7% 10.7% 10.8% 10.7% 10.6% 10.7% 10.7% 11.0% 11.2%
11,105 12,210 13,715 14,155 14,505 14,275 14,305 14,650 15,560 17,160 18,270 18,770
Black 4.7% 5.1% 5.2% 5.6% 5.7% 5.6% 5.7% 5.8% 5.9% 6.6% 6.8% 6.7%
5,315 6,165 6,825 7,340 7,740 7,390 7,590 8,035 8,585 10,510 11,305 11,295
Mixed 1.8% 2.0% 2.2% 2.4% 2.6% 2.6% 2.6% 2.7% 2.9% 3.0% 3.2% 3.3%
2,010 2,395 2,860 3,155 3,460 3,395 3,530 3,775 4,145 4,810 5,275 5,505
Other 1.5% 1.6% 1.6% 1.7% 1.7% 1.8% 1.8% 1.9% 1.8% 1.9% 1.9% 1.9%
1,700 1,945 2,115 2,195 2,280 2,330 2,425 2,570 2,675 3,000 3,210 3,250
Total 17.9% 18.9% 19.6% 20.3% 20.7% 20.8% 20.8% 21.0% 21.4% 22.2% 22.9% 23.2%
20,130 22,710 25,515 26,840 27,985 27,385 27,850 29,035 30,965 35,475 38,060 38,825
White Total 82.1% 81.1% 80.4% 79.7% 79.3% 79.2% 79.2% 79.0% 78.6% 77.8% 77.1% 76.8%
92,330 97,700 104,840 105,425 107,325 104,310 106,050 109,405 114,030 124,295 128,175 128,565
Postgraduate total 100.0% 100.0% 100.0% 100.0% 100.0% 100.0% 100.0% 100.0% 100.0% 100.0% 100.0% 100.0%
112,460 120,415 130,350 132,265 135,310 131,695 133,900 138,440 144,995 159,770 166,235 167,390
Total 100.0% 100.0% 100.0% 100.0% 100.0% 100.0% 100.0% 100.0% 100.0% 100.0% 100.0% 100.0%
599,360 625,465 661,955 683,070 716,030 720,735 736,110 747,280 772,870 802,225 819,210 822,175
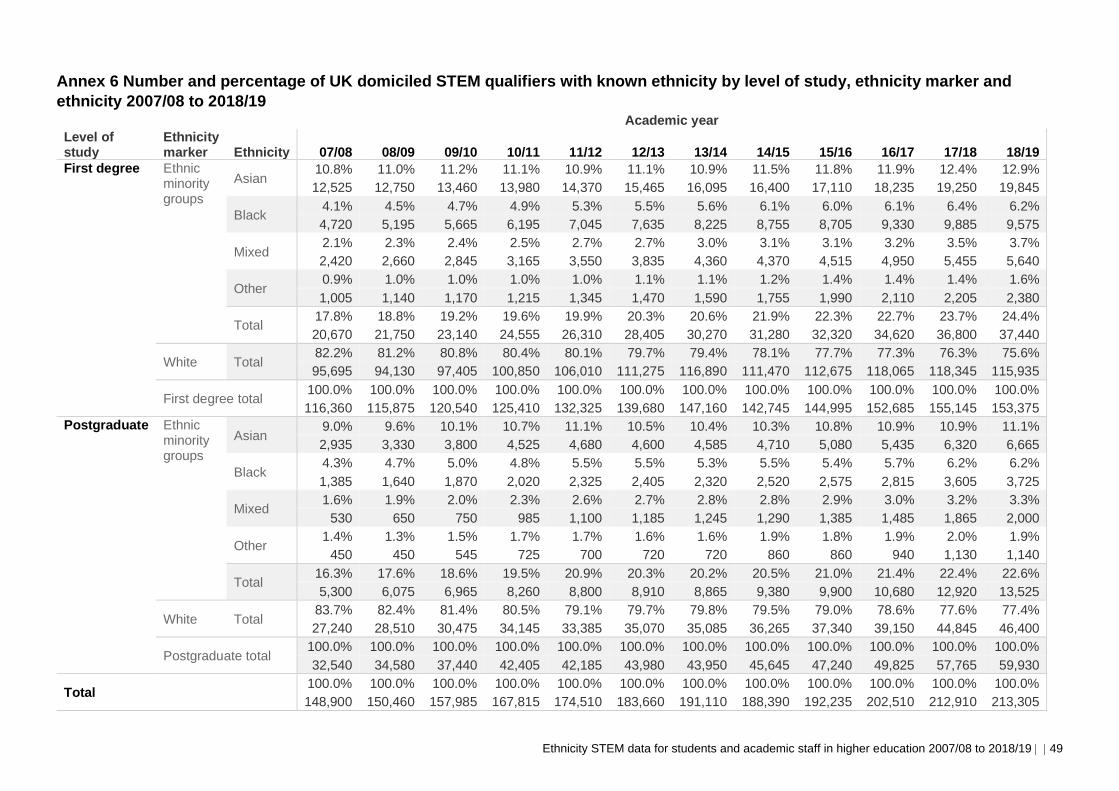
Ethnicity STEM data for students and academic staff in higher education 2007/08 to 2018/19 49
Annex 6 Number and percentage of UK domiciled STEM qualifiers with known ethnicity by level of study, ethnicity marker and
ethnicity 2007/08 to 2018/19
Academic year
Level of study
Ethnicity marker Ethnicity 07/08 08/09 09/10 10/11 11/12 12/13 13/14 14/15 15/16 16/17 17/18 18/19
First degree Ethnic minority groups
Asian 10.8% 11.0% 11.2% 11.1% 10.9% 11.1% 10.9% 11.5% 11.8% 11.9% 12.4% 12.9%
12,525 12,750 13,460 13,980 14,370 15,465 16,095 16,400 17,110 18,235 19,250 19,845
Black 4.1% 4.5% 4.7% 4.9% 5.3% 5.5% 5.6% 6.1% 6.0% 6.1% 6.4% 6.2%
4,720 5,195 5,665 6,195 7,045 7,635 8,225 8,755 8,705 9,330 9,885 9,575
Mixed 2.1% 2.3% 2.4% 2.5% 2.7% 2.7% 3.0% 3.1% 3.1% 3.2% 3.5% 3.7%
2,420 2,660 2,845 3,165 3,550 3,835 4,360 4,370 4,515 4,950 5,455 5,640
Other 0.9% 1.0% 1.0% 1.0% 1.0% 1.1% 1.1% 1.2% 1.4% 1.4% 1.4% 1.6%
1,005 1,140 1,170 1,215 1,345 1,470 1,590 1,755 1,990 2,110 2,205 2,380
Total 17.8% 18.8% 19.2% 19.6% 19.9% 20.3% 20.6% 21.9% 22.3% 22.7% 23.7% 24.4%
20,670 21,750 23,140 24,555 26,310 28,405 30,270 31,280 32,320 34,620 36,800 37,440
White Total 82.2% 81.2% 80.8% 80.4% 80.1% 79.7% 79.4% 78.1% 77.7% 77.3% 76.3% 75.6%
95,695 94,130 97,405 100,850 106,010 111,275 116,890 111,470 112,675 118,065 118,345 115,935
First degree total 100.0% 100.0% 100.0% 100.0% 100.0% 100.0% 100.0% 100.0% 100.0% 100.0% 100.0% 100.0%
116,360 115,875 120,540 125,410 132,325 139,680 147,160 142,745 144,995 152,685 155,145 153,375
Postgraduate Ethnic minority groups
Asian 9.0% 9.6% 10.1% 10.7% 11.1% 10.5% 10.4% 10.3% 10.8% 10.9% 10.9% 11.1%
2,935 3,330 3,800 4,525 4,680 4,600 4,585 4,710 5,080 5,435 6,320 6,665
Black 4.3% 4.7% 5.0% 4.8% 5.5% 5.5% 5.3% 5.5% 5.4% 5.7% 6.2% 6.2%
1,385 1,640 1,870 2,020 2,325 2,405 2,320 2,520 2,575 2,815 3,605 3,725
Mixed 1.6% 1.9% 2.0% 2.3% 2.6% 2.7% 2.8% 2.8% 2.9% 3.0% 3.2% 3.3%
530 650 750 985 1,100 1,185 1,245 1,290 1,385 1,485 1,865 2,000
Other 1.4% 1.3% 1.5% 1.7% 1.7% 1.6% 1.6% 1.9% 1.8% 1.9% 2.0% 1.9%
450 450 545 725 700 720 720 860 860 940 1,130 1,140
Total 16.3% 17.6% 18.6% 19.5% 20.9% 20.3% 20.2% 20.5% 21.0% 21.4% 22.4% 22.6%
5,300 6,075 6,965 8,260 8,800 8,910 8,865 9,380 9,900 10,680 12,920 13,525
White Total 83.7% 82.4% 81.4% 80.5% 79.1% 79.7% 79.8% 79.5% 79.0% 78.6% 77.6% 77.4%
27,240 28,510 30,475 34,145 33,385 35,070 35,085 36,265 37,340 39,150 44,845 46,400
Postgraduate total 100.0% 100.0% 100.0% 100.0% 100.0% 100.0% 100.0% 100.0% 100.0% 100.0% 100.0% 100.0%
32,540 34,580 37,440 42,405 42,185 43,980 43,950 45,645 47,240 49,825 57,765 59,930
Total 100.0% 100.0% 100.0% 100.0% 100.0% 100.0% 100.0% 100.0% 100.0% 100.0% 100.0% 100.0%
148,900 150,460 157,985 167,815 174,510 183,660 191,110 188,390 192,235 202,510 212,910 213,305

Ethnicity STEM data for students and academic staff in higher education 2007/08 to 2018/19 50
Annex 7 Number and percentage of UK domiciled STEM DLHE respondents with known ethnicity by level of study, ethnicity marker
and ethnicity 2011/12 to 2016/17
Academic year Level of study
Ethnicity marker Ethnicity 11/12 12/13 13/14 14/15 15/16 16/17
First degree Ethnic minority groups
Asian 10.6% 11.0% 11.0% 11.4% 11.7% 11.8%
10,545 11,875 12,620 12,565 13,120 13,860
Black 4.5% 4.8% 5.1% 5.7% 5.7% 5.9%
4,485 5,210 5,820 6,275 6,375 6,915
Mixed 2.6% 2.6% 2.9% 3.0% 3.0% 3.2%
2,560 2,860 3,320 3,320 3,340 3,715
Other 0.9% 1.0% 1.0% 1.2% 1.3% 1.3%
940 1,070 1,155 1,305 1,435 1,535
Total 18.5% 19.4% 20.0% 21.3% 21.7% 22.2%
18,530 21,015 22,920 23,465 24,270 26,020
White Total 81.5% 80.6% 80.0% 78.7% 78.3% 77.8%
81,375 87,380 91,690 86,615 87,505 91,055
First degree total 100.0% 100.0% 100.0% 100.0% 100.0% 100.0%
99,910 108,395 114,610 110,080 111,775 117,075
Postgraduate Ethnic minority groups
Asian 10.0% 9.8% 9.5% 9.8% 10.5% 10.4%
2,550 2,755 2,665 2,860 3,175 3,310
Black 4.6% 4.8% 4.8% 5.0% 5.1% 5.4%
1,165 1,365 1,340 1,450 1,540 1,720
Mixed 2.4% 2.8% 2.8% 2.8% 2.9% 3.0%
615 780 780 810 890 955
Other 1.5% 1.5% 1.4% 1.7% 1.6% 1.7%
380 410 390 505 470 550
Total 18.4% 18.8% 18.4% 19.3% 20.0% 20.5%
4,715 5,310 5,175 5,625 6,075 6,540
White Total 81.6% 81.2% 81.6% 80.7% 80.0% 79.5%
20,925 22,890 22,925 23,505 24,285 25,410
Postgraduate total 100.0% 100.0% 100.0% 100.0% 100.0% 100.0%
25,640 28,195 28,100 29,130 30,360 31,950
Total 100.0% 100.0% 100.0% 100.0% 100.0% 100.0%
125,550 136,590 142,710 139,210 142,135 149,025

Ethnicity STEM data for students and academic staff in higher education 2007/08 to 2018/19 51
Annex 8 Number and percentage of STEM academic staff with known ethnicity by ethnicity marker and ethnicity 2007/08 to 2018/19
Academic year Ethnicity marker Ethnicity 07/08 08/09 09/10 10/11 11/12 12/13 13/14 14/15 15/16 16/17 17/18 18/19
Ethnic minority groups
Asian 9.4% 9.6% 9.9% 10.1% 10.2% 10.3% 10.7% 11.2% 11.7% 12.0% 12.6% 13.2%
7,240 7,610 7,965 8,230 8,475 9,445 10,260 11,110 11,860 12,470 13,530 14,445
Black 1.3% 1.3% 1.3% 1.3% 1.4% 1.5% 1.5% 1.5% 1.5% 1.5% 1.6% 1.7%
965 1,025 1,075 1,100 1,150 1,340 1,405 1,475 1,495 1,545 1,715 1,880
Mixed 1.1% 1.2% 1.3% 1.4% 1.4% 1.5% 1.5% 1.6% 1.8% 1.8% 2.0% 2.1%
875 965 1,035 1,125 1,180 1,350 1,455 1,610 1,780 1,905 2,115 2,305
Other 1.6% 1.5% 1.6% 1.6% 1.6% 1.6% 1.8% 1.7% 1.6% 1.6% 1.7% 1.7%
1,210 1,215 1,255 1,290 1,325 1,470 1,700 1,740 1,645 1,705 1,775 1,840
Total 13.4% 13.7% 14.0% 14.4% 14.6% 14.9% 15.4% 16.0% 16.5% 17.0% 17.8% 18.7%
10,285 10,820 11,330 11,745 12,125 13,605 14,820 15,935 16,780 17,625 19,135 20,470
White Total 86.6% 86.3% 86.0% 85.6% 85.4% 85.1% 84.6% 84.0% 83.5% 83.0% 82.2% 81.3%
66,365 68,135 69,410 69,980 70,980 77,845 81,175 83,540 84,945 86,015 88,305 88,750
Total 100.0% 100.0% 100.0% 100.0% 100.0% 100.0% 100.0% 100.0% 100.0% 100.0% 100.0% 100.0%
76,655 78,955 80,740 81,725 83,110 91,445 95,990 99,480 101,725 103,640 107,435 109,220