baseline report on the rwanda horticulture organisations ... · baseline report on the rwanda...
TRANSCRIPT

Baseline Report on the Rwanda Horticulture Organisations Survey
Final Report
March 2014
Rwanda Ministry of Agriculture and National Agricultural Export Animal Resources (MINAGRI) Development Board (NAEB)
European Union’s External Cooperation Programme for Rwanda
This project is funded by
The European Union
A project implemented by
AGRER Consortium

The contents of this publication are the sole responsibility of Agrer Consortium and can in no way be taken to reflect the views of the European Union

iii | P a g e
ACKNOWLEDGMENTS
The lead authors, Daniel Clay and Juvénal Turatsinze wish to acknowledge, first and foremost, the technical and administrative teams at Ministry of Agriculture and Animal Resources (MINAGRI) and the National Agriculture Export Development Board (NAEB) for their engagement, technical support and administrative leadership in the implementation of the RHOS 2013. We thank the Delegation of the European Union to Rwanda for programmatic guidance and funding support for the RHOS 2013. We express our appreciation to ECO3/AGRER for providing consulting services through the EU Framework Contract FWC BENEF 2009, LOT 1 Contract N°2013/325498
Special thanks are due to several individuals for their outstanding technical contributions to the success of the initiative. They are:
Callist Kayigamba for his role as the national supervisor for the fieldwork phase of the project;
John Rwirahira for his technical leadership on the data entry phase of the survey;
Nathan Clay for his contributions as co-author for all spatial analysis and maps found in this report;
Aniseh Bro for her assistance in database management;
Daniel Ntawumenya for his assistance in geocoding the organisations to enable spatial analysis and mapping;
Alfred Bizoza for his administrative and technical guidance to staffing and survey operations.

iv | P a g e
TABLE OF CONTENTS
Acknowledgments .......................................................................................................................................... 1
Table of Contents ........................................................................................................................................... iv
Abbreviations ................................................................................................................................................ vii
1 Introduction & Summary Results ...................................................................................... 1
2 Methodology & Survey Implementation ........................................................................................ 3
3 Survey Results ......................................................................................................................................... 8
3.1 Horticulture Organisations, Membership and Geographic Distribution ................. 9
3.2 Horticulture Sales, Production and Area Cultivated ...................................................... 15
3.2.1 Horticulture Sales Values and Volumes by Crop ....................................................................................... 16
3.2.2 Horticulture Sales Value, Volumes and Area Planted by Province and District .......................... 17
3.2.3 Processed Horticulture Products ..................................................................................................................... 20
3.3 Horticulture Markets ................................................................................................................ 23
3.3.1 Market Outlets for Horticulture Products .................................................................................................... 24
3.3.2 Destination Markets for Horticulture Products ......................................................................................... 25
3.3.3 Current and Future Market Requirements .................................................................................................. 27
3.4 Accessing Agricultural Inputs, Services & Information ................................................ 31
3.4.1 Intensification through Improved Inputs ..................................................................................................... 32
3.4.2 Access to Inputs & Services ................................................................................................................................. 33
3.4.3 Sources of Information for Improved Horticulture Practices & Management ............................. 37
3.5 Spatial Location and Competing Land Use ......................................................................... 39
3.5.1 Valley and Hillside Location of Horticulture Crops .................................................................................. 40
3.5.2 Distance from Paved Road................................................................................................................................... 42
3.5.3 Competing for Land ................................................................................................................................................ 44
3.6 Age of Organisation, Gender Balance and Partnerships ............................................... 46
3.6.1 Comparison of Older and Younger Organisations .................................................................................... 47
3.6.2 Gender and Horticulture Organisations ........................................................................................................ 48
3.6.3 Partners & Support for Horticulture Organisations................................................................................. 51
3.7 Largeholder Horticulture Producers................................................................................... 53
3.7.1 Largeholder Horticulture Producers .............................................................................................................. 54
3.7.2 Largeholder Crop Production ............................................................................................................................ 55
4 Future Tracking of Horticulture Organisations ........................................................................ 57
ANNEXES .......................................................................................................................................................... 59
Horticulture Sales Value (FRW) and Volumes (Kg) by Crop ............................................ 60 Table 1.

v | P a g e
Horticulture Sales Value (FRW) by Crop and Province...................................................... 61 Table 2.
Horticulture Crop Production (Kg) Sales (Kg) & Difference between Table 3.Production and Sales by Crop Category, Province and District .............................. 62
Horticulture Sales Value (FRW) by Crop Category, Province and District ................. 63 Table 4.
Horticulture Sales Volume (Kg) by Crop Category, Province and District ................. 64 Table 5.
Horticulture Area Cultivated (Ha) by Crop Category, Province and District ............ 65 Table 6.
Value (FRW) and Volume (Kg) of Horticuture Processed Products by Table 7.Province and District ................................................................................................................ 66
Horticulture Sales Value (FRW) by Crop and Province...................................................... 67 Table 8.
Horticulture Sales Volume (Kg) by Crop and Province ...................................................... 68 Table 9.
Greenhouse and Other Buildings (SqM) Property of Horticulture Organisations Table 10.(Shown by Building Type, Province and District) ........................................................ 69
Use of Irrigation Systems by Horticulture Organisations (Shown by System Table 11.Type, Province and District) .................................................................................................. 70
Characteristics of Loans to Organisations Over Past 24 Months (Shown by Table 12.Province and District) .............................................................................................................. 71
Selected Organisational Characteristics by Percent Female Membership Table 13.Quartiles......................................................................................................................................... 72
Location of Land on Hillside by Selected Categories of Land Use .................................. 73 Table 14.
Production Area (Ha) by Location on the Hillside and Province ................................... 73 Table 15.
Sources of Information Received by Organisations by Type of Information ............ 74 Table 16.
Horticulture Crops Produced by Individual Largeholder Producers ........................... 75 Table 17.
Value (FRW) and Area (Ha) in Horticulture by Individual Largeholder Table 18.Producers (Shown by Province and District) ................................................................. 76
Map 1. Organisations by Area (Ha) in Production .............................................................................. 77
Map 2. Organisatins by Main Source of Revenue and Level of Revenue .................................... 78
Map 3. Horticulture Organisations by Main Crop Sold ..................................................................... 79
Map 4. Cabbage Sales by District and Level of Sales (FRW Tertiles)........................................... 80
Map 5. Carrot Sales by District and Level of Sales (FRW Tertiles) ............................................... 81
Map 6. Eggplant Sales by District and Level of Sales (FRW Tertiles) .......................................... 82
Map 7. Onion Sales by District and Level of Sales (FRW Tertiles)................................................ 83
Map 8. Sweet Pepper Sales by District and Level of Sales (FRW Tertiles) ................................ 84
Map 9. Tamarillo Sales by District and Level of Sales (FRW Tertiles) ........................................ 85
Map 10. Tomato Sales by District and Level of Sales (FRW Tertiles) ............................................ 86
Map 11. Other Vegetable Sales by District and Level of Sales (FRW Tertiles) ........................... 87
Map 12. Passion Fruit Sales by District and Level of Sales (FRW Tertiles) ................................. 88
Map 13. Pineapple Sales by District and Level of Sales (FRW Tertiles) ....................................... 89

vi | P a g e
Map 14. Other Fruit Sales by District and Level of Sales (FRW Tertiles) ..................................... 90
Map 15. Specialty Crops Sales by District and Level of Sales (FRW Tertiles) ............................ 91
Map 16. Organisations by Percent Female Membership (Quartiles) ............................................. 92
Questionnaire (Annex)
RHOS Database Variables and Parameters by Questionnaire Section (Annex)

vii | P a g e
ABBREVIATIONS
AGRER AGRER Etudes et Conseils ECO3 European Consultants Organisation EU European Union F&V Fruits and Vegetables FRW Rwandan Francs Ha Hectares HACCP Hazard Analysis and Critical Control Points HO Horticultural Organisation IPM Integrated Pest Management Kg Kilogram MINAGRI Ministry of Agriculture and Animal Resources MT Metric Ton NAEB National Agriculture Export Board NCCR Confederation of Coops of Rwanda RCA Rwanda Cooperative Agency RDB Rwanda Development Board (RDB) RHIO Rwanda Horticulture Inter-Professional Organisation RHOS Rwanda Horticulture Organisations Survey RPSF Rwanda Private Sector Federation USD US Dollars SqM Square Meters

1 INTRODUCTION & SUMMARY RESULTS
The 2013 Baseline Survey of Horticultural Cooperatives and Other Producer Organisations and Groups in Rwanda, (hereafter referred to as the Rwanda Horticulture Organisations Survey, or RHOS), is an initiative organised by the Rwanda Ministry of Agriculture and Animal Resources (MINAGRI) and the National Agriculture Export Development Board (NAEB). Funding support for the RHOS is provided by the Delegation of the European Union to Rwanda. It is designed to include all horticultural cooperatives/associations and companies, as well as a summary descriptive listing of all largeholder individual farmers, in all 30 of Rwanda’s districts.
The overarching goal of the RHOS is to support market-oriented agricultural production, job creation, poverty reduction and nutritional security in Rwanda via a vibrant and sustainable development of the horticulture sector. More specifically, the survey is designed to assess the current state of horticultural production, processing and marketing (including fruits, vegetables, mushrooms, flowers, essential oils and nuts), carried out collectively by cooperatives, associations and private horticultural companies (hereafter referred to as “horticulture organisations”). Of special interest are the capacities of these groups and companies, the constraints they face, and the kinds of interventions and support that will lead to greater development of Rwanda’s horticulture sector.
This report presents scientifically valid statistical information that will enable Rwanda’s horticulture stakeholders to improve sector planning, management, investment and policy decision-making, all crucial steps to achieving one of its chief Vision 2020 goals⎼⎼making horticulture one of the country’s leading economic drivers and a major contributor to the improved nutritional status of its people.
Also, as part of an evidence-based framework for development, the survey data provided in the tables, figures and maps in this this report will serve as a baseline against which future growth of the horticulture sector can be compared and evaluated. Simply the number of organisations today, or their revenue from sales or the markets they serve, when compared to the same figures three or five or ten years from now will be telling. Such comparisons will enable Rwanda to gauge the pace of its development and the success of its policies and investments.
This report presents and discusses many of the defining parameters of Rwanda’s horticulture sector, including production and sales of horticulture crops and products, area cultivated, geographic dispersion of organisations, market standards, gender of membership, and so on. However, it is important to note that as a baseline report its main goal is to provide a broad-based snapshot of the sector, not an in-depth analysis of its intricate details and myriad policy questions. At the same time, the great volume of data contained in the database are highly organised, clearly labelled and in a format that can be readily explored and applied to queries and detailed analyses from users in the future.
The report is organised into two major sections. The first is a review of the methodology employed through the development and fielding of the survey. The second is a presentation and summary discussion of many of the more fundamental and sector-defining data tables, figures and maps. Other basic tables are contained in the annex to the report, along with the survey

2 | P a g e
questionnaire (English version). Table 1 shown here below contains an “Executive Quantitative Summary,” presenting at a glance many of the key findings of the survey by province.
TABLE 1
Characteristic Rwanda Kigali South West North EastType of Organisation
Total Organisations 1,155 110 267 294 206 278 Nbr of Production Organisations 1,127 107 260 284 202 274 Nbr of Marketing Organisations 14 3 1 8 1 1 Nbr of Processing Organisations 14 - 6 2 3 3
RegistrationRegistered Organisations 804 85 174 177 152 216 Percent Registered 72.3% 82.5% 68.8% 62.3% 76.0% 79.4%
CertificationNbr Industry Certified Orgs 34 1 4 2 23 4Percent Certified 2.9% 0.9% 1.5% 0.7% 11.2% 1.4%
MembershipNbr of Members 60,657 5,237 16,931 11,922 9,395 17,172 Percent Female Members 56.5% 63.3% 60.7% 61.5% 47.3% 51.8%
Land Area in HorticultureTotal (Ha) 6,278 308 1,056 1,061 497 3,357 Fruits (Ha) 3,627 22 296 520 259 2,530 Vegetables (Ha) 2,574 259 758 510 221 826 Flowers (Ha) 77 27 1 31 17 1
Horticulture Production (Kg)Total (Kg) 29,728,155 3,799,510 9,170,344 5,672,678 3,220,142 7,865,481 Fruits (Kg) 5,935,558 38,896 1,102,286 1,255,357 1,678,631 1,860,388 Vegetables (Kg) 23,532,832 3,728,784 8,062,910 4,283,265 1,488,737 5,969,136 Other Hort (Kg) 259,765 31,830 5,148 134,056 52,774 35,957
Horticulture Sales (FRW)Total FRW 5,334,993,326 468,777,144 1,980,773,200 1,313,044,544 694,985,745 877,412,693 Fruits (FRW) 1,081,249,203 11,955,100 56,990,600 325,134,150 506,129,600 181,039,753 Vegetables (FRW) 4,125,193,962 428,505,044 1,918,677,000 920,408,033 180,175,945 677,427,940 Other Hort (FRW) 128,550,161 28,317,000 5,105,600 67,502,361 8,680,200 18,945,000
Principle Crops Sold1st crop Tomato French beans Onion Tomato Passion fruit Tomato2nd crop Onion Tomato Sweet pepper Passion fruit Tamarillo Pineapple3rd crop Sweet pepper Cabbage Tomato Carrot Pineapple Onion4th crop Passion fruit Eggplant Eggplant Tamarillo Tomato Cabbage
Processing Processing (Kg/Lt) 2,146,371 1,392,500 79,590 15,740 645,449 13,092 Processing (FRW) 1,794,356,400 1,461,580,000 40,195,000 22,620,000 262,294,000 7,667,400
Destination MarketsPct sold to own district 76.3% 61.8% 82.1% 76.0% 71.7% 80.3%Pct sold to own province 6.4% 9.9% 8.0% 5.5% 6.4% 4.3%Pct sold to other province 3.7% 11.6% 2.0% 3.5% 4.2% 2.2%Pct sold to Kigali 11.6% 16.6% 7.1% 9.9% 15.5% 12.6%Pct sold to African Countries 1.8% 0.0% 0.8% 4.9% 1.9% 0.3%Pct sold to MidEast and Europe 0.2% 0.0% 0.0% 0.3% 0.4% 0.4%
GreenhousesOrgs with Greenhouses 82 16 34 4 11 17 SqM in Greenhouse 27,678 9,452 9,094 1,184 4,318 3,630
Largeholder ProducersArea in horticulture crops (Ha) 712 38 142 60 49 424 Crop/Product sales (FRW) 527,525,142 85,114,200 87,343,942 64,199,200 40,198,000 250,669,800
Executive Quantitative Summary of Results by ProvinceProvince

3 | P a g e
2 METHODOLOGY & SURVEY IMPLEMENTATION
The major steps and activities undertaken in the development, fielding and data entry phases of the survey, including obstacles encountered and solutions found, are documented in this section of the baseline report. The section is organised in chronological fashion as illustrated in Figure 1, starting with the initial review of documents and data, through the consultative stages with stakeholders, training of supervisors and pretesting of the survey instrument and on to the data entry, processing and analysis of the data. The goal of this section is to provide users of the survey data with a thorough understanding of the where the data come from and a review of some of the more important considerations in their use and interpretation.
FIGURE 1
Desk study. The initial search and review of documents and data on Rwanda horticulture served to orient the advisory team to recent developments in the sector and to draw on the experiences of similar surveys in other countries. During this short phase the team was able to compile a listing of key constraints to horticultural growth identified in previous sector reports and studies. These constraints were condensed and categorised and served as the basis for several important themes in the questionnaire, such as “access to markets,” “competencies,” and “organisational management.” The review documents also helped to clarify the roles and responsibilities of the various institutional partners and other stakeholders. This phase was especially important in that it enabled the design team to understand what steps had already been taken (e.g., the previous horticulture listing) and to develop a forward-looking approach that builds on these previous efforts.
Consultations with stakeholders on survey design, methodology and calendar. Meetings were held with a range of horticulture stakeholders, particularly in NAEB and MINAGRI, the primary organisers of the activity. Among these consultations was the project “kick-off” meeting held at the Ministry of Agriculture. During this period the team was successful in collectively mapping out the initial survey design and methodology.
One of the more important conceptual issues taken under consideration was how to define “farmer organisations” for purposes of the survey. There are many farmer groups in Rwanda that claim to be legitimate “farmer associations,” but many are very small operations that are not registered or otherwise recognised as associations. There are others that are bona fide associations but horticulture may be just a very small production effort squeezed between maize or rice or other harvests that are the main focus of the organisation. To concentrate efforts uniquely on those organisations (and largeholder individuals) engaging in horticulture production, processing and marketing as a primary activity, the team established the following set of criteria, only one of which had to be satisfied to qualify for inclusion in the survey:

4 | P a g e
1. Horticulture in at least 0.5 hectare in collectively operated open field horticulture over the past 12 months.
2. Horticulture production in at least 100 m2 of collectively operated greenhouses over the past 12 months.
3. Horticulture gross sales of 5,000,000 FRW over the past 12 months.
Individual largeholder producers were also included in a separate listing of basic parameters if they met these criteria, with the exception of the individual pyrethrum producers. There are believed to be thousands of commercial pyrethrum producers that would meet these criteria and their inclusion would result in a very lopsided survey that would deviate from the core interest of the baseline, which is collective production and processing of fruits, vegetables, cut flowers and other specialty crops.
Collaborative development of the survey questionnaire. The development of the survey questionnaire, annexed here in English, constitutes one of the more intensive activities completed by the team. Its development was an iterative process that engaged stakeholders in question by question discussions and debate. While a few items were not included in the survey, due mainly to cost and time constraints, most of the major data components were retained in the final questionnaire. There are 14 sections to the questionnaire, each one dealing with a different priority aspect of horticulture production, processing and marketing. They include:
1. Organisation Identification 2. Organisation Basic Characteristics 3. Horticulture Production & Post-Harvest Handling 4. Horticulture Processing 5. Markets & Marketing 6. Land Access for Horticulture Production & Processing 7. Access to Inputs and Services 8. Buildings & Equipment 9. Credit & Finances 10. Technical and Managerial Competencies 11. Certifications 12. Sources of Horticulture Information 13. Partners & Support 14. Organisational Structure & Management
The questionnaire is organised as a structured interview with most questions being pre-coded for more expedient data processing. Interviewer instructions are included for most questions in the survey instrument itself. This helped to reduce errors significantly. The survey also includes some of the more advanced survey techniques such as Likert-type scaling and contingent valuation, both of which are designed to elicit more sensitive and nuanced variations in responses. Filter questions and skip patterns are also part of the instrument’s structure, helping to reduce the length of the interview in the field and to streamline data entry and cleaning in the home office.
The questionnaire was translated into Kinyarwanda for the pretest and for final fielding of the survey. Efforts were made to ensure accurate translations, a common source of error.

5 | P a g e
Development of the Interviewer/Supervisor Field and Training Guide. The Field and Training Guide is a useful document that provides practical information to assist project interviewers and supervisors (and data users) in the implementation of the survey. And it serves as a form of survey documentation as it provides a summary of the survey goals and methodology, including content, field structure and timeframe. It also reviews the primary responsibilities of the interviewers and supervisors, with guidance and expectations intended to improve the success of the interview. It introduces the interviewers and supervisors to the various types of questions found on the survey instrument and also provides a section-by-section review of those particular questions that need additional explanation and attention by the field team.
The Guide was translated into Kinyarwanda and was used extensively in the supervisor training program described below. The English version of the Guide can be obtained from NAEB upon request.
Consultations with the National Institute of Statistics Rwanda (NISR). By a Rwandan law, all national level surveys require approval (a “visa”) from the National Institute of Statistics. In a meeting with a NISR official the team was instructed in the submission process. A letter from the responsible agency, NAEB in this case, was required, along with copies of the questionnaire, survey methodology, survey calendar, and other documents. The NISR visa was received prior to fielding the survey.
Recruitment of supervisory team (province and national level). To ensure the highest quality of the survey, it was decided to set the number of enumerators at 36, one per district (30) plus an additional six that were provisionally engaged as substitutes. To manage these district-level enumerators the team recruited five province-based supervisors whose main responsibility was to support and monitor the enumeration at the province level, ensure quality control at all stages and assist with the training of enumerators. Their detailed responsibilities are listed in the Interviewer/Supervisor Field and Training Guide.
Supervisor training. A two day training session was conducted with the province supervisors during which they were informed about the survey and trained on the content of the questionnaire and how it was to be administered. Special attention was given to their quality control responsibilities and steps required in monitoring the performance of the interviewers. After the classroom training, the supervisors obtained practical training by participating as interviewers in the pretest of the questionnaire in two districts. They also contributed to the post-pretest review and revision as described below.
Implementation of the survey pretest. In the interest of improving the questionnaire and assessing the field conditions, a survey pretest was organised and carried out in two districts (Bugesera and Rulindo) known to be very active in the horticulture sector. The pretest was done on 10 HOs in one of the districts each day. Five survey teams were organised in each district with each survey team being comprised of two individuals (on average), a province supervisor and one of the members of the national team of NAEB, MINAGRI and external advisors. Teams visited one HO in the morning and another in afternoon for each of the two days. In total 20 HOs were visited and 20 questionnaires were completed.

6 | P a g e
Review and revision of the survey questionnaire & guide based on pretest results. A full day meeting was organised with the survey team, including technical staff from MINAGRI and NAEB as well as all five supervisors, to review and discuss the results of the pretest fielded during the previous two days. The result was a significant reformatting of several sections of the survey instrument that helped to reduce interview times from the 2½ - 3 hour range down to 2 - 2½ hours. This was an important savings and did not sacrifice much in terms of useful data. Much of the savings came from more efficient skip patterns and through the elimination of superfluous questions that did not add new information value to the questionnaire.
Survey implementation. The survey fieldwork was implemented in a series of organized steps including recruitment of field personnel, enumerator training, a listing of organisations and individual largeholder producers and completion of the interviews. Each of these steps is summarized in the paragraphs below.
Recruitment and training. The survey was fielded by a team of 36 district-level enumerators (30 district enumerators plus six “replacements”), five province-level supervisors and a national supervisor. Candidates for the supervisors and enumerators were recruited, with assistance from NAEB and MINGARI, from among their former employees and enumerators with experience in horticulture. Before their deployment in the field, enumerators received intensive interviewer training for a period of three days (18-20 November, 2013) to obtain a proper understanding of the questionnaire, field guide, methodology of the survey and their responsibilities. The field work was completed in two phases: (1) listing procedure, and (2) face-to-face interviews. The field work was closely monitored by a consulting advisor and two NAEB horticultural officers through a program of regular field visits to ensure that all activities were carried as accurately and on schedule.
Listing. The listing phase of the survey took six days to complete (21-26 November 2013). During this phase the enumerators, supported by their provincial supervisors, travelled to all 30 districts to identify and list all horticultural cooperatives/associations, private companies and individual large farmers. The listing phase was then finalised and the lists were checked and compiled by supervisors and entered into a control spreadsheet for final review and confirmation at the national level. A meeting was subsequently convened with all enumerators and supervisors to plan for the actual fieldwork which began December 2, 2013.
As a result of the listing exercise and continuing updates, the numbers of HOs identified came to nearly three times the number initially listed (398) by MINAGRI/NAEB in 2010. There had been much change in this dynamic sector over the three years since the initial listing. In total, 1,155 cooperatives/groups and private companies and 2,438 individual farmers were identified.
However, since it was not known how many of the individual farmers on the initial list actually fulfilled the three-pronged criteria for inclusion, the team was instructed to start by interviewing the cooperatives, groups and companies. During this interview period enumerators were instructed to continue to check with the individual largeholder farmers to confirm whether they met the criteria for inclusion. This confirmation was completed by seeking information from sector agriculture officers and from representatives of the interviewed cooperatives from the same sector.

7 | P a g e
Interviews. Following discussions among supervisors, enumerators, and MINAGRI/NAEB officers on numerous logistics arrangements, it was concluded that the most efficient way to carry out interviews and supervision was to send each entire province level team into one or two districts at a time. That way, every week, each team of 6-8 enumerators and one provincial supervisor was able to work together to complete interviews in two districts. With all five teams on the job simultaneously, 80% of the districts were completed in a 3 week period from December 2–22, 2013. The remaining HOs were interviewed between December 24, 2013 and January 3, 2014. In total, 1,155 HOs were interviewed in all 30 districts. During this period the team also completed interviews with 550 individual largeholder farmers that met the selection criteria. The largeholder farmers each received a basic set of questions to identify them, their locations, the main crops grown, area (Ha) cultivated, square meters in greenhouses and total sales.
It is important to note that cooperation among horticulture organisations was exemplary, with very few refusals. The field team is confident that they were successful in identifying and interviewing nearly 100% of producer organisations and most cooperatively run processors. However, it is important to note among processors that several private sector processors, particularly in Kigali province declined to be interviewed. Thus, national-level estimates of processed products (especially juices) are believed to be underestimated in the survey data. A supplementary post-survey follow-up with the major processors in Kigali and adjustments based on the NAEB Horticulture Processor Database, 2013, enabled more accurate national estimates of processed product in this report.
Prior to data entry, supervisors took time to check all questionnaires and correct errors that were identified.
Data entry. Data processing is a critical element of all large scale surveys. The team took care in developing the survey instrument to ensure rapid data entry and cleaning and to keep data entry errors to a minimum. Pre-coding, skip patterns and standardised response structure are some of the techniques used to achieve the goals of accuracy and timeliness. A data entry program developer and a team of 10 experienced data entry clerks were engaged to complete the data entry phase in early January. Data were entered using EpiData software and then exported to SPSS for further cleaning, restructuring and analysis.

8 | P a g e
3 SURVEY RESULTS
The survey results reviewed in this section provide a broad overview of the horticulture sector in Rwanda. The data, presented mostly as tables, figures and maps, are intended to give the reader an accurate, generalized understanding of the major parameters of the horticulture sector, how it is organised, where product is sold, the challenges faced, and the direction it is headed. As the title suggests, it is a baseline report, one that will enable sector planners and managers to track changes and compare with data in the future and with data from other countries in similar stages of development. The findings presented include many of the priority variables and estimates identified by stakeholders.
There are over 600 variables in the survey, each with its own significance. While it is not possible to present and discuss each of these variables in this baseline report, summary statistics for each variable can be found in annex to this report. Also provided in annex is a series of “most essential” tables and maps. These include major estimates of production and sales by district, by province and by crop (or crop group). For convenience, these tables and maps are listed in the report’s table of contents. Other tables and analyses not included here can be obtained upon request to NAEB/MINAGRI. The date files have been organised and labelled in such a way as to facilitate such requests and more in-depth analysis.
TABLE 2
The RHOS data base is far reaching and rich in the information it contains. The data base is comprised of 10 interrelated files corresponding to each of the levels of observation incorporated into the questionnaire (see Table 2). While most variables are at the organisation level (N=1,155), others are at the crop level (Section 3 of the questionnaire), at the product level (Section 4), and so forth. All ten files are linked by the “KeyID” variable, making analysis among and between files possible. The analyses presented in the subsections that follow include data from all ten of these files, and many draw upon multiple files, as necessary.
Questionnaire Section Questions on… Level NSection 1 ID and diverse areas (main questionnaire) Organisation 1,155Section 2 Organisational Characteristics Organisation 1,155Section 3 Crop Production, Inputs Use and Sales Crop 3,171Section 4 Processed Products Production and Sales Product 40Section 5 Markets & Marketing Organisation 1,155Section 6 Land by Use and Ownership Category Land Category 17,325Section 7 Access to Inputs & Services Input/service 26,565Section 8 Buildings & Equipment Organisation 1,155Section 9 Credit & Finances Loan 184Section 10 Technical and Managerial Competencies Competency 13,860Section 11 Industry Certifications Organisation 1,155Section 12 Access & Sources of Information Information type 25,410Section 13 Partners and External Support Support type 1,224Section 14 Organisational Strength & Cohesiveness Strength indicator 16,821Largeholder survey ID and diverse areas (main questionnaire) Largeholder 550Largeholder survey Crops grown Crop 974
Levels of Observation and Analysis from the RHOS Questionnaire
9 | P a g e
3.1 Horticulture Organisations, Membership and Geographic Distribution
Section Contents
Organisations by District ....................................................................................................................................................... 10
Growth of Horticulture Organisations ............................................................................................................................. 11
Organisational Status & Primary Activity ...................................................................................................................... 11
Membership Composition ..................................................................................................................................................... 14
About the Data in this Section
Questionnaire Section Questions on… Level N
Section 1 ID and diverse areas (main questionnaire) Organisation 1,155
Section 2 Organisational Characteristics Organisation 1,155
Section Tables, Figures and Maps
Figure 2. Distribution of Horticulture Organisations Province and District ......................................... 10
Figure 3. Number of Horticulture Organisations by Year Established ..................................................... 11
Map 1. Organisation Type by District ................................................................................................................. 12
Table 3. Type and Primary Activity of Organisation by Primary Source of Revenue ...................... 13
Table 4. Male and Female Membership by Organisation Type .................................................................. 14

10 | P a g e
Organisations by District. The Rwanda Horticulture Organisations Survey, 2013, listed and then interviewed a total of 1,155 organisations, believed to be a near complete enumeration of all such organisations in existence in Rwanda at the time. As detailed in the methodology section, interviewers conducted a complete search and listing of all the horticulture organisations in their districts, with the assistance of the district level horticulture agents. Figure 2 reports the distribution of these organisations across the country, revealing that all provinces and districts are engaged in a significant level the collective production of horticulture crops and products. All provinces except for Kigali are home to at least 200 organisations, with the West containing the most at 294 organisations. Kigali Province, with only three districts, has 110 horticulture organisations. The average number or organisations found per province is 231.
FIGURE 2

11 | P a g e
Viewed by district, one finds that the numbers of organisations ranges from 16 in Gisagara to 77 in Gicumi, with and overall average of 38.5 organisations per district. Every province has districts with organisations numbering both above and below that average, a good indicator of the pervasiveness of horticulture production, processing and marketing in Rwanda.
Growth of Horticulture Organisations. Collective production of horticulture crops in Rwanda dates back to the 1960s for some of the more established cooperatives and associations. Figure 3 shows the progressive growth of horticulture organisations in since these early times. What is especially illuminating in this figure is that over half of the organisations in existence today have been established since 2010, and over 90% have formed since the year 2000. This development is a tribute to the Rwanda’s emphasis on horticulture as a cornerstone in the strategy to commercialise and modernise the country’s agricultural economy. Clearly, efforts to promote the horticulture sector have paid off in terms of the sheer numbers of organisations and their members.
FIGURE 3
Organisational Status & Primary Activity. Horticulture organisations in Rwanda can be defined and categorised in many different ways. One of the more important groupings often used for legal and administrative purposes is whether and how organisations are registered, either locally or nationally. The major types of registration are: registered cooperatives, registered associations and private sector companies. There are also a sizable number of associations that are unregistered.
How these different types of organisations are dispersed geographically can be viewed in Map 1. One is struck by the extent to which organisations of all types are represented in virtually every corner of the country. While there are recognisable clusters of organisations around Kigali, Gisenyi/Goma, along the southern border at Bukavu and elsewhere in the country, no discernible concentration of cooperatives versus associations, registered or unregistered, becomes immediately apparent. By contrast, private sector companies do tend to cluster, with

12 | P a g e
groupings near the urban centres of Kigali and Butare, and a smaller cluster in Rulindo and adjacent districts in the North.
Most horticulture organisations in Rwanda are officially registered, with over half (52.6%) of the horticulture organisations in Rwanda being registered cooperatives and another 16.7% being registered as associations. The smallest group of registered organisations is the 38 private sector companies (3.3% of organisations). There are 313 (27.1%) organisations that are not registered.
MAP 1
How do these groups differ in terms of their primary sources of revenue? One concludes from Table 3 that cooperatives and associations tend to be very similar in what they do. Approximately 35% of all three groups derive their primary earnings from fruit sales, and another 60% primarily from vegetables. We know from parallel analyses (not shown here) that cooperatives and registered associations tend to be older organisations, where unregistered associations are younger, most having been established only in the past three years. We expect that many of the associations that are unregistered today will be registered with one of the registering entities (NCRR, RHIO, RCA, RDB) in the coming years, as they mature and show greater sustainability for the long term.
Private companies differ from the cooperatives and associations in their greater likelihood of being in the business of horticulture processing, such as the production of juices and preserves, but like cooperatives and associations, the production of fruits and vegetables is far and away their most remunerative revenue source. As we will see later on, fruit and vegetable processing

13 | P a g e
tends to be done by private sector firms, most often located in relative proximity to urban markets. The greater capital requirements and level of technical expertise demanded are among the reasons that private sector companies constitute a larger share of organisations engaged in processing.
The lower portion of Table 3 is similarly revealing in terms of primary domains of activity, with just under two-thirds of production and marketing organisations being engaged primarily in vegetables and just over a third engaged in fruits. As will be seen in the following sections, this pattern is by no means constant across the country. There is considerable regional specialisation in where fruits and vegetables are produced.
TABLE 3
OrganisationCharacteristic Fruits Vegetables
Other hort crops
Hort processed
products Total
Organisation TypeCooperatives (reg) N 216 369 13 9 607
% 35.6% 60.8% 2.1% 1.5% 100.0%Associations (reg) N 68 121 4 - 193
% 35.2% 62.7% 2.1% 0.0% 100.0%Associations (not reg) N 121 189 2 1 313
% 38.7% 60.4% 0.6% 0.3% 100.0%Private companies N 9 23 2 4 38
% 23.7% 60.5% 5.3% 10.5% 100.0%Other N 2 1 1 - 4
% 50.0% 25.0% 25.0% 0.0% 100.0%Total N 416 703 22 14 1,155
% 36.0% 60.9% 1.9% 1.2% 100.0%
Primary ActivityProduction N 411 694 22 - 1,127
% 36.5% 61.6% 2.0% 0.0% 100.0%Processing N - - - 14 14
% 0.0% 0.0% 0.0% 100.0% 100.0%Marketing N 5 9 - - 14
% 35.7% 64.3% 0.0% 0.0% 100.0%Total N 416 703 22 14 1,155
% 36.0% 60.9% 1.9% 1.2% 100.0%
Type and Primary Activity of Organisation by Primary Source of Revenue
Primary Source of Revenue(based on sales - FRW )

14 | P a g e
Membership Composition. Table 4 provides a look at the how the membership of each type of cooperative and association is distributed by gender. Overall, there are 60,657 members of horticulture cooperatives and organisations in Rwanda. Cooperatives are the largest category by membership at 67.1%, with registered and unregistered association members comprising the remaining 32.9% in roughly equal proportions. Women in horticulture outnumber men by a significant margin, accounting for 56.5% of the total membership compared to men at 44.5%. While that pattern holds across all types of organisations, women’s membership (as a percentage of total membership) is the highest in registered organisations (65.0%) and the lowest in cooperative organisations at 54.5%.
TABLE 4
N % N % N %
Cooperative reg 18,497 70.1% 22,196 64.8% 40,693 67.1% 54.5%Association reg 3,752 14.2% 6,966 20.3% 10,718 17.7% 65.0%Association not reg 4,148 15.7% 5,098 14.9% 9,246 15.2% 55.1%
Total 26,397 100.0% 34,260 100.0% 60,657 100.0% 56.5%
Male and Female Membership by Organisation Type(Cooperatives and Associations)
Percent Female
Organisation Type
Male Membership
Female Membership
Total Membership

15 | P a g e
3.2 Horticulture Sales, Production and Area Cultivated
Section Contents
3.2.1 Horticulture Sales Values and Volumes by Crop ....................................................................................... 16
3.2.2 Horticulture Sales Value, Volumes and Area Planted by Province and District .......................... 17
3.2.3 Processed Horticulture Products ..................................................................................................................... 20
About the Data in this Section
Questionnaire Section Questions on… Level N
Section 3 Crop Production, Inputs Use and Sales Crop 3,171
Section 4 Processed Products Production and Sales Product 40
Section 6 Land by Use and Ownership Category Land Category 17,325
Section Tables, Figures and Maps
Figure 4. Percentages of Total Value (FRW) of Horticulture Sales by Crop Category ....................... 16
Figure 5. Value of Crops (FRW) Sold by Horticulture Organisations ........................................................ 18
Figure 6. Volume of Crops (Kg) Sold by Horticulture Organisations ........................................................ 19
Figure 7. Area (Ha) Planted in Crops by Horticulture Organisations ....................................................... 20
Table 5. Processed Product Sold (Kg/Lt) and Value of Sales ...................................................................... 21
Figure 8. Production (Lt/Kg) of Processed Products by Horticulture Organisations ....................... 22
16 | P a g e
3.2.1 Horticulture Sales Values and Volumes by Crop
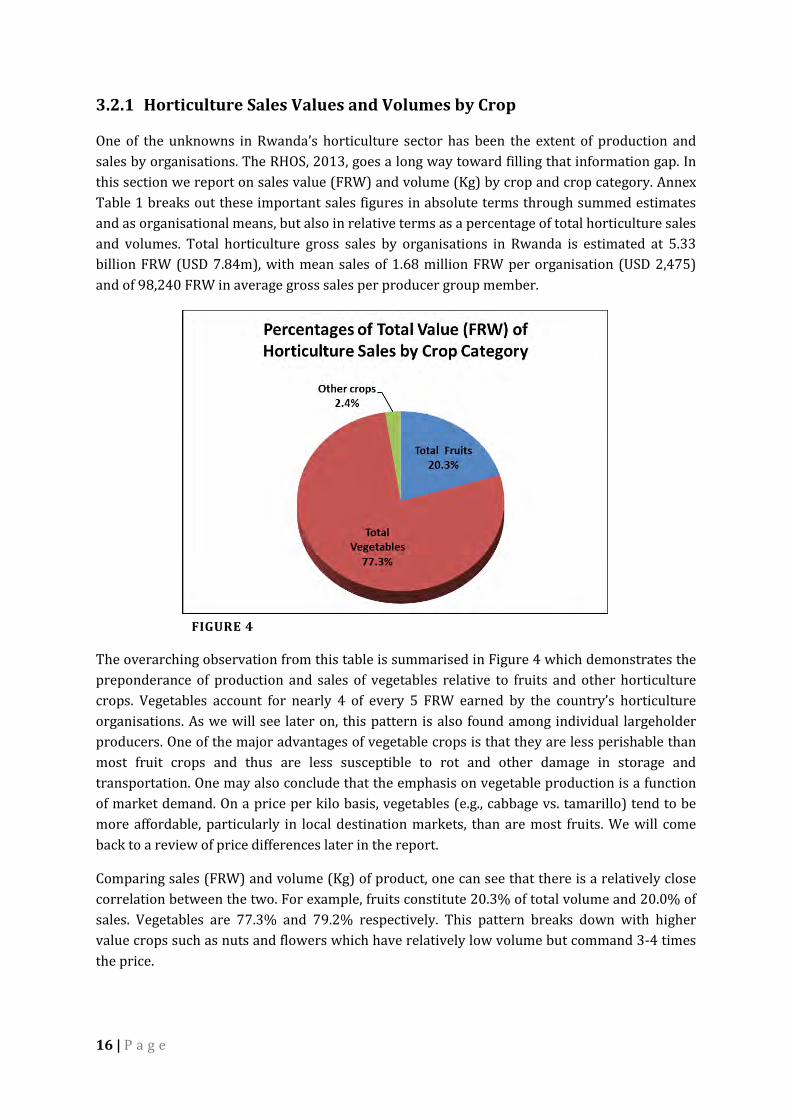
One of the unknowns in Rwanda’s horticulture sector has been the extent of production and sales by organisations. The RHOS, 2013, goes a long way toward filling that information gap. In this section we report on sales value (FRW) and volume (Kg) by crop and crop category. Annex Table 1 breaks out these important sales figures in absolute terms through summed estimates and as organisational means, but also in relative terms as a percentage of total horticulture sales and volumes. Total horticulture gross sales by organisations in Rwanda is estimated at 5.33 billion FRW (USD 7.84m), with mean sales of 1.68 million FRW per organisation (USD 2,475) and of 98,240 FRW in average gross sales per producer group member.
FIGURE 4
The overarching observation from this table is summarised in Figure 4 which demonstrates the preponderance of production and sales of vegetables relative to fruits and other horticulture crops. Vegetables account for nearly 4 of every 5 FRW earned by the country’s horticulture organisations. As we will see later on, this pattern is also found among individual largeholder producers. One of the major advantages of vegetable crops is that they are less perishable than most fruit crops and thus are less susceptible to rot and other damage in storage and transportation. One may also conclude that the emphasis on vegetable production is a function of market demand. On a price per kilo basis, vegetables (e.g., cabbage vs. tamarillo) tend to be more affordable, particularly in local destination markets, than are most fruits. We will come back to a review of price differences later in the report.
Comparing sales (FRW) and volume (Kg) of product, one can see that there is a relatively close correlation between the two. For example, fruits constitute 20.3% of total volume and 20.0% of sales. Vegetables are 77.3% and 79.2% respectively. This pattern breaks down with higher value crops such as nuts and flowers which have relatively low volume but command 3-4 times the price.

17 | P a g e
What are the predominant crops produced in each of these major crop categories? Among fruits, pineapple is by far the largest in volume at 12.8 percent of total horticultural production. Passion fruit (3.5%) and tamarillo (2.6%) come in a distant second and third. No other fruit crops produced by organisations in Rwanda amount to more than a few tenths of a percent of total national horticulture production. As a function of sales value, the big three (pineapple, passion fruit and tamarillos) constitute nearly 95% of all fruit sales. The difference, when compared to volumes, is that the order of importance shifts so that passion fruit and tamarillos take on a relatively higher position due to their higher per kilo cost.
Vegetables sales by organisations are dominated by tomatoes (28.4%), onions (14.2%) and cabbages (12.8%), by volume of total horticulture production. These crops are also very important in terms of sales value, but sweet pepper surfaces as one of the more important vegetable crops (11.5%) of all sales due to its high price per kilo. Other crops that round out the vegetable segment of horticulture markets are carrot and eggplant, commanding 4.5% and 6.3% of market share, respectively. Mushrooms are noteworthy not because of volume or total sales, both of which are small; rather, they are a crop that is unusually light in weight, yet relatively high in price. Mushroom sales value is five times its volume in percentages. Crops with high price to weight ratios can be more competitive in distant, higher-end markets, particularly for highly perishable products that require air transport.
Rwanda’s horticultural organisations have not yet embraced the production of low-volume, high-value specialty products such as herbs & spices, nuts, and flowers (fresh-cut and industrial). Together, all of these specialty crops amount to less than one percent of total horticulture production volume. Yet their sales value is close to 2.5% of organisational horticulture sales. Nearly half of this value comes from macadamia nut, and that is produced by just three organisations; over half of this macadamia production comes from a single private sector enterprise.
3.2.2 Horticulture Sales Value, Volumes and Area Planted by Province and District
Horticulture production is highly dispersed in Rwanda. All 30 of the country’s districts are home to a variety of organisations that produce fruits vegetables and other products. While production is dispersed across the country, that is not to say that it is uniform either in terms of volumes produced or in which crops are grown, processed and/or marketed. A detailed table showing crop sales by province and district (Table 4) can be found in Annex 1. Highlights from that table are provided in the present section.
We start with a comparison of overall value of horticultural sales by province. As Figure 5 shows, the highest overall value of production comes from the South and West provinces, together with nearly 3.3 billion FRW in sales. Both of these provinces stand out in the value of their vegetable production. But that is only part of the story. While the South and West provinces are highly productive, their production is concentrated in a small number of high-producing districts. In the South, nearly all horticulture sales (91.8%) are concentrated in Kamonyi where exceptionally large volumes of cabbage, onion, sweet pepper and French bean are produced. And in the West, over half of the region’s sales are in Rusizi district. Both Kamonyi

18 | P a g e
and Rusizi stand out entirely in their preponderance of vegetable sales, particularly cabbage, onion, sweet pepper in Kamonyi and tomato in Rusizi. These district level concentrations of horticulture crops are consistent with data reported in 2008 by RHODA on tomato production in Rwanda.
FIGURE 5
The North province is noticeably low in its vegetable production, the lowest of all five provinces. But this may be a reflection of the region’s ecological suitability and unique specialisation in Irish potato production. For the purposes of the RHOS, Irish potato is treated as a “field crop” like sweet potato, cassava and other tubers in Rwanda and thus was not included in the survey. There are hundreds (possibly thousands) of producer organisations focused on potato in the North province and this is undoubtedly one contributing factor to the low output of vegetable crops in the region.
However, despite low (non-potato) vegetable production, the North province boasts far and away the highest level of fruit sales at over 500 million FRW per year, nearly half of the entire country’s fruit sales. The prolific fruit production of two northern districts, Gakenke (in passion fruit and pineapple) and Gicumbi (in passion fruit) provide the vast majority of these sales.
The West province is the source of Rwanda’s most balanced production of horticulture crops. In addition to its strong fruit and vegetable production the West is Rwanda’s leader in the small but high value category of “other horticulture crops” including nuts, herbs & spices, flowers and other products. Over half (52.5%) of these specialty horticulture crops comes from the West

19 | P a g e
province. Two districts stand out in this domain, the first is Karongi which is home Rwanda’s largest macadamia nut producer and the other is Rubavu, a district whose organisations produce and sell more cut flowers than any other. Rubavu is also a leader in the sales in the herbs & spices category.
Being productive in terms of crop sales is not exactly the same thing as being productive in volumes of horticulture products. This is because prices for fruits and vegetables can vary a great deal, and prices are not necessarily stable, showing considerable variation from year to year and even from one district to another for the same crop. For this reason we include Annex Table 5, “Volume of Crops Sold (KG) by Horticulture Organisations in Rwanda,” broken out by crop category, province and district." Overall, Rwanda’s organisations produced 29.7 thousand tons of horticultural products. Four fifths of that production is in vegetables and 20% is in fruits, closely mimicking the general proportions in FRW value reported earlier. A subtle difference is found in specialty products, where volume (weight) tends to be very low relative to price. Flowers and herbs & spices, for example, are products that are low in volume but high in price. Consequently these products only account for 0.9% of volume but 2.4% of sales value. Though small by comparison to fruits and vegetables production, this finding is highly instructive for strategic planning for horticulture exports where product weight is known to be a major barrier.
FIGURE 6
Perhaps the most visible difference in comparing the regional distribution of production volumes to sales value is seen in the East province where the volume of F&V leaps from 16.4% of value to 26.5% of weight (Annex Table 5). This is because the East tends to produce higher amounts of low-value fruits (e.g., pineapple) and vegetables (e.g., tomato) relative to other regions. We speculate that the greater availability of land in the East, as will be shown later in

20 | P a g e
this section, reduces the pressure on organisations and individual farmers to produce crops that yield a higher value per hectare.
The preponderance of pineapple production in the East emerges again in Figure 7, which breaks out area (Ha) by the major crop category and province. Overall, the East accounts for over half (53.5%) of all area in horticulture crops in Rwanda. The vast majority of that area is in pineapple. Vegetable crops in the East are also substantial and tomato comprises the largest share of that area. This regional comparison of area in crops also reveals fundamental differences in productivity. Production in the East province is more “extensive” than in other provinces. In other words, land area in horticulture is high, but measured in terms of volume, and especially of value, the East does not show a corresponding advantage. Indeed, as a function of value, the east region is close to the national average and in fruit production is on the lower end. Other provinces, such as the South, show a more “intensive” system of horticulture production with a modest 1,056 hectares in horticulture crops but producing more in volume and value than the East derives from three times the area⎼⎼3,357 hectares in horticulture.
FIGURE 7
3.2.3 Processed Horticulture Products
Nearly all of Rwanda’s horticulture products are consumed fresh and are sold in local markets. Processed foods are available on market shelves in Kigali and elsewhere in Rwanda and some of them are produced in Rwanda. But most of those products are not locally produced, and fruit and vegetable products are few and far between. Of the 1,155 horticulture organisations in

21 | P a g e
Rwanda only 14 (1.2%) of them are primarily engaged in processing. This figure is adjusted upward to 20 when including processors in Kigali that declined to be interviewed.
As shown in Table 5, there are also very few processed products produced by organisations in Rwanda. Juices, mainly pineapple and passion fruit, are the one product that appears in significant volume at 2.05 million litres per year, with total sales of 1,794 million FRW. Juices comprise 92.8% of production and 95.8 percent of sales. Preserves (pineapple, strawberry, gooseberry) and dried fruit and nuts account for the small fraction remaining.
TABLE 5
One point bears repeating from the earlier discussion of the survey fieldwork. It is that a number of major processors in Kigali province, notably those engaged in the production of juices, declined to be interviewed. Their production and sales figures are available for inclusion from the Horticulture Processors Database Report compiled by NAEB in 2013.
Broken out by province, one notes that processed horticultural products are concentrated in Kigali and to a lesser degree in the North province (Figure 8). This is due the location of juice processors in the two regions, particularly passion fruit and pineapple juices. It is not surprising to find that the North province is home to so much of Rwanda’s juices as it is by far the most productive region in passion fruit (74% of national production).
Processed Product N Kg/Lt % FRW %Total Hort Products 40 2,134,812 100.0% 1,794,356,400 100.0%
Dried Fruits 2 108 0.0% 701,400 0.0%Juices 33 2,046,764 95.9% 1,665,745,000 92.8%Preserves 4 1,340 0.1% 2,960,000 0.2%Other Product 1 86,600 4.1% 124,950,000 7.0%
*Includes Kg and FRW reported for Kigali processors in Horticulture Processors Database, NAEB 2013
Processed Product* Sold (Kg/Lt) and Value of Sales (FRW)
Quantity Product Sold(Kg or Lt)
Value of Sales(FRW)

22 | P a g e
FIGURE 8

23 | P a g e
3.3 Horticulture Markets
Section Contents
3.3.1 Market Outlets for Horticulture Products .................................................................................................... 24
3.3.2 Destination Markets for Horticulture Products ......................................................................................... 25
3.3.3 Current and Future Market Requirements .................................................................................................. 27
About the Data in this Section
Questionnaire Section Questions on… Level N
Section 3 Crop Production, Inputs Use and Sales Crop 3,171
Section 4 Processed Products Production and Sales Product 40
Section 5 Markets & Marketing Organisation 1,155
Section Tables, Figures and Maps
Figure 9. Organisation Crop Sales and Market Outlet...................................................................................... 24
Figure 10. Mean Market Prices by market Outlet and Crop Type ................................................................. 25
Figure 11. Comparison of Current and Preferred Future Markets ............................................................... 26
Figure 12. Standards Required by Current Buyers.............................................................................................. 27
Figure 13. Most Important Challenges to Accessing Preferred markets in the Future ....................... 28
Table 6. Organisations Certified or in the Process of Certification by Type of Certification ........ 29
Map 2. Certification Status by District ................................................................................................................ 30

24 | P a g e
3.3.1 Market Outlets for Horticulture Products
Organisations, be they producers, processors or marketing firms, establish marketing channels for their products. The four most common buyers for these horticulture products are wholesale traders, retail traders, processors and cooperatives, and other specialty retail markets. There are important differences among these buyers and the prices they pay for products. Wholesale traders are those who generally buy higher volumes of product and transport it to larger markets where they sell to other wholesalers or retail buyers. In terms of total sales, they are an important market channel for product from horticulture organisations in Rwanda, at 38% of product value. Retail traders are the largest buyer of product from organisations at 52% of product sales. They typically sell their product on retail markets either locally (same district or province) or in more distant markets such as Kigali. There is a very small buyer group which is comprised of processors and other cooperatives. These are wholesale buyers but often work under contract with the producer groups. Juice processors, for example often buy passion fruit or pineapple from producer organisations on seasonal contracts. The same tends to be true for tomato processors. The final buyer group is here classified as “specialty retail.” These buyers comprise 8% of the market and include supermarkets, hotels, schools, prisons and the like.
FIGURE 9
Figure 9 shows how these market channels differ by horticulture crop type. Organisations marketing their vegetables, for example, tend to lean toward wholesale buyers, where fruits are more often sought out by retail buyers (traders and specialty) and also constitute a significant share of sales to processors and other coops. This reflects the predominance of fruit juices in domestic agricultural processing. Other horticulture crops such as flowers, nuts, herbs & spices are rarely sold to wholesalers in Rwanda and instead lean heavily toward processors and specialty markets. As we will see later on, much of these specialty products are destined for

25 | P a g e
Kigali, where the specialty markets are more developed, a reflection of urban consumer preferences.
FIGURE 10
Comparing mean market price of sales for the four market outlets and three product categories in Figure 10, one notes a general trend across products moving from wholesale traders to retail traders to other retail/specialty. Sales to processors are among the lowest prices received. There are two important reasons for this. The first is that processors very often work on contract, and this is found in the present survey data as well. A contract price is often lower than spot market prices because it is a guaranteed price and thus comes with lower risk. The second reason is that processors often take lower quality product as its appearance does not have to please the consumer buying fresh product in the marketplace. These “seconds” are commonly used for juice and other processed products.
3.3.2 Destination Markets for Horticulture Products
The previous section reported on market channels that are defined by the buyers and the particular segments of the horticulture sector in which they operate. This section examines market destination, which, though related to market channels, also has a geographic component and a strong consumer demand component. While almost all sales by organisations are made at the wholesale level, to traders who then sell either on the wholesale or retail markets, organisations are generally very aware of where there product goes once sold, they know if it will be sold locally, to other provinces, to Kigali city, or through cross-border channels to Uganda, DRC, Burundi or elsewhere. They generally sell to traders whom they know and trust, and they have a good sense through experience and personal relationships in which destination markets their products are ultimately sold. Organisations were asked about the percentages of their current sales going to various destination markets, starting with the local district markets and all the way up the scale to international export markets such as Europe and the Middle East.

26 | P a g e
They were also asked to identify which markets they would prefer to sell to in the next three years. These market-specific percentages and preferred markets are averaged across all organisations to produce the mean percent sales to each market and the percent identifying each of the preferred markets. Both indicators are presented in Figure 11.
At the most obvious level, one concludes that destination markets lean strongly toward local consumption, as the bulk of product sold (72.4) by organisations never leaves the district in which it is produced. The rest is split between the Kigali market and the organisation’s own or other provinces. That pattern differs from what organisations say are their preferred markets over the next three years. They are clearly looking to expand beyond the local district markets, particularly to Kigali (28.3%) where they know that prices are higher. They also show greater interest in selling their product across a range of international markets, expanding from a negligible level currently (2.1%) to and overall 12.1% in the future. Most of this international market growth is envisioned to neighbouring African countries, notably DRC, Burundi, and Uganda, where prices can also be more competitive than in their home districts. The high concentrations of producer associations in border areas that supply the urban Goma and Bukavu markets are similarly indicative of this opportunity for Rwanda’s producers.
FIGURE 11
Only three organisations report a significant share of their product going to the higher end European and Middle Eastern markets. That organisations so rarely envision moving to these markets is likely a reflection of how little they know about them, other than a general awareness of the more exigent requirements and the challenges of meeting those requirements. In the following section we look more closely at the market requirement for current sales and perceived requirements for sales in preferred future markets.

27 | P a g e
3.3.3 Current and Future Market Requirements
Because most organisations sell principally to buyers on local (district) markets, product requirements are relatively relaxed. So long as growers can meet product size and colour expectations, as well as selling in adequate volume, their buyers will be generally satisfied (Figure 12). The volume requirement may exclude many of the smaller and disadvantaged organisations (e.g., women’s groups) that do not have access to larger tracts of land. Larger volumes are also generally associated with more distant markets, such as the Kigali and other urban destinations where prices are invariably higher.
Some of the more exigent standards that characterise higher-end export markets are rarely identified by Rwanda’s producer organisations. These include public standards such as food safety and phytosanitary certification as well as private standards including packaging & labelling and industry certifications such as Fair Trade. These are among the product standards that the Kenyan and South African producers regularly face in a more mature horticultural sector.
FIGURE 12
But these more stringent market requirements are not exclusively tied to export markets. They are also standards that are adopted by many of the larger urban market buyers. Nakumatt supermarkets is a good example as this is a Kenyan chain that is doing business throughout East Africa and has now opened a store in Kigali. And other, competing regional chains are surely coming: Uchumi and Shoprite also support aggressive growth strategies in the region and it may not be long before they, too, arrive in Rwanda.
As Rwanda begins to expand into these more mature markets in the coming years, particularly in Kigali and some of the secondary urban areas, there will be growing pressure to conform to public and private industry standards. The challenge for Rwanda’s growers and processors will be in developing the capacity to meet those standards and capture greater market share.

28 | P a g e
Currently the Nakumatt store in Kigali supplies very little product from Rwanda. South African and Kenyan labels are far more common. An important goal for Rwanda’s horticulture producers, particularly for associations that can sustain high volumes of product, will be to tap into these local high-end markets and begin to supply greater amounts of high quality products to urban markets.
In the longer run, Rwanda may also envision taking on contracts with the regional supermarket chains that will enable access to urban markets in Uganda, Kenya and other countries in the region. But that will require building the capacity to meet increasingly stringent market requirements. There is a small cadre of organisations that is gaining an appreciation for what will be required. This way of thinking emerges in Figure 13, which reports on the challenges that organisations expect will be their most important in accessing preferred markets in the future. Packaging (18.4), market information (26.8%), and industry certification (11.4%), for example, are challenges that show up in sufficiently high frequency to suggest that producer groups have a growing awareness of what will be required, even if they are not able to conform to these standards now. That is an encouraging sign.
FIGURE 13
But for now the most important challenges to preferred markets are more fundamental. They include: how to deal with long distances and poor infrastructure, meeting market price points and doing so in sufficient volume as to attract wholesalers and retailers that do business in these markets. Some of these changes lie beyond their immediate control. Geographical proximity and paved roads benefit some, but not others. It is noteworthy, however, that recognition of these constraints appears to have led to the growth of associations in areas where transportation networks are more highly developed. Virtually all of the maps in annex to this baseline report demonstrate that organisations are not randomly distributed across the

29 | P a g e
countryside. They tend to be clustered along the national routes, most notably those leading to and from Kigali.
Certification. Although there seems to be some awareness of the importance of private standards and how certifications such as organic, Fair Trade and GlobalGAP can lead to higher prices, it is clear that organisations are still a long way from embracing the concept. Currently only 17 organisations (1.47%) hold certification of any kind, and over half of these are local, Rwanda Bureau of Standards (RBS) certifications (Table 6). More promising is that another 56 organisations are now in the process of becoming certified, and 20 of these are higher-end international certifications. This finding demonstrates that there is rapidly growing interest in accessing international markets.
Stated certification plans for future years is similarly indicative of the growing interest in accessing higher end markets. Over 20% of Rwanda’s organisations are planning to pursue one or more certifications in the next three years. While half of these are local, RBS certification, the other half is planning on seeking organic, Fair Trade or GlobalGAP certification. This will be an important figure to track in the coming years to see whether this growing level of interest will actually materialise, and if so, whether it can be sustained.
TABLE 6
Who are these organisations that are oriented toward certification, i.e., those who have already been certified or are working toward or planning for certification? Where are they located? What crops are they producing? A quick review of the survey data shows that organisations that are certification-oriented tend to have larger membership, more assets, cultivate more area and have greater sales. In other words, being big, established and commercially oriented translated into considerably greater interest in certification and the benefits that it can bring. Compared across regions, there does not appear to be a clear pattern, as organisations from all regions seem to be expressing interest in the range of 10-20%. It was surmised that Kigali
Currently Certified
Certification in Process
Certification Planned for next 3 years
(N) (N) (N)RBS certification 10 36 116Organic certification 2 11 71Fair Trade certification 3 4 26GlobalGAP certification 1 3 20HACCP certification 1 2 2UTZ certification 0 0 0
Total Certified 17 56 235
Total N 1,155 1,155 1,155
% Certified, in process or planning 1.47% 4.85% 20.35%
Organisations Certified or in the Process of Certification by Type of Certification

30 | P a g e
province might be more advanced than others in this regard but that is not the case (see Map 2). Kigali is actually lower than all other regions in their numbers certified or in the process of certification, yet organisations in Kigali are more advanced, at 20%, than any other region in terms of their plans for certification over the next three years.
MAP 2
Noteworthy is that fruit and vegetable growers do not differ in their interest in producing certified crops. This is true for actual certification, those in the process and those just in the planning stages. They are remarkably alike in that regard. Not surprisingly, the one group that differs substantially from the others is the horticulture processors, who are dramatically higher than fruit and vegetable growers in all categories of certification. Indeed of the 14 processors in the survey, only one is not at least planning to become certified in the next few years. The predominant certifications of interest to the processors are RBS and organic certification. The high level of RBS certification is anticipated as all of the country’s processors are expected to be RBS certified as a public health (food safety) measure.

31 | P a g e
3.4 Accessing Agricultural Inputs, Services & Information
Section Contents
3.4.1 Intensification through Improved Inputs ..................................................................................................... 32
3.4.2 Access to Inputs & Services ................................................................................................................................. 33
3.4.3 Sources of Information for Improved Horticulture Practices & Management ............................. 37
About the Data in this Section
Questionnaire Section Questions on… Level N
Section 3 Crop Production, Inputs Use and Sales Crop 3,171
Section 8 Buildings & Equipment Organisation 1,155
Section 12 Access & Sources of Information Information type 25,410
Section Tables, Figures and Maps
Table 7. Intensification Investments by Selected Inputs/Practices and Crop Category ................ 32
Table 8. Organisations Reporting Poor Access to Selected Inputs/Services by Main source of Revenue ........................................................................................................................................ 34
Figure 14. Organisations Reporting Poor Access to Intensification Inputs and Services by Main Source of Revenue ............................................................................................................................ 35
Figure 15. Primary Constraints to Access to Inputs and Services ................................................................ 36
Figure 16. Sources of Information Received by Organisation by Type of Information ....................... 37

32 | P a g e
3.4.1 Intensification through Improved Inputs
Intensification through the adoption of improved inputs and practices is one of the guiding themes of Rwanda’s agricultural strategy. It is envisioned that through land consolidation and specialisation the country’s producer organisations will achieve greater economies of scale, making the cost of inputs more affordable and their adoption more practical. This subsection reviews the extent to which this vision has taken root. Table 7 presents data on the use of three sets of improved inputs: seed, fertilisers, pesticides/fungicides, plus the adoption of irrigation technologies. These inputs and practices are compared across organisations, classified by the crop categories they are used on—fruits, vegetables and other horticulture.
TABLE 7
Improved seed is now used by the vast majority (84.1%) of crops grown by organisations in Rwanda. Only a small fraction continues to use traditional seed (or no seed at all in the case of tree crops and certain vegetables). Breaking out improved seed adoption by crop category is equally revealing. The highest use of all is by vegetable growers at 89.8%, with a markedly lower average rate of around 65% in the fruit and other horticulture categories.
Fruits Vegetables Other hort* Total(%) (%) (%) (%)
SeedNone 1.4% 1.2% 1.7% 1.3%Own/traditional 32.1% 9.0% 34.7% 14.6%Improved or Both 66.5% 89.8% 63.6% 84.1%
Total 100.0% 100.0% 100.0% 100.0%
FertiliserNone 11.2% 3.9% 3.3% 5.3%Trad/Organic 57.1% 34.3% 52.1% 39.6%Commercial or Both 31.8% 61.8% 44.6% 55.1%
Total 100.0% 100.0% 100.0% 100.0%
Pesticide/FungicideNone 42.0% 15.1% 28.9% 21.1%Organic/IPM 12.6% 10.0% 3.3% 10.3%Commercial or Both 45.4% 74.9% 67.8% 68.6%
Total 100.0% 100.0% 100.0% 100.0%
IrrigationNone 63.8% 10.4% 16.5% 21.4%Water by hand 28.9% 78.5% 73.6% 68.3%Sprinkler, drip or other 7.2% 11.1% 9.9% 10.3%
Total 100.0% 100.0% 100.0% 100.0%
Inputs investment IndexMean scale score 4.33 6.07 5.36 5.69
N 636 2391 121 3148*flowers, nuts, herbs & spices
Crop Category
Intensification Investments by SelectedInputs/Practices and by Crop Category

33 | P a g e
Commercially available fertilisers and pesticides & fungicides are also commonly used by horticulture organisations in Rwanda. Nearly all producer groups apply fertilisers to their fields, using either traditional, organic fertilisers (typically manure and compost) approximately 40% of the time or, commercial or a combination of commercial and organic another 55.1% of the time. Vegetables are considerably more likely to receive applications of commercial fertilisers than are fruits, and vice versa for the use of organic fertilisers. Practices in support of organic certification may be a factor in the lower use of chemical inputs among fruit growers in Rwanda.
Mechanical irrigation using sprinklers or drip technologies is limited to just 10.3% of organisations and that overall proportion does not vary significantly in the production of fruits, vegetables and other crops. Among fruits, drip and sprinkler irrigation tend to be used in the production of tree fruits such as mango, orange, lemon, avocado and cape gooseberry. The high volume crops like pineapple, passion fruit and tamarillo are not mechanically irrigated. Among vegetable crops, tomato, sweet pepper and leek are mechanically irrigated more often than others.
By contrast, watering by hand (buckets) is very common among vegetable growers (78.5%) but much less so in fruit production (28.9%). This is because most vegetable crops are seasonal and require significant water for proper growth. They also tend to be grown in concentrated areas in valleys, making hand irrigation a relatively easy option. Fruit crops are often perennials and as such are heartier and deep rooted, thus able to do well with minimal irrigation. Fruit crops are also grown mostly on the hillsides, making hand irrigation a more labour intensive task in those often more distant and dispersed locations.
Overall, one concludes from these figures that the adoption of improved inputs and technologies has been relatively successful in the horticulture sector, with the majority of growers, particularly vegetable and specialty crop producers, following the recommendations of extension and other experts for an increasingly modern and professionalised sector.
3.4.2 Access to Inputs & Services
Success in horticulture, as in any agricultural sector, requires adequate access to the right inputs, equipment and services. In the case of producer groups, access to seed, fertilisers, tools irrigation equipment, market information and other inputs and services is critical. For processing organisations, packaging, processing equipment and other items take on greater significance.
To determine the extent to which organisations have such access they were asked three questions with regard to 23 different types of inputs, equipment and services. The first question asked whether a given item was important to the success of their organisations. The second asked about the level of access they currently had (on a scale from 1 to 5) for each item identified as important to success. The third question asked them to identify the major constraints they faced in improving their access to the input/service item.
The proportion of organisations reporting various inputs and services to be important to their success as a business varies greatly. Because nearly all of the organisations in the data base are producer groups, it is not surprising that 96% say that seed is an important input (Table 8). The

34 | P a g e
same is true for fertilisers, pesticides and small production equipment. Other items, by contrast, are identified as important to success far less frequently; cold storage equipment (32%) and packing materials & equipment (28%) are good examples. Those items that rise to the top in terms of overall importance tend to be the most basic services. In addition to the production inputs mentioned above, organisations also identify irrigation equipment, sufficient water, paved roads, market information and credit as critical needs.
TABLE 8
Fruit sales Veg salesOther hort crop sales
Input/Service N PctPoor
AccessPoor
AccessPoor
AccessSeed 1112 96% 26.7% 24.3% 18.2%Organic fertilisers 1055 91% 32.0% 25.3% 15.0%Commercial fertilisers 904 78% 52.8% 39.1% 18.2%Pesticides 986 85% 55.8% 37.2% 25.0%Small production equipment 1033 89% 27.9% 23.1% 9.5%Large production equipment 346 30% 85.0% 77.6% 62.5%Irrigation equipment 854 74% 67.9% 52.4% 40.0%Electricity 613 53% 72.8% 60.3% 44.4%Sufficient water 921 80% 47.1% 31.3% 11.8%Clean water 777 67% 52.7% 43.2% 25.0%Green house materials & equip 345 30% 70.9% 72.2% 62.5%Certification services 283 25% 86.0% 88.8% 87.5%Horticulture processing equip 302 26% 86.2% 82.6% 100.0%Dry storage facilities 372 32% 79.9% 80.4% 100.0%Cold storage equip/facilities 373 32% 85.7% 91.9% 100.0%Packaging materials and equip 328 28% 86.3% 83.1% 84.6%Internet/computers & supp serv 368 32% 88.3% 84.5% 33.3%Transportation 713 62% 80.2% 74.9% 38.9%Paved/accessible roads 934 81% 40.4% 32.4% 5.3%Mkt info for hort crops/products 849 74% 64.4% 60.8% 55.0%Exports promotion services 366 32% 88.7% 85.5% 85.7%Exports certification services 297 26% 87.4% 83.4% 83.3%Credit/financing 851 74% 63.2% 62.7% 53.3%
Orgs Reporting Input/Service
Import to Succ
Main Source of Revenue
Organisations Reporting Poor Access to Selected Inputs andServices by Main Source of Revenue

35 | P a g e
Table 8 also breaks out the percentage of organisations indicating that their access to these inputs and services is “low” or “very low” across organisations grouped according to their main sources of revenue. As described in the subsection below, processor organisations are treated separately in this analysis. For the fundamental improved agronomic inputs required for higher productivity, one observes that fruit producers have a greater access problem than do producers of vegetables or other horticulture products. This disparity is highlighted in Figure 14 where, for example, 52.8% of fruit producers struggle to obtain commercial fertilisers compared to 39.1% of vegetable producers and 18.2 percent of groups producing other horticulture crops (flowers, nuts, herbs and spices, etc.). The same pattern holds across all inputs required for the intensification of horticulture production.
FIGURE 14
Why fruit producers have more limited access than do vegetable and other horticulture crop producers may in part be a function of their smaller membership and overall sales. But more likely it is tied to other factors, some of which are reported below, that differentiate fruit and vegetable grower organisations. Figure 15 presents the responses organisations provided to the question on the primary constraints they face in accessing inputs and services. The high costs of inputs and services are the major constraint identified, however this appears to be equally problematic for all types of producers, including those in specialty crops. The two factors that most successfully differentiate the groups are “lack of local availability” and “low public investment,” both of which are noticeably higher for fruit growers than for vegetable or other (specialty) crop producers. Interpreting what this means can certainly be debated, but it does not appear to be a function of geography, as the same set of constraints broken out by

36 | P a g e
province does not suggest that fruit growing regions, such as the North Province, have significantly more or less constrained access to inputs and services than do other regions.
A more plausible interpretation is that fruit production in Rwanda has simply not received the level of promotional attention that vegetable production has. In many ways fruit production is more diversified and dispersed than vegetable production and nearly all fruits are grown across the hillsides, as opposed to vegetables which are nearly always grown in the valleys (as will be seen in a later section of this report). Undoubtedly there are also positive externalities, or spill-over benefits, that accrue to vegetable production when grown in proximity to (and often alternating with) maize and other crops promoted through Rwanda’s crop consolidation and specialisation programs. The flow of seed, fertilisers and other agricultural inputs into the highly promoted grains and other field crops comes with inputs distribution networks and related extension services that can be easily extended in support of vegetable production. More developed market channels in these areas may also be a boon to vegetable producer groups.
FIGURE 15
Processing organisations. Because of the very small number of horticulture processing organisations indicating poor access to inputs and services, this group is not included in Table 14. Instead, in those critical areas where numbers are sufficient and percentages meaningful the findings are described individually here. There are two such areas where there appears to be consensus expressed by processing groups in the need for improved access. The first is in the area of export promotion services and the second is in certification services. Both areas are at the high end of the spectrum of services and are indicative of the markets in which these processor organisations are interested in engaging.
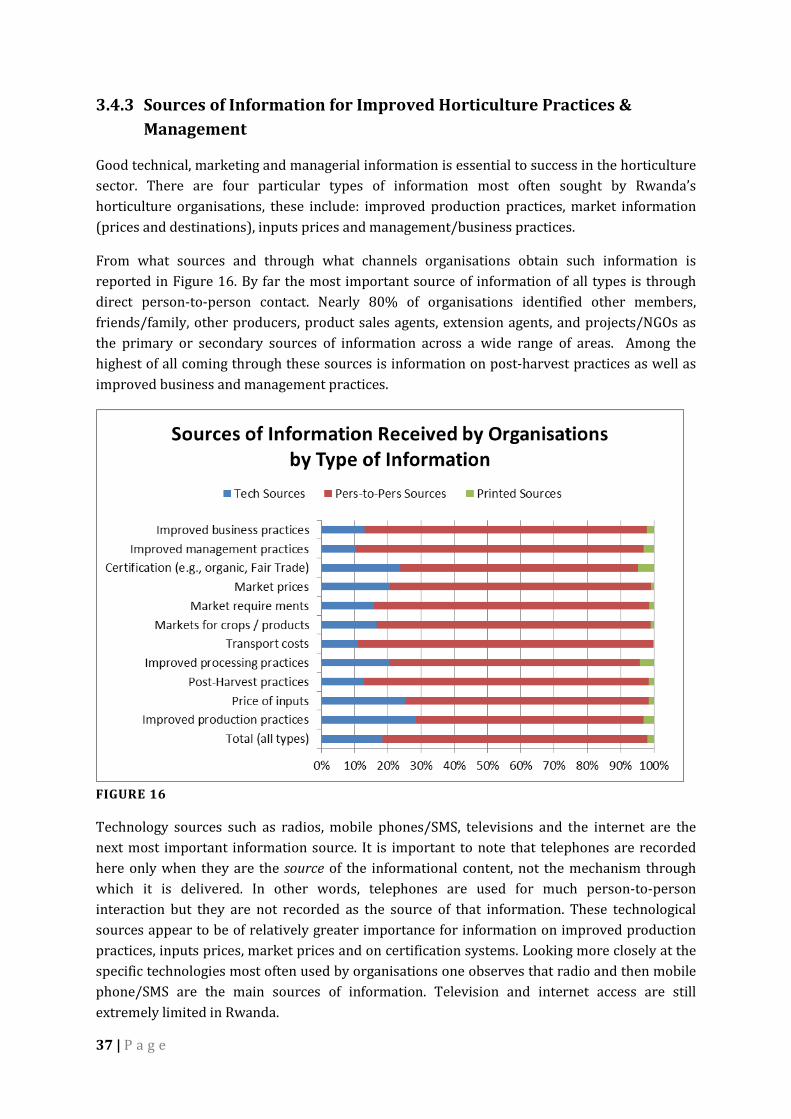
37 | P a g e
3.4.3 Sources of Information for Improved Horticulture Practices & Management
Good technical, marketing and managerial information is essential to success in the horticulture sector. There are four particular types of information most often sought by Rwanda’s horticulture organisations, these include: improved production practices, market information (prices and destinations), inputs prices and management/business practices.
From what sources and through what channels organisations obtain such information is reported in Figure 16. By far the most important source of information of all types is through direct person-to-person contact. Nearly 80% of organisations identified other members, friends/family, other producers, product sales agents, extension agents, and projects/NGOs as the primary or secondary sources of information across a wide range of areas. Among the highest of all coming through these sources is information on post-harvest practices as well as improved business and management practices.
FIGURE 16
Technology sources such as radios, mobile phones/SMS, televisions and the internet are the next most important information source. It is important to note that telephones are recorded here only when they are the source of the informational content, not the mechanism through which it is delivered. In other words, telephones are used for much person-to-person interaction but they are not recorded as the source of that information. These technological sources appear to be of relatively greater importance for information on improved production practices, inputs prices, market prices and on certification systems. Looking more closely at the specific technologies most often used by organisations one observes that radio and then mobile phone/SMS are the main sources of information. Television and internet access are still extremely limited in Rwanda.

38 | P a g e
The third set of information sources identified by the survey is written materials, such as extension publications, commercial publications and newspapers. These sources only account for 2.0% of all information used by organisations and much of that is concentrated in just a few areas, including production and processing practices and certification services. That printed materials receive such a minor following is rather surprising given the vast attention given to these sources by support agencies, projects and services. This result, coupled with the findings on how technologies and person-to-person communications are use, should serve as an important lesson for all engaged in promoting best practices and products to potential users in the horticulture sector.

39 | P a g e
3.5 Spatial Location and Competing Land Use
Section Contents
3.5.1 Valley and Hillside Location of Horticulture Crops .................................................................................. 40
3.5.2 Distance from Paved Road................................................................................................................................... 42
3.5.3 Competing for Land ................................................................................................................................................ 44
About the Data in this Section
Questionnaire Section Questions on… Level N
Section 6 Land by Use and Ownership Category Land Category 17,325
Section Tables, Figures and Maps
Figure 17. Location of Land (Ha) on Hillside by Selected Land Characteristics ..................................... 40
Figure 18. Production Area (Ha) by Location on Hillside and Province .................................................... 41
Map 3. Organisations by Distance to Paved National Road ...................................................................... 42
Table 9. Selected Characteristics of Horticulture Organisations by Distance from Paved Road .................................................................................................................................................................... 43
Figure 19. Major Competing Uses of Land ............................................................................................................... 44
Figure 20. Horticulture Competition for Land by Regional Specialisation Program Crops .............. 45

40 | P a g e
3.5.1 Valley and Hillside Location of Horticulture Crops
Some organisations operate land in the valleys and others operate land on the hillsides. These are important differences in terms of crop production, geography, land ownership, use of inputs and other factors. Figure 17 breaks out the different types of land use by organisations according to where on the hillside each is located. Total area in production by organisations in the past 12 months amounts to 7,135 hectares and topographically this land area shows a relatively balanced distribution, with roughly equal proportions in the valleys and on the lower and upper hillsides.
FIGURE 17
Comparing the locations of fruit, vegetables and flowers yields a striking contrast. Fruit is grown almost exclusively (94.4%) on the hillsides and rarely in the lowland areas. Most fruit is perennial, (e.g., passion fruit, avocado, mango), and as such it is not selected by organisations for production in the common area valleys that are most often reserved for annual crops such as maize, bean and other crops promoted through land consolidation policies. Horticulture organisations follow this same directive in producing vegetables. And this can be aptly seen in the data where vegetable crops are grown 78.5% of the time in the lowlands. Flowers are even more likely than vegetables to be located in valleys, at 88.5%.
Another part of the reason for locating vegetables and flowers in the valley bottoms is their greater need for irrigation, as seasonal crops. Irrigation is more manageable and cost effective in the flatter lowlands, often previously wetlands, than on the hillsides.

41 | P a g e
Land ownership is also affected by topography. Land owned by organisation tends to be located on the hillsides (61.2%). This is especially true (81.4%) when the land operated by the organisation is located on the individual members’ farms. It is not uncommon for organisations to form on the concept where each producer designates a fixed portion of his/her own holdings (e.g., 5 ares) to the organisation. Members operate such parcels in consort with the organisation and following the crop choice, inputs regime and other directives of the organisation. Land purchased by organisations tends to be similarly located on the hillsides as this is mainly where land comes up for sale. Communally owned lands tend to be situated in the lowland areas and are less frequently put up for sale. By contrast, when land is collectively leased by an organisation it is usually (about 70% of the time) located in the valleys. These are typically communally owned lands that are made available to cooperatives and associations through long-term lease arrangements.
It is instructive to examine how topography and horticulture production intersect with geography, notably across Rwanda’s five provinces, as that will help to shed light on a range of findings presented in this report. One observation that stands out in Figure 18 is that there are sweeping differences from one region to the next. Kigali province represents an extreme case where nearly all land (90.7%) operated by organisations is located in lowland areas. Earlier it was discovered that a roughly equal proportion of horticulture production in Kigali was in vegetables such as tomatoes, French beans and cabbage. Kigali produces almost no fruits.
FIGURE 18
The South province is similar to Kigali but less extreme at 65.4% valley production, and its focus on vegetable production is also exceptionally high, with over a third of Rwanda’s total vegetable production coming from the region. And the parallel continues for the other provinces with increasing proportions of land operated by organisations being situated in upland areas. In the East province, 76.1% of horticulture is on the hillsides and the majority of that is on the upper slopes. Not surprisingly, organisations in the eastern province produce a higher volume of fruits than producers in any other region.

42 | P a g e
This distinct pattern of findings begs the question of whether the cropping and production patterns of organisations in Rwanda are dictated by market demand or by agroecology and topography⎼⎼simply by where land is accessible to those producer groups (i.e., in the valley or the hillsides) and what crops happen to grow well in those areas or require agronomic practices (e.g., irrigation) that are suitable to those areas. The answer is that it is probably a bit of both and that it is in a state of flux as urban markets and cross-border trade/competition continue to expand.
One other important factor to consider from an agroecological perspective is the significance of fruit crops as perennials, which, like coffee, tea, banana and other tree crops, are vital to the country’s battle against soil erosion. While it is not clear whether fruit and other highland perennials are deliberately planted by producers or producer groups with the aim of reducing soil loss, it is without doubt a highly effective contribution to that ongoing effort and worthy of further study and potential promotion.
3.5.2 Distance from Paved Road
Many organisations identified poor roads and transportation as a steep challenge to their success. Using ArcGIS the team was able to complete a spatial analysis of organisations to identify their distances from the nearest national road and the nearest paved road. Analysis of these effects reinforced the views expressed by many that good roads can make a difference. Proximity to paved roads is found to be an especially important determinant. Map 3 shows the location of all 1,155 organisations relative to the country’s paved road system. Organisations are coloured according to their proximity, with dark red being the closest and dark green being the farthest from a paved road.
MAP 3

43 | P a g e
The map underscores the fact that a large number of organisations have formed in areas close to paved roads, suggesting that roads are a factor in the establishment of horticulture organisations, or in their longer term success. It also shows that there are plenty of organisations that form in more distant areas. Important regional differences also emerge, showing that organisations in Kigali average 2.3 Km to a paved road compared to three times that distance (6.9 Km) on average for organisations in the less densely populated East province. While distances are farther in the East province, it is important to note that roads there are, in general, flatter and straighter than they are in other regions of the country.
TABLE 9
Table 9 compares organisations by their proximity to a paved road on a range of defining characteristics, such as size, area cultivated, sales, and productivity. First, organisational membership is conditioned by road proximity both in numbers and male-female composition. The more remote organisations tend to be both larger and with fewer female members. Those located closest to paved roads (< 1.0 Km) are smallest in size at 45.7 members and highest in proportion female at 60.7%. At the other extreme, organisations located 8.0 Km or more from a paved road are the largest in membership, averaging 64.0 members, and are among the lowest percent female at 54.4%. Road proximity is also linked to area cultivated, with those closest to roads being smaller (4.73 Ha) than the most remote organisations registering nearly twice the area under cultivation at 9.03 Ha. This may be a reflection of the larger organisations (in membership and hectares) being disproportionately located in the East province
Table 9 also draws attention to how proximity to paved roads is associated with measures of agricultural productivity and sales values. There is a very strong association across the board. Close road proximity is linked to the highest levels of Kg yield per hectare, proving to be twice as high inside 1.0 Km from the road (12,558 Kg/ha) compared to 6,283 Kg/Ha for those located 8.00+ km from the paved road. The same pattern holds for FRW per day of labour, at 1,902 FRW/day compared to 984 FRW/Day for the less proximate organisations. The productivity difference is even more pronounced when measured in terms of FRW per hectare, showing almost a four-fold advantage for organisations located closest to the paved road. An important part of the improved marginal value product (MVP) for land and labour is that crops grown closer to the paved road sell for much higher prices than do those produced in more distant locations. The average FRW/Kg price for crops grown near the paved road is 347 FRW compared to approximately half that value (183 FRW) for crops grown 8:00+ kilometres from
Distance from paved road (Km) N
Membership (mean)
Percent Female
members (mean)
Area (Ha) under
production (mean)
Area (Ha) under
irrigation (mean)
FRW in loans over
past 24 mos(mean)
KG per Ha land under production
(mean)
FRW per day of
labor (mean)
FRWper Ha
(mean)
FRW per KG (mean)
< 1.00 Km 259 45.7 60.7% 4.73 1.85 6,009,486 12,558 1,902 3,470,659 347 1.00 - 3.99 297 50.3 58.5% 5.35 1.45 356,840 11,986 1,826 2,508,474 275 4.00 - 7.99 282 58.6 53.7% 7.42 1.32 319,371 6,934 1,826 1,793,194 271 8.00+ 317 64.0 54.4% 9.03 1.52 462,464 6,283 984 891,616 183 Total 1155 55.1 56.7% 6.73 1.52 1,644,244 9,268 1,606 2,082,020 266
Selected Characteristics of Horiculture Organisations by Distance from Paved RoadSelected Characteristics

44 | P a g e
the paved road. This dramatic difference is likely a reflection of the greater access these organisations have to Kigali and other higher paying markets for horticulture product.
3.5.3 Competing for Land
The conversion of large tracts of valley lands for agricultural purposes is a process that has evolved for generations in Rwanda. Traditional uses such as pasture and protected wetlands have given way in many areas to increased crop production, particularly from a growing number of cooperatives and other farmer associations as a part of the country’s overall agricultural development strategy. In addition to the phenomenal growth in horticulture organisations reported earlier in this report, there has been similar expansion of farmer groups in other promoted commodity subsectors such as maize, bean, wheat and rice.
FIGURE 19
When asked about their own experiences in competing for land in their local areas, organisations provided insights into the challenges they face. Figure 19 suggests that some of the more traditional competing uses such as pasture for livestock and wetland protection are relatively minor by comparison the 57.5% who identify other crops as a main source of competition for land.
The national crop consolidation and specialisation programs are the source of much of the competition horticulture organisations face, as confirmed by 37.7% of the organisations surveyed. From among those identifying these programs as competing for land in their areas, maize stands out as the major competing crop at 35.4%, followed by bean growers (10.6%), potato (5.4%) and other promoted crops (Figure 20).

45 | P a g e
Organisations in the West province are more likely than in any other province to identify competition with other promoted crops, with maize, bean, potato and cassava all being identified at a high rate. Next is the South province that identifies rice, wheat and cassava as competing crops. Wheat is a significant competing crop in the North.
FIGURE 20

46 | P a g e
3.6 Age of Organisation, Gender Balance and Partnerships
Section Contents
3.6.1 Comparison of Older and Younger Organisations .................................................................................... 47
3.6.2 Gender and Horticulture Organisations ........................................................................................................ 48
3.6.3 Partners & Support for Horticulture Organisations................................................................................. 51
About the Data in this Section
Questionnaire Section Questions on… Level N
Section 2 Organisational Characteristics Organisation 1,155
Section 13 Partners and External Support Support type 1,224
Section Tables, Figures and Maps
Table 10. Comparison of Organisations by Year Established and Selected Characteristics ............ 47
Table 11. Selected Organisational Characteristics by Percent Female Membership Quartile ....... 49
Figure 21. MVP Land and Labour by Female Membership Quartile ............................................................ 50
Table 12. Types of Support Received by Organisations by Type, Delivery Partner and Funding Partner ............................................................................................................................................ 51

47 | P a g e
3.6.1 Comparison of Older and Younger Organisations
The rapid growth in the number of horticultural organisations in Rwanda was reported earlier in this report. This growth is important not only in terms of the numbers of new organisations that have been established (50% since 2010), but because younger organisations are different from more mature organisations in many ways that affect their performance, their needs and even in their basic geography.
TABLE 10
Table 10 compares older and younger organisations across a range of indicators. This table reveals many of the differences that might be expected in comparing organisations that have been newly formed with those that are more established. Organisations that have been established since 2010 are only 1.6 years old on average, compared to 8.5 years for the “first generation” of organisations, some of which were established as early as the 1960s.
This additional 7 years, has enabled the older organisations to develop their membership, which stands at 67.9 on average, compared to 41.8 for younger groups. Area under production over the past 12 months (10.27 ha) is over three times that cultivated by newly formed organisations. Whether this is a function of their younger age or how times have changed is not clear. It may be that organisations become more established and influential over time and that
Age of organisation (years since estab.) 8.5 1.6 4.9Total active Membership 67.9 41.8 54.1Area under production (Ha) 10.27 3.37 6.67Land owned (Ha) 1.25 0.23 0.72Total sale of fruits (FRW) 1,417,474 508,230 943,397 Total sale of veg (FRW) 5,510,166 1,842,650 3,597,933 Total sale other hort crops (FRW) 193,284 37,907 112,271 Total crop sales (FRW) 7,120,924 2,388,788 4,653,600 Total processed product sales (FRW) 576,825 7,917 280,198 Total crops & products sales (FRW) 7,697,748 2,396,705 4,933,798 Input investment index 5.2 5.5 5.4Percent sales in own district 71.8 72.9 72.4Total SqM in Buildings 88.5 46.7 66.7Area in greenhouse SqM 30.6 18.3 24.2Nbr of loans in past 24 months 0.20 0.12 0.16Strength of internal competencies 2.23 2.28 2.26Strength of external competencies 1.60 1.66 1.64Nbr types of outside support received 1.06 1.06 1.06Organizational strength (scale) 4.24 4.17 4.20
Number of Organisations 548 597 1,145
2010 - 2013(mean)
Total(mean)
Year Organisation Established
Comparison of Organisations by Year (period) Establishedand Selected Characteristics
1966 - 2009(mean)Organisational Characteristic

48 | P a g e
this enables them to acquire more land by purchase or by grant from local authorities. But it is also known that competition for land from many sources has escalated over the years and now means that organisations, like individual households, struggle to expand their land area. Looking more deeply into their circumstances, the data show that younger organisations are more interested than are older ones in expanding their land in operation and that they are facing moderately greater competition for land from other crops, such as maize and bean.
Greater crop sales reported by mature organisations mimics their advantage in area cultivated, with sales of 3-5 times as great as the newer producer groups. Not surprisingly, parallel analysis reflects the same pattern of findings in volumes (Kg) produced. The higher production and sales of more established groups holds for both fruits and vegetables. Where younger groups lag their older counterparts most dramatically is in the processing domain where capital investments are vital, clearly favouring the more established organisations (mainly private sector companies).
One area that did show unexpected findings is that the newly formed organisations register a higher score on the inputs investment scale at 5.5 compared to 5.2 for the older organisations. This finding is reinforced by the higher score on internal level of technical and managerial competencies registered by the newly formed organisations.
3.6.2 Gender and Horticulture Organisations
Women outnumber men by a significant margin in their membership in horticultural organisations, 56.5% to 44.5%, reaffirming their role in the success of these organisations. Most horticulture groups in Rwanda have mixed membership, with only 1.4% being all male and 5.6 being all female. To better understand the effect of gender on Rwanda’s horticultural sector, organisations have been broken out into four equally sized groups (or quartiles) based on percent female membership, for comparison across a series of key defining characteristics as shown in Table 11.1
Looking first at overall membership size, it is evident that the larger organisations are those that have a good balance of male-to-female membership as both middle quartiles measure well above the average of 54.7 members, while those at the extremes, i.e., mostly men or mostly women, are below the average size. This pattern of organisation size does not carry over into the land area organisations have under production, but there is a very clear gender effect on this all-important land access variable. Predominantly male organisations (1st quartile) cultivate an average of 10.36 Ha of land and that amount declines to 1.4 Ha for those in the predominantly female (4th quartile). Is this apparent gender effect on land access a function of age of organisation? It was reported earlier that newly formed organisations had limited land access compared to the more established group. This hypothesis is rejected, however, as men’s and women’s groups do not vary by age, with all four quartiles reporting average years since establishment very close to the average of 4.73 years. Whether this land access disadvantage is
1 Quartiles constitute a convenient method for grouping organisations by their degree of female membership. The 1st quartile is at the low end of the scale and contains the smallest share of female members (mean female membership of 27.4% for this group). The 4th quartile, by contrast, contains the highest share of female membership (mean female membership of 87.0%).

49 | P a g e
a function of the particular crops produced by predominantly women’s groups is a question we will come back to below.
TABLE 11
An important indicator of how connected associations are to various market options is how and where their products are sold. Earlier it was discovered that better prices were paid for product in Kigali and other more distant markets, compared to sales in the home district. This is perhaps the main reason producer groups so often stated a preference for selling to these higher-paying markets in the future. This difference seems to be tied to gender composition too, as higher female membership is associated with greater sales in the local, district market, at 81.5% for the high quartile and declining to 65.8% in the quartile with the lowest female membership.
If there are disadvantages in land access and market access, do these differences carry over to other, related areas such as access to inputs and various competencies, either internal or external to the association? The answer is no, there appear to be no disadvantages to predominantly women’s groups in this regard. Comparing the inputs investment index across the four quartiles shows minimal variation. And in terms of self-assessed internal and external competencies in production, post-harvest handling, marketing, management and other areas, there is little difference from one quartile to the next.
However, when compared across crop production and productivity, the results in Table 11 bear witness to a strong gender effect. The high female quartiles report dramatically lower sales
Organizational CharacteristicLow
1st Quartile 2nd Quartile 3rd QuartileHigh
4th Quartile TotalTotal active Membership 46.2 69.8 58.5 44.9 54.7Area under production (Ha) 10.36 10.92 4.13 1.40 6.68Land owned by organisation (Ha) 0.89 0.72 0.26 0.25 0.53Years since established 4.75 4.97 4.50 4.70 4.73Percent sales in own district 65.8 73.7 74.0 81.5 73.7Mean Inputs Investment index 5.41 5.35 5.38 5.31 5.36Strength of internal competencies 2.32 2.24 2.09 2.27 2.23Strength of external competencies 1.69 1.65 1.54 1.61 1.62Nbr types of outside support received 0.79 1.07 1.21 1.23 1.07Organizational strength (scale) 4.21 4.27 4.19 4.14 4.20Total sale of fruits (FRW) 1,952,111 977,742 438,657 409,547 949,707Total sale of veg (FRW) 8,260,723 2,627,339 1,196,345 2,415,888 3,656,351Total sale other hort crops (FRW) 113,548 70,358 78,899 38,663 75,814Total crop sales (FRW) 10,326,382 3,675,440 1,713,902 2,864,098 4,681,872Total product sales (FRW) 107,811 798,346 97,606 7,883 246,137Total crops & products sales (FRW) 10,434,192 4,473,785 1,811,507 2,871,981 4,928,010FRW per day of labor 2,286 1,755 1,273 842 1,537FRW per Ha of land 1,613,222 1,185,418 2,033,390 2,526,355 1,838,941
N 295 272 286 279 1,132
Percent Female Membership Quartile
Selected Organizational Characteristics by Percent Female Membership Quartiles(Cooperatives and Associations)

50 | P a g e
(production) than observed for predominantly male groups. In value of total crop sales, for example, the high quartile averages 2.86 million FRW compared to 10.33 million FRW for the lowest female quartile. Though predominantly female groups tend to work more in vegetables than in fruits, the same pattern of lower production by these groups holds true across all crop categories—fruits, vegetables and other (specialty) crops. Thus, we conclude that the gender effect does not lie mainly in differences in the types of crops produced.
Lower sales across all of these crop categories are largely a function of limited land access, as pointed out above. But there is a very important nuance in these findings, one that provides some insight into the observed gender differences. While the higher female membership quartiles operate just a fraction of the land that low female quartiles operate, their levels of productivity tell a different story when measured as output per unit of land (Marginal Value Product of land—MVP Land) and per unit of labour (Marginal Value Product of Labour—MVP Labour). Figure 21 demonstrates that increasing female membership results in a precipitous decline in output (FRW) per day of labour. By contrast, increasing female membership yields precipitously higher output (FRW) per unit of land. In short, because of their disadvantaged land access the predominantly female groups are able to squeeze more out of the land they operate, but this comes at the cost of diminishing returns to labour.
FIGURE 21
It is also noteworthy that the higher percent female membership is found especially in the Kigali and South provinces. Low female representation in horticulture cooperatives and associations is found in the North and the East provinces. The West province shows no bias in one direction or the other.
One final observation on gender differences in Rwanda horticulture is that predominantly female membership tends to attract a high level of support (tools, seed, etc.) from funding and

51 | P a g e
delivery agencies. As Table 11 shows, the number of different types of outside support climbs in direct proportion to the percentage of female membership. The lowest quartile receives and average of 0.79 types of support while those in the top quartile receive 1.23 types of support. The following section takes a summary look at external support for horticulture in Rwanda and how it is delivered and funded.
3.6.3 Partners & Support for Horticulture Organisations
As a promoted sector, one that the Ministry of Agriculture and NAEB emphasise as a lead sector for exports growth as well as for improved nutrition and incomes domestically, many agencies and support organisations, both local and international, have mobilised to help build capacity
and provide incentives for expanded horticulture development. Organisations were asked about the types of support they received over the past 24 months from outside groups and about how those support programs were funded and delivered. Overall, 44.2% of organisations reported having received outside support during the previous 24 months. Half of these organisations received just one type of support but others reported multiple types and sources.
Table 12 summarises the baseline survey results on these questions about the types, delivery and funding sources of the support they received. The three most common types of material support received by organisations are: tools, seeds and other improved inputs. Support in the form of capacity building is most heavily concentrated in production practices and to a lesser degree in management.
The principle delivery partners are government agencies, both domestic (39.2%) and international (26.7%). International and domestic NGOs are also active in the delivery of inputs and capacity building support, together accounting for 19.8% of total support received. It is encouraging to also see the private sector engagement in partnerships with the organisations they work with. They are identified as the supporting partner 13.1% of the time, a figure that will be important to track over time as the sector becomes increasingly commercialised.
Delivery of support and services is often separate from the funding of that support and it is often the case that organisations are not aware that the two are separate. That is likely the reason that 57.4% of organisations list “other” as the
N %
Support TypeSeeds 288 23.5%Fertiliser/pesticides 90 7.4%Tools 178 14.5%Production practices 291 23.8%Post-harvest support 9 0.7%Processing support 21 1.7%Marketing support 13 1.1%Management support 106 8.7%Financing (FRW) 101 8.3%Financing info 27 2.2%Other support type 100 8.2%
Total 1224 100.0%
Delivery PartnerGov't agency/service 417 39.2%Local organisation 119 11.2%International donor 284 26.7%International org 91 8.6%Private sector company 139 13.1%Other delivery partner 13 1.2%
Total 1063 100.0%
Funding PartnerRwanda district govt 229 19.1%Rwanda other govt agenc 201 16.8%International agency 80 6.7%Other funding partner 688 57.4%
Total 1198 100.0%
Types of Support Received by Organisations by Type, Delivery
Partner and Funding Partner
TABLE 12

52 | P a g e
funding partner, a surrogate for “don’t know.” But for those who are aware of the difference, the primary funding sources identified are the district government (19.1%), other domestic agencies such as NAEB and RAB (16.8%), and international donors.
53 | P a g e
3.7 Largeholder Horticulture Producers
Section Contents
3.7.1 Largeholder Horticulture Producers .............................................................................................................. 54
3.7.2 Largeholder Crop Production ............................................................................................................................ 55
About the Data in this Section
Questionnaire Section Questions on… Level N
Largeholder survey ID and diverse areas (main questionnaire) Largeholder 550 Largeholder survey Crops grown Crop 974
Section Tables, Figures and Maps
Figure 22. Distribution of Horticulture Largeholder Producers by Province and District ................ 54
Table 13. Horticulture Crops Produced by Individual Largeholder Producers by Province .......... 55
Table 14. Individual Largeholder Selected Characteristics by Province .................................................. 56

54 | P a g e
3.7.1 Largeholder Horticulture Producers
In addition to the survey of organisations, the RHOS 2013 also listed and surveyed all of Rwanda’s individual largeholder horticulture producers. Largeholder producers were defined by the same criteria as were organisations. As discussed in the methodology section of this report, to qualify for the survey largeholder farmers had to satisfy one of the following criteria: 1) cultivate at least 0.5 Ha in open-field horticulture crops, 2) cultivate 100 m2 or more of greenhouse crops, or 3) register gross sales of at least 5,000,000 FRW over the past 12 months. Overall, 550 independent largeholders met at least one of the three criteria. Data collected on these largeholder farmers were limited to a small number of questions on principle crops, total horticulture sales, area planted in horticulture crops and area in greenhouses.
FIGURE 22

55 | P a g e
The geographic distribution of individual largeholder horticulture producers can be seen in Figure 22. There is broad geographic representation with nearly all districts in Rwanda included. In this respect it follows a similar pattern to the distribution of organisations discussed in section 3.1, yet with one significant exception. All seven districts in the East province show large numbers of largeholder horticulture producers. Overall, the East is home to over half of the country’s largeholder farmers and they stand out both in their elevated level of production of vegetables and in the amount of land under cultivation in horticulture.
3.7.2 Largeholder Crop Production
Table 13 presents the principle crop categories grown by Rwanda’s largeholders by major crop category and province. Vegetable production is identified as the overall primary crop group at 68.1%, with fruit production being the next most important at 30.4%. Other specialty crops receive negligible investment from this producer group as all flowers, nuts, herbs and spices and other crops in this category amount to just 1.5% of crops produced. In other words, largeholder producers do not differ substantially in their crop choices from horticulture organisations, with an emphasis on vegetable production, most notably tomato and cabbage. Among fruits, largeholders again mimic the organisations in their focus on pineapple, passion fruit and tamarillos. It appears that the factors that drive crop choice are largely the same for both organisations and largeholder producers.
TABLE 13
Largeholder horticulture producers are also broadly distributed across the country and their regional variation in crop choice follows the pattern set by organisations. Fruits are grown in greater abundance in the North and the high vegetable count is found in the Kigali.
Overall crop and product sales by individual largeholder farmers is over 527 million FRW with nearly half of that coming from the East province at 250 million FRW (see Table 14). This elevated figure is not because farmers in the East are more productive. In fact, their mean production is among the lowest in the country at 0.87 million FRW per farm. The difference is that there are so many largeholder producers in the East and their farms are the largest on
Total Kigali South West North East% % % % % %
Total 100.0% 100.0% 100.0% 100.0% 100.0% 100.0%Fruits 30.4% 15.3% 39.6% 37.8% 44.8% 23.7%Vegetables 68.1% 76.5% 59.9% 61.5% 54.0% 75.2%Herbs & Spices 0.4% 0.0% 0.0% 0.7% 1.1% 0.4%Nuts 0.4% 1.2% 0.0% 0.0% 0.0% 0.7%Cut Flowers 0.7% 7.1% 0.5% 0.0% 0.0% 0.0%Flowers/herbs for Processing 0.0% 0.0% 0.0% 0.0% 0.0% 0.0%Processed Hort Products 0.0% 0.0% 0.0% 0.0% 0.0% 0.0%
N 974 85 212 143 87 447
Province
Horticulture Crops Produced by Individual Largeholder Producers by Province

56 | P a g e
average at 1.48 Ha. Compared in terms of total area (Ha), farmers in the East cultivate nearly 60% of all largeholder land in the country.
Among the 550 largeholder farmers only three of them operate greenhouses, with each at approximately 250 SqM. One is located in Kigali, another in the South and the third in the East, the three main vegetable growing regions in the country.
TABLE 14
Characteristic Total Kigali South West North East
Crop/Product sales FRW 527,525,142 85,114,200 87,343,942 64,199,200 40,198,000 250,669,800 % 100.0% 16.1% 16.6% 12.2% 7.6% 47.5%Mean 959,137 2,182,415 779,857 1,003,112 855,277 870,381
Area in horticulture crops Ha 711.98 37.56 141.51 59.96 49.11 423.84% 100.0% 5.3% 19.9% 8.4% 6.9% 59.5%Mean 1.30 0.99 1.27 0.94 1.04 1.48
Area in greenhouse SqM 770 250 256 0 0 264% 100.0% 32.5% 33.2% 0.0% 0.0% 34.3%
N 550 39 112 64 47 288
Individual Largeholder Selected Characteristics by Province Province

57 | P a g e
4 FUTURE TRACKING OF HORTICULTURE ORGANISATIONS
This section presents some considerations for how MINAGRI/NAEB can continue to track changes in the horticulture sector on a more regular basis. The RHOS 2013 is a census of horticulture organisations and largeholder producers in Rwanda. It is a comprehensive survey that provides a benchmark for future comparison. A detailed survey program like the RHOS 2013 is neither necessary nor feasible, financially or otherwise, to complete on an annual basis. More appropriate will be to conduct a similar enumeration five years from now. That will give sector managers and investors an important gauge to assess how the diverse and dynamic components of the sector are evolving and how those components are responding to investments, promotion programs and changing consumer demand for horticulture products in Rwanda.
Yet, waiting five years for the next census of horticulture associations will not satisfy the need for a focused, ongoing system for tracking some of the major parameters of the sector. For a small investment of resources MINAGRI/NAEB will be in a position to implement a targeted system that will provide essential measures of how and where the sector is growing. The subsections below are intended to provide a starting point for the discussion. We frame out a set of recommended variables for regular tracking as well as some of the options and considerations for how, and how often, data can be collected, processed and reported.
Data Updates. The variables to be updated on a regular (e.g., annual) basis must be selected carefully by MINAGRI/NAEB as the principles of resource availability and cost efficiency will undoubtedly drive/limit what can and cannot be achieved during the “intercensal” period. Perhaps the most important variables to track will be simply: 1) the number of organisations, 2) their geographic locations, 3) their male and female membership, 4) the principle crops and products that are grown and produced, and 5) their up-to-date contacts. These variables alone will be indicative of the pace and direction of growth in the sector. They are also the key variables needed for keeping a directory of horticulture organisations.
A second tier of variables may include total production volumes (Kg/Lt) and sales (FRW). These data will be especially important for estimating total annual production and sales and are similarly indicative of the growth of the sector. These figures will effectively be the equivalent of the MINAGRI’s annual estimates of farm production.
A third tier of variables that can be considered for regular tracking can be those variables that are especially indicative of modernisation of the sector. They include square meters of greenhouse production, installation of irrigation systems, and attaining industry certifications.
Data Collection & Processing. The variables listed above are similar to those collected for the individual largeholder farmers. These data were collected mostly through relatively short telephone interviews. An annual effort using five province-level enumerators for 4 weeks will likely be sufficient for collecting the 6-12 variables identified for regular tracking. Data collection should begin with the listing and key variables collected during the RHOS 2013. Ideally this will be a listing that shows all current data on one line and leaves the subsequent line open for any updates/changes.

58 | P a g e
The major challenge will be not be the data collection phase of the operation; it will be the task of keeping the listing of organisations up-to-date. While the current database is believed to be quite complete, as of December, 2013, we know that the horticulture landscape is changing very rapidly. Figures presented in this report suggest that the number of horticulture organisations is doubling every 3-4 years. It is likely that growth in the number of organisations will continue for at least a few more years as government programs and promotion take effect. Perhaps more likely in the long run is that we will see the number of organisations level off but their membership continue to expand as existing organisations become more established, gain access to additional land and attract new members.
The variables recommended above for collection will enable MINAGRI/NAEB to track such changes with some precision. Updating the listing with newly formed organisations will require coordination with the district agricultural offices. The enumerators will be required to schedule visits in each district to go over the listing and identify organisations that should be added, as well as those that have dissolved. If the lists are kept up yearly the task of updating them will be relatively simple. The longer the wait the greater the effort required. Enumerators for the RHOS 2013 took an average of five days to complete the listing operation in their assigned districts. That could be reduced to 2 days per district if the listings are updated annually.
Cleaning and processing of the data can be completed in SPSS and should take one person less than a week, from start finish. The major tables and graphs can be decided upon in advance and once the syntax is written it will serve for subsequent years as well. Each year of data should be merged onto the master file that will contain each successive year of data. The first variable in the file should be “enumeration year” and that will enable future time series analysis and comparisons/graphics over multiple years. Potentially the data (minus the names and contacts) can be made available online for other users, assuming any confidentiality concerns can be addressed.

59 | P a g e
ANNEXES
• Tables • Maps • Questionnaire • RHOS Database Variables and Parameters by Questionnaire Section

60 | P a g e
Horticulture Sales Value (FRW) and Volumes (Kg) by Crop Table 1.
Crop & Crop Group N
Mean Value of
Sales (FRW)
Total Value of
Sales (FRW)
Percent of Total Value
of Sales (%)
Mean Volume of
Sales (KG)
Total Volume of
Sales (FRW)
Pct Total Volume of Sales (%)
Total Hort Crops 3,171 1,682,963 5,334,993,326 100.0% 9,477 29,728,155 100.0%
Total Fruits 647 1,671,173 1,081,249,203 20.3% 9,303 5,935,558 20.0%Apple 4 522,500 2,090,000 0.0% 331 1,325 0.0%Avocado 30 120,489 3,614,665 0.1% 848 24,603 0.1%Banana (fruit) 11 810,470 8,915,175 0.2% 6,488 64,880 0.2%Cape Gooseberry 4 125,000 500,000 0.0% 250 1,000 0.0%Lemon 6 303,333 1,820,000 0.0% 1,967 11,800 0.0%Mango 24 456,736 10,961,665 0.2% 5,434 124,990 0.4%Orange 17 198,627 3,376,665 0.1% 159 2,550 0.0%Papaya 12 27,417 329,000 0.0% 93 1,116 0.0%Passion fruit 120 3,102,506 372,300,750 7.0% 8,829 1,033,050 3.5%Pineapple 227 1,457,790 330,918,388 6.2% 16,713 3,793,914 12.8%Strawberry 8 2,609,375 20,875,000 0.4% 7,827 62,617 0.2%Tamarillos 155 2,055,580 318,614,895 6.0% 5,073 781,218 2.6%Other fruit 29 239,069 6,933,000 0.1% 1,161 32,495 0.1%
Total Vegetables 2,403 1,717,400 4,125,193,962 77.3% 9,830 23,532,832 79.2%Cabbage 548 661,967 362,757,834 6.8% 6,942 3,797,258 12.8%Carrot 341 703,443 239,874,171 4.5% 4,905 1,667,792 5.6%Eggplant (local) 282 1,199,395 338,229,305 6.3% 6,183 1,743,501 5.9%French beans 88 2,114,005 186,032,400 3.5% 13,876 1,221,109 4.1%Leek 15 99,147 1,487,210 0.0% 1,044 15,666 0.1%Mushrooms 45 1,165,807 52,461,300 1.0% 1,591 71,607 0.2%Onion 233 3,733,879 869,993,848 16.3% 18,250 4,233,931 14.2%Pepper 33 235,843 7,782,820 0.1% 477 15,756 0.1%Sweet pepper 164 3,745,431 614,250,762 11.5% 9,790 1,595,836 5.4%Tomato 300 4,460,778 1,333,772,550 25.0% 28,228 8,440,051 28.4%Other vegetable 354 334,892 118,551,762 2.2% 2,087 730,325 2.5%
Total Herbs & Spices 27 255,585 6,900,800 0.1% 1,325 34,438 0.1%Garlic 3 1,520,000 4,560,000 0.1% 6,400 19,200 0.1%Parsley 23 88,730 2,040,800 0.0% 556 12,238 0.0%Other H&S 1 300,000 300,000 0.0% 3,000 3,000 0.0%
Total Nuts 3 18,960,000 56,880,000 1.1% 27,667 83,000 0.3%Macadamia 3 18,960,000 56,880,000 1.1% 27,667 83,000 0.3%
Total Cut Flowers 76 809,386 61,513,361 1.2% 2,079 126,830 0.4%Aromas 16 938,056 15,008,892 0.3% 4,654 65,154 0.2%Calla lilies 2 238,334 476,667 0.0% 50 50 0.0%Carnations 2 233,834 467,667 0.0% 1 1 0.0%Chrysanthemum 1 466,667 466,667 0.0% 0 0 0.0%Gladiolus 2 252,334 504,667 0.0% 137 137 0.0%Pastels 1 466,667 466,667 0.0% 0 0 0.0%Roses 8 1,024,583 8,196,667 0.2% 297 1,780 0.0%Saint Joseph (Lys) 6 636,111 3,816,667 0.1% 930 3,720 0.0%Other cut flower 38 844,968 32,108,800 0.6% 1,647 55,988 0.2%
Total Processing Flowers 15 217,067 3,256,000 0.1% 1,033 15,497 0.1%Geranium Lemon grass 2 250,000 500,000 0.0% 1,529 3,057 0.0%Patchouli 1 516,000 516,000 0.0% 1,290 1,290 0.0%Other processing flowers 12 186,667 2,240,000 0.0% 929 11,150 0.0%
Horticulture Sales Value (FRW) and Volumes (Kg) by Crop
Value of Horticulture Sales (FRW) Volume of Horticulture Sales (KG)

61 | P a g e
Horticulture Sales Value (FRW) by Crop and Province Table 2.
Crop & Crop Group N
Total Value of
Sales (FRW)
Pct of Total Value of
Sales (%)
Total Value of
Sales (FRW)
Pct of Total Value of
Sales (%)
Total Value of
Sales (FRW)
Pct of Total Value of
Sales (%)
Total Value of
Sales (FRW)
Pct of Total Value of
Sales (%)
Total Value of
Sales (FRW)
Pct of Total Value of
Sales (%)
Total Value of
Sales (FRW)
Pct of Total Value of
Sales (%)
Total Hort Crops 3,171 5,334,993,326 100.0% 468,777,144 100.0% 1,980,773,200 100.0% 1,313,044,544 100.0% 694,985,745 100.0% 877,412,693 100.0%
Total Fruits 647 1,081,249,203 20.3% 11,955,100 2.6% 56,990,600 2.9% 325,134,150 24.8% 506,129,600 72.8% 181,039,753 20.6%Apple 4 2,090,000 0.0% 2,000,000 0 0.0% 0 0.0% 90,000 0.0% 0 0.0%Avocado 30 3,614,665 0.1% 838,000 0.2% 140,000 0.0% 570,000 0.0% 280,000 0.0% 1,786,665 0.2%Banana (fruit) 11 8,915,175 0.2% 1,164,000 0.2% 500,000 0.0% 600,000 0.0% 42,000 0.0% 6,609,175 0.8%Cape Gooseberry 4 500,000 0.0% 0 0.0% 0 0.0% 0 0.0% 500,000 0.1% 0 0.0%Lemon 6 1,820,000 0.0% 600,000 0.1% 0 0.0% 1,060,000 0.1% 0 0.0% 160,000 0.0%Mango 24 10,961,665 0.2% 545,000 0.1% 0 0.0% 9,180,000 0.7% 0 0.0% 1,236,665 0.1%Orange 17 3,376,665 0.1% 600,000 0.1% 0 0.0% 110,000 0.0% 0 0.0% 2,666,665 0.3%Papaya 12 329,000 0.0% 320,000 0.1% 0 0.0% 0 0.0% 9,000 0.0% 0 0.0%Passion fruit 120 372,300,750 7.0% 1,098,100 0.2% 10,297,900 0.5% 83,503,400 6.4% 277,098,350 39.9% 303,000 0.0%Pineapple 227 330,918,388 6.2% 2,470,000 0.5% 36,200,700 1.8% 54,547,950 4.2% 79,041,600 11.4% 158,658,138 18.1%Strawberry 8 20,875,000 0.4% . 0.0% 1,200,000 0.1% 17,275,000 1.3% 2,400,000 0.3% 0 0.0%Tamarillos 155 318,614,895 6.0% 2,200,000 0.5% 6,902,000 0.3% 158,152,800 12.0% 145,828,650 21.0% 5,531,445 0.6%Other fruit 29 6,933,000 0.1% 120,000 0.0% 1,750,000 0.1% 135,000 0.0% 840,000 0.1% 4,088,000 0.5%
Total Vegetables 2,403 4,125,193,962 77.3% 428,505,044 91.4% 1,918,677,000 96.9% 920,408,033 70.1% 180,175,945 25.9% 677,427,940 77.2%Cabbage 548 362,757,834 6.8% 62,442,229 13.3% 154,253,950 7.8% 44,350,920 3.4% 42,200,825 6.1% 59,509,910 6.8%Carrot 341 239,874,171 4.5% 16,009,730 3.4% 29,390,540 1.5% 162,301,011 12.4% 15,836,370 2.3% 16,336,520 1.9%Eggplant (local) 282 338,229,305 6.3% 43,356,255 9.2% 211,211,650 10.7% 24,421,300 1.9% 21,916,100 3.2% 37,324,000 4.3%French beans 88 186,032,400 3.5% 122,720,900 26.2% 57,226,500 2.9% 2,078,000 0.2% 1,793,000 0.3% 2,214,000 0.3%Leek 15 1,487,210 0.0% 303,350 0.1% 100,000 0.0% 300,000 0.0% 304,000 0.0% 479,860 0.1%Mushrooms 45 52,461,300 1.0% 19,355,100 4.1% 1,240,000 0.1% 5,052,600 0.4% 10,369,600 1.5% 16,444,000 1.9%Onion 233 869,993,848 16.3% 44,396,168 9.5% 660,336,600 33.3% 78,417,380 6.0% 5,800,400 0.8% 81,043,300 9.2%Pepper 33 7,782,820 0.1% 985,500 0.2% 2,333,420 0.1% 3,213,000 0.2% 43,400 0.0% 1,207,500 0.1%Sweet pepper 164 614,250,762 11.5% 16,460,300 3.5% 514,378,400 26.0% 36,444,462 2.8% 7,606,000 1.1% 39,361,600 4.5%Tomato 300 1,333,772,550 25.0% 76,570,950 16.3% 247,443,890 12.5% 540,834,860 41.2% 64,235,000 9.2% 404,687,850 46.1%Other vegetable 354 118,551,762 2.2% 25,904,562 5.5% 40,762,050 2.1% 22,994,500 1.8% 10,071,250 1.4% 18,819,400 2.1%
Total Herbs & Spices 27 6,900,800 0.1% 0 0.0% 106,600 0.0% 4,694,000 0.4% 815,200 0.1% 1,285,000 0.1%Garlic 3 4,560,000 0.1% 0 0.0% 0 0.0% 4,160,000 0.3% 400,000 0.1% 0 0.0%Parsley 23 2,040,800 0.0% 0 0.0% 106,600 0.0% 534,000 0.0% 115,200 0.0% 1,285,000 0.1%Other H&S 1 300,000 0.0% 0 0.0% 0 0.0% 0 0.0% 300,000 0.0% 0 0.0%
Total Nuts 3 56,880,000 1.1% 0 0.0% 0 0.0% 39,420,000 3.0% 0 0.0% 17,460,000 2.0%Macadamia 3 56,880,000 1.1% 0 0.0% 0 0.0% 39,420,000 3.0% 0 0.0% 17,460,000 2.0%
Total Cut Flowers 76 61,513,361 1.2% 25,777,000 5.5% 4,999,000 0.3% 22,872,361 1.7% 7,865,000 1.1% 0 0.0%Aromas 16 15,008,892 0.3% 2,500,000 0.5% 4,000,000 0.2% 783,892 0.1% 7,725,000 1.1% 0 0.0%Calla lilies 2 476,667 0.0% 0 0.0% 0 0.0% 476,667 0.0% 0 0.0% 0 0.0%Carnations 2 467,667 0.0% 0 0.0% 1,000 0.0% 466,667 0.0% 0 0.0% 0 0.0%Chrysanthemum 1 466,667 0.0% 0 0.0% 0 0.0% 466,667 0.0% 0 0.0% 0 0.0%Gladiolus 2 504,667 0.0% 0 0.0% 38,000 0.0% 466,667 0.0% 0 0.0% 0 0.0%Pastels 1 466,667 0.0% 0 0.0% 0 0.0% 466,667 0.0% 0 0.0% 0 0.0%Roses 8 8,196,667 0.2% 1,650,000 0.4% 480,000 0.0% 6,066,667 0.5% 0 0.0% 0 0.0%Saint Joseph (Lys) 6 3,816,667 0.1% 2,220,000 0.5% 480,000 0.0% 1,066,667 0.1% 50,000 0.0% 0 0.0%Other cut flower 38 32,108,800 0.6% 19,407,000 4.1% 0 0.0% 12,611,800 1.0% 90,000 0.0% 0 0.0%
Total Processing Flowers 15 3,256,000 0.1% 2,540,000 0.5% 0 0.0% 516,000 0.0% 0 0.0% 200,000 0.0%Geranium Lemon grass 2 500,000 0.0% 300,000 0.1% 0 0.0% 0 0.0% 0 0.0% 200,000 0.0%Patchouli 1 516,000 0.0% . 0.0% 0 0.0% 516,000 0.0% 0 0.0% 0 0.0%Other processing flowers 12 2,240,000 0.0% 2,240,000 0.5% 0 0.0% 0 0.0% 0 0.0% 0 0.0%
Horticulture Sales Value by Crop and Province, 2013Province
EastNorthWestSouthKigaliRwanda

62 | P a g e
Horticulture Crop Production (Kg) Sales (Kg) & Difference between Table 3.Production and Sales by Crop Category, Province and District
Crop/Crop Group N KG % KG % KG (%)
Total Hort Crops 3,094 29,727,769 100.0% 26,789,553 100.0% -2,938,216 -9.9%
Total Fruits 621 6,338,494 21.3% 5,595,958 20.9% -742,536 -11.7%Passion fruit 116 1,087,095 3.7% 992,050 3.7% -95,045 -8.7%Pineapple 221 4,309,403 14.5% 3,769,794 14.1% -539,609 -12.5%Tamarillos 150 701,833 2.4% 640,218 2.4% -61,615 -8.8%Other fruit 134 240,163 0.8% 193,896 0.7% -46,267 -19.3%
Total Vegetables 2,353 23,149,474 77.9% 20,951,830 78.2% -2,197,644 -9.5%Cabbage 543 4,360,176 14.7% 3,440,198 12.8% -919,978 -21.1%Carrot 333 1,577,450 5.3% 1,431,382 5.3% -146,068 -9.3%Eggplant (local) 275 2,160,133 7.3% 1,561,431 5.8% -598,702 -27.7%French beans 86 510,506 1.7% 495,909 1.9% -14,597 -2.9%Mushrooms 45 77,447 0.3% 71,607 0.3% -5,840 -7.5%Onion 225 4,246,921 14.3% 4,078,511 15.2% -168,410 -4.0%Pepper 32 17,837 0.1% 12,396 0.0% -5,441 -30.5%Sweet pepper 160 1,581,280 5.3% 1,539,054 5.7% -42,226 -2.7%Tomato 295 7,724,846 26.0% 7,686,951 28.7% -37,895 -0.5%Other vegetable 359 892,878 3.0% 634,391 2.4% -258,487 -28.9%
Total Other Hort Crops 120 239,801 0.8% 241,765 0.9% 1,964 0.8%All Herbs & Spices 26 16,533 0.1% 16,438 0.1% -95 -0.6%Macadamia nut 3 83,050 0.3% 83,000 0.3% -50 -0.1%All cut flowers 76 135,321 0.5% 126,830 0.5% -8,491 -6.3%All processing flowers 15 4,897 0.0% 15,497 0.1% 10,600 216.5%
Horticulture Crop Production and Sales (KG) by Crop(Producer Organisations)
Crop Production Crops SoldDifference
(Sold - Produced)

63 | P a g e
Horticulture Sales Value (FRW) by Crop Category, Province and District Table 4.
N FRW % FRW % FRW % FRW %
RWANDA 3,171 5,334,993,326 100.0% 1,081,249,203 100.0% 4,125,193,962 100.0% 128,550,161 100.0%
Kigali Province 397 468,777,144 8.8% 11,955,100 1.1% 428,505,044 10.4% 28,317,000 22.0%Gasabo 244 360,861,000 6.8% 9,961,100 0.9% 323,759,900 7.8% 27,140,000 21.1%Kicukiro 108 51,911,190 1.0% 294,000 0.0% 50,440,190 1.2% 1,177,000 0.9%Nyarugenge 45 56,004,954 1.0% 1,700,000 0.2% 54,304,954 1.3% 0 0.0%
South Province 677 1,980,773,200 37.1% 56,990,600 5.3% 1,918,677,000 46.5% 5,105,600 4.0%Gisagara 37 7,756,970 0.1% 4,820,000 0.4% 2,936,970 0.1% 0 0.0%Huye 189 62,479,170 1.2% 1,225,000 0.1% 56,253,170 1.4% 5,001,000 3.9%Kamonyi 156 1,818,762,540 34.1% 14,594,100 1.3% 1,804,168,440 43.7% 0 0.0%Muhanga 67 33,935,620 0.6% 10,753,000 1.0% 23,132,620 0.6% 50,000 0.0%Nyamagabe 71 13,526,250 0.3% 11,449,600 1.1% 2,076,650 0.1% 0 0.0%Nyanza 75 18,399,050 0.3% 70,000 0.0% 18,274,450 0.4% 54,600 0.0%Nyaruguru 38 3,491,500 0.1% 1,940,500 0.2% 1,551,000 0.0% 0 0.0%Ruhango 44 22,422,100 0.4% 12,138,400 1.1% 10,283,700 0.2% 0 0.0%
West Province 716 1,313,044,544 24.6% 325,134,150 30.1% 920,408,033 22.3% 67,502,361 52.5%Karongi 85 92,504,300 1.7% 42,313,000 3.9% 10,671,300 0.3% 39,520,000 30.7%Ngororero 30 65,003,000 1.2% 62,459,500 5.8% 2,543,500 0.1% 0 0.0%Nyabihu 67 100,034,861 1.9% 66,603,200 6.2% 32,915,661 0.8% 516,000 0.4%Nyamasheke 87 18,908,080 0.4% 11,388,400 1.1% 7,519,680 0.2% 0 0.0%Rubavu 254 283,751,593 5.3% 43,297,600 4.0% 213,357,632 5.2% 27,096,361 21.1%Rusizi 136 659,440,260 12.4% 13,870,000 1.3% 645,230,260 15.6% 340,000 0.3%Rutsiro 57 93,402,450 1.8% 85,202,450 7.9% 8,170,000 0.2% 30,000 0.0%
North Province 505 694,985,745 13.0% 506,129,600 46.8% 180,175,945 4.4% 8,680,200 6.8%Burera 42 13,792,120 0.3% 10,302,000 1.0% 3,030,120 0.1% 460,000 0.4%Gakenke 89 224,781,100 4.2% 204,766,100 18.9% 20,015,000 0.5% 0 0.0%Gicumbi 202 230,882,775 4.3% 176,794,850 16.4% 53,917,725 1.3% 170,200 0.1%Musanze 41 149,395,650 2.8% 98,873,650 9.1% 50,522,000 1.2% 0 0.0%Rulindo 131 76,134,100 1.4% 15,393,000 1.4% 52,691,100 1.3% 8,050,000 6.3%
East Province 876 877,412,693 16.4% 181,039,753 16.7% 677,427,940 16.4% 18,945,000 14.7%Bugesera 175 223,461,830 4.2% 20,708,850 1.9% 202,357,980 4.9% 395,000 0.3%Gatsibo 252 80,830,360 1.5% 9,460,000 0.9% 71,090,360 1.7% 280,000 0.2%Kayonza 112 206,759,980 3.9% 5,422,280 0.5% 200,927,700 4.9% 410,000 0.3%Kirehe 65 137,207,423 2.6% 55,191,823 5.1% 81,815,600 2.0% 200,000 0.2%Ngoma 128 84,284,435 1.6% 56,191,835 5.2% 27,792,600 0.7% 300,000 0.2%Nyagatare 71 61,584,065 1.2% 22,478,965 2.1% 38,905,100 0.9% 200,000 0.2%Rwamagana 73 83,284,600 1.6% 11,586,000 1.1% 54,538,600 1.3% 17,160,000 13.3%
Horticulture Sales Value (FRW) by Crop Category, Province and District
Province & District
Other Horticulture Crop Sales (FRW)
Fruit Crop Sales (FRW)
Vegetable CropSales (FRW)
Total Horticulture Crop Sales (FRW)
Crop Category

64 | P a g e
Horticulture Sales Volume (Kg) by Crop Category, Province and District Table 5.
N KG % KG % KG % KG %
RWANDA 3,171 29,728,155 100.0% 5,935,558 100.0% 23,532,832 100.0% 259,765 100.0%
Kigali Province 397 3,799,510 12.8% 38,896 0.7% 3,728,784 15.8% 31,830 12.3%Gasabo 244 3,068,888 10.3% 32,716 0.6% 3,011,812 12.8% 24,360 9.4%Kicukiro 108 260,038 0.9% 580 0.0% 251,988 1.1% 7,470 2.9%Nyarugenge 45 470,584 1.6% S 5,600 0.1% 464,984 2.0% 0 0.0%
South Province 677 9,170,344 30.8% 1,102,286 18.6% 8,062,910 34.3% 5,148 2.0%Gisagara 37 63,485 0.2% 26,850 0.5% 36,635 0.2% 0 0.0%Huye 189 415,294 1.4% 7,455 0.1% 403,281 1.7% 4,558 1.8%Kamonyi 156 7,389,946 24.9% 104,146 1.8% 7,285,800 31.0% 0 0.0%Muhanga 67 165,009 0.6% 49,230 0.8% 115,279 0.5% 500 0.2%Nyamagabe 71 56,366 0.2% 41,795 0.7% 14,571 0.1% 0 0.0%Nyanza 75 98,537 0.3% 1,200 0.0% 97,247 0.4% 90 0.0%Nyaruguru 38 30,845 0.1% 7,405 0.1% 23,440 0.1% 0 0.0%Ruhango 44 950,862 3.2% 864,205 14.6% 86,657 0.4% 0 0.0%
West Province 716 5,672,678 19.1% 1,255,357 21.1% 4,283,265 18.2% 134,056 51.6%Karongi 85 281,381 0.9% 121,886 2.1% 100,495 0.4% 59,000 22.7%Ngororero 30 275,104 0.9% 251,827 4.2% 23,277 0.1% 0 0.0%Nyabihu 67 464,148 1.6% 196,944 3.3% 265,914 1.1% 1,290 0.5%Nyamasheke 87 154,594 0.5% 82,975 1.4% 71,619 0.3% 0 0.0%Rubavu 254 1,760,227 5.9% 186,176 3.1% 1,502,005 6.4% 72,046 27.7%Rusizi 136 2,358,960 7.9% 135,715 2.3% 2,221,645 9.4% 1,600 0.6%Rutsiro 57 378,264 1.3% 279,834 4.7% 98,310 0.4% 120 0.0%
North Province 505 3,220,142 10.8% 1,678,631 28.3% 1,488,737 6.3% 52,774 20.3%Burera 42 49,428 0.2% 15,720 0.3% 33,268 0.1% 440 0.2%Gakenke 89 1,070,801 3.6% 929,682 15.7% 141,119 0.6% 0 0.0%Gicumbi 202 837,879 2.8% 443,026 7.5% 394,519 1.7% 334 0.1%Musanze 41 709,889 2.4% 221,958 3.7% 487,931 2.1% 0 0.0%Rulindo 131 552,145 1.9% 68,245 1.1% 431,900 1.8% 52,000 20.0%
East Province 876 7,865,481 26.5% 1,860,388 31.3% 5,969,136 25.4% 35,957 13.8%Bugesera 175 1,908,084 6.4% 170,660 2.9% 1,735,424 7.4% 2,000 0.8%Gatsibo 252 591,860 2.0% 110,100 1.9% 481,360 2.0% 400 0.2%Kayonza 112 1,907,375 6.4% 26,460 0.4% 1,880,215 8.0% 700 0.3%Kirehe 65 1,592,250 5.4% 750,864 12.7% 840,386 3.6% 1,000 0.4%Ngoma 128 837,267 2.8% 583,116 9.8% 253,751 1.1% 400 0.2%Nyagatare 71 489,000 1.6% 119,788 2.0% 366,355 1.6% 2,857 1.1%Rwamagana 73 539,645 1.8% 99,400 1.7% 411,645 1.7% 28,600 11.0%
Horticulture Crop Sales (KG)
Vegetable Crop Sales (KG)
Other Horticulture Crop Sales (KG) Province &
District
Crop Category
Horticulture Sales Volume (Kg) by Crop Category, Province and District
Fruit Crop Sales (KG)

65 | P a g e
N Ha % Ha % Ha % Ha %
RWANDA 1,155 6,278 100.0% 3,627 100.0% 2,574 100.0% 77 100.0%
Kigali Province 110 308 4.9% 22 0.6% 259 10.0% 27 35.0%Gasabo 61 194 3.1% 4 0.1% 187 7.2% 3 4.4%Kicukiro 29 57 0.9% 18 0.5% 37 1.4% 2 2.7%Nyarugenge 20 58 0.9% 1 0.0% 35 1.4% 22 27.9%
South Province 267 1,056 16.8% 296 8.2% 758 29.5% 1 1.9%Gisagara 16 29 0.5% 17 0.5% 12 0.5% 0 0.0%Huye 68 146 2.3% 7 0.2% 138 5.4% 1 1.2%Kamonyi 50 395 6.3% 112 3.1% 283 11.0% 0 0.0%Muhanga 27 198 3.1% 84 2.3% 114 4.4% 0 0.0%Nyamagabe 40 41 0.7% 31 0.9% 10 0.4% 0 0.0%Nyanza 24 178 2.8% 7 0.2% 171 6.6% 0 0.0%Nyaruguru 21 21 0.3% 9 0.3% 12 0.4% 0 0.1%Ruhango 21 49 0.8% 31 0.8% 18 0.7% 1 0.6%
West Province 294 1,061 16.9% 520 14.3% 510 19.8% 31 39.9%Karongi 43 220 3.5% 181 5.0% 38 1.5% 1 0.6%Ngororero 21 107 1.7% 60 1.7% 44 1.7% 3 3.9%Nyabihu 32 57 0.9% 29 0.8% 23 0.9% 5 7.0%Nyamasheke 46 151 2.4% 103 2.8% 49 1.9% 0 0.0%Rubavu 72 294 4.7% 26 0.7% 246 9.6% 22 28.3%Rusizi 51 133 2.1% 39 1.1% 95 3.7% 0 0.0%Rutsiro 29 99 1.6% 83 2.3% 16 0.6% 0 0.0%
North Province 206 497 7.9% 259 7.1% 221 8.6% 17 21.5%Burera 17 27 0.4% 12 0.3% 15 0.6% 1 1.4%Gakenke 43 181 2.9% 159 4.4% 18 0.7% 4 5.2%Gicumbi 77 111 1.8% 41 1.1% 70 2.7% 0 0.1%Musanze 23 65 1.0% 13 0.3% 47 1.8% 5 7.1%Rulindo 46 112 1.8% 35 1.0% 71 2.7% 6 7.8%
East Province 278 3,357 53.5% 2,530 69.7% 826 32.1% 1 1.7%Bugesera 56 248 3.9% 81 2.2% 166 6.5% 0 0.4%Gatsibo 54 182 2.9% 93 2.6% 88 3.4% 0 0.0%Kayonza 23 140 2.2% 15 0.4% 125 4.9% 0 0.0%Kirehe 31 1,368 21.8% 1,176 32.4% 192 7.4% 0 0.0%Ngoma 54 1,111 17.7% 1,045 28.8% 67 2.6% 0 0.0%Nyagatare 33 95 1.5% 64 1.8% 30 1.2% 1 1.3%Rwamagana 27 214 3.4% 56 1.5% 158 6.1% 0 0.0%
Horticulture Area Cultivated (Ha) by Crop Category, Province and District
Crop Category
Province & District
Total Fruits,Veg & Flowers Fruits Vegetables Flowers
Horticulture Area Cultivated (Ha) by Crop Category, Province and District Table 6.

66 | P a g e
Value (FRW) and Volume (Kg) of Horticulture Table 7.Processed Products by Province and District
N FRW % KG/LT %
RWANDA TOTAL 40 1,794,356,400 100.0% 2,146,371 100.0%
Kigali Province * 0 1,461,580,000 81.5% 1,392,500 64.9%Gasabo 0 60,000,000 3.3% 50,000 2.3%Kicukiro 0 1,401,580,000 78.1% 1,342,500 0.0%Nyarugenge 0 0 0.0% 0 0.0%
South Province 15 40,195,000 2.2% 79,590 3.7%Gisagara 1 7,000,000 0.4% 14,000 0.7%Huye 6 6,445,000 0.4% 43,990 2.0%Kamonyi 2 6,160,000 0.3% 7,700 0.4%Muhanga 0 0 0.0% 0 0.0%Nyamagabe 4 15,350,000 0.9% 8,500 0.4%Nyanza 0 0 0.0% 0 0.0%Nyaruguru 0 0 0.0% 0 0.0%Ruhango 2 5,240,000 0.3% 5,400 0.3%
West Province 7 22,620,000 1.3% 15,740 0.7%Karongi 1 21,600,000 1.2% 8,640 0.4%Ngororero 0 0 0.0% 0 0.0%Nyabihu 0 0 0.0% 0 0.0%Nyamasheke 1 0 0.0% 5,200 0.2%Rubavu 2 200,000 0.0% 200 0.0%Rusizi 2 700,000 0.0% 1,300 0.1%Rutsiro 1 120,000 0.0% 400 0.0%
North Province 14 262,294,000 14.6% 645,449 30.1%Burera 0 0 0.0% 0 0.0%Gakenke 5 50,674,000 2.8% 19,464 0.9%Gicumbi 9 211,620,000 11.8% 625,985 29.2%Musanze 0 0 0.0% 0 0.0%Rulindo 0 0 0.0% 0 0.0%
East Province 4 7,667,400 0.4% 13,092 0.6%Bugesera 0 0 0.0% 0 0.0%Gatsibo 0 0 0.0% 0 0.0%Kayonza 0 0 0.0% 0 0.0%Kirehe 1 500,000 0.0% 362 0.0%Ngoma 2 6,966,000 0.4% 12,672 0.6%Nyagatare 1 201,400 0.0% 58 0.0%Rwamagana 0 0 0.0% 0 0.0%
*Includes Kg & FRW reported for Kigali processors in Horticulture Processors Database, NAEB 2013
Horticulture Processed Product Sales (FRW)
Horticulture Processed Product Sales (KG)Province &
District
Value (FRW) and Volume (KG) of Processed Products Sold by Horticulture Organizations in Rwanda, 2013
(Shown by Province and District)

67 | P a g e
Horticulture Sales Value (FRW) by Crop and Province Table 8.
Crop/Crop Group N
Total Value of
Sales (FRW)
Total Value of
Sales (%)
Total Value of
Sales (FRW)
Total Value of
Sales (%)
Total Value of
Sales (FRW)
Total Value of
Sales (%)
Total Value of
Sales (FRW)
Total Value of
Sales (%)
Total Value of
Sales (FRW)
Total Value of
Sales (%)
Total Value of
Sales (FRW)
Total Value of
Sales (%)
Total Hort Crops 3,171 5,334,993,326 100.0% 468,777,144 100.0% 1,980,773,200 100.0% 1,313,044,544 100.0% 694,985,745 100.0% 877,412,693 100.0%Total Fruits 647 1,081,249,203 20.3% 11,955,100 2.6% 56,990,600 2.9% 325,134,150 24.8% 506,129,600 72.8% 181,039,753 20.6%
Passion fruit 120 372,300,750 7.0% 1,098,100 0.2% 10,297,900 0.5% 83,503,400 6.4% 277,098,350 39.9% 303,000 0.0%Pineapple 227 330,918,388 6.2% 2,470,000 0.5% 36,200,700 1.8% 54,547,950 4.2% 79,041,600 11.4% 158,658,138 18.1%Tamarillos 155 318,614,895 6.0% 2,200,000 0.5% 6,902,000 0.3% 158,152,800 12.0% 145,828,650 21.0% 5,531,445 0.6%Other fruit 145 59,415,170 1.1% 6,187,000 1.3% 3,590,000 0.2% 28,930,000 2.2% 4,161,000 0.6% 16,547,170 1.9%
Total Vegetables 2,403 4,125,193,962 77.3% 428,505,044 91.4% 1,918,677,000 96.9% 920,408,033 70.1% 180,175,945 25.9% 677,427,940 77.2%Cabbage 548 362,757,834 6.8% 62,442,229 13.3% 154,253,950 7.8% 44,350,920 3.4% 42,200,825 6.1% 59,509,910 6.8%Carrot 341 239,874,171 4.5% 16,009,730 3.4% 29,390,540 1.5% 162,301,011 12.4% 15,836,370 2.3% 16,336,520 1.9%Eggplant (local) 282 338,229,305 6.3% 43,356,255 9.2% 211,211,650 10.7% 24,421,300 1.9% 21,916,100 3.2% 37,324,000 4.3%French beans 88 186,032,400 3.5% 122,720,900 26.2% 57,226,500 2.9% 2,078,000 0.2% 1,793,000 0.3% 2,214,000 0.3%Mushrooms 45 52,461,300 1.0% 19,355,100 4.1% 1,240,000 0.1% 5,052,600 0.4% 10,369,600 1.5% 16,444,000 1.9%Onion 233 869,993,848 16.3% 44,396,168 9.5% 660,336,600 33.3% 78,417,380 6.0% 5,800,400 0.8% 81,043,300 9.2%Pepper 33 7,782,820 0.1% 985,500 0.2% 2,333,420 0.1% 3,213,000 0.2% 43,400 0.0% 1,207,500 0.1%Sweet pepper 164 614,250,762 11.5% 16,460,300 3.5% 514,378,400 26.0% 36,444,462 2.8% 7,606,000 1.1% 39,361,600 4.5%Tomato 300 1,333,772,550 25.0% 76,570,950 16.3% 247,443,890 12.5% 540,834,860 41.2% 64,235,000 9.2% 404,687,850 46.1%Other vegetable 369 120,038,972 2.3% 26,207,912 5.6% 40,862,050 2.1% 23,294,500 1.8% 10,375,250 1.5% 19,299,260 2.2%
Total Other Hort Crops 121 128,550,161 2.4% 28,317,000 6.0% 5,105,600 0.3% 67,502,361 5.1% 8,680,200 1.2% 18,945,000 2.2%All Herbs & Spices 27 6,900,800 0.1% - 0.0% 106,600 0.0% 4,694,000 0.4% 815,200 0.1% 1,285,000 0.1%Macadamia nut 3 56,880,000 1.1% - 0.0% - 0.0% 39,420,000 3.0% - 0.0% 17,460,000 2.0%All cut flowers 76 61,513,361 1.2% 25,777,000 5.5% 4,999,000 0.3% 22,872,361 1.7% 7,865,000 1.1% - 0.0%All processing flowers 15 3,256,000 0.1% 2,540,000 0.5% - 0.0% 516,000 0.0% - 0.0% 200,000 0.0%
Horticulture Sales Value (FRW) by Crop and ProvinceProvince
Rwanda Kigali South West North East

68 | P a g e
Horticulture Sales Volume (Kg) by Crop and Province Table 9.
Crop/Crop Group N
Total Volume ofSales (KG)
Total Vol. of
Sales (%)
Total Volume ofSales (KG)
Total Vol. of
Sales (%)
Total Volume ofSales (KG)
Total Vol. of
Sales (%)
Total Volume ofSales (KG)
Total Vol. of
Sales (%)
Total Volume ofSales (KG)
Total Vol. of
Sales (%)
Total Volume ofSales (KG)
Total Vol. of
Sales (%)
Total Hort Crops 3,171 29,728,155 100.0% 3,799,510 100.0% 9,170,344 100.0% 5,672,678 100.0% 3,220,142 100.0% 7,865,481 100.0%Total Fruits 647 5,935,558 20.0% 38,896 1.0% 1,102,286 12.0% 1,255,357 22.1% 1,678,631 52.1% 1,860,388 23.7%
Passion fruit 120 1,033,050 3.5% 1,187 0.0% 22,517 0.2% 345,680 6.1% 663,336 20.6% 330 0.0%Pineapple 227 3,793,914 12.8% 10,750 0.3% 1,047,634 11.4% 325,545 5.7% 637,372 19.8% 1,772,613 22.5%Tamarillos 155 781,218 2.6% 2,000 0.1% 8,685 0.1% 422,375 7.4% 340,448 10.6% 7,710 0.1%Other fruit 145 327,376 1.1% 24,959 0.7% 23,450 0.3% 161,757 2.9% 37,475 1.2% 79,735 1.0%
Total Vegetables 2,403 23,532,832 79.2% 3,728,784 98.1% 8,062,910 87.9% 4,283,265 75.5% 1,488,737 46.2% 5,969,136 75.9%Cabbage 548 3,797,258 12.8% 949,784 25.0% 1,069,045 11.7% 569,619 10.0% 542,894 16.9% 665,916 8.5%Carrot 341 1,667,792 5.6% 240,327 6.3% 136,564 1.5% 1,048,890 18.5% 117,821 3.7% 124,190 1.6%Eggplant (local) 282 1,743,501 5.9% 387,895 10.2% 708,574 7.7% 213,610 3.8% 159,936 5.0% 273,486 3.5%French beans 88 1,221,109 4.1% 834,802 22.0% 346,195 3.8% 9,960 0.2% 11,212 0.3% 18,940 0.2%Mushrooms 45 71,607 0.2% 43,874 1.2% 1,650 0.0% 3,517 0.1% 11,192 0.3% 11,374 0.1%Onion 233 4,233,931 14.2% 112,460 3.0% 3,301,014 36.0% 440,912 7.8% 16,433 0.5% 363,112 4.6%Pepper 33 15,756 0.1% 4,510 0.1% 2,312 0.0% 4,095 0.1% 434 0.0% 4,405 0.1%Sweet pepper 164 1,595,836 5.4% 55,350 1.5% 1,046,890 11.4% 247,102 4.4% 26,487 0.8% 220,007 2.8%Tomato 300 8,440,051 28.4% 866,684 22.8% 1,280,691 14.0% 1,573,395 27.7% 542,329 16.8% 4,176,952 53.1%Other vegetable 369 745,991 2.5% 233,098 6.1% 169,975 1.9% 172,165 3.0% 59,999 1.9% 110,754 1.4%
Total Other Hort Crops 121 259,765 0.9% 31,830 0.8% 5,148 0.1% 134,056 2.4% 52,774 1.6% 35,957 0.5%All Herbs & Spices 27 34,438 0.1% - 0.0% 610 0.0% 26,240 0.5% 3,488 0.1% 4,100 0.1%Macadamia nut 3 83,000 0.3% - 0.0% - 0.0% 54,000 1.0% - 0.0% 29,000 0.4%All cut flowers 76 126,830 0.4% 20,480 0.5% 4,538 0.0% 52,526 0.9% 49,286 1.5% - 0.0%All processing flowers 15 15,497 0.1% 11,350 0.3% - 0.0% 1,290 0.0% - 0.0% 2,857 0.0%
Horticulture Sales Volume (Kg) by Crop and ProvinceProvince
Rwanda Kigali South West North East

69 | P a g e
Greenhouse and Other Buildings (SqM) Property of Horticulture Table 10.Organisations (Shown by Building Type, Province and District)
N SqM % SqM % SqM % SqM % SqM % SqM % SqM %
RWANDA TOTAL 1,155 27,678 100.0% 57,012 100.0% 7,085 100.0% 6,572 100.0% 956 100.0% 91 100.0% 6,361 100.0%
Kigali Province 110 9,452 34.1% 11,337 19.9% 298 4.2% 508 7.7% 40 4.2% 35 38.5% 598 9.4%Gasabo 61 6,882 24.9% 1,039 1.8% 115 1.6% 408 6.2% 40 4.2% 35 38.5% 184 2.9%Kicukiro 29 1,470 5.3% 274 0.5% 95 1.3% 12 0.2% 0 0.0% 0 0.0% 414 6.5%Nyarugenge 20 1,100 4.0% 10,024 17.6% 88 1.2% 88 1.3% 0 0.0% 0 0.0% 0 0.0%
South Province 267 9,094 32.9% 24,784 43.5% 1,585 22.4% 1,456 22.2% 333 34.8% 5 5.5% 450 7.1%Gisagara 16 0 0.0% 117 0.2% 30 0.4% 21 0.3% 16 1.7% 5 5.5% 0 0.0%Huye 68 1,586 5.7% 21,993 38.6% 850 12.0% 1,154 17.6% 175 18.3% 0 0.0% 104 1.6%Kamonyi 50 768 2.8% 1,153 2.0% 243 3.4% 241 3.7% 34 3.6% 0 0.0% 250 3.9%Muhanga 27 0 0.0% 448 0.8% 158 2.2% 0 0.0% 48 5.0% 0 0.0% 0 0.0%Nyamagabe 40 2,192 7.9% 36 0.1% 51 0.7% 20 0.3% 0 0.0% 0 0.0% 96 1.5%Nyanza 24 1,208 4.4% 603 1.1% 96 1.4% 0 0.0% 0 0.0% 0 0.0% 0 0.0%Nyaruguru 21 3,340 12.1% 205 0.4% - 0.0% 20 0.3% 0 0.0% 0 0.0% 0 0.0%Ruhango 21 0 0.0% 228 0.4% 157 2.2% 0 0.0% 60 6.3% 0 0.0% 0 0.0%
West Province 294 1,184 4.3% 7,969 14.0% 1,536 21.7% 1,343 20.4% 134 14.0% 15 16.5% 566 8.9%Karongi 43 0 0.0% 372 0.7% 12 0.2% 12 0.2% 20 2.1% 0 0.0% 0 0.0%Ngororero 21 0 0.0% 592 1.0% 106 1.5% 538 8.2% 24 2.5% 0 0.0% 32 0.5%Nyabihu 32 0 0.0% 303 0.5% 267 3.8% 100 1.5% 0 0.0% 0 0.0% 0 0.0%Nyamasheke 46 32 0.1% 126 0.2% 80 1.1% 82 1.2% 20 2.1% 0 0.0% 0 0.0%Rubavu 72 852 3.1% 5,796 10.2% 552 7.8% 286 4.4% 0 0.0% 15 16.5% 90 1.4%Rusizi 51 0 0.0% 326 0.6% 466 6.6% 220 3.3% 70 7.3% 0 0.0% 24 0.4%Rutsiro 29 300 1.1% 454 0.8% 53 0.7% 105 1.6% 0 0.0% 0 0.0% 420 6.6%
North Province 206 4,318 15.6% 3,185 5.6% 820 11.6% 814 12.4% 406 42.5% 6 6.6% 3,602 56.6%Burera 17 0 0.0% 28 0.0% 240 3.4% 0 0.0% 153 16.0% 0 0.0% 0 0.0%Gakenke 43 1,356 4.9% 1,085 1.9% 100 1.4% 80 1.2% 32 3.3% 0 0.0% 0 0.0%Gicumbi 77 2,122 7.7% 754 1.3% 134 1.9% 176 2.7% 181 18.9% 0 0.0% 0 0.0%Musanze 23 200 0.7% 893 1.6% 105 1.5% 56 0.9% 0 0.0% 0 0.0% 0 0.0%Rulindo 46 640 2.3% 425 0.7% 241 3.4% 502 7.6% 40 4.2% 6 6.6% 3,602 56.6%
East Province 278 3,630 13.1% 9,737 17.1% 2,846 40.2% 2,451 37.3% 43 4.5% 30 33.0% 1,145 18.0%Bugesera 56 192 0.7% 929 1.6% 603 8.5% 182 2.8% 0 0.0% 28 30.8% 463 7.3%Gatsibo 54 1,250 4.5% 665 1.2% 359 5.1% 109 1.7% 13 1.4% 2 2.2% 0 0.0%Kayonza 23 848 3.1% 316 0.6% 296 4.2% 136 2.1% 0 0.0% 0 0.0% 160 2.5%Kirehe 31 0 0.0% 863 1.5% 736 10.4% 80 1.2% 0 0.0% 0 0.0% 522 8.2%Ngoma 54 0 0.0% 622 1.1% 116 1.6% 973 14.8% 6 0.6% 0 0.0% 0 0.0%Nyagatare 33 0 0.0% 5,245 9.2% 80 1.1% 395 6.0% 24 2.5% 0 0.0% 0 0.0%Rwamagana 27 1,340 4.8% 1,097 1.9% 656 9.3% 576 8.8% 0 0.0% 0 0.0% 0 0.0%
OtherBuilding
Building Type
Greenhouse and Other Buildings (SqM) Property of Horticulture Organisations(Shown by Building Type, Province and District)
Province & District
GreenhouseOffice
Building WarehouseCollection
Center PackhouseCold
Storage

70 | P a g e
Use of Irrigation Systems by Horticulture Organisations Table 11.(Shown by System Type, Province and District)
N % N % N % N % N % N %
RWANDA 1,155 49 100.0% 660 100.0% 7 100.0% 37 100.0% 93 100.0% 1 100.0%
Kigali Province 110 11 22.4% 78 11.8% 0 0.0% 3 8.1% 16 17.2% 0 0.0%Gasabo 61 6 12.2% 49 7.4% 0 0.0% 1 2.7% 1 1.1% 0 0.0%Kicukiro 29 3 6.1% 23 3.5% 0 0.0% 2 5.4% 15 16.1% 0 0.0%Nyarugenge 20 2 4.1% 6 0.9% 0 0.0% 0 0.0% 0 0.0% 0 0.0%
South Province 267 12 24.5% 158 23.9% 3 42.9% 18 48.6% 24 25.8% 0 0.0%Gisagara 16 0 0.0% 11 1.7% 0 0.0% 0 0.0% 2 2.2% 0 0.0%Huye 68 5 10.2% 49 7.4% 2 28.6% 4 10.8% 9 9.7% 0 0.0%Kamonyi 50 0 0.0% 29 4.4% 1 14.3% 1 2.7% 4 4.3% 0 0.0%Muhanga 27 0 0.0% 10 1.5% 0 0.0% 0 0.0% 2 2.2% 0 0.0%Nyamagabe 40 4 8.2% 20 3.0% 0 0.0% 12 32.4% 5 5.4% 0 0.0%Nyanza 24 2 4.1% 21 3.2% 0 0.0% 1 2.7% 2 2.2% 0 0.0%Nyaruguru 21 0 0.0% 8 1.2% 0 0.0% 0 0.0% 0 0.0% 0 0.0%Ruhango 21 1 2.0% 10 1.5% 0 0.0% 0 0.0% 0 0.0% 0 0.0%
West Province 294 2 4.1% 161 24.4% 0 0.0% 1 2.7% 20 21.5% 0 0.0%Karongi 43 0 0.0% 23 3.5% 0 0.0% 0 0.0% 1 1.1% 0 0.0%Ngororero 21 0 0.0% 7 1.1% 0 0.0% 0 0.0% 2 2.2% 0 0.0%Nyabihu 32 0 0.0% 22 3.3% 0 0.0% 0 0.0% 4 4.3% 0 0.0%Nyamasheke 46 0 0.0% 15 2.3% 0 0.0% 0 0.0% 5 5.4% 0 0.0%Rubavu 72 2 4.1% 44 6.7% 0 0.0% 0 0.0% 2 2.2% 0 0.0%Rusizi 51 0 0.0% 34 5.2% 0 0.0% 0 0.0% 5 5.4% 0 0.0%Rutsiro 29 0 0.0% 16 2.4% 0 0.0% 1 2.7% 1 1.1% 0 0.0%
North Province 206 7 14.3% 106 16.1% 1 14.3% 0 0.0% 2 2.2% 0 0.0%Burera 17 1 2.0% 5 0.8% 0 0.0% 0 0.0% 1 1.1% 0 0.0%Gakenke 43 2 4.1% 22 3.3% 1 14.3% 0 0.0% 0 0.0% 0 0.0%Gicumbi 77 3 6.1% 59 8.9% 0 0.0% 0 0.0% 1 1.1% 0 0.0%Musanze 23 0 0.0% 5 0.8% 0 0.0% 0 0.0% 0 0.0% 0 0.0%Rulindo 46 1 2.0% 15 2.3% 0 0.0% 0 0.0% 0 0.0% 0 0.0%
East Province 278 17 34.7% 157 23.8% 3 42.9% 15 40.5% 31 33.3% 1 100.0%Bugesera 56 2 4.1% 31 4.7% 1 14.3% 2 5.4% 12 12.9% 1 100.0%Gatsibo 54 2 4.1% 43 6.5% 0 0.0% 10 27.0% 4 4.3% 0 0.0%Kayonza 23 7 14.3% 18 2.7% 1 14.3% 3 8.1% 5 5.4% 0 0.0%Kirehe 31 3 6.1% 13 2.0% 0 0.0% 0 0.0% 2 2.2% 0 0.0%Ngoma 54 0 0.0% 20 3.0% 0 0.0% 0 0.0% 0 0.0% 0 0.0%Nyagatare 33 0 0.0% 13 2.0% 0 0.0% 0 0.0% 3 3.2% 0 0.0%Rwamagana 27 3 6.1% 19 2.9% 1 14.3% 0 0.0% 5 5.4% 0 0.0%
Use of Irrigation Systems by Horticulture Organisations(Shown by System Type, Province and District)
Irrigation System Type
Province & District
DripHand
DeliveredGroundwater
DiversionStorage Tanks (Gravity Fed)
Mechanical (Pumped)
OtherIrrigation
N Total Orgs

71 | P a g e
Characteristics of Loans to Organisations over Past 24 Months Table 12.(Shown by Province and District)
RWANDA 1,155 184 1,899,102,055 100.0% 8.0 9.7%
Kigali Province 110 15 48,720,000 2.6% 9.0 9.3%Gasabo 61 7 21,880,000 1.2% 4.0 13.1%Kicukiro 29 3 18,500,000 1.0% 14.0 6.3%Nyarugenge 20 5 8,340,000 0.4% 12.0 5.6%
South Province 267 51 119,031,000 6.3% 9.0 9.4%Gisagara 16 3 5,500,000 0.3% 9.0 17.3%Huye 68 7 4,400,000 0.2% 1.0 17.0%Kamonyi 50 14 48,100,000 2.5% 20.0 4.8%Muhanga 27 8 34,200,000 1.8% 7.0 10.9%Nyamagabe 40 6 9,140,000 0.5% 5.0 10.2%Nyanza 24 4 5,511,000 0.3% 3.0 7.6%Nyaruguru 21 2 1,600,000 0.1% 1.0 16.0%Ruhango 21 7 10,580,000 0.6% 7.0 6.7%
West Province 294 32 624,400,000 32.9% 12.0 16.4%Karongi 43 6 19,900,000 1.0% 16.0 15.1%Ngororero 21 4 516,000,000 27.2% 18.0 18.3%Nyabihu 32 6 8,700,000 0.5% 4.0 16.6%Nyamasheke 46 3 3,600,000 0.2% 12.0 8.0%Rubavu 72 7 40,200,000 2.1% 12.0 20.9%Rusizi 51 4 10,800,000 0.6% 2.0 17.0%Rutsiro 29 2 25,200,000 1.3% 30.0 12.0%
North Province 206 38 1,008,425,680 53.1% 8.0 9.3%Burera 17 3 5,600,000 0.3% 5.0 7.3%Gakenke 43 12 22,840,000 1.2% 8.0 13.1%Gicumbi 77 17 24,462,680 1.3% 6.0 5.3%Musanze 23 0 - - - - Rulindo 46 6 955,523,000 50.3% 17.0 14.8%
East Province 278 48 98,525,375 5.2% 4.0 5.9%Bugesera 56 17 12,090,000 0.6% 3.0 2.3%Gatsibo 54 6 5,482,000 0.3% 3.0 7.0%Kayonza 23 3 1,787,375 0.1% 7.0 10.7%Kirehe 31 2 21,600,000 1.1% 0.0 7.5%Ngoma 54 8 14,000,000 0.7% 4.0 6.4%Nyagatare 33 7 3,566,000 0.2% 2.0 9.4%Rwamagana 27 5 40,000,000 2.1% 9.0 6.5%
Characteristics of Loans to Organisations Over Past 24 Months(Shown by Province and District)
Number of Loans
Sum ofLoans (FRW)
Percent of Sum
Mean months
leftInterest
Rate
Loan Characteristics
Province & District
Total Orgs (N)

72 | P a g e
Selected Organisational Characteristics by Table 13.Percent Female Membership Quartiles
Organizational Characteristic
Low1st Quartile
(percent) 2nd Quartile
(percent) 3rd Quartile
(percent)
High4th Quartile
(percent) Total
(percent) N
Main source of revenueFruit sales 43.20% 37.60% 32.70% 31.40% 36.20% 402Vegetable sales 53.30% 60.50% 63.70% 67.50% 61.20% 679Other hort crop sales 2.10% 1.50% 2.50% 0.70% 1.70% 19Hort processed product sales 1.40% 0.40% 1.10% 0.40% 0.80% 9
Total 100.00% 100.00% 100.00% 100.00% 100.00% 1109
Estimated value of owned assets0 to 3M 57.20% 56.80% 63.70% 70.80% 62.10% 6893 to 10m 22.10% 24.40% 21.80% 16.10% 21.10% 23410 to 30m 11.20% 11.30% 8.80% 8.40% 9.90% 110More than 30m 9.50% 7.50% 5.60% 4.70% 6.90% 76
Total 100.00% 100.00% 100.00% 100.00% 100.00% 1109
Highest registration level attainedNone 31.70% 25.90% 27.50% 25.20% 27.60% 306Sector 26.40% 21.10% 19.70% 20.80% 22.00% 244District 16.20% 19.90% 18.70% 17.50% 18.10% 200RCA 25.70% 33.10% 34.20% 36.50% 32.30% 358
Total 100.00% 100.00% 100.00% 100.00% 100.00% 1108
Organization industry certified No 96.80% 97.70% 97.90% 97.10% 97.40% 1080Yes 3.20% 2.30% 2.10% 2.90% 2.60% 29
Total 100.00% 100.00% 100.00% 100.00% 100.00% 1109
Organization has paid managerial staffNo 91.90% 92.50% 93.70% 97.10% 93.80% 1040Yes 8.10% 7.50% 6.30% 2.90% 6.20% 69
Total 100.00% 100.00% 100.00% 100.00% 100.00% 1109
Selected Organizational Characteristics by Percent Female Membership QuartilesPercent Female Membershop Quartile

73 | P a g e
Location of Land on Hillside by Selected Categories of Land Use Table 14.
Production Area (Ha) by Location on the Hillside and Province Table 15.
Land Use % (Ha) % (Ha) % (Ha) % (Ha)
Total area 44.1% 4,428 35.6% 3,576 20.3% 2,038 100% 10,042 Production area 37.1% 2,648 28.6% 2,040 34.3% 2,448 100% 7,135 Fruit area 5.6% 168 64.8% 1,945 29.6% 887 100% 3,001 Vegetable area 78.5% 2,008 11.9% 303 9.7% 247 100% 2,559 Flower area 88.5% 68 9.9% 8 1.6% 1 100% 77 Irrigated area 83.0% 1,457 9.9% 174 7.2% 126 100% 1,756 Org Own area 39.8% 320 17.2% 139 43.0% 346 100% 806 Indiv owned area 18.6% 852 70.3% 3,227 11.1% 510 100% 4,589 Comm owned area 73.4% 2,010 13.3% 366 13.3% 364 100% 2,740 Privately owned area 40.9% 293 24.1% 173 35.0% 252 100% 718 Other owned area 61.8% 117 15.4% 29 22.7% 43 100% 189 Purchased area 27.2% 423 46.3% 719 26.5% 412 100% 1,554 Gift area 10.2% 208 82.9% 1,696 6.9% 142 100% 2,045 No cost leased area 75.9% 2,404 11.7% 370 12.4% 392 100% 3,166 Cost lease area 57.1% 978 21.5% 368 21.5% 368 100% 1,713
Location of Land on Hillside
Location of Land on Hillside by Selected Categories of Land Use
Valley Low hillside High hillside Total
Province Sum (Ha) % (Ha) Sum (Ha) % (Ha) Sum (Ha) % (Ha) Sum (Ha) % (Ha)Kigali 328 90.7% 12 3.2% 22 6.1% 362 100.0%South 719 65.4% 215 19.6% 166 15.1% 1,100 100.0%West 460 40.9% 317 28.2% 348 30.9% 1,124 100.0%North 187 33.9% 167 30.3% 197 35.8% 551 100.0%East 954 23.9% 1,330 33.2% 1,715 42.9% 3,999 100.0%
Rwanda 2,648 37.1% 2,040 28.6% 2,448 34.3% 7,135 100.0%
Production Area (Ha) by Locationon the Hillside and Province
Localization of land on hillside
Valley Low hillside High hillside Total

74 | P a g e
Sources of Information Received by Organisations by Type of Information Table 16.
Total (all types)
Improved production
practicesPrice of
inputs
Post-Harvest
practices
Improved processing
practicesTransport
costs
Markets for crops/
products
Market require ments
Market prices
Certification (e.g., organic,
Fair Trade)
Improved manage-
ment practices
Improved business practices
(%) (%) (%) (%) (%) (%) (%) (%) (%) (%) (%) (%)
Total All Sources 100.0% 100.0% 100.0% 100.0% 100.0% 100.0% 100.0% 100.0% 100.0% 100.0% 100.0% 100.0%
Total Tech Sources 18.4% 28.5% 25.2% 12.8% 20.4% 10.8% 16.7% 15.8% 20.7% 23.8% 10.2% 12.9%Radio 11.6% 22.6% 18.8% 9.2% 13.7% 4.9% 6.9% 6.8% 9.6% 17.7% 7.9% 7.9%Television 0.6% 1.0% 0.7% 0.6% 2.0% 0.2% 0.4% 0.5% 0.3% 1.8% 0.2% 0.5%Internet 0.6% 0.7% 0.3% 0.9% 1.7% 0.2% 0.6% 0.5% 0.5% 2.3% 0.4% 0.5%Mobile phone 5.5% 4.2% 5.4% 2.0% 2.9% 5.5% 8.8% 8.0% 10.3% 2.0% 1.7% 4.0%
Total Pers-to-Pers Sources 79.7% 68.3% 73.2% 85.6% 75.4% 88.9% 82.2% 82.8% 78.5% 71.4% 86.7% 85.0%Org. members 23.3% 16.4% 12.8% 34.2% 23.5% 35.4% 25.5% 22.0% 22.4% 14.9% 29.7% 25.0%Friends/family 6.8% 4.4% 5.2% 7.5% 8.0% 11.2% 8.7% 6.8% 8.5% 2.8% 5.3% 5.6%Other producers 19.2% 13.2% 14.8% 17.7% 15.2% 25.5% 25.1% 25.2% 23.8% 12.3% 16.2% 17.1%Product sales agents 13.8% 1.4% 18.0% 4.4% 9.8% 13.8% 18.3% 21.0% 20.1% 4.5% 2.4% 28.6%Extension agents 13.1% 25.8% 20.2% 18.0% 14.0% 2.1% 3.4% 6.3% 2.9% 29.0% 23.2% 6.4%Project/NGO 3.6% 7.0% 2.1% 3.9% 5.0% 0.9% 1.2% 1.5% 0.9% 7.9% 9.9% 2.3%
Total Printed Sources 2.0% 3.2% 1.6% 1.6% 4.2% 0.3% 1.1% 1.4% 0.8% 4.8% 3.1% 2.1%Extension publications 0.8% 1.7% 0.5% 0.8% 1.9% 0.2% 0.2% 0.3% 0.2% 2.2% 1.7% 0.3%Commercial pubs 0.6% 0.7% 0.7% 0.7% 1.5% 0.1% 0.3% 0.4% 0.4% 1.5% 0.4% 0.6%Newspapers 0.6% 0.7% 0.4% 0.1% 0.9% 0.1% 0.6% 0.8% 0.3% 1.2% 1.0% 1.2%
N 1,155 1,155 1,155 1,155 1,155 1,155 1,155 1,155 1,155 1,155 1,155 1,155
Sources of Information Received by Organisations by Type of InformationType of Information
Primary & Secondary sources of information
(combined)

75 | P a g e
Horticulture Crops Produced by Table 17.Individual Largeholder Producers
Crop Crop N Crop %
Total Hort Crops 974 100.0%
Total Fruits 296 30.4%Avocado 19 2.0%Banana (fruit) 10 1.0%Lemon 3 0.3%Mango 20 2.1%Orange 23 2.4%Papaya 3 0.3%Passion fruit 31 3.2%Pineapple 85 8.7%Strawberry 2 0.2%Tamarillos 83 8.5%Other fruit 17 1.7%
Total Vegetables 663 68.1%Cabbage 110 11.3%Carrot 56 5.7%Eggplant (local) 82 8.4%French beans 13 1.3%Leek 3 0.3%Mushrooms 5 0.5%Onion 55 5.6%Pepper 38 3.9%Sweet pepper 39 4.0%Tomato 209 21.5%Other vegetable 53 5.4%
Total Herbs & Spice 4 0.4%Garlic 1 0.1%Parsley 3 0.3%
Total Nuts 4 0.4%Other nut 4 0.4%
Total Cut Flowers 7 0.7%Aromas 2 0.2%Roses 1 0.1%Other cut flower 4 0.4%
Horticulture Crops Produced by Individual Largeholder Producers

76 | P a g e
Value (FRW) and Area (Ha) in Horticulture by Individual Table 18.Largeholder Producers (Shown by Province and District)
N FRW % Ha %
RWANDA TOTAL 550 527,525,142 100.0% 712 100.0%
Kigali Province 39 85,114,200 16.1% 38 5.3%Gasabo 25 44,306,200 8.4% 20 2.8%Kicukiro 14 40,808,000 7.7% 18 2.5%Nyarugenge 0 . 0.0% . 0.0%
South Province 112 87,343,942 16.6% 142 19.9%Gisagara 16 26,705,942 5.1% 24 3.4%Huye 2 3,261,600 0.6% 3 0.4%Kamonyi 26 13,852,500 2.6% 30 4.3%Muhanga 19 10,385,000 2.0% 22 3.1%Nyamagabe 11 1,510,000 0.3% 17 2.4%Nyanza 27 27,026,000 5.1% 30 4.2%Nyaruguru 3 842,900 0.2% 5 0.7%Ruhango 8 3,760,000 0.7% 10 1.3%
West Province 64 64,199,200 12.2% 60 8.4%Karongi 16 10,119,000 1.9% 18 2.5%Ngororero 0 . 0.0% . 0.0%Nyabihu 6 12,300,000 2.3% 7 1.0%Nyamasheke 19 16,219,000 3.1% 16 2.2%Rubavu 1 258,000 0.0% 1 0.1%Rusizi 14 22,872,000 4.3% 12 1.6%Rutsiro 8 2,431,200 0.5% 7 0.9%
North Province 47 40,198,000 7.6% 49 6.9%Burera 10 6,580,000 1.2% 9 1.2%Gakenke 7 6,903,000 1.3% 7 0.9%Gicumbi 1 5,000,000 0.9% 14 2.0%Musanze 15 18,274,000 3.5% 9 1.2%Rulindo 14 3,441,000 0.7% 11 1.6%
East Province 288 250,669,800 47.5% 424 59.5%Bugesera 21 22,220,000 4.2% 27 3.8%Gatsibo 52 61,863,800 11.7% 82 11.5%Kayonza 27 34,700,000 6.6% 25 3.5%Kirehe 74 40,121,000 7.6% 72 10.1%Ngoma 19 11,895,000 2.3% 23 3.2%Nyagatare 50 50,120,000 9.5% 152 21.3%Rwamagana 45 29,750,000 5.6% 45 6.3%
Horticulture Sales (FRW)Province &
District
Value (FRW) and Area (Ha) in Horticulture by Individual Largeholder Producers (Shown by Province and District)
Area in Horticulture (Ha)

77 | P a g e
Map 1. Organisations by Area (Ha) in Production

78 | P a g e
Map 2. Organisations by Main Source of Revenue and Level of Revenue

79 | P a g e
Map 3. Horticulture Organisations by Main Crop Sold

80 | P a g e
Map 4. Cabbage Sales by District and Level of Sales (FRW Tertiles) 2
2 Tertiles are computed as three equally-sized groups based on their levels of sales (FRW). They constitute a convenient method for grouping organisations by their degree of sales of a given crop. The 1st tertile is at the low end of the scale and contains the lowest third of organisations based on their sales of the crop. The 3rd tertile, by contrast, contains the highest third of organisations in terms of their sales of the crop.

81 | P a g e
Map 5. Carrot Sales by District and Level of Sales (FRW Tertiles)

82 | P a g e
Map 6. Eggplant Sales by District and Level of Sales (FRW Tertiles)

83 | P a g e
Map 7. Onion Sales by District and Level of Sales (FRW Tertiles)

84 | P a g e
Map 8. Sweet Pepper Sales by District and Level of Sales (FRW Tertiles)

85 | P a g e
Map 9. Tamarillo Sales by District and Level of Sales (FRW Tertiles)

86 | P a g e
Map 10. Tomato Sales by District and Level of Sales (FRW Tertiles)

87 | P a g e
Map 11. Other Vegetable Sales by District and Level of Sales (FRW Tertiles)

88 | P a g e
Map 12. Passion Fruit Sales by District and Level of Sales (FRW Tertiles)

89 | P a g e
Map 13. Pineapple Sales by District and Level of Sales (FRW Tertiles)

90 | P a g e
Map 14. Other Fruit Sales by District and Level of Sales (FRW Tertiles)

91 | P a g e
Map 15. Specialty Crops Sales by District and Level of Sales (FRW Tertiles)

92 | P a g e
Map 16. Organisations by Percent Female Membership (Quartiles)

Horticulture Cooperatives / Associations / Companies Survey – 2013 Ministry of Agriculture and Animal Resources (MINAGRI) / National Agricultural Export Board (NAEB) of Rwanda
Questionnaire
KeyID Number | | | | | | | | (Transcribe from page 1: Provence Q1.1, District Q1.2, Org. Nbr Q1.12)

INTERVIEWER: My name is .......................................and I’m part of a team from the MINAGRI in collaboration with the National Agricultural Export Board of Rwanda (NAEB). We are carrying out national survey of horticulture organisations in Rwanda. The results of the survey will enable the Government of Rwanda to plan for the country’s horticulture sector development and growth. You can be assured that the information provided is for statistical purposes and will remain confidential and will not be disclosed for any reason whatsoever. May we proceed? NOTE: The term “horticultural organisations” will be used in this survey to refer to the cooperatives, associations, and private sector companies completing the survey.
Horticulture Cooperatives / Associations / Companies Survey – 2013 Ministry of Agriculture and Animal Resources (MINAGRI) / National Agricultural Export Board (NAEB) of Rwanda
Section 1. Identification of the Organisation Q1.11 Name of organisation: _____________________________
Q1.12 Organisation Number (Assign sequential number
starting with 001)
└──┴──┴──┘ Q1.13 Is horticulture production, processing or marketing one of the primary activities of the organization?
0 - No (End survey here) 1 - Yes (Continue)
Q1.14 GPS -- Geo-coordinates of organization (local operational headquarters)
Record in decimal degree format (DD.DDDDDD)
Latitude: − | | |.| | | | | | |
Longitude: | | |.| | | | | | |
Q1.15 Name and contacts of respondent (for follow up): A. Name: _________________________________________________ B. Position: _______________________________________________ C. Telephone: _____________________________________________ D. Email: _________________________________________________
Q1.1 Province (circle code) 1 - Kigali 2 - South 3 - West 4 - North 5 - East
Q1.2 District (circle code)
1 - Gasabo 2 - Kicukiro 3 - Nyarugenge
1 - Gisagara 2 - Huye 3 - Kamonyi 4 - Muhanga 5 - Nyamagabe 6 - Nyanza 7 - Nyaruguru 8 - Ruhango
1 - Karongi 2 - Ngororero 3 - Nyabihu 4 - Nyamasheke 5 - Rubavu 6 - Rusizi 7 - Rutsiro
1 - Burera 2 - Gakenke 3 - Gicumbi 4 - Musanze 5 - Rulindo
1 - Bugesera 2 - Gatsibo 3 - Kayonza 4 - Kirehe 5 - Ngoma 6 - Nyagatare 7 - Rwamagana
Q1.3 Sector _____________
_____________ _____________
___________ ______________
Q1.4 Cellule _____________
_____________ _____________
___________ ______________
Q1.5 Village _____________
_____________ _____________
___________ ______________
Q1.6 Interviewer name: _________________________________
Q1.7 Date of interview (DDMMYY)
| ı | ı | ı |
Q1.8 Time of interv. hh:mm A. Start | | |:| | | B. Finish | | |:| | |
Q1.9 Supervisor name: _________________________________
Q1.10 Date of verification (DDMMYY)
| ı | ı | ı |

2
Section 2. Organizational Characteristics Q2.1 What type of organisation is this?
1 - Cooperative (registered) 2 - Association (registered) 3 - Association (not registered) 4 - Private Company 5 - Individual largeholder producer 6 - Other (Specify)______________________________
Q2.6 How many paid full-time and part-time employees have you employed over the past 12 months?
(For part-time employees, also record their total person-days over past 12 mos)
A. Full time (on salary)? | | | | B. Part time? | | | | (If “0”, skip to Q2.7)
C. Total person-days over past 12 mos? | | | | Q2.2 What is the highest level at which your organisation is registered? (Circle code)
1 - None 2 - Sector 3 - District 4 - RCA
Q2.7 How has the number of members changed… (circle code)
A. … over the past 3 years? 1 - Grown 2 - Declined 3 - Stayed about the same 4 - DK or NA
B. Projected over the next 3 years? 1 - Will grow 2 - Will decline 3 - Will stay about the same 4 - DK or NA
Q2.3 A. In what year was the organisation established? | | | | |
B. In what year was the organisation officially registered? | | | | |
Q2.4 With which bodies is the organisation affiliated/registered… (Circle codes)
A. Aff w/ Natl Confederation of Coops of Rwanda (NCCR)? 0 - No 1 - Yes B. Aff w/ Rwanda Hort Inter-professional Org (RHIO)? 0 - No 1 - Yes C. Reg w/ Rwanda Cooperative Agency (RCA)? 0 - No 1 - Yes D. Reg /w Rwanda Development Board (RDB)? 0 - No 1 - Yes E. Aff w/ Rwanda Private Sector Federation (RPSF)? 0 - No 1 - Yes
Q2.8 What are the primary types of horticultural activities of the organisation… ? (Check all that apply)
A. Production (cultivation of horticulture crops. NOTE: For cooperatives & associations, this applies only to crops grown on collectively operated land. Exclude crops grown on farmer-operated land)
B. Post-Harvest handling (packing, cold storage, transport, etc.) C. Processing (juices, preserves, dried fruit, etc.) D. Marketing (e.g., wholesale, retail, exports, etc.) E. Other (specify) ______________________________________
[“Now we would like to ask you some questions about these horticultural activities”]
Q2.5 How many active members are there in the organisation… ? A. Total? | | | | | B. Male? | | | | | C. Female? | | | | |
D. What is the average number of person-days worked per member over the past 12 months? | | | | (avg. person-days)

3
Section 3. Horticulture Production, Post-Harvest Handling and Marketing CROPS PRODUCTION POST HARVEST SALES & MARKETING
Q3.1 A & B Q3.2 Q3.3 Q3.4 Q3.5 Q3.6 Q3.7 Q3.8 Q3.9 Q3.10 Q3.11 Q3.12 Q3.13 Q3.14 What fruits, vegetables and other horticulture crops has your organisation harvested or handled over last 12 months?
(see crop codes below)
Seed/plant material used? None ......... 0 Own/trad ... 1 Improved ... 2 Both .......... 3 DK ............ 4
Fertiliser used? None...............0 Trad/Org .........1 Commercial ....2 Both ................3
Pesticides/ Fungicides used? None .......... 0 Org/IPM ..... 1 Commerc. .. 2 Both ........... 3
Primary Irrigation used? None ........ 0 Drip .......... 1 Sprinkler ... 2 By hand .... 3 Other ........ 4
What quantity have you harvested over the last 12 months? All harvest measured in Kgs
Did you provide grading & sorting to meet market require ments?
No .... 0 Yes .. 1
Did you provide specialized packaging? None ...... 0 Boxes ..... 1 Sacks ..... 2 Crates .... 3 Other ...... 4
Did you provide cold storage? No .......... 0 Yes ......... 1
What quantity have you sold over the course of the last 12 months?
What was the total amount you received from the sale?
If coop or assoc… What was the estimated amount received per participating member?
What was the principal outlet/market for this sale?
Wholesale trader .. 1 Retail trader ......... 2 Cooperative ......... 3 Processor. ........... 4 Supermarket. ....... 5 International Co.... 6 Other ................... 7
Was this crop grown on contract order? No .... 0 Yes ... 1 Both .. 2
Name of crops Code Code Code Code Code Kg Code Code Code Kg RWF RWF Code Code
Fruits 1 - Apple 2 - Avocado 3 - Banana (fruit) 4 - Cape
Gooseberry 5 - Japanese plum 6 - Lemon 7 - Mango
8 - Orange 9 - Papaya 10 - Passion fruit 11 - Pineapple 12 - Strawberry 13 - Tamarillos 19 - Other fruit
Vegetables 20 - Bird’s eye
chilies 21 - Cabbage 22 - Carrot 23 - Eggplant
(local) 24 - French beans 25 - Leek
26 - Mushrooms 27 - Onion 28 - Pepper 29 - Sweet pepper 30 - Tomato 39 - Other vegetable
Herbs & Spices 40 - Garlic 41 - Ginger 42 - Parsley 43 - Spicy grass 49 - Other H&S
Nuts 50 - Macadamia 59 - Other nut
Cut Flowers 60 - Aromas 61 - Calla lilies 62 - Carnations 63 - Chrysanthemum 64 - Gladiolus 65 - Pastels 66 - Roses 67 - Saint Joseph (Lys) 79 - Other cut flower
Flowers/herbs for processing 80 - Eucalyptus 81 - Geranium Lemon grass 82 - Patchouli 83 - Pyrethrum 89 - Other processing flowers

4
Section 4. Horticulture Processing Q4.1 A&B Q4.2 A&B Q4.3 A&B Q4.4 A&B Q4.5 Q4.6 Q4.7 Q4.8 Q4.9
What horticultural products has your organisation produced over last 12 months?
(see product codes below)
How did you source your raw fruits & veg?
(Identify primary and secondary sources)
Own production .......... 1 Cooperative ............... 2 Producers (farmgate) .. 3 Whlsale trader ............ 4 Commercial co ........... 5 Other ......................... 6
What quantity of processed product have you produced over the last 12 months?
Unit codes Kg ............. 1 Liter .......... 2
What quantity of processed product have you sold over the course of the last 12 months?
Unit codes Kg ............. 1 Liter .......... 2
What was the total amount (FRW) you received from the sale?
If coop or association… What was the estimated average amount (FRW) received per participating member?
What was the primary packaging material used for this product at the time of sale? None ............................. 0 Paper cont. for whlsale .. 1 Paper cont. for retail ..... 2 Plastic cont. for whlsale . 3 Plastic cont for retail ...... 4 Metal cans .................... 5 Glass bottles ................. 6 Other packaging ............ 7
What was the primary outlet/market for this sale?
Wholesale trader .. 1 Retail trader ......... 2 Cooperative ......... 3 Processor. ........... 4 Supermarket. ....... 5 International Co ... 6 Other ................... 7
Was this product produced on contract order? No .......... 0 Yes......... 1 Both ....... 2
Name of product Code 1st Code 2nd Code Quantity Unit Quantity Unit RWF RWF Code Code Code
Horticulture Processed Products 90 - Dried fruits 91 - Essential oils 92 - Juices 93 - Preserves 94 - Purees 95 - Pyrethrin (extract) 99 - Other Processed Product

5
Section 5. Markets & Marketing Q5.1 By percent, what have been the principal buyers for your crops/products over the past 12 months? (record % to 100 sum)
A. Wholesale trader | | | |% B. Retail trader | | | |% C. Cooperative | | | |% D. Processor | | | |% E. Supermarket | | | |% F. International company | | | |% G. Other _______________ | | | |%
(Specify) TOTAL | 1 | 0 | 0 |%
Q5.2 By percent, what are the principle destination markets for your crops/products over the past 12 months? (record % to 100 sum)
A. Own district | | | |% B. Own province | | | |% C. Other Provinces | | | |% D. Kigali city | | | |% E. Burundi | | | |% F. Congo/DRC | | | |% G. Tanzania | | | |% H. Uganda | | | |% I. Other Africa | | | |% J. Middle East | | | |% K. Europe | | | |% L. Other _______________ | | | |%
(Specify) TOTAL | 1 | 0 | 0 |%
Q5.3 Are there preferred buyers that your organisation aspires to use more of in the next 3 years? (Check all that apply)
A. No other markets of interest (Skip to Q5.4)
B. Wholesale trader C. Retail trader D. Cooperative E. Processor F. Supermarket G. International company H. Other ______________________________
(specify) Q5.4 What are the principle destination markets your organization aspires to sell to in the next 3 years? (Check all that apply)
A. Own district B. Own province C. Other Provinces D. Kigali city E. Burundi F. Congo/DRC G. Tanzania H. Uganda I. Other Africa J. Middle East K. Europe L. Other _______________
(Specify)
Q5.5 What standards do your current buyers require of your organisation as a condition of sale? (Check all that apply)
A. Size of product B. Color of product C. Limited number of defects D. Taste of product E. Large volume requirements F. Packaging G. Labeling H. Food safety compliance I. Phytosanitary compliance J. Certification (organic, Fair Trade, etc.)
Q5.6 What standards will your future buyers require of your organisation as a condition of sale? (Check all that apply)
A. Size of product B. Color of product C. Limited number of defects D. Taste of product E. Large volume requirements F. Packaging G. Labeling H. Food safety compliance I. Phytosanitary compliance J. Certification (organic, Fair Trade, etc.)

6
Section 5. Markets & Marketing (continued) Q5.7 What are the primary challenges your organisation faces in accessing these preferred markets in the next 3 years? (Check 3 most important)
A. Meeting price competitiveness of markets B. Distance from markets C. Meeting certification requirements D. Meeting high quality standards E. Meeting large volume requirements F. Infrastructure (roads, electricity, water, etc) G. Lack of packaging materials H. Lack of market information I. Other ______________________________
(specify)
Q5.8 A. Are there new crops or products that your organisation plans to grow/produce in the next 3 years?
0 - No (Skip to Q5.9) 1 - Yes (list below) (Write name and complete code from Code List on page 3) Crop/product name Crop/product Code
B. _________________________ | | | C. _________________________ | | | D. _________________________ | | | E. _________________________ | | | F. _________________________ | | |
(specify)
Q5.9 What kinds of infrastructure improvements will be most important (3 max) to your success in expanding to meet these future markets. (Check 3 most important)
A. None B. Roads C. Electricity D. Water E. Internet F. Cold storage G. Other _______________________
(specify)
Q5.10 Who are your organisation’s two most important competitors for your current buyers/markets? (Check 2 most important)
A. Other cooperatives (Rwanda) B. Independent traders (Rwanda) C. Individual farmers (Rwanda) D. Private companies (Rwanda) E. Traders/companies from other countries F. Other specify ________________________
Q5.11 From which other countries do you face the most competition for your crops/products? (Check all that apply and record crop/product names and codes – 2 max from list) Most important Crops/Products 1st Crop 2nd Crop A. Burundi 1. | | | 2. | | | Crop/product: _________ _________ B. DRC Congo 1. | | | 2. | | |
Crop/product: _________ _________ C. Kenya 1. | | | 2. | | | Crop/product: _________ _________ D. South Africa 1. | | | 2. | | |
Crop/product: _________ _________ E. Tanzania 1. | | | 2. | | | Crop/product: _________ _________ F. Uganda 1. | | | 2. | | |
Crop/product: _________ _________ G. Other 1. | | | 2. | | |
Crop/product: _________ _________

7
Section 6. Land Access for Horticulture Production & Processing Categories of land operated by the organization for purposes of horticulture production and processing over the past 12 months
A & B. What is the area in m2 or in hectares? Record area and circle unit code
(Note: 10.000m2 = 1 ha)
C. What is the primary location of this land? Valley.............. 1 Low hillside ..... 2 High hillside .... 3
Q6.16 Would your organisation like to expand and operate more land in the next 3 years? (Circle code)
0 - No 1 - Yes (Skip to Q6.17)
Q6.19 What are the major competing uses of land in your area that restrict your expansion? (Check all that apply)
A. Other crops
B. Livestock/pasture
C. Protected lands (e.g., wetlands)
D. Other (specify) ____________
Area Unit Code
Q6.1 Total land (owned or operated) by the i ti ?
1 - m2 2 - Ha. Q6.17 If no, what is the primary reason for not expanding in the future? (Circle code)
1 - Not profitable 2 - No market 3 - No financing
Q6.2 Land in production this year 1 - m2 2 - Ha.
Q6.3 Area under irrigation 1 - m2 2 - Ha. Q6.20 A. Have crops promoted through the regional crop specialisation program restricted your access to more land? (Circle code)
0 - No (skip to Q6.20) 1 - Yes If yes, which crops? (Check all that apply)
B. Maize E. Wheat
C. Rice F. Cassava
D. Irish Potato G. Beans/Soya
Crop Categories?
Q6.4 Land planted in fruits? 1 - m2 2 - Ha.
Q6.5 Land planted in vegetables? 1 - m2 2 - Ha.
Q6.6 Land planted in flowers? 1 - m2 2 - Ha.
Ownership? Q6.18 If yes, is there land available in your area onto which you can expand your organisation’s operations? (Circle code)
1 - No, none available 2 - Yes, land is available
Q6.7 Organisation 1 - m2 2 - Ha.
Q6.8 Individual members 1 - m2 2 - Ha.
Q6.9 Community 1 - m2 2 - Ha. Q6.21 A. Have crops promoted through the land use consolidation program restricted your access to more land? (Circle code) 0 - No (skip to Q7.1) 1 - Yes If yes, which crops? (Check all that apply)
B. Maize E. Wheat
C. Rice F. Cassava
D. Irish Potato G. Beans/Soya
Q6.10 Private owner (largeholder or company) 1 - m2 2 - Ha.
Q6.11 Other 1 - m2 2 - Ha.
How Acquired? D. Estimate how many years remain on the lease agreement?
E. What is the estimated lease payment for the past 12 months?
Q6.12 Purchased 1 - m2 2 - Ha.
Q6.13 Gift 1 - m2 2 - Ha.
Q6.14 Leased (no cost) 1 - m2 2 - Ha.
Q6.15 Leased (at cost) 1 - m2 2 - Ha.

8
Section 7. Access to Inputs and Services
Inputs and Services
A. Is this input/service important to the success of your organization?
B. On a scale from 1-5 where… 1 = very low level, and 5 = very high level… What level of access do you have to this input/service?
C. What is the primary constraint to improving your access to this input/service?
None............................. 0 High cost ...................... 1 Lack local availability ..... 2 Lack information ........... 3 Low public investment ... 4 Other (specify) .............. 5
Circle code Circle code Code Q7.1 Seed 0 - No 1 - Yes 1 2 3 4 5 | |
Q7.2 Organic fertilisers 0 - No 1 - Yes 1 2 3 4 5 | |
Q7.3 Commercial fertilisers 0 - No 1 - Yes 1 2 3 4 5 | |
Q7.4 Pesticides 0 - No 1 - Yes 1 2 3 4 5 | |
Q7.5 Small production equipment (hoes, machetes, wheelbarrows, etc.) 0 - No 1 - Yes 1 2 3 4 5 | |
Q7.6 Large production equipment (tractors, plows, etc.) 0 - No 1 - Yes 1 2 3 4 5 | |
Q7.7 Irrigation equipment 0 - No 1 - Yes 1 2 3 4 5 | |
Q7.8 Electricity 0 - No 1 - Yes 1 2 3 4 5 | |
Q7.9 Sufficient water 0 - No 1 - Yes 1 2 3 4 5 | |
Q7.10 Clean water 0 - No 1 - Yes 1 2 3 4 5 | |
Q7.11 Green house materials and equipment 0 - No 1 - Yes 1 2 3 4 5 | |
Q7.12 Certification services (organic, GlobalGap, Fair Trade, etc.) 0 - No 1 - Yes 1 2 3 4 5 | |
Q7.13 Horticulture processing equipment 0 - No 1 - Yes 1 2 3 4 5 | |
Q7.14 Dry storage facilities 0 - No 1 - Yes 1 2 3 4 5 | |
Q7.15 Cold storage equipment/facilities 0 - No 1 - Yes 1 2 3 4 5 | |
Q7.16 Packaging materials and equipment 0 - No 1 - Yes 1 2 3 4 5 | |
Q7.17 Internet, computers and support services 0 - No 1 - Yes 1 2 3 4 5 | |
Q7.18 Transportation 0 - No 1 - Yes 1 2 3 4 5 | |
Q7.19 Paved/accessible roads 0 - No 1 - Yes 1 2 3 4 5 | |
Q7.20 Current market information for horticulture crops/products 0 - No 1 - Yes 1 2 3 4 5 | |
Q7.21 Exports promotion services 0 - No 1 - Yes 1 2 3 4 5 | |
Q7.22 Exports certification services (SPS/food safety) 0 - No 1 - Yes 1 2 3 4 5 | |
Q7.23 Credit/financing 0 - No 1 - Yes 1 2 3 4 5 | |

9
Section 8. Buildings & Equipment Q8.3 Does your organisation use any irrigation systems/practices? No (Skip to Q8.4) Yes (complete all below)
A. Drip B. Hand delivered (buckets, etc)
C. Ground water diversion dam/flood D. Storage tanks, gravity fed E. Mechanical (pumped) F. Other (specify)_____________________
Q8.4 Does your organization own any motorized vehicles?
No (Skip to Q8.4) Yes (complete all below) A. Moto bike? | | | B. Tractor? | | |
C. Refrigerated truck? | | | D. Pickup / light truck |___|___| E. Medium / heavy truck |___|___| F. Other (specify)_________ |___|___|
Q8.5 Does your organization own any of the following equipment or implements?
(Check all that apply and record number)
Manual Tools? No (Skip) Yes A. Hoes | | | B. Spades/shovels | | | C. Pitch forks | | | D. Pruning Secateurs | | | E. Sprayers | | | F. Wheelbarrows | | |
Packing Equipment? No (Skip) Yes G. Receiving belt | | | H. Washer | | | I. Sorting table | | |
Processing Equipment? No (Skip) Yes J. Fruit press | | | K. Refractometer | | | L. Solar dryer | | | M. Air dehydrator | | | N. Canning machine | | | O. Cold containers | | | P. Refrigerators | | | Q. Freezers | | | R. Juice processing line | | | S. Juice bottling machine | | | T. Other (specify)________ | | |
Q8.1 Does your organization own or lease any buildings? No (Skip to Q8.2) Yes (complete below)
Approximately how many m2 ? (no decimal)
(Check all that apply) A. Office building(s)? | | | | | | | m2 B. Warehouse(s)? | | | | | | | m2 C. Collection center(s)? | | | | | | | m2 D. Pack house(s)? | | | | | | | m2 E. Cold storage unit(s)? | | | | | | | m2 F. Other _____________? | | | | | | | m2
(specify)
Q8.2
A. Does your organization own or lease any greenhouses? 0 - No (continue to Q8.3) 1 - Yes
B. Approximately how many m2 ? (no decimal)
| | | | | | m2
C. Principal cover material used? (circle code)
1 - Glass 2 - Plastic film 3 - Corrugated sheets
D. Principal framing material used? (circle code) 1 - Metal 2 - Plastic 3 - Wood

10
Section 9. Credit and Finances Q9.6 From the following categories, what is your organization’s estimated total… ? [Note: includes value of land owned] (Prompt with categories if not known, then circle code) A. …value of owned assets?
1 - 0 – 3m FRW 2 - 3m – 10m FRW 3 - 10m – 30m FRW 4 - 30m – 50m FRW 5 - >50m FRW
B. …average annual working capital? 1 - 0 - 3m FRW 2 - 3 – 10m FRW 3 - 10m – 30m FRW 4 - 30m – 50m FRW 5 - >50m FRW
Q9.7 Overall, on a scale from 1-5, where: 1 = Strongly disagree, and 5 = Strongly agree
Do the members of this organisation generally think that the cooperative/ association… ? (Circle code for each question)
Strongly Strongly disagree agree
A. Is financially sound? 1 2 3 4 5 B. Has difficulty obtaining loans? 1 2 3 4 5 C. Does not have collateral for loans? 1 2 3 4 5 D. Struggles to repay loans? 1 2 3 4 5 E. Credit is required for success? 1 2 3 4 5 F. Has taken on too much financial risk? 1 2 3 4 5
Q9.8 How has this organisation’s level of debt changed over the past 3 years? 0 - No debt over past 3 years 1 - Increased 2 - Decreased 3 - Stayed about the same
Q9.1 A. Over the past 24 months has this organisation held or received any loans? 0 - No (Skip to 9.6) 1 – Yes → If yes, how many different loans? | | |
In order of size of loan, please tell us about them… (3 maximum)
Q9.2 Loan 1
A. Original value of loan? | | | |.| | | |.| 0 | 0 | 0 | FRW B/C. Time remaining on loan? | | | 1 - months 2 - years D. Source of loan? (circle code) 1 - Bank 2 - Members 3 - NGO/project 4 - Other________________ E. Annual interest rate of loan: | | |.| | %
Q9.3 Loan 2
A. Original value of loan? | | | |.| | | |.| 0 | 0 | 0 | FRW B/C. Time remaining on loan? | | | 1 - months 2 - years D. Source of loan? (circle code) 1 - Bank 2 - Members 3 - NGO/project 4 - Other________________ E. Annual interest rate of loan: | | |.| | %
Q9.4 Loan 3
A. Original value of loan? | | | |.| | | |.| 0 | 0 | 0 | FRW B/C. Time remaining on loan? | | | 1 - months 2 - years D. Source of loan? (circle code) 1 - Bank 2 - Members 3 - NGO/project 4 - Other________________ E. Annual interest rate of loan: | | |.| | %
Q9.5 Has your organisation missed a loan payment over the past 24 months? 0 - No 1 – Yes → If yes, how many times? | | |
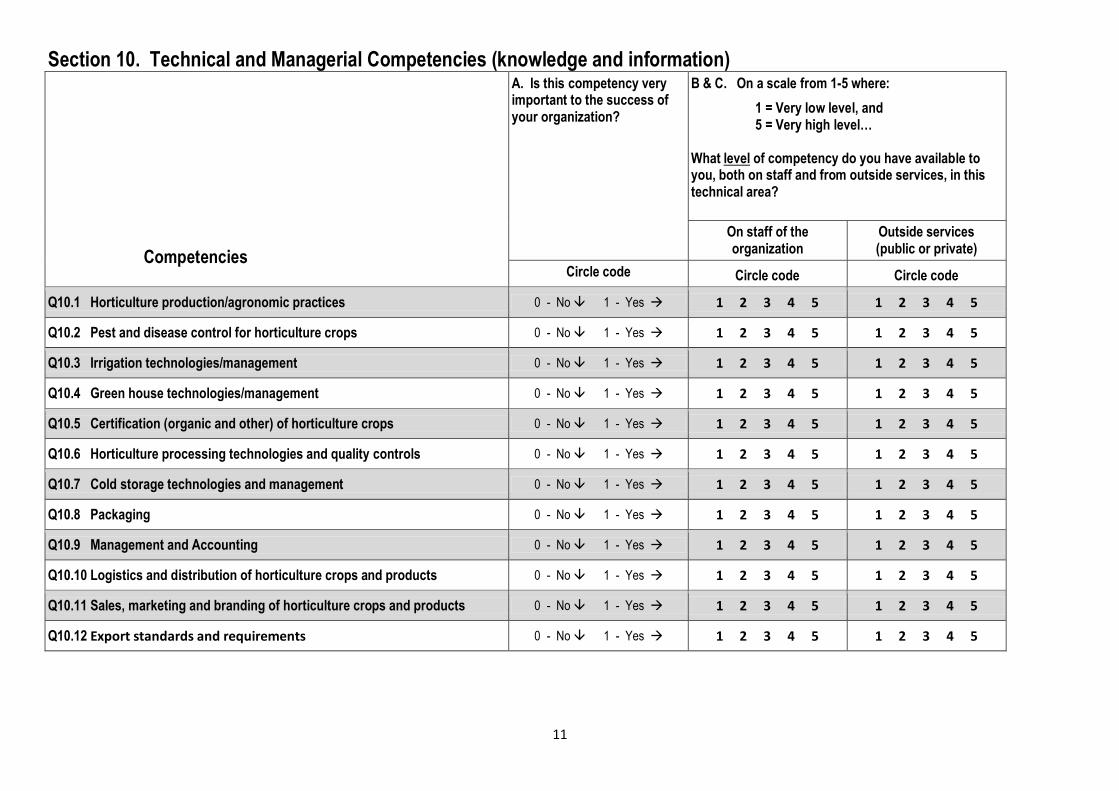
11
Section 10. Technical and Managerial Competencies (knowledge and information)
Competencies
A. Is this competency very important to the success of your organization?
B & C. On a scale from 1-5 where: 1 = Very low level, and 5 = Very high level…
What level of competency do you have available to you, both on staff and from outside services, in this technical area?
On staff of the organization
Outside services (public or private)
Circle code Circle code Circle code
Q10.1 Horticulture production/agronomic practices 0 - No 1 - Yes 1 2 3 4 5 1 2 3 4 5
Q10.2 Pest and disease control for horticulture crops 0 - No 1 - Yes 1 2 3 4 5 1 2 3 4 5
Q10.3 Irrigation technologies/management 0 - No 1 - Yes 1 2 3 4 5 1 2 3 4 5
Q10.4 Green house technologies/management 0 - No 1 - Yes 1 2 3 4 5 1 2 3 4 5
Q10.5 Certification (organic and other) of horticulture crops 0 - No 1 - Yes 1 2 3 4 5 1 2 3 4 5
Q10.6 Horticulture processing technologies and quality controls 0 - No 1 - Yes 1 2 3 4 5 1 2 3 4 5
Q10.7 Cold storage technologies and management 0 - No 1 - Yes 1 2 3 4 5 1 2 3 4 5
Q10.8 Packaging 0 - No 1 - Yes 1 2 3 4 5 1 2 3 4 5
Q10.9 Management and Accounting 0 - No 1 - Yes 1 2 3 4 5 1 2 3 4 5
Q10.10 Logistics and distribution of horticulture crops and products 0 - No 1 - Yes 1 2 3 4 5 1 2 3 4 5
Q10.11 Sales, marketing and branding of horticulture crops and products 0 - No 1 - Yes 1 2 3 4 5 1 2 3 4 5
Q10.12 Export standards and requirements 0 - No 1 - Yes 1 2 3 4 5 1 2 3 4 5

12
Section 11. Certifications Q11.1 On a scale of 1-5, how informed are managers of this organisation about the potential advantages of certifications such as organic, Fair Trade? (Circle code)
Not well informed Very informed
1 2 3 4 5
Q11.2 Does your organization currently hold any of the following certifications?
No (Skip to Q11.3) Yes (complete all that apply) Year certification received?
A. RBS Certification | | | | | B. Organic | | | | | C. Fair Trade | | | | | D. GlobalGAP | | | | | E. HACCP | | | | | F. UTZ Certified | | | | | G. Other _______________ | | | | |
Q11.3 Is your organization in the process of qualifying for any certifications? No (Skip to Q11.4) Yes (complete all that apply)
Year certification anticipated?
A. RBS Certification | | | | | B. Organic | | | | | C. Fair Trade | | | | | D. GlobalGAP | | | | | E. HACCP | | | | | F. UTZ Certified | | | | | G. Other __________________ | | | | |
Q11.4 Does your organization aspire to qualify for any certifications in the next 3 years?
No (Skip to Q11.5) Yes (check all that apply)
A. RBS Certification B. Organic C. Fair Trade
D. GlobalGAP
E. HACCP F. UTZ Certified G. Other __________________
(specify)
Q11.5 On a scale of 1-5, how important is certification (organic, Fair Trade, etc.) to the success of your organization in the next 5-10 years future? (Circle code)
Unimportant Very Important
1 2 3 4 5
NOTE: Pose this next question only to organisations that are not already certified or in the process of becoming certified. Q11.6 Begin with this statement: “Buyers of horticulture products often pay produce rs higher prices for certified products; but at the same time, there are costs associated with becoming certified.” If buyers offered to pay your organisation a [10%] higher price per kilo for your products, would you take steps to becoming certified?
(Start by proposing the percentage at the top of the list (10%) and continue down the list until the respondent says “yes”. Circle that code)
1 - 10% ← (start here) 2 - 20% 3 - 40% 4 - 60% 5 - 80% 6 - 100% 7 - >100% (specify) | | | |% 8 - No price high enough 9 - DK
10 - Already certified or in process
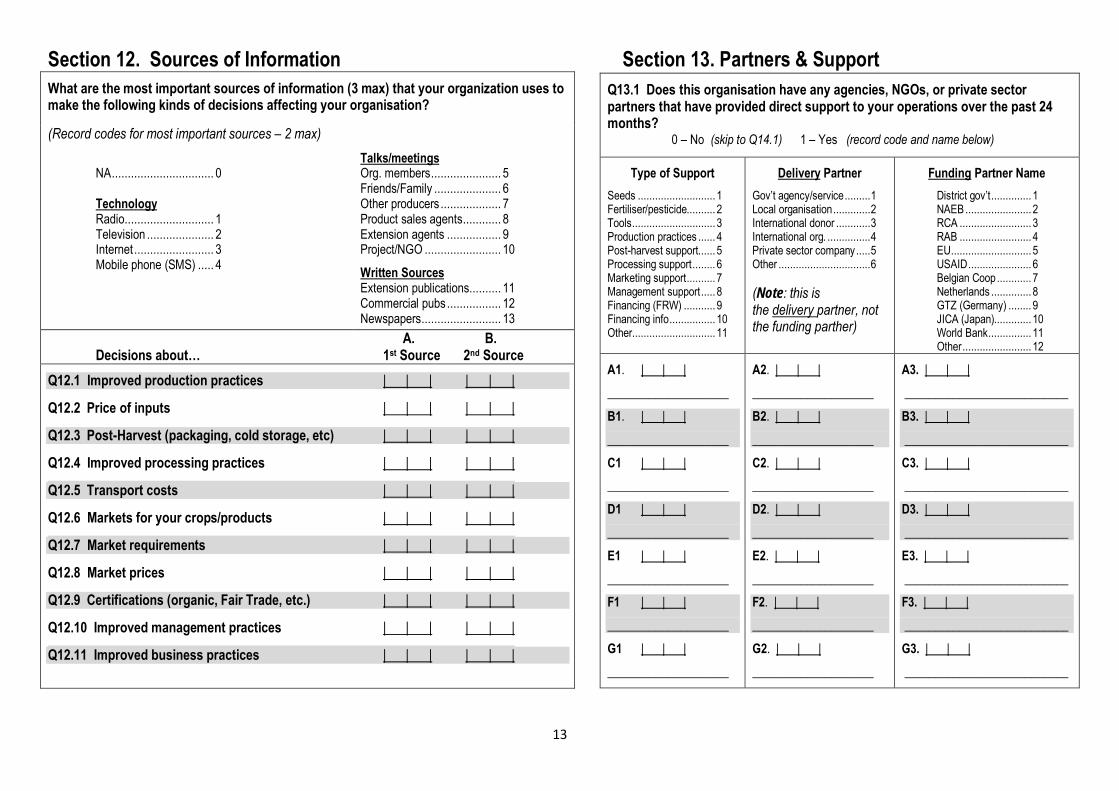
13
Section 12. Sources of Information Section 13. Partners & Support
What are the most important sources of information (3 max) that your organization uses to make the following kinds of decisions affecting your organisation?
(Record codes for most important sources – 2 max) NA ................................ 0 Technology Radio ............................ 1 Television ..................... 2 Internet ......................... 3 Mobile phone (SMS) ..... 4
Talks/meetings Org. members ...................... 5 Friends/Family ..................... 6 Other producers ................... 7 Product sales agents ............ 8 Extension agents ................. 9 Project/NGO ........................ 10 Written Sources Extension publications .......... 11 Commercial pubs ................. 12 Newspapers ......................... 13
A. B. Decisions about… 1st Source 2nd Source
Q12.1 Improved production practices | | | | | |
Q12.2 Price of inputs | | | | | |
Q12.3 Post-Harvest (packaging, cold storage, etc) | | | | | |
Q12.4 Improved processing practices | | | | | |
Q12.5 Transport costs | | | | | |
Q12.6 Markets for your crops/products | | | | | |
Q12.7 Market requirements | | | | | |
Q12.8 Market prices | | | | | |
Q12.9 Certifications (organic, Fair Trade, etc.) | | | | | |
Q12.10 Improved management practices | | | | | |
Q12.11 Improved business practices | | | | | |
Q13.1 Does this organisation have any agencies, NGOs, or private sector partners that have provided direct support to your operations over the past 24 months?
0 – No (skip to Q14.1) 1 – Yes (record code and name below)
Type of Support Seeds ........................... 1 Fertiliser/pesticide.......... 2 Tools ............................. 3 Production practices ...... 4 Post-harvest support...... 5 Processing support ........ 6 Marketing support .......... 7 Management support ..... 8 Financing (FRW) ........... 9 Financing info ................ 10 Other............................. 11
Delivery Partner Gov’t agency/service ......... 1 Local organisation ............. 2 International donor ............ 3 International org. ............... 4 Private sector company ..... 5 Other ................................ 6 (Note: this is the delivery partner, not the funding parther)
Funding Partner Name District gov’t .............. 1 NAEB ....................... 2 RCA ......................... 3 RAB ......................... 4 EU ............................ 5 USAID ...................... 6 Belgian Coop ............ 7 Netherlands .............. 8 GTZ (Germany) ........ 9 JICA (Japan)............. 10 World Bank ............... 11 Other ........................ 12
A1. | | | ____________________ B1. | | | ____________________ C1 | | | ____________________ D1 | | | ____________________ E1 | | | ____________________ F1 | | | ____________________ G1 | | | ____________________
A2. | | | ____________________ B2. | | | ____________________ C2. | | | ____________________ D2. | | | ____________________ E2. | | | ____________________ F2. | | | ____________________ G2. | | | ____________________
A3. | | | ___________________________ B3. | | | ___________________________ C3. | | | ___________________________ D3. | | | ___________________________ E3. | | | ___________________________ F3. | | | ___________________________ G3. | | | ___________________________

14
Section 14. Organisational Structure & Management (Cooperatives/Associations Only) Q14.1 A. Does this cooperative/ association have an elected and functioning Board of Directors? (Circle code) 0 - No (Skip to Q14.2)
1 - Yes B. If yes, how regularly does the Board of Directors meet? (Circle code)
1 - Monthly 2 - Quarterly 3 - Semi-annually 4 - Annually
Q14.2 How often does this cooperative/ association hold a General Assembly of its members (e.g., annual meeting)? (Circle code)
1 - Monthly 2 - Quarterly 3 - Semi-annually 4 - Annually
Q14.3 Is this cooperative / association governed by the following written documents…? (Check all that apply) A. Up-to-date written by-laws? B. Up-to-date rules and regulations? C. Up-to-date management &
financial procedures?
Q14.7 Overall, on a scale from 1-5, where: 1 = Strongly disagree, and 5 = Strongly agree
Do the members of this cooperative / association generally think that in this organisation… ? (Circle code for each question) Strongly Strongly Disagree Agree
A. Members are committed to the organization? 1 2 3 4 5
B. There is trust/harmony among members? 1 2 3 4 5
C. Members regularly pay their membership fees? 1 2 3 4 5
D. Members benefit financially from membership ? 1 2 3 4 5
E. Members participate in decision-making? 1 2 3 4 5
F. Members trust the management staff? 1 2 3 4 5
G. Members respect for decisions of leaders? 1 2 3 4 5
H. Members have a sense of ownership? 1 2 3 4 5
I. Members have a sense of pride? 1 2 3 4 5
J. Conflicts are easily resolved? 1 2 3 4 5
K. Members volunteer their services as needed? 1 2 3 4 5
L. There is cohesiveness among members? 1 2 3 4 5
M. Cohesiveness is important to success? 1 2 3 4 5
N. The organisation has been economically successful? 1 2 3 4 5
O. The org. will be econ. successful in the future? 1 2 3 4 5
Q14.4 Is there a contracted/paid management staff? (Circle code)
0 - No 1 - Yes
Q14.5 Which of the following leadership positions are active in this organisation? (Check all that apply)
A. General Manager/Director
B. Operations/Technical Manager C. Financial Officer/Accountant D. Marketing Specialist E. Other _______________________
(specify)
Q14.6 What is the highest level of formal education completed by these staff members? (Enter codes)
N/A (no position) ................ 0 Primary ............................... 1 Secondary .......................... 2 Post-secondary diploma .... 3 University graduate............ 4 Post-graduate degree........ 5
A. General Manager/Director | | B. Operations/Technical Manager | | C. Financial Officer/Accountant | | D. Marketing Specialist | | E. Other ____________________ | |
(specify)

15
Horticulture Crop/Product Listing
1-19 20-39 40-49 50-59 60-79 80-89 90-99
Fruits Vegetables Herbs & Spices Nuts Cut Flowers Flowers/herbs for processing Horticulture Processed Products
1 - Apple 2 - Avocado 3 - Banana (fruit) 4 - Cape Gooseberry 5 - Japanese plum 6 - Lemon 7 - Mango 8 - Orange 9 - Papaya
10 - Passion fruit 11 - Pineapple 12 - Strawberry 13 - Tamarillos 19 - Other fruit
20 - Bird’s eye chilies 21 - Cabbage 22 - Carrot 23 - Eggplant (local) 24 - French beans 25 - Leek 26 - Mushrooms 27 - Onion 28 - Pepper 29 - Sweet pepper 30 - Tomato 39 - Other vegetable
40 - Garlic 41 - Ginger 42 - Parsley 43 - Spicy grass 49 - Other H&S
51 - Macadamia 59 - Other nut
60 - Aromas 61 - Calla lilies 62 - Carnations 63 - Chrysanthemum 64 - Gladiolus 65 - Pastels 66 - Roses 67 - Saint Joseph (Lys) 79 - Other cut flower
80 - Eucalyptus 81 - Geranium Lemon grass 82 - Patchouli 83 - Pyrethrum 89 - Other processing flower
90 - Dried fruits 91 - Essential oils 92 - Juices 93 - Preserves 94 - Purees 95 - Pyrethrin (extract) 99 - Other proc product
Thank you!

Variable Name N Minimum Maximum
KeyID KeyID (Q1.1-2&11) 1155 11001 57027ProvinceID Province (Q1.1) 1155 1 5
DistrictID District ID 1155 11 57DistrictNo District number (Q1.1) 1155 1 8CompLandUseYN Competing Uses of Land (COUNT) (Q6.19) 1155 0.00 3.00OrgID Organization Number (within District) 1155 1 275CoopAssocFTR Filter Coops and Assoc - exclude all others 1155 0 1DateInt Date of Interview (Q1.7) 1155 01.12.2013 04.01.2014StartTimeHR Start Time of Interview - Hour (Q1.8A) 1144 0 90StartTimeMIN Start Time of Interview - Min (Q1.8A1) 1144 0 59EndTimeHR End Time of Interview - Hour (Q1.8B) 1134 1 19EndTimeMIN End Time of Interview - Min (Q1.8B1) 1134 0 75Lat Latitude of org -UTM (Q1.14A) 1155 374032.2524 596573.4041Long Longitude of org - UTM (Q1.14B) 1155 4690955.1848 4878020.3450OrgType Organization Type (Q2.1) 1155 1 6RegLevel Highest Registration Level (Q2.2) 1150 1 4YrEstab Year Org Established (Q2.3A) 1145 1966 2013YrEstab2 Year Organisation established, 2 groups (Q2.3A) 1145 1 2YrReg Year of Org Registration (Q2.3B) 791 1969 2013RegNCCR Org Affiliated with NCCR (Q2.4A) 1155 0 1RegRHIO Org Affiliated with RHIO (Q2.4B) 1155 0 1RegRCA Org Affiliated with RCA (Q2.4C) 1155 0 1RegRDB Org Affiliated with RDB (Q2.4D) 1155 0 1RegRPSF Org Affiliated with RPSF (Q2.4E) 1155 0 1TotMembr Total Active Membership (Q2.5A) 1131 1 1840AvgWrkDays Avg days worked in past year (Q2.5D) 1101 0 365TotLabDays Total Labor (TotMembr * AvgWrkDays)(Q2.5A+D) 1099 0 183300TotMembr4 Total Active Membership - 4 Groups (Q2.5A) 1132 1 4PctFemDistx Mean district % female 1155 .47 .72MaleMembr Total Active Male Membership (Q2.5B) 1132 0 6796FemMembr Total Active Female Membership (Q2.5C) 1132 0 1644PctFemMem Percent female members - Computed (Q2.5) 1132 0.00 1.00PctFemMem4 Percent female members - Quartiles (Q2.5) 1132 1 4FllTimeEmp No of FT staff in past year (Q2.6A) 1155 0 540PrtTimeEmp No of PT staff in past year (Q2.6B) 1155 0 400TotPrsDaysEmp Total Person-Days Empl in past year (Q2.6C) 1155 0 32000MembrChng Change in membshp in past 3 yrs (Q2.7A) 1130 1 4MembrProj Projected membrshp change in next 3 yrs (Q2.7B) 1131 1 4PrimProd Production as Primary Activity (Q2.8A) 1155 0 1PrimPstHarProc Post Harvest process primary activity (Q2.8B) 1155 0 1PrimProc Processing as Primary Activity (Q2.8C) 1155 0 1PrimMarkt Marketing as Primary Activity (Q2.8D) 1155 0 1PrimOther Other as Primary Actity (Q2.8E) 1155 0 1PrimAct Primary Activity of Organization 1155 1 4BuyWhSlPct Percent wholesale buyer in past year (Q5.1A) 1155 0 501BuyRetPct Percent retail trader in past year (Q5.1B) 1155 0 100BuyCoopPct Percent coop buyer in past yr (Q5.1C) 1155 0 100BuyProcPct Percent processor buyer in past year (Q5.1D) 1155 0 100BuySupPct Percent supermarket buyer in past year (Q5.1E) 1155 0 100BuyIntlCoPct Pct foreign comp buyer in past year(Q5.1F) 1155 0 100BuyOtherPct Percent other buyer in past year (Q5.1G) 1155 0 100DestOwnDistPct Percentage sold to own district in past year (Q5.2A) 1155 0 100DestOwnProvPct Percentage sold to own province in past year (Q5.2B) 1155 0 100DestOthProvPct Pct sold to other province in past year (Q5.2C) 1155 0 100DestKigCityPct Pct sold to Kigali in past year (Q5.2D) 1155 0 100DestBurPct Pct sold to Burundi in past year (Q5.2E) 1155 0 60DestDRCPct Pct sold to DRC in past year (Q5.2F) 1155 0 100DestTanzPct Pct sold to Tanzania in past year (Q5.2G) 1155 0 50DestUgPct Pct sold to Uganda in past year (Q5.2H) 1155 0 100DestOthAfrPct Pct sold to african ctry in past year (Q5.2I) 1155 0 90DestAfrPct Pct sold to African Countries (Q5.2E-I) 0 0 0DestMidEastPct Pct sold to mid east in past year (Q5.2J) 1155 0 0DestEuropPct Pct sold to Europe in past year (Q5.2K) 1155 0 100
Variable Label
Horticuture Survey Variables and Parameters by Questionnaire Section
Sections 1, 2, 5, 8, 9, 11: ID and diverse areas (main questionnaire)
Annex Variable List Page 1

Variable Name N Minimum MaximumVariable LabelDestMidEurPct Pct sold to MidEast and Europe (Q5.2J-K) 0 0 0DestOthPct Pct sold to other in past year (Q5.2L) 1155 0 100NoPrefMkt No preferred market of interest in next 3 yrs (Q5.3A) 1155 0 1PrefWhlSlX prefer to sell to wholesaler in next 3 yrs (Q5.3B) 1155 0 1PrefRetX Prefer to sell to retailer in next 3 yrs (Q5.3C) 1155 0 1PrefCoopX Prefer to sell to coop in next 3 yrs (Q5.3D) 1155 0 1PrefProcX Prefer to sell to processor in next 3 yrs (Q5.3E) 1155 0 1PrefSuperX Prefer to sell to supermarket in next 3 yrs (Q5.3F) 1155 0 1PrefIntlX Prefer to sell international in next 3 yrs (Q5.3G) 1155 0 1PrefOthX Prefer to sell to other in next 3 yrs (Q5.3H) 1155 0 1PrefOwnDistX Specify Prefer to sell to own district in next 3 yrs (Q5.4ASP) 1155 0 1PrefOwnProvX Prefer to sell to own province in next 3 yrs (Q5.4B) 1155 0 1PrefOthProvX Prefer to sell to other province in next 3 yrs (Q5.4C) 1155 0 1PrefKigX Prefer to sell to Kigali in next 3 yrs (Q5.4D) 1155 0 1PrefBurX Prefer to sell to Burundi in next 3 yrs (Q5.4E) 1155 0 1PrefDRCX Prefer to sell to DRC in next 3 yrs (Q5.4F) 1155 0 1PrefTanzX Prefer to sell to Tanzania in the next 3 yrs (Q5.4G) 1155 0 1PrefUgX Prefer to sell to Uganda in the next 3 yrs (Q5.4H) 1155 0 1PrefOtherAfrX Prefer to sell to african countries in next 3 yrs (Q5.4I) 1155 0 1PrefMidEastX Prefer to sell to the mid east in next 3 yrs (Q5.4J) 1155 0 1PrefEuropeX Prefer to sell to Europe in next 3 yrs (Q5.4K) 1155 0 1PrefOthDestX Prefer to sell to other in next 3 yrs (Q5.4L) 1155 0 1CurrSize Current buyer requires size standard (Q5.5A) 1155 0 1CurrColor Current buyer requires color standard (Q5.5B) 1155 0 1CurrLimDefect Current buyer requires limited No of defects (Q5.5C) 1155 0 1CurrTaste Current buyer requires taste standard (Q5.5D) 1155 0 1CurrVolume Current buyer has big volume req (Q5.5E) 1155 0 1CurrPackage Current buyer requires packaging standard (Q5.5F) 1155 0 1CurrLabel Current buyer has labeling standard (Q5.5G) 1155 0 1CurrSafety Current buyer has food safety standard (Q5.5H) 1155 0 1CurrSani Current buyer has phytosanitary standard (Q5.5I) 1155 0 1CurrCertif Current buyer requires cert (Q5.5J) 1155 0 1FutSize Future buyer has size standard (Q5.6A) 1155 0 1FutColor Future buyer has color standard (Q5.6B) 1155 0 1FutLimDefect Future buyer requires limited No of defects (Q5.6C) 1155 0 1FutTaste Future buyer has taste standard (Q5.6D) 1155 0 1FutVolume Future buyer requires big volume (Q5.6E) 1155 0 1FutPackage Future buyer has packaging standard (Q5.6F) 1155 0 1FutLabel Future buyer has labeling standard (Q5.6G) 1155 0 1FutSafety Future buyer has food safety standard (Q5.6H) 1155 0 1FutSanitation Future buyer has phytosanitary standard (Q5.6I) 1155 0 1FutCert Future buyer has cert standard (Q5.6J) 1155 0 1ChalPriceComp Price competition is biggest challenge (Q5.7A) 1155 0 1ChalDist Distance to market is biggest challenge (Q5.7B) 1155 0 1ChalCert Cert req is biggest challenge (Q5.7C) 1155 0 1ChalQual High quality standards is biggest challenge (Q5.7D) 1155 0 1ChalLrgVol Large volume req is biggest challenge (Q5.7E) 1155 0 1ChalInfra Infrastrucure is biggest challenge (Q5.7F) 1155 0 1ChalPkgMat Lack of packaging materials is biggest challenge (Q5.7G) 1155 0 1ChalMktInfo Lack of market information is biggest challenge (Q5.7H) 1155 0 1ChalOther Other challenges (Q5.7I) 1155 0 1NewCropYN Org will produce new crop in next 3 yrs (Q5.8A) 1155 0 1NewCrop1 Crop 1 code of crop for production in next 3 yrs (Q5.8B) 736 1 99NewCrop2 Crop 2 code of crop for production in next 3 yrs (Q5.8C) 432 1 93NewCrop3 Crop 3 code of crop for production in next 3 yrs (Q5.8D) 177 1 79NewCrop4 Crop 4 code of crop for production in next 3 yrs (Q5.8D) 68 2 67NewCrop5 Crop 5 code of crop for production in next 3 yrs (Q5.8E) 23 2 79NoImprove Org does not need infrst improvm (Q5.9A) 1155 0 1ImprRoads Org needs better roads to succeed in future mrkt (Q5.9B) 1155 0 1ImprElec Org needs better electricity to succeed in future mrkt (Q5.9C) 1155 0 1ImprWater Org needs better water to succeed in future mrkt (Q5.9D) 1155 0 1ImprInternet Org needs better internet to succeed in future mrkt (Q5.9E) 1155 0 1ImprColdStrg Org needs better cold storage to succeed in future mrkt 1155 0 1ImprOther Org needs other improvements (Q5.9G) 1155 0 1CompOthCoop Coops in Rwanda are biggest competitor (Q5.10A) 1155 0 1
CompIndTraderIndependent traders in Rwanda are biggest competitor (Q5.10B) 1155 0 1
CompIndFrmr Individual farmers in Rwanda are biggest competitor (Q5.10C) 1155 0 1
Annex Variable List Page 2

Variable Name N Minimum MaximumVariable LabelCompPrivCo Private companies in Rwanda are biggest competitor (Q5.10D) 1155 0 1CompOthCountr International traders are biggest competitor (Q5.10E) 1155 0 1CompOther This org has other biggest competitor (Q5.10F) 1155 0 1CompBurCr1 Burundi Crop 1 code (Q5.11A1) 49 1 79CompBurCr2 Burundi Crop 2 code (Q5.11A2) 16 8 79CompDRCCr1 DRC Crop 1 code (Q5.11B1) 3 11 27CompDRCCr2 DRC Crop 2 code (Q5.11B2) 1 29 29CompKenyaCr1 Kenya Crop 1 code (Q5.11C1) 5 10 92CompKenyaCr2 Kenya Crop 2 code (Q5.11C2) 2 62 93CompSACr1 South Africa Crop 1 code (Q5.11D1) 1 1 1CompSACr2 South Africa Crop 2 code (Q5.11D2) 0 0 0CompTanzCr1 Tanzania Crop 1 code (Q5.11E1) 16 10 30CompTanzCr2 Tanzania Crop 2 code (Q5.11E2) 1 13 13CompUgCr1 Uganda Crop 1 code (Q5.11F1) 43 7 92CompUgCr2 Uganda Crop 2 code (Q5.11F2) 10 1 93CompOtherCr1 Other country Crop 1 code (Q5.11G1) 3 11 92CompOtherCr2 Other country Crop 2 code (Q5.11G2) 1 93 93TotArea Total area managed by org (Q6.1A) 1155 0.00 78200.00TotAreaUnit Unit of total area (Q6.1B) 1137 1 2TotAreaHa Total area (Ha) managed by org (Q6.1A) 1155 0.0000 803.0000TotAreaHa3 Total area (Ha) managed by org (Q6.1A) - 3 groups 1137 1 3TotAreaLoc Location of total this land (Q6.1C) 1126 1 3ProdArea Area under production (Q6.2A) 1052 .20 70000.00ProdAreaUnit Unit of production area (Q6.2B) 1052 1 2ProdAreaHa Area (Ha) under production (Q6.2A) 1155 0.0000 803.0000ProdArHa4 Area (Ha) under production (Q6.2A) (Binned) 1155 1 4ProdAreaLoc Location of prod land (Q6.2C) 1040 1 3IrrigArea Area under irrigation (Q6.3A) 598 .07 71000.00IrrigAreaUnit Unit of irrig area (Q6.3B) 603 1 2IrrigAreaHa Area (Ha) under irrigation (Q6.3A) 1155 0.0000 70.0000IrrigAreaLoc Location of irrig land (Q6.3C) 591 1 3FruitArea Land planted in fruits (Q6.4A) 435 .16 70000.00FruitAreaUnit Unit of fruit area (Q6.4B) 435 1 2FruitAreaHa Land (Ha) planted in fruits (Q6.4A) 1155 0.0000 803.0000FruitAreaLoc Location of fruit land (Q6.4C) 427 1 3VegArea Land planted in vegetables (Q6.5A) 743 .09 55100.00VegAreaUnit Unit of veg area (Q6.5B) 743 1 2VegAreaHa Land (Ha) planted in vegetables (Q6.5A) 1155 0.0000 147.0000VegAreaLoc Location of veg land (Q6.5C) 735 1 3FlowerArea Land planted in flowers (Q6.6A) 45 .10 9056.00FlowerAreaUnit Unit of flower area (Q6.6B) 45 1 2FlowerAreaHa Land (Ha) planted in flowers (Q6.6A) 1155 0.0000 20.0000FlowerAreaLoc Location of flower land (Q6.6C) 45 1 3AreaFrVegFlHa Area (Ha) in Fruits, Vegs and Flowers (Q6.1,4-6) 1155 0.0000 803.0000OrgOwnArea Land owned by org (Q6.7A) 236 .01 45000.00OrgOwnAreaUnit Unit of own area (Q6.7B) 236 1 2OrgOwnAreaHa Land (Ha) owned by org (Q6.7A) 1155 0.0000 78.0000OrgOwnAreaLoc Location of own land (Q6.7C) 230 1 3IndOwnArea Land owned by indiv members (Q6.8A) 254 .18 70000.00IndOwnAreaUnit Unit of indiv owned area (Q6.8B) 257 1 2IndOwnAreaHa Land (Ha) owned by indiv members (Q6.8A) 1155 0.0000 800.0000IndOwnAreaLoc Location of this indiv owned land (Q6.8C) 251 1 3ComOwnArea Land owned by community (Q6.9A) 430 .12 50000.00ComOwnAreaUnit Unit of comm area (Q6.9B) 430 1 2ComOwnAreaHa Land (Ha) owned by community (Q6.9A) 1155 0.0000 150.0000ComOwnAreaLoc Location of comm land (Q6.9C) 428 1 3PrivOwnArea Land owned by private company (Q6.10A) 309 .10 27000.00PrivOwnAreaUnit Unit of priv co area (Q6.10B) 309 1 2PrivOwnAreaHa Land (Ha) owned by private company (Q6.10A) 1155 0.0000 40.0000PrivOwnAreaLoc Location of priv co land (Q6.10C) 309 1 3OtherOwnArea Land owned by other (Q6.11A) 78 .20 31150.00OtherOwnAreaUnit Unit of other owned area (Q6.11B) 78 1 2OtherOwnAreaHa Land (Ha) owned by other (Q6.11A) 1155 0.0000 30.0000OtherOwnAreaLoc Location of other owned land (Q6.11C) 77 1 3PurchArea Land purchased (Q6.12A) 260 .01 70000.00PurchAreaUnit Unit of purchased area (Q6.12B) 261 1 2PurchAreaHa Land (Ha) purchased (Q6.12A) 1155 0.0000 205.0000PurchAreaLoc Location of purchased land (Q6.12C) 255 1 3GiftArea Land gifted (Q6.13A) 106 .20 15750.00
Annex Variable List Page 3

Variable Name N Minimum MaximumVariable LabelGiftAreaUnit Unit of gifted area (Q6.13B) 106 1 2GiftAreaHa Land (Ha) gifted (Q6.13A) 1155 0.0000 740.0000GiftAreaLoc Location of gifted land (Q6.13C) 103 1 3NCLeaseArea Land leased at no cost (Q6.14A) 384 .12 50000.00NCLeaseAreaUnit Unit of NC leased area (Q6.14B) 384 1 2NCLeaseAreaHa Land (Ha) leased at no cost (Q6.14A) 1155 0.0000 600.0000NCLeaseAreaLoc Location of NC leased land (Q6.14C) 377 1 3NCLeaseAreaYrLft No of yrs remaining on NC lease (Q6.14D) 239 1.0 99.0CostLeaseArea Land leased at a cost (Q6.15A) 547 .10 45000.00CostLeaseAreaUnit Unit of paid leased area (Q6.15B) 547 1 2CostLeaseAreaHa Land (Ha) leased at a cost (Q6.15A) 1155 0.0000 120.0000CostLeaseAreaLoc Location of paid leased land (Q6.15C) 539 1 3CostLeaseAreaYrLft No of yrs remaining on paid lease (Q6.15D) 439 0.0 30.0CostLeaseAreaLeasPay Lease payment for past yr (Q6.15E) 541 105 6000000LandExpandYN Org would like to expand in next 3 yrs (Q6.16) 1135 0 1WhyNoLandExp Reason for no expansion (Q6.17) 99 1 3LandAvail Land available for expansion (Q6.18) 1027 1 2CompCrop Other crops compete with land use (Q6.19A) 1155 0 1CompAnim Livestock compete with land use (Q6.19B) 1155 0 1CompProtLnd Protected land compete with land use (Q6.19C) 1155 0 1CompOtherX Others compete with land use (Q6.19D) 1155 0 1
CrSpecYNCompete with crops are promoted by crop special prog (Q6.20A) 1155 0 1
MaizeSpec Compete with maize promoted by crop spec prog (Q6.20B) 1155 0 1RiceSpec Compete with rice promoted by crop spec prog (Q6.20C) 1155 0 1PotSpec Compete with potato promoted by crop spec prog (Q6.20D) 1155 0 1WheatSpec Compete with wheat promoted by crop spec prog (Q6.20E) 1155 0 1CassavaSpec Compete with cassava promoted by crop spec prog (Q6.20F) 1155 0 1BeanSpec Compete with bean promoted by crop spec prog (Q6.20G) 1155 0 1
CrConsolYNCompete with Crops are promoted by land use cons prog YN (Q6.21A) 1155 0 1
MaizeConsol Compete with Maize promoted by land use cons prog 1155 0 1RiceConsol Compete with Rice promoted by land use cons prog (Q6.21C) 1155 0 1IrishPotConsol Compete with Potato promoted by land use cons prog 1155 0 1WheatConsol Compete with Wheat promoted by land use cons prog 1155 0 1
CassavaConsolCompete with Cassava promoted by land use cons prog (Q6.21F) 1155 0 1
BeanConsol Compete with Bean promoted by land use cons prog (Q6.21G) 1155 0 1OfficeM Size of office building SQM (Q8.1A) 1155 0 20000WarehousM Size of warehouse SQM (Q8.1B) 1155 0 600CollCtrM Size of collection center SQM (Q8.1C) 1155 0 999PackHousM Size of pack house SQM (Q8.1D) 1155 0 153ColdStrgM Size of cold storage SQM (Q8.1E) 1155 0 35OtherBldgM Size of other buildings SQM (Q8.1F) 1155 0 3560TotBldgsM Total SqM in Buildings 1155 0 20000GrnHouseYN org owns or lease greenhouse (Q8.2A) 1155 0 1GrnHouseM Area in greenhouse SQM (Q8.2B) 1155 0 5000GHCoverMtrl Principal cover material used (Q8.2C) 77 2 3GHFramingMtrl Principal framing material used (Q8.2D) 79 1 3IrrUsedYN Irrigation Used YN (Q8.3) 1155 0 1IrrDrip Drip irrigation (Q8.3A) 1155 0 1IrrHand Hand delivered (Q8.3B) 1155 0 1IrrWtrDivert Groundwater diversion dam or flood (Q8.3C) 1155 0 1IrrStrgTank Storage Tanks gravity fed (Q8.3D) 1155 0 1IrrPump Mechanical pumped (Q8.3E) 1155 0 1IrrOther Other irrigation method (Q8.3F) 1155 0 1OwnMotVehYN Nbr motorized vehicle YN (Q8.4YN) 1155 0 1Motobike Nbr motor bike (Q8.4A) 1155 0 30Tractor Nbr tractor (Q8.4B) 1155 0 1RefTruckNbr Nbr regrigerated truck (Q8.4C) 1155 0 0LightTruckNbr Nbr light truck or pickup (Q8.4D) 1155 0 4HeavyTruckNbr Nbr heavy truck (Q8.4E) 1155 0 2OtherVehNbr Nbr other vehicle (Q8.4F) 1155 0 0HoesNbr Nbr hoes (Q8.5A) 1155 0 999ShovelNbr Nbr shovels or spades (Q8.5B) 1155 0 500PitchforkNbr Nbr pitch forks (Q8.5C) 1155 0 250PrunSecNbr Nbr prunning secateurs (Q8.5D) 1155 0 400SprayersNbr Nbr spreayers (Q8.5E) 1155 0 697
Annex Variable List Page 4
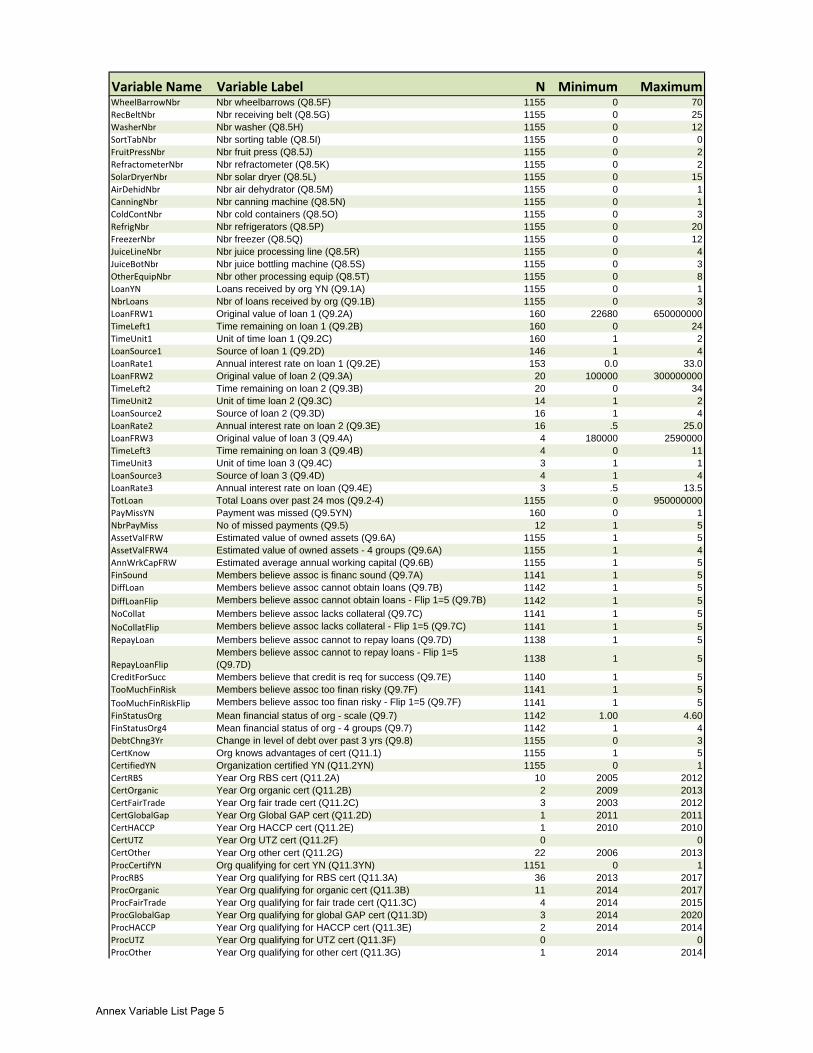
Variable Name N Minimum MaximumVariable LabelWheelBarrowNbr Nbr wheelbarrows (Q8.5F) 1155 0 70RecBeltNbr Nbr receiving belt (Q8.5G) 1155 0 25WasherNbr Nbr washer (Q8.5H) 1155 0 12SortTabNbr Nbr sorting table (Q8.5I) 1155 0 0FruitPressNbr Nbr fruit press (Q8.5J) 1155 0 2RefractometerNbr Nbr refractometer (Q8.5K) 1155 0 2SolarDryerNbr Nbr solar dryer (Q8.5L) 1155 0 15AirDehidNbr Nbr air dehydrator (Q8.5M) 1155 0 1CanningNbr Nbr canning machine (Q8.5N) 1155 0 1ColdContNbr Nbr cold containers (Q8.5O) 1155 0 3RefrigNbr Nbr refrigerators (Q8.5P) 1155 0 20FreezerNbr Nbr freezer (Q8.5Q) 1155 0 12JuiceLineNbr Nbr juice processing line (Q8.5R) 1155 0 4JuiceBotNbr Nbr juice bottling machine (Q8.5S) 1155 0 3OtherEquipNbr Nbr other processing equip (Q8.5T) 1155 0 8LoanYN Loans received by org YN (Q9.1A) 1155 0 1NbrLoans Nbr of loans received by org (Q9.1B) 1155 0 3LoanFRW1 Original value of loan 1 (Q9.2A) 160 22680 650000000TimeLeft1 Time remaining on loan 1 (Q9.2B) 160 0 24TimeUnit1 Unit of time loan 1 (Q9.2C) 160 1 2LoanSource1 Source of loan 1 (Q9.2D) 146 1 4LoanRate1 Annual interest rate on loan 1 (Q9.2E) 153 0.0 33.0LoanFRW2 Original value of loan 2 (Q9.3A) 20 100000 300000000TimeLeft2 Time remaining on loan 2 (Q9.3B) 20 0 34TimeUnit2 Unit of time loan 2 (Q9.3C) 14 1 2LoanSource2 Source of loan 2 (Q9.3D) 16 1 4LoanRate2 Annual interest rate on loan 2 (Q9.3E) 16 .5 25.0LoanFRW3 Original value of loan 3 (Q9.4A) 4 180000 2590000TimeLeft3 Time remaining on loan 3 (Q9.4B) 4 0 11TimeUnit3 Unit of time loan 3 (Q9.4C) 3 1 1LoanSource3 Source of loan 3 (Q9.4D) 4 1 4LoanRate3 Annual interest rate on loan (Q9.4E) 3 .5 13.5TotLoan Total Loans over past 24 mos (Q9.2-4) 1155 0 950000000PayMissYN Payment was missed (Q9.5YN) 160 0 1NbrPayMiss No of missed payments (Q9.5) 12 1 5AssetValFRW Estimated value of owned assets (Q9.6A) 1155 1 5AssetValFRW4 Estimated value of owned assets - 4 groups (Q9.6A) 1155 1 4AnnWrkCapFRW Estimated average annual working capital (Q9.6B) 1155 1 5FinSound Members believe assoc is financ sound (Q9.7A) 1141 1 5DiffLoan Members believe assoc cannot obtain loans (Q9.7B) 1142 1 5DiffLoanFlip Members believe assoc cannot obtain loans - Flip 1=5 (Q9.7B) 1142 1 5NoCollat Members believe assoc lacks collateral (Q9.7C) 1141 1 5NoCollatFlip Members believe assoc lacks collateral - Flip 1=5 (Q9.7C) 1141 1 5RepayLoan Members believe assoc cannot to repay loans (Q9.7D) 1138 1 5
RepayLoanFlipMembers believe assoc cannot to repay loans - Flip 1=5 (Q9.7D) 1138 1 5
CreditForSucc Members believe that credit is req for success (Q9.7E) 1140 1 5TooMuchFinRisk Members believe assoc too finan risky (Q9.7F) 1141 1 5TooMuchFinRiskFlip Members believe assoc too finan risky - Flip 1=5 (Q9.7F) 1141 1 5FinStatusOrg Mean financial status of org - scale (Q9.7) 1142 1.00 4.60FinStatusOrg4 Mean financial status of org - 4 groups (Q9.7) 1142 1 4DebtChng3Yr Change in level of debt over past 3 yrs (Q9.8) 1155 0 3CertKnow Org knows advantages of cert (Q11.1) 1155 1 5CertifiedYN Organization certified YN (Q11.2YN) 1155 0 1CertRBS Year Org RBS cert (Q11.2A) 10 2005 2012CertOrganic Year Org organic cert (Q11.2B) 2 2009 2013CertFairTrade Year Org fair trade cert (Q11.2C) 3 2003 2012CertGlobalGap Year Org Global GAP cert (Q11.2D) 1 2011 2011CertHACCP Year Org HACCP cert (Q11.2E) 1 2010 2010CertUTZ Year Org UTZ cert (Q11.2F) 0 0CertOther Year Org other cert (Q11.2G) 22 2006 2013ProcCertifYN Org qualifying for cert YN (Q11.3YN) 1151 0 1ProcRBS Year Org qualifying for RBS cert (Q11.3A) 36 2013 2017ProcOrganic Year Org qualifying for organic cert (Q11.3B) 11 2014 2017ProcFairTrade Year Org qualifying for fair trade cert (Q11.3C) 4 2014 2015ProcGlobalGap Year Org qualifying for global GAP cert (Q11.3D) 3 2014 2020ProcHACCP Year Org qualifying for HACCP cert (Q11.3E) 2 2014 2014ProcUTZ Year Org qualifying for UTZ cert (Q11.3F) 0 0ProcOther Year Org qualifying for other cert (Q11.3G) 1 2014 2014
Annex Variable List Page 5

Variable Name N Minimum MaximumVariable LabelIntlorRBSCert Number of Intl or RBS Certs (Q11.2-3) 1155 0 4FutCertifYN Org aspires to qualify for cert YN (Q11.4YN) 1152 0 1FutRBS Org aspires to qualify for RBS (Q11.4A) 1155 0 1FutOrganic Org aspires to qualify for organic (Q11.4B) 1155 0 1FutFairTrade Org aspires to qualify for fair trade (Q11.4C) 1155 0 1FutGlobalGap Org aspires to qualify for global GAP (Q11.4D) 1155 0 1FutHACCP Org aspires to qualify for HACCP (Q11.4E) 1155 0 1FutUTZ Org aspires to qualify for UTZ (Q11.4F) 1155 0 0FutOtherCert Org aspires to qualify for other cert (Q11.4G) 1155 0 1FutIntRBSCert Nbr of future Intl or RBS Cert planned (Q11.4) 1155 0 4ActCertYN Org has Intl or RBS Certs (Q11.2) 1155 0 1ProcCertYN Org in process of Intl or RBS Cert (Q11.3) 1155 0 1PlanCertYN Org plans Intl or RBS Cert in 3 yrs (Q11.4) 1155 0 1CertStatus Org certification status (Q11.2-4) 1155 0 3CertImport Importance of cert for success in the next 5 to 10 yrs (Q11.5) 1155 1 5CertPrem Premium desired to become certified? (Q11.6) 1155 1 10CertPremSp Specify Premium desired to become certified? (Q11.6SP) 44 110 800CertPremOrd Premium desired to become certified? % only (Q11.6) 0 0BoardYN Assoc has board of directors (Q14.1A) 1155 0 1BrdMtgFreq Board meetings (Q14.1B) 1098 1 4AnnualMtgFreq General assembly meetings (Q14.2) 1112 1 4ByLawsYN Assoc has written bylaws (Q14.3A) 1155 0 1RuleNRegYN Assoc has written rules and reg (Q14.3B) 1155 0 1ProceduresYN Assoc has updated mang and fin proced (Q14.3C) 1155 0 1PaidMangYN Assoc has paid managerial staff (Q14.4) 1155 0 1GrlMngrYN Active general managr (Q14.5A) 1155 0 1TechMngrYN Active technical managr (Q14.5B) 1155 0 1FinOffcrYN Active financ offcr (Q14.5C) 1155 0 1MrktSpecYN Active marketing spec (Q14.5D) 1155 0 1OtherPosYN Other position active (Q14.5E) 1155 0 1GrlMangEd Highest educ level of grl mang (Q14.6A) 222 1 5TechMangEd Highest educ level of tech mangr (Q14.6B) 105 1 4FinOffcrEd Highest educ level of finance offcr (Q14.6C) 213 1 4MrktSpecEd Highest educ level of marketing spec (Q14.6D) 58 1 4OtherEd Highest educ level of other staff (Q14.6E) 72 1 4Commit Members are committed to org (Q14.7A) 1123 2 5Trust Harmony among members (Q14.7B) 1123 1 5PayFee Members regularly pay fees (Q14.7C) 1118 1 5FinBenefit Members benefit financially (Q14.7D) 1122 1 5DecMake Members participate in decisions (Q14.7E) 1120 1 5TrustMgment Members trust management (Q14.7F) 1122 1 5RespectMgment Members respect decisions (Q14.7G) 1121 1 5SenseOwner Members feel ownership (Q14.7H) 1123 1 5SensePride Members feel pride (Q14.7I) 1120 1 5ConflEasyRes Conflicts are easily resolved (Q14.7J) 1122 1 5VolunteerServ Members volunteer services (Q14.7K) 1122 1 5Cohesive There is cohesivns btw members (Q14.7L) 1121 2 5CohesiveImport Cohesivns is important to succeed (Q14.7M) 1122 1 5EconSucc Org has been econ successful (Q14.7N) 1121 1 5FutEconSucc Org will be econ successful in future (Q14.7O) 1121 1 5MeanOrgStrgth Mean Org Strength -- across 15 indicators (Q14.7) 1123 1.60 5.00SaleFruitFRW Total sale of fruits (FRW) - SUM Sect 3 1155 0 109440000SaleVegFRW Total sale of veg (FRW) - SUM Sect 3 1155 0 1,582,970,000SaleOthHortCropFRW Total sale of other hort crops (FRW) - SUM Sect 3 1155 0 39420000MainRev Org main revenue based on FRW sales 1155 1 4SaleCropTotFRW Total crop sales (FRW) - Sum Sect 3 1155 0 1582970000SaleCropTotFRWpp Sum of total crop sales pp (FRW) - SUM Sect 3 1155 0 15545965SaleCropTotFRW5 Total crop sales (FRW) - 5 Groups 1146 1 5SaleProdTotFRW Total processed product sales (FRW) - Sum Sect 4 1155 0 211620000SaleCrPrTotFRW Total sales of crops and proc products (FRW) 1155 0 1582970000SaleCrPrTotFRW5 Total crop+product sales (FRW) - 5 Groups 1155 1 5FRWperDay FRW per day of labor (Q2.5D) 1087 0 99706FRWperMem FRW per day of labor (Q2.5D) 1137 0 14108000FRWperHa FRW per hectare land under production (Q6.2) 1052 0 192307692FRWperKGx Mean FRW per KG (Section 3) 1073 10.49 7500.00KGperHa Total KG per hectare land under production (Q6.2) 1052 0 533333SaleFruitKG Total sale of fruits (KG) - SUM Sect 3 1155 0 756933SaleVegKG Total sale of veg (KG) - SUM Sect 3 1155 0 6019000SaleOthHortCropKG Total sale of other hort crops (KG) - SUM Sect 3 1155 0 54000
Annex Variable List Page 6

Variable Name N Minimum MaximumVariable LabelSaleCropTotKG Total crop sales (KG) - Sum Sect 3 1155 0 6019000AccLevelOrgMean Mean level of access to inputs/services - Mean (Q7B 1139 1.00 5.00
AccLevelNNbr of inputs/services indic as important and used in mean (Q7B) 1155 0 23
AccLevelOrgMean4Mean level of access to inputs/services - Mean (Q7B (Quartiles) 1139 1 4
IntCompX Org Mean internal comp across all items - (Q10A) 1131 1.00 5.00ExtCompX Org Mean external comp across all items - (Q10B) 1131 1.00 5.00NbrSuppTyp Number of diff types of support received (Q13.1A) 1155 0 7ImprInptIdx Mean Inputs Investment index (from 3.2-5) 1144 0.00 8.00ImprInptIdx3 Mean Inputs Investment index (from 3.2-5) - 3 groups 1144 1 3PassFrtFRW Passion Fruit FRW (Q3.1A & Q3.10) 100 3000 80000000PineAppleFRW Pineapple FRW (Q3.1A & Q3.10) 212 2000 46793823TamarilloFRW Tamarillo FRW (Q3.1A & Q3.10) 111 700 90000000OtherFrtFRW Other Fruit FRW (Q3.1A & Q3.10) 46 3000 14400000CabbageFRW Cabbage FRW (Q3.1A & Q3.10) 504 294 100000000CarrotFRW Carrot FRW (Q3.1A & Q3.10) 304 700 60000000EggPlantFRW Egg Plant FRW (Q3.1A & Q3.10) 248 5000 180000000OnionFRW Onion FRW (Q3.1A & Q3.10) 197 1200 600000000SwtPeppFRW Sweet Pepper FRW (Q3.1A & Q3.10) 150 1000 500000000TomatoFRW Tomato FRW (Q3.1A & Q3.10) 279 3000 309280000OtherVegFRW Other Vegetable FRW (Q3.1A & Q3.10) 308 900 109800000SpecCropFRW Specialty Crops (flowers, nuts, etc) FRW (Q3.1A & Q3.10) 49 2000 39420000Maxval Max Value computed across all crops FRW 1075 294 600000000MainCrop Main crop grown by org (based on FRW sales) 1075 10 999PassFrtFRW3 Percentile Group of PassFrtFRW (Q3.1&11) 100 1 3PineAppleFRW3 Percentile Group of PineAppleFRW (Q3.1&11) 212 1 3TamarilloFRW3 Percentile Group of TamarilloFRW (Q3.1&11) 111 1 3OtherFrtFRW3 Percentile Group of OtherFrtFRW (Q3.1&11) 46 1 3CabbageFRW3 Percentile Group of CabbageFRW (Q3.1&11) 504 1 3CarrotFRW3 Percentile Group of CarrotFRW (Q3.1&11) 304 1 3EggPlantFRW3 Percentile Group of EggPlantFRW (Q3.1&11) 248 1 3OnionFRW3 Percentile Group of OnionFRW (Q3.1&11) 197 1 3SwtPeppFRW3 Percentile Group of SwtPeppFRW (Q3.1&11) 150 1 3TomatoFRW3 Percentile Group of TomatoFRW (Q3.1&11) 279 1 3OtherVegFRW3 Percentile Group of OtherVegFRW (Q3.1&11) 308 1 3SpecCropFRW3 Percentile Group of SpecCropFRW (Q3.1&11) 49 1 3Elevation Elevation (m) 1155 0 2714DistPavRdKm Distance from paved road (Km) 1155 .004 29.486DistPavRdKm4 Distance from paved road (Km) 4 groups 1155 1 4DistNatRdKm Distance from national road (Km) 1155 0.000 26.137DistUrbCtrKm Distance to nearest urban center (Km) 1155 .37 93.78DistToKigaliKm Distance to Kigali (Km) 1155 1.63 151.10DistUrbCtrKm4 Distance to nearest urban center (Km) (Binned) 1155 1 4SectorPop Sector Population 1155 0 78106
KeyID KeyID (V1) 3171 11001 57027
CropOrder Crop Line number 3171 1 14
PrimAct Primary Activity of Organization 3171 1 4
ProducerFTR Filter: Include only producer orgs 3171 0 1
ProvinceID Province (Q1.1) 3171 1 5
DistrictID District ID 3171 11 57
CoopAssocFTR 3171 0 1
Crop Crop Code (Q3.1B) 3171 1 89
CropLite Crop Code Condensed (Q3.1B) 3171 10 89
CropLite2 Crop Code Condensed (Q3.1B) 3171 10 999
CropGrp Crop Group 3171 1 6
CropGrp3 Crop 3 Groups 3171 1 3
SeedType Seed/plant materials used (Q3.2) 3148 0 3
SeedTpOrd ORD Seed/plant materials used (Q3.2) 3148 0 2
FertType Fertilizer Used (Q3.3) 3148 0 3
FertTpOrd ORD Fertilizer Used (Q3.3) 3148 0 2
PestFungType Pesticide/Fungicide used (Q3.4) 3148 0 3
PestFungTpOrd ORD Pesticide/Fungicide used (Q3.4) 3148 0 2
Irrigation Irrigation used (Q3.5) 3148 0 4
IrrigOrd ORD Irrigation used (Q3.5) 3148 0 2
ImprInptIdx Improved Inputs Summated Index 3148 0 8
OrgType Organization Type (Q2.1) 3171 1 6
Section3: Crop production, inputs use and sales
Annex Variable List Page 7

Variable Name N Minimum MaximumVariable LabelQtyHarvestKG Quantity harvested ‐ Kg (Q3.6L1) 3084 0 3000000
GradeSort Grading/sorting to meet market (Q3.7) 3171 0 1
SpecPack Specialized packaging used (Q3.8) 3171 0 4
ColdStrg Cold storage used (Q3.9) 3171 0 1
QtySoldKG Quantity sold ‐ Kg (Q3.10) 3137 0 3000000
ProdSoldKG KG sold ‐ KG produced (Q3.10 ‐ Q3.6) 3080 ‐517700 30000
FruitSoldKG Quantity of fruits sold (KG) 3171 0 756933
VegSoldKG Quantity of vegetables sold (KG) 3171 0 3000000
OthHortSoldKG Quantity of other hort crops sold (KG) 3171 0 54000
SaleValFRW Value of crop sales ‐ FRW (Q3.11) 3170 0 600000000
FRWperKG FRW per KG sold (Q3.10‐11) 2703 10.4 15000
FruitFRW Value of fruit sales (FRW) 3171 0 90000000
VegFRW Value of veg sales (FRW) 3171 0 600000000
OtherHortFRW Value of other hort sales (FRW) 3171 0 39420000
SaleValFRWpp Value received per particip memeber ‐ FRW (Q3.12) 2599 0 11943805
PrincMktOutlet Principle market outlet of sale (Q3.13) 2791 1 7
PrincMktOutletGP Principal market outlet ‐‐ grouped 2791 1 7
PrincMktOutletGP4 Principal market outlet ‐‐ 4 groups 2791 1 7
PrincMktOutletGP2 Principal market outlet ‐‐ 2 groups 2791 1 2
CropContract Crop grown under contract? (Q3.14) 3169 0 2
PassFrtFRW Passion Fruit FRW (Q3.1A & Q3.10) 120 0 80000000
PineAppleFRW Pineapple FRW (Q3.1A & Q3.10) 227 0 46793823
TamarilloFRW Tamarillo FRW (Q3.1A & Q3.10) 155 0 90000000
OtherFrtFRW Other Fruit FRW (Q3.1A & Q3.10) 145 0 14400000
CabbageFRW Cabbage FRW (Q3.1A & Q3.10) 548 0 100000000
CarrotFRW Carrot FRW (Q3.1A & Q3.10) 341 0 60000000
EggPlantFRW Egg Plant FRW (Q3.1A & Q3.10) 282 0 180000000
OnionFRW Onion FRW (Q3.1A & Q3.10) 233 0 600000000
SwtPeppFRW Sweet Pepper FRW (Q3.1A & Q3.10) 164 0 500000000
TomatoFRW Tomato FRW (Q3.1A & Q3.10) 299 0 308880000
OtherVegFRW Other Vegetable FRW (Q3.1A & Q3.10) 535 0 108000000
SpecCropFRW Specialty Crops (flowers, nuts, etc) FRW (Q3.1A & Q3.10) 121 0 39420000
Elevation Elevation (m) 3171 0 2714
DistPavRdKm Distance from paved road (Km) 3171 0.004 29.486
DistPavRdKm4 Distance from paved road (Km) 4 groups 3171 1 4
DistNatRdKm Distance from national road (Km) 3171 0 26.137
KeyID KeyID (V1) 40 21024 56011
ProdOrder Product Line number 40 1 5
ProvinceID Province (Q1.1) 40 2 5
DistrictID District ID 40 21 56
Product Product (Q4.1B) 40 90 99
SrcRawProd1 1st Source of Raw F&V (Q4.2A) 40 1 4
SrcRawProd2 2nd Source of Rwan F&V (Q.4.2B) 24 2 4
QtyProc12mo Quantity Processed over past 12 months (Q4.3A) 40 10 588200
QtyProdUnit Unit of processed product (Q4.3B) 40 1 2
QtyProdSold Quantity Product Sold ‐ (Kg or Lt) (Q4.4A) 40 0 588200
QtyProdSoldUnit Unit of sold processed product (Q4.3B) 40 1 2
ProdSaleRFW Total Revenue from sale of product (Q4.5) 40 0 156600000
FRWperKgLt FRW per Kg/Lt sold (Q3.10‐11) 35 64 10000
AvgProdSaleRFWpp Average Revenue per member (Q4.6) 14 5600 1180580
PrimPackMat Primary packaging material used (Q4.7) 40 0 7
PrimMktOutlet Primary market outlet for product (Q4.8) 39 1 7
ProdOnContract Product produced on contract? (Q4.9) 40 0 2
KeyID KeyID 17325 11001 57027
ProvinceID Province (Q1.1) 17325 1 5
DistrictID District ID 17325 11 57
LandUseTp Land Use Type (Q6.1‐15) 17325 1 15
Area Area (non‐standardized units) (Q6A) 6632 0 78200
Unit Unit of Area Measurement (HA vs SQM) (Q6B) 6623 1 2
Ha Land area operated byorg (HA) (Q6A&B) 17325 0 803
LocSlope Localization of land on hillside (Q6C) 6533 1 3
LeaseAreaYrLft No of yrs remaining on lease (Q6.14D & 6.15D) 932 0 99
CostLeaseAreaLeasPay Lease payment for past yr (Q6.15E) 545 0 6000000
ProdHa Production per Hectare (Section 3) 17325 0 1
Section 4: Processed products production and sales
Section 6: Land by use and ownership category
Annex Variable List Page 8
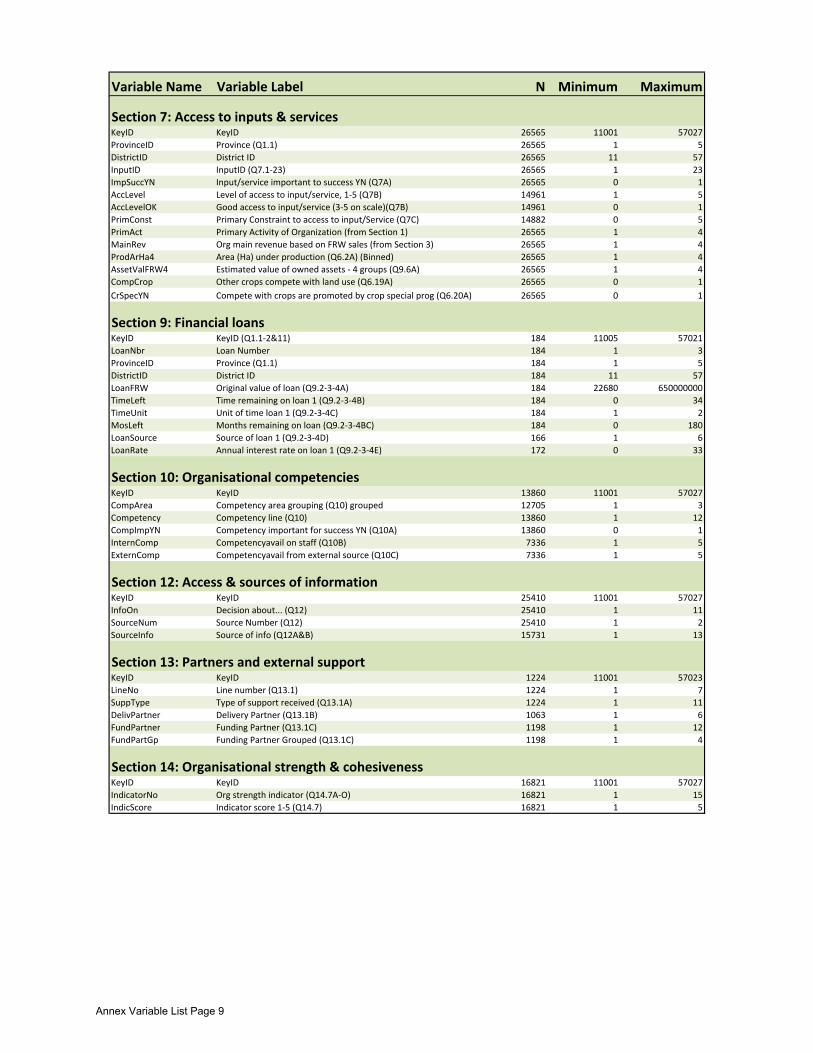
Variable Name N Minimum MaximumVariable Label
KeyID KeyID 26565 11001 57027
ProvinceID Province (Q1.1) 26565 1 5
DistrictID District ID 26565 11 57
InputID InputID (Q7.1‐23) 26565 1 23
ImpSuccYN Input/service important to success YN (Q7A) 26565 0 1
AccLevel Level of access to input/service, 1‐5 (Q7B) 14961 1 5
AccLevelOK Good access to input/service (3‐5 on scale)(Q7B) 14961 0 1
PrimConst Primary Constraint to access to input/Service (Q7C) 14882 0 5
PrimAct Primary Activity of Organization (from Section 1) 26565 1 4
MainRev Org main revenue based on FRW sales (from Section 3) 26565 1 4
ProdArHa4 Area (Ha) under production (Q6.2A) (Binned) 26565 1 4
AssetValFRW4 Estimated value of owned assets ‐ 4 groups (Q9.6A) 26565 1 4
CompCrop Other crops compete with land use (Q6.19A) 26565 0 1
CrSpecYN Compete with crops are promoted by crop special prog (Q6.20A) 26565 0 1
KeyID KeyID (Q1.1‐2&11) 184 11005 57021
LoanNbr Loan Number 184 1 3
ProvinceID Province (Q1.1) 184 1 5
DistrictID District ID 184 11 57
LoanFRW Original value of loan (Q9.2‐3‐4A) 184 22680 650000000
TimeLeft Time remaining on loan 1 (Q9.2‐3‐4B) 184 0 34
TimeUnit Unit of time loan 1 (Q9.2‐3‐4C) 184 1 2
MosLeft Months remaining on loan (Q9.2‐3‐4BC) 184 0 180
LoanSource Source of loan 1 (Q9.2‐3‐4D) 166 1 6
LoanRate Annual interest rate on loan 1 (Q9.2‐3‐4E) 172 0 33
KeyID KeyID 13860 11001 57027
CompArea Competency area grouping (Q10) grouped 12705 1 3
Competency Competency line (Q10) 13860 1 12
CompImpYN Competency important for success YN (Q10A) 13860 0 1
InternComp Competencyavail on staff (Q10B) 7336 1 5
ExternComp Competencyavail from external source (Q10C) 7336 1 5
KeyID KeyID 25410 11001 57027
InfoOn Decision about... (Q12) 25410 1 11
SourceNum Source Number (Q12) 25410 1 2
SourceInfo Source of info (Q12A&B) 15731 1 13
KeyID KeyID 1224 11001 57023
LineNo Line number (Q13.1) 1224 1 7
SuppType Type of support received (Q13.1A) 1224 1 11
DelivPartner Delivery Partner (Q13.1B) 1063 1 6
FundPartner Funding Partner (Q13.1C) 1198 1 12
FundPartGp Funding Partner Grouped (Q13.1C) 1198 1 4
KeyID KeyID 16821 11001 57027
IndicatorNo Org strength indicator (Q14.7A‐O) 16821 1 15
IndicScore Indicator score 1‐5 (Q14.7) 16821 1 5
Section 10: Organisational competencies
Section 12: Access & sources of information
Section 13: Partners and external support
Section 14: Organisational strength & cohesiveness
Section 7: Access to inputs & services
Section 9: Financial loans
Annex Variable List Page 9