baseline budget projections as of march 6, 2020...3 see congressional budget office, cost estimate...
TRANSCRIPT
www.cbo.gov/publication/56268
Baseline Budget Projections as of March 6, 2020
March 2020
The Congressional Budget Office’s spring baseline budget projections are based this year, as they usually are,
on the agency’s January economic forecast. However, interest rates and some other economic variables are
far from the amounts CBO projected for the beginning of this year, in large part because of responses to the
novel coronavirus. Because the spring baseline incorporates legislative and technical revisions that are useful
to policymakers, CBO is making it available to the Congress now, even though it does not incorporate the
estimated effects of the novel coronavirus or any economic news since January. Incorporating those recent
developments would warrant substantial revisions, which would take additional time and would affect
projections of both spending and revenues.
This document provides tables with the spring baseline projections and an explanation of the changes since
January 2020, including the effects of legislation enacted through March 6, 2020; additional details about
selected programs are available on CBO’s website. CBO will update its economic and budget projections
later this year.

1
This document provides the Congressional Budget Office’s spring 2020 baseline budget
projections and explains how they differ from the projections published earlier this year.1
Background
CBO’s spring budget projections are based on the economic forecast that the agency developed
in January 2020, and they incorporate legislation enacted through March 6, 2020, as well as
various technical adjustments based on new information available prior to that date (such as
program details released in conjunction with the President’s budget).2 The budget projections
provided in this update do not account for changes to the nation’s economic outlook and fiscal
situation arising from the recent and rapidly evolving public health emergency related to the
novel coronavirus.
The tables included in this document show the agency’s projections for the budget by major
category (see Table 1), federal debt held by the public (see Table 2), a set of key projections (see
Table 3), and details about mandatory and discretionary spending (see Table 4 and Table 5). The
changes since the January projections are discussed below (see Table 6).
CBO’s projections are constructed in accordance with provisions set forth in the Balanced
Budget and Emergency Deficit Control Act of 1985 (Public Law 99-177) and the Congressional
Budget and Impoundment Control Act of 1974 (P.L. 93-344). Those laws require CBO to
construct its baseline under the assumption that current laws generally remain unchanged. CBO’s
baseline is not intended to provide a forecast of future budgetary outcomes; rather, it provides a
benchmark that policymakers can use to assess the potential effects of future policy decisions.
Changes in CBO’s Baseline Projections Since January 2020
In CBO’s spring projections, the deficit for fiscal year 2020 is $58 billion larger than the agency
estimated in January. CBO’s updated baseline projections for the 2021–2030 period show a
cumulative deficit that is virtually unchanged from the $13.1 trillion deficit that the agency
projected in January.
Notes: Unless this report indicates otherwise, all years referred to are federal fiscal years, which run from October 1
to September 30 and are designated by the calendar year in which they end. Numbers in the tables may not add up to
totals because of rounding.
1 See Congressional Budget Office, The Budget and Economic Outlook: 2020 to 2030 (January 2020),
www.cbo.gov/publication/56020.
2 The most recent law with significant budgetary effects that are reflected in CBO’s spring baseline is the
Coronavirus Preparedness and Response Supplemental Appropriations Act, 2020 (Public Law 116-123), enacted on
March 6, 2020. After CBO completed its analysis, the Congress began consideration of H.R. 6201, the Families First
Coronavirus Response Act. Budgetary effects related to that act—as well as any other legislation enacted after
March 6, 2020—are not incorporated into these projections.

2
All the changes that CBO has made to its baseline either reflect legislation enacted from January
through March 6 or incorporate technical updates—changes made for reasons other than revised
economic information or newly enacted laws. Technical changes include, for example, updated
estimates of how quickly programs will obligate and expend funds, incorporating year-end data
for various program activities; updated demographic information; and changes related to new
administrative actions such as rule changes. None of the changes are classified as economic
because CBO’s updated budget projections are based on the same economic forecast that the
agency developed for its January 2020 baseline.
Legislative Changes
New legislation increased projected cumulative deficits by $72 billion over the 2021–2030
period. Two pieces of legislation enacted since January significantly affected CBO’s projections:
the United States–Mexico–Canada Agreement Implementation Act (P.L. 116-113) and the
Coronavirus Preparedness and Response Supplemental Appropriations Act, 2020. (The updated
projections do not include effects of H.R. 6201, the Families First Coronavirus Response Act,
which lawmakers were considering when CBO finalized this report.)
Outlays. Legislation enacted from January through March 6 led CBO to increase projected
outlays by $1 billion in 2020 and by $76 billion for the 2021–2030 period. Those increased
outlays stem almost entirely from enactment of the Coronavirus Preparedness and Response
Supplemental Appropriations Act, 2020, which added nearly $8 billion in discretionary budget
authority in 2020 to the amounts included in CBO’s January baseline.3 Under the rules governing
CBO’s baseline projections, that funding is assumed to continue and to grow with inflation each
year of the baseline period. (In accordance with section 257 of the Deficit Control Act, CBO
projects budget authority by applying the specified inflation rate to the most recent
appropriations for discretionary accounts.) That increased funding primarily supports activities
related to public health, including efforts to develop and manufacture vaccines and other
treatments, as well as grants to state, local, and tribal organizations; to community health centers;
and to other nonfederal entities to prevent, prepare for, and respond to the coronavirus.
All told, legislative changes to mandatory programs were small. The net effect of legislative
changes on CBO’s projections of revenues and outlays led the agency to raise its estimate of
debt-service costs by $8 billion over the 2021–2030 period.
Revenues. In CBO’s projections, the United States–Mexico–Canada Agreement Implementation
Act increased revenues by $10 million in 2020 and by $3.4 billion over the 2021–2030 period,
3 See Congressional Budget Office, cost estimate for H.R. 6074, the Coronavirus Preparedness and Response
Supplemental Appropriations Act, 2020 (March 4, 2020), www.cbo.gov/publication/56227.
3
largely because of a provision of the act that is expected to increase revenue from tariffs on
motor vehicles and parts.4
Technical Changes
Technical changes—those not directly related to newly enacted laws or changes to CBO’s
economic forecast—led the agency to increase its estimate of the deficit by $57 billion in 2020
but to decrease its projection of the cumulative deficit by $77 billion over the 2021–2030 period.
Outlays. Technical updates to CBO’s spending projections resulted in an increase of $57 billion
in estimated outlays for 2020, mostly because the Administration is recording revisions to the
subsidy costs of direct and subsidized loans made in prior years.5 The largest such change was an
upward revision for student loans.
Over the 2021–2030 period, the agency decreased its projections by $88 billion. The main
changes lowered projected outlays for Medicare and Social Security, which were partially offset
by increases in projected outlays for premium tax credits and net interest.
■ Medicare. For technical reasons, CBO decreased its projection of Medicare outlays by a net
of $131 billion (or 1.3 percent) over the 2021–2030 period. That downward revision reflects
lower-than-expected actual spending so far in the current fiscal year as well as slightly slower
projected growth rates in spending for various medical services. That downward revision in
growth rates is the net result of slower growth in spending for some services, such as
physician and skilled nursing services, and faster projected growth for other services, such as
hospital outpatient services.
■ Social Security. CBO’s 10-year projection of spending for Social Security is $67 billion (or
0.4 percent) lower than the agency last projected, reflecting reductions in projected outlays
for both Old-Age and Survivors Insurance and Disability Insurance, because of small
reductions in the projected number of beneficiaries for both programs.
■ Premium Tax Credits and Related Spending. CBO and the staff of the Joint Committee on
Taxation increased their projections of outlays for subsidies for health insurance purchased
through the marketplaces established under the Affordable Care Act and related spending by
$60 billion (or 9.8 percent) over the 2021–2030 period. That increase largely stems from
higher projections of subsidized enrollment through those marketplaces, in part because of
higher-than-expected enrollment during the open enrollment period for 2020.
4 See Congressional Budget Office, cost estimate for H.R. 5430, the United States–Mexico–Canada Agreement
Implementation Act (December 16, 2019), www.cbo.gov/publication/55960.
5 CBO does not estimate those revisions to subsidy costs; rather, those totals are based on the amounts that the
Office of Management and Budget expects to record in fiscal year 2020.
4
■ Net Interest. CBO increased its estimate of net interest outlays by $34 billion (or
0.6 percent) for the 2021–2030 period. That revision is the net result of reductions in
projected credit financing activity, an increase in CBO’s projections of the weighted-average
maturity of outstanding debt (partially driven by the introduction of the 20-year Treasury
bond), and a decrease in debt-service costs because the other technical updates to CBO’s
projections of revenues and outlays, on net, reduced the cumulative deficit. The estimate of
net interest outlays does not reflect the lower interest rates that have prevailed in
March 2020.
Revenues. CBO did not fully update its revenue projections for this baseline; such a revision
typically would occur in conjunction with an updated economic forecast, which the agency
expects to complete later this year. However, because of revisions to CBO’s projections of health
insurance coverage, the agency raised its revenue projections by $300 million for 2020 and
reduced them by $11 billion for the 2021–2030 period. Most of that reduction stems from CBO’s
revision to its projections of subsidies for insurance purchased through the marketplaces
established under the Affordable Care Act. CBO increased the projected amounts of those
subsidies, part of which are recorded as reductions in tax liabilities. That change reduced
projections of net receipts from individual income taxes by $13 billion over the 2021–2030
period.
5
About This Document
This document is one of a series of reports on the state of the budget and the economy that the
Congressional Budget Office issues each year. It satisfies the requirement in section 202(e) of
the Congressional Budget Act of 1974 for CBO to submit to the Committees on the Budget
periodic reports about fiscal policy and to provide baseline projections of the federal budget. In
keeping with CBO’s mandate to provide objective, impartial analysis, this report makes no
recommendations.
Amber Marcellino wrote the report with assistance from Aaron Feinstein, Dan Ready, and
Joshua Shakin. Christina Hawley Anthony, Theresa Gullo, Leo Lex, John McClelland, and Sam
Papenfuss provided guidance. The estimates in the report are the work of more than 100 staff
members at CBO and the staff of the Joint Committee on Taxation.
Wendy Edelberg, Mark Hadley, Jeffrey Kling, and Robert Sunshine reviewed the report.
Rebecca Lanning was the editor, and Jorge Salazar was the graphics editor. The report is
available on CBO’s website (www.cbo.gov/publication/56268).
CBO continually seeks feedback to make its work as useful as possible. Please send any
comments to [email protected].
Phillip L. Swagel
Director
March 2020
6
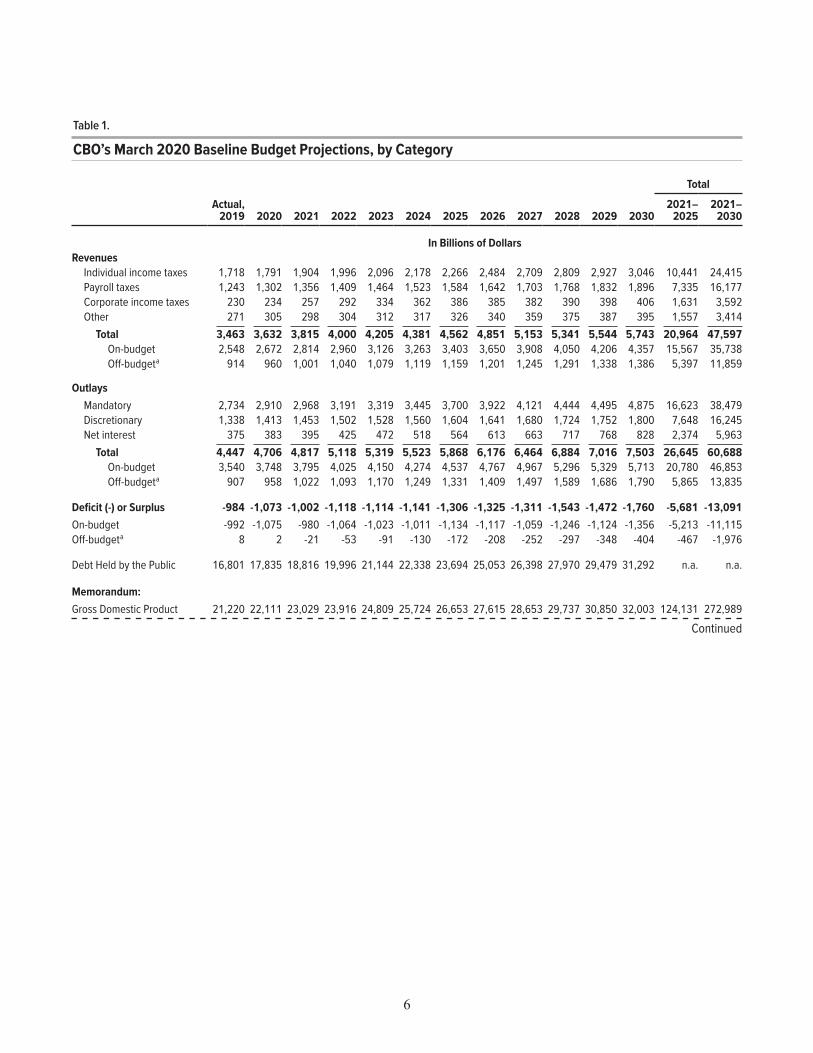
Table 1 .
CBO’s March 2020 Baseline Budget Projections, by Category
Total
Actual, 2019 2020 2021 2022 2023 2024 2025 2026 2027 2028 2029 2030
2021–2025
2021–2030
In Billions of DollarsRevenues
Individual income taxes 1,718 1,791 1,904 1,996 2,096 2,178 2,266 2,484 2,709 2,809 2,927 3,046 10,441 24,415Payroll taxes 1,243 1,302 1,356 1,409 1,464 1,523 1,584 1,642 1,703 1,768 1,832 1,896 7,335 16,177Corporate income taxes 230 234 257 292 334 362 386 385 382 390 398 406 1,631 3,592Other 271 305 298 304 312 317 326 340 359 375 387 395 1,557 3,414
Total 3,463 3,632 3,815 4,000 4,205 4,381 4,562 4,851 5,153 5,341 5,544 5,743 20,964 47,597On-budget 2,548 2,672 2,814 2,960 3,126 3,263 3,403 3,650 3,908 4,050 4,206 4,357 15,567 35,738Off-budget a 914 960 1,001 1,040 1,079 1,119 1,159 1,201 1,245 1,291 1,338 1,386 5,397 11,859
OutlaysMandatory 2,734 2,910 2,968 3,191 3,319 3,445 3,700 3,922 4,121 4,444 4,495 4,875 16,623 38,479Discretionary 1,338 1,413 1,453 1,502 1,528 1,560 1,604 1,641 1,680 1,724 1,752 1,800 7,648 16,245Net interest 375 383 395 425 472 518 564 613 663 717 768 828 2,374 5,963
Total 4,447 4,706 4,817 5,118 5,319 5,523 5,868 6,176 6,464 6,884 7,016 7,503 26,645 60,688On-budget 3,540 3,748 3,795 4,025 4,150 4,274 4,537 4,767 4,967 5,296 5,329 5,713 20,780 46,853Off-budget a 907 958 1,022 1,093 1,170 1,249 1,331 1,409 1,497 1,589 1,686 1,790 5,865 13,835
Deficit (-) or Surplus -984 -1,073 -1,002 -1,118 -1,114 -1,141 -1,306 -1,325 -1,311 -1,543 -1,472 -1,760 -5,681 -13,091On-budget -992 -1,075 -980 -1,064 -1,023 -1,011 -1,134 -1,117 -1,059 -1,246 -1,124 -1,356 -5,213 -11,115Off-budget a 8 2 -21 -53 -91 -130 -172 -208 -252 -297 -348 -404 -467 -1,976
Debt Held by the Public 16,801 17,835 18,816 19,996 21,144 22,338 23,694 25,053 26,398 27,970 29,479 31,292 n.a. n.a.
Memorandum:Gross Domestic Product 21,220 22,111 23,029 23,916 24,809 25,724 26,653 27,615 28,653 29,737 30,850 32,003 124,131 272,989
Continued

7
Total
Actual, 2019 2020 2021 2022 2023 2024 2025 2026 2027 2028 2029 2030
2021–2025
2021–2030
As a Percentage of Gross Domestic ProductRevenues
Individual income taxes 8.1 8.1 8.3 8.3 8.4 8.5 8.5 9.0 9.5 9.4 9.5 9.5 8.4 8.9Payroll taxes 5.9 5.9 5.9 5.9 5.9 5.9 5.9 5.9 5.9 5.9 5.9 5.9 5.9 5.9Corporate income taxes 1.1 1.1 1.1 1.2 1.3 1.4 1.4 1.4 1.3 1.3 1.3 1.3 1.3 1.3Other 1.3 1.4 1.3 1.3 1.3 1.2 1.2 1.2 1.3 1.3 1.3 1.2 1.3 1.3
Total 16.3 16.4 16.6 16.7 16.9 17.0 17.1 17.6 18.0 18.0 18.0 17.9 16.9 17.4On-budget 12.0 12.1 12.2 12.4 12.6 12.7 12.8 13.2 13.6 13.6 13.6 13.6 12.5 13.1Off-budget a 4.3 4.3 4.3 4.3 4.3 4.3 4.3 4.3 4.3 4.3 4.3 4.3 4.3 4.3
OutlaysMandatory 12.9 13.2 12.9 13.3 13.4 13.4 13.9 14.2 14.4 14.9 14.6 15.2 13.4 14.1Discretionary 6.3 6.4 6.3 6.3 6.2 6.1 6.0 5.9 5.9 5.8 5.7 5.6 6.2 6.0Net interest 1.8 1.7 1.7 1.8 1.9 2.0 2.1 2.2 2.3 2.4 2.5 2.6 1.9 2.2
Total 21.0 21.3 20.9 21.4 21.4 21.5 22.0 22.4 22.6 23.2 22.7 23.4 21.5 22.2On-budget 16.7 16.9 16.5 16.8 16.7 16.6 17.0 17.3 17.3 17.8 17.3 17.9 16.7 17.2Off-budget a 4.3 4.3 4.4 4.6 4.7 4.9 5.0 5.1 5.2 5.3 5.5 5.6 4.7 5.1
Deficit (-) or Surplus -4.6 -4.9 -4.3 -4.7 -4.5 -4.4 -4.9 -4.8 -4.6 -5.2 -4.8 -5.5 -4.6 -4.8On-budget -4.7 -4.9 -4.3 -4.5 -4.1 -3.9 -4.3 -4.0 -3.7 -4.2 -3.6 -4.2 -4.2 -4.1Off-budget a * * -0.1 -0.2 -0.4 -0.5 -0.6 -0.8 -0.9 -1.0 -1.1 -1.3 -0.4 -0.7
Debt Held by the Public 79.2 80.7 81.7 83.6 85.2 86.8 88.9 90.7 92.1 94.1 95.6 97.8 n.a. n.a.
Source: Congressional Budget Office.
These budget projections reflect legislation, administrative actions, and regulatory changes through March 6, 2020. They are based on the economic forecast that CBO completed on January 7, 2020, and do not account for changes to the nation’s economic outlook and fiscal situation arising from the recent and rapidly evolving public health emergency related to the novel coronavirus.
n.a. = not applicable; * = between -0.05 percent and 0.05 percent.
a. The revenues and outlays of the Social Security trust funds and the net cash flow of the Postal Service are classified as off-budget.
Table 1. Continued
CBO’s March 2020 Baseline Budget Projections, by Category

8
Table 2 .
CBO’s March 2020 Baseline Projections of Federal DebtBillions of Dollars
Actual, 2019 2020 2021 2022 2023 2024 2025 2026 2027 2028 2029 2030
Debt Held by the Public at the Beginning of the Year 15,750 16,801 17,835 18,816 19,996 21,144 22,338 23,694 25,053 26,398 27,970 29,479
Changes in Debt Held by the PublicDeficit 984 1,073 1,002 1,118 1,114 1,141 1,306 1,325 1,311 1,543 1,472 1,760Other means of financing a 67 -39 -21 63 34 53 49 34 34 30 37 54
Total 1,051 1,034 981 1,180 1,148 1,195 1,355 1,359 1,345 1,573 1,508 1,813
Debt Held by the Public at the End of the Year
In billions of dollars 16,801 17,835 18,816 19,996 21,144 22,338 23,694 25,053 26,398 27,970 29,479 31,292As a percentage of GDP 79.2 80.7 81.7 83.6 85.2 86.8 88.9 90.7 92.1 94.1 95.6 97.8
Memorandum:
Debt Held by the Public Minus Financial Assets b
In billions of dollars 14,959 16,032 17,033 18,151 19,266 20,407 21,712 23,038 24,348 25,891 27,363 29,123As a percentage of GDP 70.5 72.5 74.0 75.9 77.7 79.3 81.5 83.4 85.0 87.1 88.7 91.0
Gross Federal Debt c 22,669 23,785 24,846 26,065 27,227 28,413 29,695 30,994 32,146 33,474 34,714 36,189
Debt Subject to Limit d 22,687 23,804 24,865 26,084 27,247 28,434 29,717 31,016 32,169 33,498 34,739 36,214
Average Interest Rate on Debt Held by the Public (Percent) 2.5 2.4 2.3 2.3 2.4 2.5 2.6 2.6 2.7 2.7 2.8 2.8
Source: Congressional Budget Office.
These budget projections reflect legislation, administrative actions, and regulatory changes through March 6, 2020. They are based on the economic forecast that CBO completed on January 7, 2020, and do not account for changes to the nation’s economic outlook and fiscal situation arising from the recent and rapidly evolving public health emergency related to the novel coronavirus.
GDP = gross domestic product.
a. Factors not included in budget totals that affect the government’s need to borrow from the public. Those factors include cash flows associated with federal credit programs such as student loans (because only the subsidy costs of those programs are reflected in the budget deficit), as well as changes in the government’s cash balances.
b. Debt held by the public minus the value of outstanding student loans and other credit transactions, cash balances, and various financial instruments.
c. Federal debt held by the public plus Treasury securities held by federal trust funds and other government accounts.
d. The amount of federal debt that is subject to the overall limit set in law. That measure of debt excludes debt issued by the Federal Financing Bank and reflects certain other adjustments that are excluded from gross federal debt. The debt limit was most recently set at $22.0 trillion but has been suspended through July 31, 2021. On August 1, 2021, the debt limit will be raised to its previous level plus the amount of federal borrowing that occurred while the limit was suspended. For more details, see Congressional Budget Office, Federal Debt and the Statutory Limit, February 2019 (February 2019), www.cbo.gov/publication/54987.
9
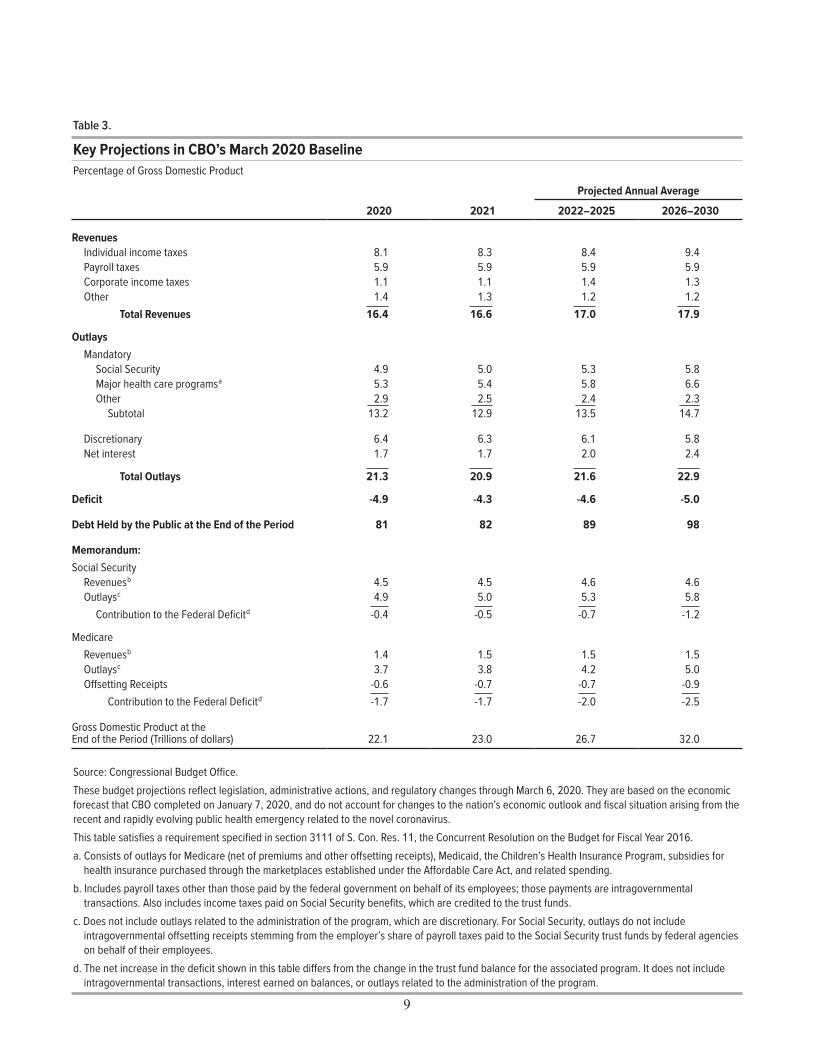
Table 3 .
Key Projections in CBO’s March 2020 BaselinePercentage of Gross Domestic Product
Projected Annual Average
2020 2021 2022–2025 2026–2030
RevenuesIndividual income taxes 8.1 8.3 8.4 9.4Payroll taxes 5.9 5.9 5.9 5.9Corporate income taxes 1.1 1.1 1.4 1.3Other 1.4 1.3 1.2 1.2
Total Revenues 16.4 16.6 17.0 17.9
OutlaysMandatory
Social Security 4.9 5.0 5.3 5.8Major health care programs a 5.3 5.4 5.8 6.6Other 2.9 2.5 2.4 2.3
Subtotal 13.2 12.9 13.5 14.7
Discretionary 6.4 6.3 6.1 5.8Net interest 1.7 1.7 2.0 2.4
Total Outlays 21.3 20.9 21.6 22.9
Deficit -4.9 -4.3 -4.6 -5.0
Debt Held by the Public at the End of the Period 81 82 89 98
Memorandum:Social Security
Revenues b 4.5 4.5 4.6 4.6Outlays c 4.9 5.0 5.3 5.8
Contribution to the Federal Deficit d -0.4 -0.5 -0.7 -1.2
MedicareRevenues b 1.4 1.5 1.5 1.5Outlays c 3.7 3.8 4.2 5.0Offsetting Receipts -0.6 -0.7 -0.7 -0.9
Contribution to the Federal Deficit d -1.7 -1.7 -2.0 -2.5
Gross Domestic Product at the End of the Period (Trillions of dollars) 22.1 23.0 26.7 32.0
Source: Congressional Budget Office.These budget projections reflect legislation, administrative actions, and regulatory changes through March 6, 2020. They are based on the economic forecast that CBO completed on January 7, 2020, and do not account for changes to the nation’s economic outlook and fiscal situation arising from the recent and rapidly evolving public health emergency related to the novel coronavirus. This table satisfies a requirement specified in section 3111 of S. Con. Res. 11, the Concurrent Resolution on the Budget for Fiscal Year 2016. a. Consists of outlays for Medicare (net of premiums and other offsetting receipts), Medicaid, the Children’s Health Insurance Program, subsidies for
health insurance purchased through the marketplaces established under the Affordable Care Act, and related spending. b. Includes payroll taxes other than those paid by the federal government on behalf of its employees; those payments are intragovernmental
transactions. Also includes income taxes paid on Social Security benefits, which are credited to the trust funds. c. Does not include outlays related to the administration of the program, which are discretionary. For Social Security, outlays do not include
intragovernmental offsetting receipts stemming from the employer’s share of payroll taxes paid to the Social Security trust funds by federal agencies on behalf of their employees.
d. The net increase in the deficit shown in this table differs from the change in the trust fund balance for the associated program. It does not include intragovernmental transactions, interest earned on balances, or outlays related to the administration of the program.
10
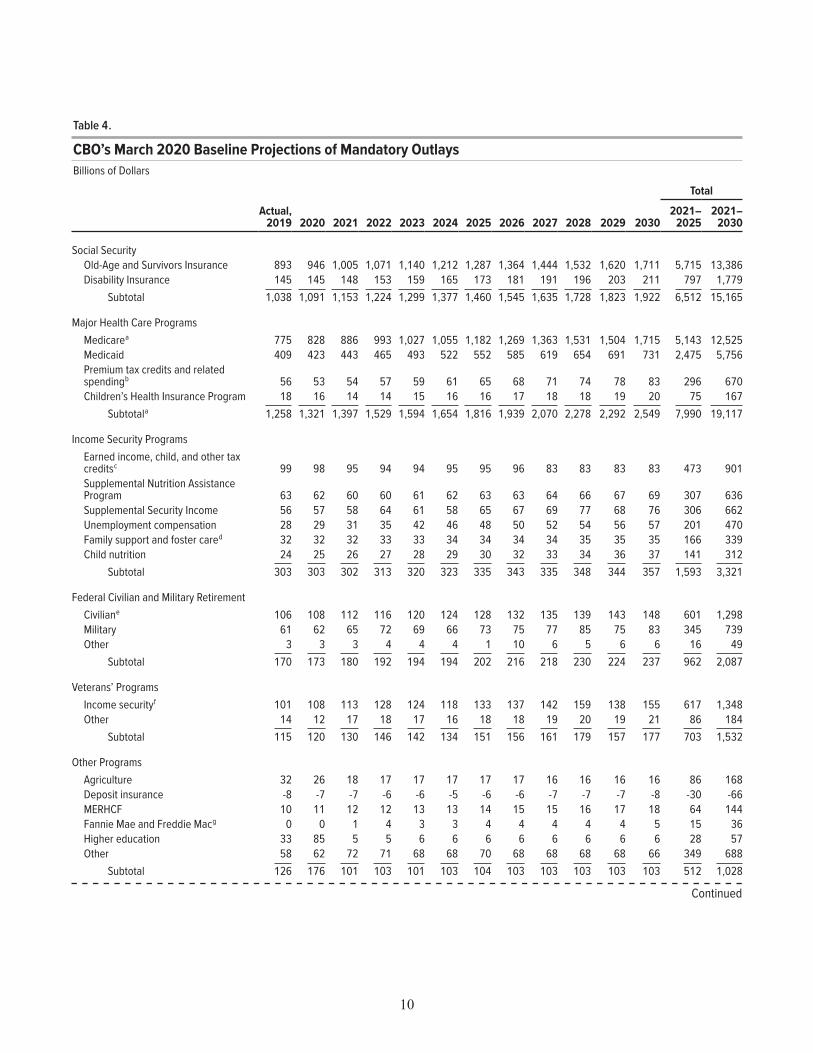
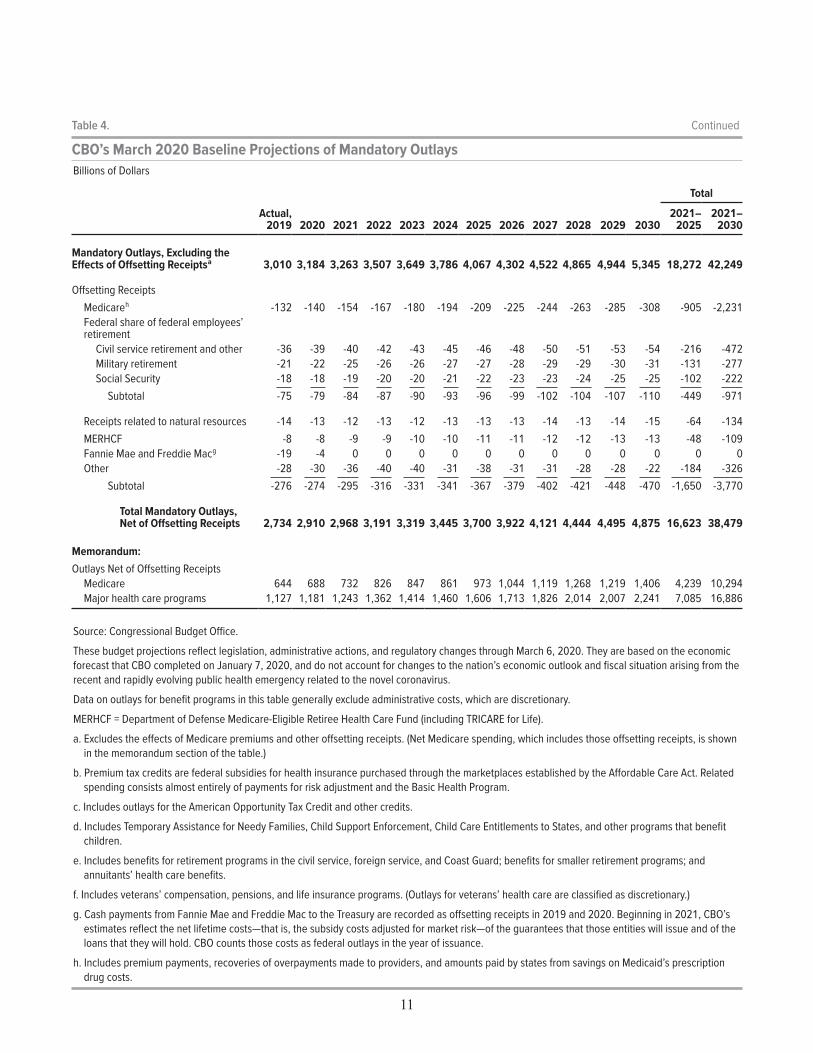
Table 4 .
CBO’s March 2020 Baseline Projections of Mandatory OutlaysBillions of Dollars
Total
Actual, 2019 2020 2021 2022 2023 2024 2025 2026 2027 2028 2029 2030
2021–2025
2021–2030
Social SecurityOld-Age and Survivors Insurance 893 946 1,005 1,071 1,140 1,212 1,287 1,364 1,444 1,532 1,620 1,711 5,715 13,386Disability Insurance 145 145 148 153 159 165 173 181 191 196 203 211 797 1,779
Subtotal 1,038 1,091 1,153 1,224 1,299 1,377 1,460 1,545 1,635 1,728 1,823 1,922 6,512 15,165
Major Health Care ProgramsMedicare a 775 828 886 993 1,027 1,055 1,182 1,269 1,363 1,531 1,504 1,715 5,143 12,525Medicaid 409 423 443 465 493 522 552 585 619 654 691 731 2,475 5,756Premium tax credits and related spending b 56 53 54 57 59 61 65 68 71 74 78 83 296 670Children’s Health Insurance Program 18 16 14 14 15 16 16 17 18 18 19 20 75 167
Subtotal a 1,258 1,321 1,397 1,529 1,594 1,654 1,816 1,939 2,070 2,278 2,292 2,549 7,990 19,117
Income Security ProgramsEarned income, child, and other tax credits c 99 98 95 94 94 95 95 96 83 83 83 83 473 901Supplemental Nutrition Assistance Program 63 62 60 60 61 62 63 63 64 66 67 69 307 636Supplemental Security Income 56 57 58 64 61 58 65 67 69 77 68 76 306 662Unemployment compensation 28 29 31 35 42 46 48 50 52 54 56 57 201 470Family support and foster care d 32 32 32 33 33 34 34 34 34 35 35 35 166 339Child nutrition 24 25 26 27 28 29 30 32 33 34 36 37 141 312
Subtotal 303 303 302 313 320 323 335 343 335 348 344 357 1,593 3,321
Federal Civilian and Military RetirementCivilian e 106 108 112 116 120 124 128 132 135 139 143 148 601 1,298Military 61 62 65 72 69 66 73 75 77 85 75 83 345 739Other 3 3 3 4 4 4 1 10 6 5 6 6 16 49
Subtotal 170 173 180 192 194 194 202 216 218 230 224 237 962 2,087
Veterans’ ProgramsIncome security f 101 108 113 128 124 118 133 137 142 159 138 155 617 1,348Other 14 12 17 18 17 16 18 18 19 20 19 21 86 184
Subtotal 115 120 130 146 142 134 151 156 161 179 157 177 703 1,532
Other ProgramsAgriculture 32 26 18 17 17 17 17 17 16 16 16 16 86 168Deposit insurance -8 -7 -7 -6 -6 -5 -6 -6 -7 -7 -7 -8 -30 -66MERHCF 10 11 12 12 13 13 14 15 15 16 17 18 64 144Fannie Mae and Freddie Mac g 0 0 1 4 3 3 4 4 4 4 4 5 15 36Higher education 33 85 5 5 6 6 6 6 6 6 6 6 28 57Other 58 62 72 71 68 68 70 68 68 68 68 66 349 688
Subtotal 126 176 101 103 101 103 104 103 103 103 103 103 512 1,028
Continued
11
Total
Actual, 2019 2020 2021 2022 2023 2024 2025 2026 2027 2028 2029 2030
2021–2025
2021–2030
Mandatory Outlays, Excluding the Effects of Offsetting Receipts a 3,010 3,184 3,263 3,507 3,649 3,786 4,067 4,302 4,522 4,865 4,944 5,345 18,272 42,249
Offsetting ReceiptsMedicare h -132 -140 -154 -167 -180 -194 -209 -225 -244 -263 -285 -308 -905 -2,231Federal share of federal employees’ retirement
Civil service retirement and other -36 -39 -40 -42 -43 -45 -46 -48 -50 -51 -53 -54 -216 -472Military retirement -21 -22 -25 -26 -26 -27 -27 -28 -29 -29 -30 -31 -131 -277Social Security -18 -18 -19 -20 -20 -21 -22 -23 -23 -24 -25 -25 -102 -222
Subtotal -75 -79 -84 -87 -90 -93 -96 -99 -102 -104 -107 -110 -449 -971
Receipts related to natural resources -14 -13 -12 -13 -12 -13 -13 -13 -14 -13 -14 -15 -64 -134MERHCF -8 -8 -9 -9 -10 -10 -11 -11 -12 -12 -13 -13 -48 -109Fannie Mae and Freddie Mac g -19 -4 0 0 0 0 0 0 0 0 0 0 0 0Other -28 -30 -36 -40 -40 -31 -38 -31 -31 -28 -28 -22 -184 -326
Subtotal -276 -274 -295 -316 -331 -341 -367 -379 -402 -421 -448 -470 -1,650 -3,770
Total Mandatory Outlays, Net of Offsetting Receipts 2,734 2,910 2,968 3,191 3,319 3,445 3,700 3,922 4,121 4,444 4,495 4,875 16,623 38,479
Memorandum:Outlays Net of Offsetting Receipts
Medicare 644 688 732 826 847 861 973 1,044 1,119 1,268 1,219 1,406 4,239 10,294Major health care programs 1,127 1,181 1,243 1,362 1,414 1,460 1,606 1,713 1,826 2,014 2,007 2,241 7,085 16,886
Source: Congressional Budget Office.
These budget projections reflect legislation, administrative actions, and regulatory changes through March 6, 2020. They are based on the economic forecast that CBO completed on January 7, 2020, and do not account for changes to the nation’s economic outlook and fiscal situation arising from the recent and rapidly evolving public health emergency related to the novel coronavirus.
Data on outlays for benefit programs in this table generally exclude administrative costs, which are discretionary.
MERHCF = Department of Defense Medicare-Eligible Retiree Health Care Fund (including TRICARE for Life).
a. Excludes the effects of Medicare premiums and other offsetting receipts. (Net Medicare spending, which includes those offsetting receipts, is shown in the memorandum section of the table.)
b. Premium tax credits are federal subsidies for health insurance purchased through the marketplaces established by the Affordable Care Act. Related spending consists almost entirely of payments for risk adjustment and the Basic Health Program.
c. Includes outlays for the American Opportunity Tax Credit and other credits.
d. Includes Temporary Assistance for Needy Families, Child Support Enforcement, Child Care Entitlements to States, and other programs that benefit children.
e. Includes benefits for retirement programs in the civil service, foreign service, and Coast Guard; benefits for smaller retirement programs; and annuitants’ health care benefits.
f. Includes veterans’ compensation, pensions, and life insurance programs. (Outlays for veterans’ health care are classified as discretionary.)
g. Cash payments from Fannie Mae and Freddie Mac to the Treasury are recorded as offsetting receipts in 2019 and 2020. Beginning in 2021, CBO’s estimates reflect the net lifetime costs—that is, the subsidy costs adjusted for market risk—of the guarantees that those entities will issue and of the loans that they will hold. CBO counts those costs as federal outlays in the year of issuance.
h. Includes premium payments, recoveries of overpayments made to providers, and amounts paid by states from savings on Medicaid’s prescription drug costs.
Table 4. Continued
CBO’s March 2020 Baseline Projections of Mandatory OutlaysBillions of Dollars

12
Table 5 .
CBO’s March 2020 Baseline Projections of Discretionary Spending Billions of Dollars
Total
Actual, 2019 a 2020 a 2021 2022 2023 2024 2025 2026 2027 2028 2029 2030
2021–2025
2021–2030
Budget AuthorityDefense 719 746 753 772 792 812 832 852 872 893 914 936 3,960 8,428Nondefense 658 680 668 689 708 726 745 764 782 800 819 839 3,536 7,539
Total 1,376 1,426 1,421 1,461 1,500 1,538 1,577 1,615 1,655 1,693 1,733 1,775 7,497 15,967Outlays
Defense 676 710 730 752 767 781 806 824 844 870 878 905 3,835 8,157Nondefense 661 702 724 750 762 779 798 817 836 854 874 895 3,813 8,088
Total 1,338 1,413 1,453 1,502 1,528 1,560 1,604 1,641 1,680 1,724 1,752 1,800 7,648 16,245
Memorandum:
Caps on Budget Authority Specified in the Budget Control Act (as Amended), Including Automatic Reductions to the Caps
Defense 647 667 672 n.a. n.a. n.a. n.a. n.a. n.a. n.a. n.a. n.a. n.a. n.a.Nondefense 597 622 627 n.a. n.a. n.a. n.a. n.a. n.a. n.a. n.a. n.a. n.a. n.a.
Total 1,244 1,288 1,298 n.a. n.a. n.a. n.a. n.a. n.a. n.a. n.a. n.a. n.a. n.a.
Adjustments to the Caps b
Defense 72 79 81 n.a. n.a. n.a. n.a. n.a. n.a. n.a. n.a. n.a. n.a. n.a.Nondefense 44 42 42 n.a. n.a. n.a. n.a. n.a. n.a. n.a. n.a. n.a. n.a. n.a.
Total 116 121 123 n.a. n.a. n.a. n.a. n.a. n.a. n.a. n.a. n.a. n.a. n.a.
Source: Congressional Budget Office.
These budget projections reflect legislation, administrative actions, and regulatory changes through March 6, 2020. They are based on the economic forecast that CBO completed on January 7, 2020, and do not account for changes to the nation’s economic outlook and fiscal situation arising from the recent and rapidly evolving public health emergency related to the novel coronavirus.
CBO’s current baseline projections incorporate the assumption that the caps on discretionary budget authority and the automatic enforcement procedures specified in the Budget Control Act of 2011 (as amended) remain in effect through 2021.
Nondefense discretionary outlays are usually greater than budget authority because of spending from the Highway Trust Fund and the Airport and Airway Trust Fund that is subject to obligation limitations set in appropriation acts. The budget authority for such programs is provided in authorizing legislation and is considered mandatory.
n.a. = not applicable.
a. The amount of budget authority for 2019 and 2020 in CBO’s baseline does not match the sum of the caps on funding plus adjustments to the caps. That occurs mostly because estimated reductions in mandatory budget authority stemming from provisions in appropriation acts for those years were credited as offsets to new discretionary budget authority in judging the acts’ compliance with the caps. In the baseline, those changes to mandatory budget authority appear in their normal mandatory accounts.
b. Some or all of the discretionary funding related to seven types of activities is not constrained by the caps; for most of those activities, the caps are adjusted to accommodate such funding, up to certain limits. Specifically, appropriations designated for overseas contingency operations and activities designated as emergency requirements are assumed to grow with inflation after 2020, and the caps are adjusted accordingly. For four other activities—disaster relief, wildfire suppression (for 2020 and 2021), activities related to the 2020 census (for this year only), and certain efforts to reduce overpayments in benefit programs—the extent to which the caps can be adjusted is subject to annual constraints, as specified in law. In addition, the 21st Century Cures Act (Public Law 114-255) requires that discretionary funding for certain authorized activities—up to amounts specified in law—be excluded from calculations of funding subject to the caps.

13
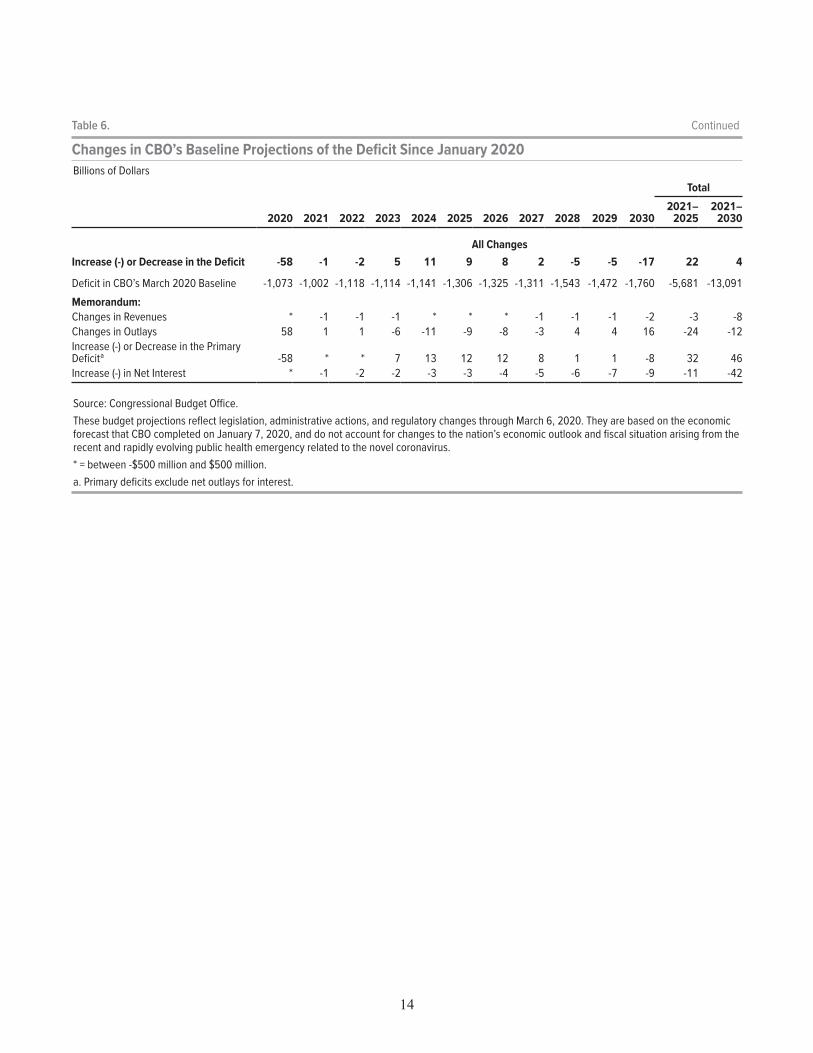
Table 6 .
Changes in CBO’s Baseline Projections of the Deficit Since January 2020Billions of Dollars
Total
2020 2021 2022 2023 2024 2025 2026 2027 2028 2029 20302021–
20252021–
2030
Deficit in CBO’s January 2020 Baseline -1,015 -1,000 -1,116 -1,119 -1,152 -1,315 -1,333 -1,313 -1,538 -1,466 -1,742 -5,702 -13,095
Legislative ChangesChanges in Revenues * * * * * * * * * * * 1 3
Changes in OutlaysMandatory outlays * * * * * * 0 0 0 0 0 * *
Discretionary outlaysDefense 0 0 0 0 0 0 0 0 0 0 0 0 0Nondefense 1 4 6 6 7 7 7 7 7 7 8 31 67
Subtotal, discretionary 1 4 6 6 7 7 7 7 7 7 8 31 67
Debt service * * * * 1 1 1 1 1 2 2 2 8Total Change in Outlays 1 5 6 7 7 7 8 8 9 9 9 33 76
Increase (-) in the Deficit From Legislative Changes -1 -5 -6 -7 -7 -7 -7 -8 -8 -9 -9 -31 -72
Technical ChangesChanges in Revenues * -1 -1 -1 -1 -1 -1 -1 -2 -2 -2 -4 -11
Changes in OutlaysMandatory outlays
Medicare -6 -9 -11 -14 -17 -17 -16 -15 -11 -14 -8 -68 -131Social Security -3 -5 -6 -8 -9 -9 -8 -7 -6 -5 -4 -37 -67Premium tax credits and related spending 1 2 4 4 3 4 5 6 9 10 13 17 60Veterans’ benefits and services -5 * 2 3 1 2 2 2 2 1 2 8 17Medicaid -1 -1 -1 -1 -1 -2 -2 -1 -1 -1 -1 -6 -12Student Loans 83 1 1 1 1 1 1 1 1 1 1 5 9Other -18 1 * -2 -3 -2 -4 -4 -6 -5 -7 -5 -32
Subtotal, Mandatory 51 -10 -11 -18 -24 -23 -23 -19 -12 -13 -3 -86 -156
Discretionary outlays 6 5 4 3 4 4 3 3 3 3 2 20 34
Net interest outlaysDebt service * -1 -1 -2 -3 -4 -4 -5 -5 -6 -6 -11 -38Other * 2 3 4 5 6 7 9 10 11 14 20 71
Subtotal, net interest * 1 1 2 2 2 3 4 4 5 7 9 34
Total Change in Outlays 57 -4 -5 -12 -18 -17 -16 -11 -5 -5 6 -57 -88
Increase (-) or Decrease in the Deficit From Technical Changes -57 4 4 11 18 16 16 10 3 3 -8 53 77
Continued
14
Total
2020 2021 2022 2023 2024 2025 2026 2027 2028 2029 20302021–
20252021–
2030
All ChangesIncrease (-) or Decrease in the Deficit -58 -1 -2 5 11 9 8 2 -5 -5 -17 22 4
Deficit in CBO’s March 2020 Baseline -1,073 -1,002 -1,118 -1,114 -1,141 -1,306 -1,325 -1,311 -1,543 -1,472 -1,760 -5,681 -13,091
Memorandum:Changes in Revenues * -1 -1 -1 * * * -1 -1 -1 -2 -3 -8Changes in Outlays 58 1 1 -6 -11 -9 -8 -3 4 4 16 -24 -12Increase (-) or Decrease in the Primary Deficit a -58 * * 7 13 12 12 8 1 1 -8 32 46Increase (-) in Net Interest * -1 -2 -2 -3 -3 -4 -5 -6 -7 -9 -11 -42
Source: Congressional Budget Office.These budget projections reflect legislation, administrative actions, and regulatory changes through March 6, 2020. They are based on the economic forecast that CBO completed on January 7, 2020, and do not account for changes to the nation’s economic outlook and fiscal situation arising from the recent and rapidly evolving public health emergency related to the novel coronavirus. * = between -$500 million and $500 million.a. Primary deficits exclude net outlays for interest.
Table 6. Continued
Changes in CBO’s Baseline Projections of the Deficit Since January 2020Billions of Dollars