baseline assessment of the nigerian pharmaceutical sector
TRANSCRIPT

BASELINE ASSESSMENT OF THE NIGERIAN PHARMACEUTICAL
SECTOR
2002
PUBLISHED BY
THE FEDERAL MINISTRY OF HEALTH
IN COLLABORATION WITH
THE WORLD HEALTH ORGANISATION

1
Table of contents
Acknowledgements ____________________________________________________ 3
List of abbreviations ___________________________________________________ 4
Executive summary ____________________________________________________ 5
Introduction __________________________________________________________ 8 Country profile _____________________________ Error! Bookmark not defined.
THE HEALTH OF NIGERIANS_________________________________________ 9
Under Five Morbidity and Mortality Rates _________________________________ 9
BASIC HEALTH INDICATORS ________________________________________ 10 Demographic Indicators __________________________________________ 10 Socio-economic Indicators _______________________________________ 10 Health Status Indicators __________________________________________ 10 Morbidity indicators _____________________________________________ 10 Mortality Indicators ______________________________________________ 10
Structure of the health system in Nigeria __________________________________ 10
DRUG SECTOR ORGANISATION______________________________________ 12 The National Drug Policy _________________________________________ 12 Essential Drugs List (EDL) ________________________________________ 12 Legislation _____________________________________________________ 13 Medicine financing ______________________________________________ 14 Pharmaceutical Research and Production ___________________________ 15 Rational Use of Medicines ________________________________________ 15 Human Resources _______________________________________________ 18
INTRODUCTION TO THE STUDY _____________________________________ 18 Study purpose and indicators _____________________________________ 18
STUDY DESIGN AND METHODOLOGY ________________________________ 20 Scope and limitations ____________________________________________ 20 Sampling procedure _____________________________________________ 20 Training of Data Collectors and pre-testing of Instruments _____________ 22 Data Collection__________________________________________________ 22 Analysis of Data_________________________________________________ 22 Problems experienced ___________________________________________ 23
RESULTS AND ANALYSIS ____________________________________________ 24
ACCESS ____________________________________________________________ 24 Availability of key drugs __________________________________________ 24 Expired drugs___________________________________________________ 25 Affordability ____________________________________________________ 26

2
Household Survey _______________________________________________ 27 QUALITY AND SAFETY ___________________________________________ 30 Rational use of drugs indicators ___________________________________ 31 Prescribing of Drugs _____________________________________________ 32 Patient Care ____________________________________________________ 33
INTERPRETATION OF RESULTS _____________________________________ 33 Access ________________________________________________________ 33 Quality and Safety _______________________________________________ 36 Rational Use of Drugs ____________________________________________ 36
CONCLUSIONS AND RECOMMENDED INTERVENTIONS _______________ 38 Access and Quality ______________________________________________ 38 Rational Use of Drugs ____________________________________________ 39
ANNEX 1 ___________________________________________________________ 40 Forms for Level I Indicators _______________________________________ 40
ANNEX 2 ____________________________________________________________ 0 Survey Forms for Level II Indicators _________________________________ 0

3
Acknowledgements We wish to thank the Federal Ministry of Health and indeed the Honourable Minister of Health for the opportunity to carry out this Baseline Assessment of the Pharmaceutical Sector. Special thanks go to Dr Mohamed Belhocine, the WHO Representative for Nigeria and the Director Food and Drug Services, Mr. R. K. Omotayo for their support. We wish to register our sincere appreciation to the World Health Organisation and in particular Helen Tata, (EDM Headquarters) and Ogori Taylor (EDM Nigeria country office) for the immense technical and financial support leading to the success of the study. Thanks also go to Simona Chorliet, Fola Tayo, Ambrose Isah, Godfrey Obiaga, Arin Joda, Oluwatosin Odufalu for their contributions in the realisation of this project. Special mention goes to the pharmacists in Food and Drug Services Department of the Federal Ministry of Health, Mrs. Eno A. Ubok-Udom, Mrs. G. A. Esiaba, Mrs. J. A. Ugwu, Mrs. A. O. Akinbisehin, Mr. E. O. Okibe, Mr. O. Oloyede, Mr. Linus Odemena, Mr. Tile, Mr. Hassan Ishaq, Mr. Joseph, and Mrs. M. A. Odaudu who collected data all over the country

4
List of abbreviations AIDS Acquired Immune Deficiency Syndrome
ARI Acute Respiratory Infection
BI Bamako Initiative
DRF Drug Revolving Fund
EDL Essential Drugs List
FMOH Federal Ministry of Health
FSP Family Support Program
GDP Gross Domestic Product
GMP Good Manufacturing Practice
HIV Human Immunodeficiency Virus
LGA Local Government Area
NAFDAC National Agency for Food and Drug Administration and Control
NDP National Drug Policy
NGO Non-Governmental Organisation
NHIS National Health Insurance Scheme
NIPRD National Institute for Pharmaceutical Research and Development
NSAIDs Non-steroidal Anti-inflammatory drugs
ORS Oral Rehydration Salts
ORT Oral Rehydration Therapy
PCN Pharmacists Council of Nigeria
PHC Primary Health Care
PPMVL Patent and Proprietary Medicine Vendors’ License
PTF Petroleum Trust Fund
STG Standard Treatment Guidelines
USD United States Dollar
WB World Bank
WBAEDP World Bank Assisted Essential Drugs Program
WHO World Health Organisation

5
Executive summary The first National Drug Policy was published in 1990. The objectives of the
policy were set out to make available at all times, medicines which are
effective, affordable, safe and of good quality in all sectors of the health care
system; and to improve the quality of health care through the rational use of
medicines. The extent to which the policy objectives have been met is yet to be
evaluated. The policy is currently under review. This study is, therefore timely
because it not only provides a baseline assessment of the current
pharmaceutical situation in the country, but also helps to identify possible
strengths and weaknesses in the sector and thus, contribute to the on-going
review process.
The structures and processes in the pharmaceutical sector were assessed
using structured questionnaires. In addition, 36 health care facilities at the
primary and secondary levels representing the 6 geopolitical zones of the
country were randomly sampled using a multistage sampling technique.
Results show that although a good number of structures and processes have
been put in place for effective delivery of pharmaceutical services, some
important gaps still exist. These include unspecified budgetary allocation for
drugs, absence of fair financing mechanism for medicines, no legislation
empowering generic prescription and substitution, high taxes on essential
medicines, no drug donation guidelines, no national standard treatment
guidelines, absence of well structured drug information services, little or no
public education on rational use of drugs and inadequate human resources in
the public sector
Assessment of facilities showed inadequate record keeping especially at the
primary health care (PHC) level. Forty-six percent (46%) of key medicines were
available at public health facilities. However, 7% of these medicines had
expired. By comparison, no expired medicines were found on the shelves of
private drug outlets. Measurement of affordability showed that to purchase co-
trimoxazole and penicillin to treat uncomplicated pneumonia in a child, without
hospitalisation, a worker receiving the lowest government wage would have to
work for 3 hours and 6 hours, respectively.

6
Thirty eight percent (38%) of health facilities had Standard Treatment
Guidelines (STGs) and 24%, the Essential Drugs List (EDL). More than 90% of
prescribed drugs were listed in the EDL. However, with respect to
appropriateness of prescriptions for specific diseases, only 2% of prescriptions
for diarrhoea, 10% for acute respiratory tract infections and 21% for mild to
moderate pneumonia were adjudged to be appropriate.
It was also observed that while drug storage was satisfactory in state-owned
facilities and warehouses, it was poor in PHC facilities.
Rational drug use indicators showed that the average number of drugs per
prescription was 4.7. 59% of patients were prescribed antibiotics and 55% were
prescribed injections. More than 90% of prescribed drugs were listed in the
EDL. Furthermore, with respect to appropriateness of prescriptions for specific
diseases, only 2% of prescriptions for diarrhoea, 10% for acute respiratory tract
infections and 21% for mild to moderate pneumonia were adjudged to be
appropriate.
The household survey showed that medical consultations were sought mainly in
public health facilities (38%), drug stores (23%) and private health facilities
(16%). Results showed a higher private sector utilisation rate (62%) than the
public sector (38%).
Twenty three percent (23%) of the average weekly expenditure of respondents
went into the treatment of an episode of illness in a member of their household.
Most of the respondents (89%) purchased all prescribed medicines. The main
reasons given for non-purchase were financial incapability (36%) and
unavailability of medicine in public pharmacy (28%).
The results underscored the need to re-engineer the system for better efficiency
in the use of scarce resources. Some of the recommendations made towards
improving the pharmaceutical sector included the following: improved

7
procurement practices, better drug management especially at the PHC levels,
better distribution of the EDL, establishment of structures and processes that
would enhance rational use of medicines, better regulation of the activities of
the private medicine providers, and building capacity in drug use and
management. Implementing these recommendations would ensure that good
quality, safe, and efficacious medicines which are used rationally are made
available to the Nigerian populace.

8
Nigeria: Country Profile
Nigeria, located on the West Coast of Africa, has a landmass of 923,678 square
kilometres and a population density of 128 per square kilometre. The country is
divided into six geo-political zones, 36 States and a Federal Capital Territory.
The states are further divided into 774 Local Government Areas (LGAs).
The Six Geo-Political Zones
Figure 1
10
Kebbi
5
MINNA
Kogi
Kaduna
KatsinaKatsina
KanoKanoKano5
1111
Akwa IbomBayelsa
ImoDelta
Oyo
Rivers
Abia Cross River
Anambra
Kano
Kaduna
Kebbi
NIGERIA GEO-POLITICAL ZONES
BauchiZONES
South East Zone
North East ZoneNorth Central Zone
South West Zone
North West Zone
South South Zone
Enugu
Kwara
OndoEdo
Ogun
Kogi
Nasarawa
Zamfara
Ebonyi
Plateau
KatsinaJigawa Yobe
Adamawa
Benue
Borno
Ekiti
FCT
Gombe
Lagos
Niger
Osun
Sokoto
Taraba

9
THE HEALTH STATUS OF NIGERIANS
Over three decades of political instability and concomitant economic
mismanagement have contributed to the poor health and socio-economic
indicators in the country. The productive sector and social infrastructure have
also deteriorated remarkably.
Although time-series demographic data are relatively lacking in Nigeria, there is
overwhelming evidence that the key health indicators have either stagnated or
worsened since the 80’s.
Under-Five Morbidity and Mortality Rates Cause Infant
morbidity rate
Under-five morbidity rate
Infant Mortality rate
Under-five Mortality Rate
Malaria 38% 30% 27% 41%
Diarrhoea 27% 22% 24% 24%
Acute Respiratory Infections 15% 19% 22% 15%
Vaccine Preventable Diseases 17% 16% 10% 15%
Others 3% 3% 5% 8%
The major causes of morbidity and mortality in under-five children in Nigeria are
virtually the same as those responsible for ill health and death in infants.
Malaria, diarrhoeal diseases, vaccine preventable diseases, and acute
respiratory infections are responsible for about 95% of morbidity and almost
90% of mortality in under – five children.
Other basic health indicators are shown in the table below.

10
BASIC HEALTH INDICATORS1
INDICATORS VALUE Demographic Indicators Total population (2001) 116,928,000 Annual growth rate 2.8% Urban population 44% Percentage population aged 60+ years 4.8 Life expectancy at birth 51.6 years Healthy life expectancy 41.6 years Economic dependency 259/100 workers Socio-economic Indicators GDP per capita 853 Annual growth of the GDP (US$) 3.5% Total expenditure on health as a percentage of the GDP (2000) 2.2 Private expenditure on health as % of total expenditure on health (2000) 79.2 Percentage of population using private sector health provision 65 General government expenditure on health as a percentage of total expenditure on health (2000)
20.8
General government expenditure on health as a percentage of total general government expenditure (2000)
3
External resources for health as a percentage of general government expenditure on health (2000)
32.2
Social security expenditure on health as a percentage of general government expenditure on health (2000)
0
Out–of–pocket expenditure as a % of total expenditure on health (2000) 79.2 Per capita expenditure on health in US$ (2000) 20 Population below poverty line (1993) 34.1% Health Status Indicators
Infant mortality/10,000 (2000) 79 Maternal mortality /100,000 (2000) 700 Probability of dying before 5 /1000 130 Morbidity indicators Estimated number of HIV infected adults 2,600,000 Incidence of malaria 31,685 Incidence of tuberculosis 25,821 Mortality Indicators Estimated AIDS deaths 250,000 Bloody diarrhoea deaths 714
Structure of the Health System in Nigeria
All three tiers of government – Federal, State and Local – share responsibilities
for providing health services and programmes in Nigeria. The Federal
1 The World Health Report 2002
11
Government is largely responsible for providing policy guidance, planning and
technical assistance, coordinating state-level implementation of the National
Health Policy and establishing health management information systems. In
addition, the Federal government is responsible for disease surveillance, drug
regulation, vaccine management and training health professionals. The Federal
Government is also responsible for the management of teaching, psychiatric
and orthopaedic hospitals and also runs some medical centres.
The responsibility for management of health facilities and programmes is
shared by the State Ministries of Health, State Hospital Management Boards,
and the Local Government Areas (LGAs). The states operate the secondary
health facilities (general hospitals) and in some cases tertiary hospitals, as well
as some primary health care facilities. The training of nurses, midwives, health
technicians and the provision of technical assistance to local government health
programs and facilities are also the responsibility of the state authorities.
The 774 local governments oversee the operations of primary health care
facilities within their geographic areas. This includes the provision of basic
health services, community health hygiene and sanitation.
The inadequacy of the public health system has given increasing prominence to
the private health sector, (profit and non-profit) as well as to traditional and
spiritual healers.

12
DRUG SECTOR ORGANISATION The National Drug Policy The National Drug Policy was first published in 1990 with the main goals of
making available at all times and in all sectors of the health care system,
adequate supplies of drugs which are effective, affordable, safe and of good
quality. The policy also aimed at improving the quality of health care through
the rational use of drugs.
After about 13 years, the policy appears to have made little impact on the
pharmaceutical sector due largely to the absence of an implementation plan,
budget and timelines. These would have paved the way for a systematic
translation of the policy into tangible improvements in the sector. Absence of
monitoring and evaluation may also have contributed to the poor results
recorded.
However, the policy is in the process of being revised. Efforts are being made to
improve on the formulation process and to include an implementation plan.
Wide dissemination of the revised document is planned in order to enlist the
support and commitment of stakeholders and to also ensure systematic
implementation of the policy.
One of the strategies employed, to ensure successful implementation and
sustainability of the revised policy, is to include aspects of the policy in the
curriculum of pharmacy and medical schools. The capacity of trainers at both
undergraduate and graduate levels also needs to be strengthened.
A national policy on traditional medicines has also been formulated as a
separate document and awaits adoption.
Essential Drugs List (EDL)
The EDL, which applies only to the public sector, has been increased from 204
entries when it was first published in 1986 to 484 in the last edition, which was
published in 1996. The list is also undergoing a revision. Although the EDL

13
includes drugs for the primary health care level, the list for this level of care is
published as a separate document. While some states have adapted the
national EDL to their local needs, others use the national EDL as is.
Procurement in public health facilities and the National Health Insurance
Scheme is limited to medicines listed in the EDL.
Legislation
The regulation of the pharmaceutical sector is vested in the National Agency for
Food and Drugs Administration and Control (NAFDAC) and the Pharmacists’
Council of Nigeria (PCN). In broad terms, the NAFDAC regulates
pharmaceutical products while the PCN regulates the premises and
professional practice. Therefore, drug registration, marketing approval,
manufacturing, importation, drug promotion and advertising are controlled by
NAFDAC while licensing and practice of pharmacy and pharmaceutical
premises are the purview of the PCN, according to promulgated laws. The
effective regulation of traditional medicines remains a challenge for the
pharmaceutical sector.
NAFDAC issues marketing approval for pharmaceuticals sold in the country
after evaluation of safety, efficacy and proof of manufacturing and use in
country of origin; in accordance with WHO certification scheme on the Quality of
Pharmaceutical Products Moving in International Commerce. To date, there are
about 4,363 registered medicines in the country. In 2002, NAFDAC commenced
listing of traditional medicines with proof of safety. About 83 have so far been
listed. In 2002, WHO supported the computerisation of drug registration in
NAFDAC to improve the process.
NAFDAC also carries out regular inspection of drug manufacturing premises to
ensure compliance with Good Manufacturing Practices (GMP) and regularly
publishes the list of registered drugs in the official gazette.
NAFDAC also has the responsibility of regulating promotion and advertisement
of medicines. The contents of advertisements and promotional materials, as

14
well as package inserts are pre-approved by NAFDAC. There is explicit
prohibition of the promotion of prescription medicines in the country.
Although there is no legislation requiring generic prescriptions, dispensers are
allowed to substitute generic drugs in the public sector. There is also no pricing
policy for pharmaceuticals but there is a 5% tax on pharmaceutical raw
materials, and taxes ranging from 20 to 25% for finished pharmaceutical
products.
Monitoring of the adverse effects of both orthodox and traditional medicines is
not institutionalised but NAFDAC does collect some information on adverse
drug reactions.
To control the quality of medicines, NAFDAC has national laboratories and may
also use the services of laboratories in academic institutions.
Medicine financing
Data is not currently available on total expenditure as well as public expenditure
on medicines. However, a national health account is being created that would
help in disaggregating data on health expenditure. The Federal Ministry of
Health usually budgets for health services while individual health institutions at
the secondary and tertiary levels spend on medicines at the discretion of the
head of the individual institutions. At the PHC level, the local government
authorities budget for medicines.
In most states of the federation, patients pay for their medicines through drug
revolving fund schemes. However, very few states for example Osun State
provide free medicines to the populace. Some others, for example Lagos State,
provide free medicines only for under-fives, pregnant women and for some
priority diseases such as tuberculosis and malaria.
Health facilities charge only registration fees to patients. Revenue accruing from
fees or drug sales are not meant to be used to pay salaries but are occasionally
used for such purposes. Most drug revolving funds have failed because of the
use of the funds to meet other needs in the health facility.

15
A National Health Insurance Scheme (NHIS) has recently been launched in the
country. It is primarily a scheme for workers in establishments with more than
10 employees. Workers outside of this category are expected to take voluntary
health insurance. Otherwise, medicine financing is generally out-of-pocket.
Drug donations are usually received for tuberculosis and during emergencies.
The value of such medicines is not quantified. There are also no national
guidelines on drug donations.
Pharmaceutical Research and Production
The pharmaceutical industry in Nigeria is fairly well developed in comparison to
most of the other developing countries in Sub-Saharan Africa. There are about
200 local manufacturers. Most were affiliated with multinational companies but
over the years, due to the poor economic climate, some of them have divested
and are now wholly indigenous. The majority of these industries are privately
owned; only five are owned by the federal or state governments or their
agencies. An accurate figure of the total sales volume of the pharmaceutical
industries is not available; but it is estimated that this may fall in the region of
about 350 million USD per annum.
These companies generally repackage medicines and/or produce
pharmaceutical products from imported raw materials. The government has
plans to develop the petrochemical industry and exploit the vast herbs and
mineral deposits for developing pharmaceutical raw materials.
Apart from the research done in universities, the National Institute for
Pharmaceutical Research and Development (NIPRD) and the National Institute
for Medical Research (NIMR) are also involved in drug research and
development.
Rational Use of Medicines
To guide the use of medicines, there are standard treatment guidelines known
as Standing Orders which are applicable at the PHC level only. There is also a
National Drug Formulary published in 1994. Plans are underway to update the

16
formulary and develop standard treatment guidelines for all levels of the health
care system.
The concept of rational use of medicines forms part of the basic training
curricula of medical and pharmacy schools and both have mandatory continuing
education, which includes rational use of medicines.
Some universities, non-governmental organizations (NGOs), secondary and
tertiary health facilities have developed drug information centres for the
provision of drug information mainly to health professions. These centres use
basic textbooks to provide drug information and some publish drug bulletins.
NAFDAC provides drug information to consumers. The main challenge is the
sustainability of these services and capacity to provide accurate and current
information to clients.
Although there is a high level of self-medication and uncontrolled sale and use
of medicines, especially antibiotics and injections, there has been little or no
public education on rational use of medicines.
The practice is that nurses or community health workers prescribe and dispense
drugs in most primary health care facilities; but drug prescribing in secondary
and tertiary health facilities is the exclusive preserve of doctors.
In the 60s, due to the inadequate number of pharmacists, Patent and
Proprietary Medicine Vendor’s Licenses (PPMVL) were issued to designated
categories of persons which authorised such persons to sell mainly over–the–
counter drugs. Generally, there has been an improvement in access to
medicines in rural areas due to the large number of medicine sellers;
unfortunately, a large proportion of these are not licensed vendors. Worse still,
they have gone beyond their mandate by stocking and selling prescription and
controlled medicines.
Although prescription drugs, which include antibiotics and injections, are not to
be sold over-the-counter, they are freely available in the informal private sector

17
(from drug hawkers, vendors and stores). Thus, the challenge is to ensure a
rational distribution of medicines.

18
Human Resources Total Number of Prescribers:
30,885 medical practitioners were registered in 2000 while the total number of
registered dental practitioners for the same period was 2,221. Thus, the total
numbers of persons authorised to prescribe drugs, consisting of both medical
and dental practitioners in the year 2000 was 33,106. The estimated total for
2002 was 36,000.
Total Number of Dispensers
According to the Registered Council Data on Health Manpower the number of
pharmacists in the year 2001 was 9,308 of which 6,412 were registered. Thus,
the patient- pharmacist ratio was 10,743 to 1 based on an estimated population
of 100 million in the year 2001. Data obtained from 22 out of the 36 states
indicated that there are 864 pharmacy technicians and 224 pharmacy assistants
working in the public sector.
Total Number of Drug Outlets
The total number of wholesalers in the country is 12,022; out of which about half
(6,753) are registered with the Pharmacists Council of Nigeria. No data is
available on outlets in both public and private sectors. However, the total
number of private pharmacies is 4,825 out of which 2,808 are registered with
the Pharmacists Council of Nigeria.
INTRODUCTION TO THE STUDY
Study purpose and indicators Since the first National Drug Policy, whose goal was to improve access to
essential drugs, was published in 1990, the extent of its implementation has
never been evaluated. This policy is currently under review and therefore, a
pharmaceutical assessment would not only serve as a baseline but also help to
identify possible strengths and weaknesses in the sector so as to influence the
review process.
This survey is also expected to help identify priority areas for evidence-based
interventions. It would also form the basis for future evaluations of technical

19
input into the pharmaceutical sector, and provide much-needed information on
the Nigerian pharmaceutical sector.
The study was carried out using Level I and Level II indicators for monitoring the
pharmaceutical sector2. Level I indicators which assess the existing
infrastructure and key processes of the pharmaceutical sector were collected
before the field study, using a structured questionnaire (annex 1). Level II
indicators which focus on the degree of access and rational use of quality drugs
was the object of this survey (annex 2). The indicators measured are as
follows:
Access Percentage availability of key drugs
Average stock-out duration
Affordability of drugs used for treatment of uncomplicated pneumonia in
children
Rational Use Average number of drugs prescribed
Percentage of patients prescribed antibiotics
Percentage of patients prescribed injections
Percentage of prescribed drugs included in the EDL
Percentage of drugs adequately labelled
Percentage of patients who have adequate knowledge of how to take their
medicines
Percentage of facilities with STG
Percentage of facilities with EDL
Percentage of appropriate diarrhoea prescriptions
Percentage of appropriate non – ARI prescriptions
Percentage of appropriate prescriptions for mild/moderate pneumonia
Quality Adequacy of storage
Percentage of expired drugs
2 WHO Operational Package for Monitoring and Assessing Country Pharmaceutical Situations.

20
Household Survey
Source of consultation
Source of medication prescribed
Barriers to acquisition of prescribed medicines
Proportion of weekly income spent on medicines for one illness episode.
Labelling Requirements Name of the drug
Strength
Dosage form
Name of patient
Dosing regimen
Duration of treatment
STUDY DESIGN AND METHODOLOGY
This was a cross sectional study of the pharmaceutical sector in Nigeria.
Scope and limitations The study was not intended to give a detailed analysis of the pharmaceutical
sector but provide a picture of the national pharmaceutical situation in the
country to help in policy analysis and in the design of appropriate interventions.
Sampling procedure Nigeria has 36 states and a Federal capital territory. These states are grouped
into six geopolitical zones with five to seven states in each. From each of the
geo-political zones of the country, one state was randomly sampled. In the
sampled state, the state hospital (secondary health care facility) and the state
central medical stores were selected for study. Thereafter, ten primary health
care facilities, which represent the lowest level of care and are usually manned
by a community health worker or a nurse, were selected by systematic random
sampling at the FMOH and listed for the data collectors. The data collectors
were instructed to visit health facilities in the order listed. When they completed
work in a health facility, they went on to any private pharmacies/drug outlets
within five kilometres (km) of the primary health care facility. From the city

21
centre, consecutive households or persons found in the vicinity of these
households were interviewed to ascertain whether they were household
members who had been ill in the preceding 2 weeks.
Below is a list of the sampled states and health facilities visited. Oyo State was
originally selected in the south-west zone but was substituted with Osun State
due to an ongoing industrial action by local government workers in the state at
the time of the study.
The study was limited to government health facilities.
List and Location of Health Facilities Visited
ZONE STATES Health Facilities Type of Facility
South-East Enugu 1. Inyi PHC 2. Ibeagwa Aka Health Centre 3. Aku Health Centre 4. Oji River Health Centre 5. Abakpa Nike Health Centre 6. Park Lane Hospital Enugu
PHC PHC PHC PHC PHC Secondary
South-West Osun 1. Moro PHC Ife 2. Apomu Health Centre Isokan 3. Ayedaade PHC, Ikire 4. Oja-Timi PHC Ede 5. Okebaale PHC 6. Osun State Hospital, Oshogbo
PHC PHC PHC PHC PHC Secondary
South-
South
Edo 1. PHC Agenebode 2. PHC Ikhideu 3. PHC Igara 4. PHC Abudu 5. Central Hospital Benin City
PHC PHC PHC PHC Secondary
North-East Yobe 1. Clinic Geidam 2. Dagirari Dispensary Nguru 3. Koriyel Dispensary 4. Kayeri Health Clinic 5. Gwoi Kura Clinic 6. General Hospital Damaturu
PHC PHC PHC PHC PHC Secondary
North-West Kebbi 1. Etene Dispensary 2. Zamare Dispensary 3. Nasarawa MCH, Birin Kebbi 4. Birin Yari PHC, Jega LGA 5. Mungadi Dispensary, Maiyama 6. General Hospital (Sir Yahaya
Memorial) Birin Kebbi
PHC PHC PHC PHC PHC Secondary
North-
Central
Kwara 1. PHC Abogunnugu 2. PHC Orolodo Omu-Aran 3. District Health Unit, Lafiagi
PHC PHC PHC

22
4. Health Centre Olufadi 5. Specialist Hospital, Ilorin
PHC Secondary
Training of Data Collectors and Pre-testing of Instruments
Training of 12 investigators was followed by practical sessions including field
visits to three health facilities in Abuja. After introducing the participants to
monitoring, survey methods and instruments, they were divided into three
groups to pre-test the monitoring tools in the selected health facilities and some
households around the environs of the health facilities. The results were
collated and problems encountered in the field were discussed and solutions
proffered by the participants. States to be studied were then randomly sampled
and allocated to the data collectors.
Data Collection
The 12 trained investigators (two for each of the six geo-political zones) set off
for the field survey with a letter for the head of each identified facility. The
introductory letters explained the objective of the study. In the absence of data
and/or patients in any selected facility, they were instructed to move on to the
next facility on their list.
The data collectors filled in data from records obtained in the respective health
facilities or interviewed health workers and patients as the case may be. They
administered the household questionnaires to respondents.
Data was collected simultaneously in all zones. However, gaps in data
collection necessitated an immediate return to the field in Edo, Osun and Yobe
States.
Analysis of Data Data was collected in the field using the WHO Level II indicators and was
entered into summary forms and manually computed. The data was presented
using descriptive statistics (means, values, percentages).

23
Problems experienced
1. Some of the sampled health facilities were not in use. This necessitated
either going on to the next facility or surveying one not earlier sampled.
2. Lack of records (stock cards) constituted a problem in the collection of data
on stock out duration.
3. Patient records were lacking in some facilities. In these facilities, patients
were furnished with notebooks, which served as case files and prescription
sheets. Prescriptions were thus not kept in health facilities but recorded in
the books each time the patient visited the facility. Consequently, some data
on rational use was not available.
4. Generally, clinic attendance in primary health care facilities was very low
(about 3 persons per day). Patient interviews were not possible in many
facilities.
5. Due to long periods of stock out, cost of medicines was also difficult to
obtain. Generally, the cost of the medicines, the last time they were
available, was recorded.
6. It was difficult to find single diagnosis of diarrhoea in case notes. This is
because diarrhoea is considered a symptom of malaria especially in children
resulting in the addition of antimalarials to diarrhoea prescriptions.
7. Access to homes was a problem and this necessitated interviewing patients
found in the vicinity of households
8. Respondents could not easily remember their weekly expenditure. Farmers
could not, for instance, calculate the cost of farm proceeds, which they
obtained free of charge.
9. Respondents could not remember the individual cost of drugs and so the
total cost spent on all medicines was recorded
10. The household form did not include the category of drug sellers. In Nigeria,
there are patent medicine stores that are licensed by the government to sell
certain categories of medicines. These are different from local stores that
sell general provisions. The data collectors, therefore, substituted local store
with drug seller.

24
RESULTS AND ANALYSIS ACCESS
Availability of key drugs In public health facilities, 46% of the basket of 12 key drugs was available while
58% of the basket of drugs was available at the public sector warehouse.
A detailed analysis showed that about 80% of health care facilities had
paracetamol, cotrimoxazole, and folic acid while amoxicillin, benzyl salicylic acid
and vitamin A were stocked in less than 18% of the health care facilities. Oral
Rehydration Salts (ORS) was available in only 29% of health care facilities. The
low availability of ORS in the health care facilities could be attributed to the
availability of a substitute - home made salt and sugar preparation that is
prescribed in the health centres and promoted nationwide.
Considering the prevalence of malaria, it would have been expected that
antimalarials would be available in all health care facilities. However, only two-
thirds of the health care facilities had either chloroquine and/or
sulphadoxine/pyrimethamine.
% OF FACILITIES WITH KEY DRUGS
29
79
68
59
77
2932
29
15
82
1518
0
10
20
30
40
50
60
70
80
90
OR
S
Cotrim
oxazole
Chloroquine/SP
Iron tablets
Folic Acid
Mebendazole
Chloram
phenicoleye oint./drops
Iodine
Benzoic/salicylic
acid oint
Paracetamol
Am
oxicillin
Vit A
% O
F FA
CIL
ITIE
S

25
Stock out duration could not be measured in 15 out of 35 health facilities, as
records were not kept. Only two secondary health facilities had an average
stock out period of less than 30 days while the rest had long stock out periods
ranging from two months to more than one year.
In about 18 out of 28 PHC facilities, the health workers disclosed that they had
not received drugs in the past two years and admitted purchasing small stocks
of medicines from patent medicine stores (drug sellers) for the few patients that
visited their health facilities. The situation was different at the secondary health
facilities as stock cards were available and drug supply was regular either from
the state medical stores or established purchasing mechanisms of the health
facility
Expired drugs
Seven percent of the basket of key drugs on health facility shelves were
expired. It was also observed that there were large quantities of expired drugs
VARIABILITY OF STOCKOUT DURATION IN PUBLIC HEALTH FACILITIES
01 1
9 9
15
0
2
4
6
8
10
12
14
16
0 1 to 30 31 - 60 61 - 180 > 180 NO RECORDS
Duration of stockout (days)
Num
ber o
f fac
ilitie
s

26
in the stores; indicating either poor drug management or inadequate drug
disposal procedures. However, no expired drugs were found on the shelves in
the private sector.
Affordability
The lowest paid government worker earns 11.3 USD weekly. Therefore, to
purchase cotrimoxazole, the cheapest drug for the treatment of uncomplicated
pneumonia without hospitalisation from the private and public sectors,
respectively this worker would work for 2 and 3 hours. Since results show a
preference for penicillin (58%) to cotrimoxazole (45%) in the treatment of
pneumonia, a worker would be expected to part with 6 hours’ wage for
treatment of a child who has been prescribed penicillin in both public and
private sector facilities.
N U M B E R O F H O U R S O F W O R K T O T R E A T U N C O M P L IC A T E D P N E U M O N IA IN A C H IL D
5 .6
3 .53 .2
5 .6
6 .4
1 .8
0
1
2
3
4
5
6
7
P E N IC IL L IN A M O X Y C IL L IN C O T R IM O X A Z O L E
NU
MB
ER O
F H
OU
RS
P U B L IC H E A L T H F A C IL IT YP R IV A T E D R U G S T O R E

27
Household Survey
Majority of persons who reported illness in households were males (55%). Their
ages ranged mainly between 1- 5 years (23%) and 16 – 54 years (49%). Most
of the respondents reported having had fever while fewer persons complained
of cough and diarrhoea.
Symptoms Reported Symptoms % of persons Diarrhoea 10.4 Cough 24.6 Fever 59.7 Others 46.4
Sources of Consultation % of respondents Care provider
Public Private Others Traditional healer 6 Public health clinic/hospital 38 0 Private health clinic/hospital 16 Private pharmacy 7 Drug store 23 Friends/neighbours/family 0 2 Bought medicine without consultation 0 5 Used medicine left over from another illness 0 1 Did nothing 0 2 Total 38 52 12
The most important sources of consultation are the public health
centre/hospital, the drug store and the private health centre/hospital as shown
in the table above. Results show a higher utilisation of the private sector than
the public sector.
A G E O F IL L P E R S O N S
2 %2 2 %
2 3 %4 7 %
6 %
U n d e r 11 – 56 – 1 51 6 – 5 45 5 a n d o ld e r

28
Sources of Drugs Utilised % of respondents Drug provider
Public Private Others
Traditional healer 5 Public health clinic/hospital 35 0 Private health clinic/hospital 17 Pharmacist 8 Drug seller 25 Advice from friend/neighbour/family 1 Bought medicine without consultation 0 6 Used Medicine from another illness 0 2 Did nothing 0 3 Total 35 56 11 Patients generally obtained their medicines where they sought consultation and
a majority indicated purchasing their medicines from the private sector.
Drugs Purchased after Consultation Level of purchase of medications % of respondents All 89 Some 9 None 2
Most of the respondents (89%) obtained all their prescribed medicines after
consultations. However majority of those who did not, attributed it to financial
incapability (36%) and unavailability of medicine in public pharmacy (28%).

29
Reasons Given for Not Purchasing All Medicines Price was too high 1 Did not have enough money 4 Not able to borrow enough money 0 Too many medicines were needed 0 Did not believe all the medicines were needed 0 Started to feel better 0 No time to get all the medicines 0 Traditional healer did not have all the medicines 0 Public pharmacy did not have all the medicines 5 Private pharmacy did not have all the medicines 0 Drug seller did not have all the medicines 0 Already had some of the medicines at home 2 Other 0
The average expenditure on medicines for the treatment of an episode of illness
was 4.42 USD; the average total weekly expenditure was estimated at 19.3
USD. This means that 23% of household expenditure is spent to treat an
episode of illness not requiring hospitalisation.
Expenditure on medicines Average cost of medicines in Naira 760 Average cost of medicines in USD 4.42 Average income/expenditure in Naira 2456 Average income/expenditure in USD 19.26 Expenditure/Income 23%

30
QUALITY AND SAFETY Storage
Thirteen (13) out of 34 public health facilities had poor storage facilities. Most
drug stores in public health facilities had moderately adequate storage facilities
with a rating of 6 to 7 out of 12. Generally, warehouses were found to have
better storage facilities as 4 out of 6 of them had adequate storage shown by a
rating of 8 to 10 out of 12.
VARIABILITY IN DRUG STORAGE RATING IN PUBLIC HEALTH FACILITIES AND WAREHOUSE
0
10
20
30
40
50
60
70
0 to 3 4 to 6 6 to 7 8 to 10 > 11RATING
PER
CEN
TGE
OF
STO
RES
HEALTH FACILITY
WAREHOUSE

31
RATIONAL USE
Rational use of drugs indicators The average number of drugs prescribed was 4.7. Use of antibiotics was
uniformly high with a national average of 59% of patients receiving at least one
antibiotic. Thirty-eight percent (38%) of patients received injections. In all the
zones, over 90% of prescribed drugs were listed in the EDL. However, it was
observed that only 27% of facilities had copies of the EDL. It was also noted
that no facility in the South East zone had any EDL.
Treatment guidelines were found in 38% of health facilities. These included
Standing Orders for Community Extension Workers as well as treatment
guidelines for specific diseases (diarrhoea, STDs) or specific medicines such as
chloroquine. No facility in the South South zone had any type of standard
treatment guidelines.
RATIONAL USE OF DRUG INDICATORS
5559
97
27
38
0
20
40
60
80
100
120
% of patientsreceivinginjections
% of patientsreceiving
antibiotics
% of drug on EDL % of facilities withEDL
% with STG

32
Prescribing of Drugs
Diagnosis % Prescribing of Diarrhoea Pneumonia Non-pneumonia ARI
ORS/ORT 54 - - Antibiotics 62 - 91 Antidiarrhoeals 35 - - Antispasmodics 9 - - Penicillin - 46 - Amoxicillin - 6 - Cotrimoxazole - 45 - Other drugs 76 60 65
% Prescribing Diagnosis Appropriate Doubtful Inappropriate
Diarrhoea 6 - 94 Pneumonia 39 18 43 Non-pneumonia ARI 11 - 89
Diarrhoea Although single prescriptions of diarrhoea were difficult to find due to the
recognition of diarrhoea as a symptom of malaria in children, 298 single
prescriptions of diarrhoea out of 340 were obtained.
ORS was prescribed in 54% of non-bacterial diarrhoea. Antibiotics were
prescribed in 62%, antidiarrhoeal drugs in 35% and other drugs in 76% of
prescriptions. Only 6% of prescriptions for diarrhoea were adjudged appropriate
- due to having only ORS/ORT with no antibiotics, antidiarrhoeal or other drugs.
Acute Respiratory Tract Infection (ARI) Only 11% of prescriptions for ARI were judged to be appropriate as these were
prescribed without antibiotics while 60% of the prescriptions included other
medicines.
Pneumonia It was also difficult to find pneumonia cases at the PHC level in some zones as
the policy in such states is to refer all suspected pneumonia cases to secondary
health care levels. 222 out of the targeted 340 prescriptions were obtained. Out
of 34 facilities, no pneumonia prescriptions could be obtained in 10 facilities.
33
Pneumonia was considered appropriately treated if the prescription consisted
only of penicillin, amoxicillin or cotrimoxazole with an antipyretic/analgesic.
Inclusion of more than one antibiotic was considered inappropriate while
inclusion of other types of antibiotics was considered doubtful. Only 21% of
pneumonia prescriptions were judged appropriate, 17% were doubtful while
62% were inappropriate.
Patient Care It was not possible to gather data on patient care indicators as clinic attendance
was very low in 23 out of 34 health facilities. Some primary health care facilities
had a maximum attendance rate of only three patients per day. Some other
facilities were closed and health workers had to be brought from their homes or
market places to allow data collectors interview them. However, attendance rate
at the secondary health facilities was quite high and enough patients were
interviewed. An exception was the South West zone where the state
government offered free medical treatment to the populace and so attendance
at the PHC level was high.
INTERPRETATION OF RESULTS
Access
The poor performance of the Nigerian pharmaceutical sector which is
characterised by poor access indicators may be attributed to a myriad of factors
summarised in the crises of governance and leadership that has been
characteristic of the country for more than two decades. The social sectors
were not a priority for the country during military rule resulting in a marked
reduction in the allocation of funds to the health sector. The lack of
accountability of the military administrators and unplanned interventions
implemented by ad- hoc bodies exacerbated the decay in infrastructure and
services.
Other fundamental structural problems such as imprecise demarcation of
functions among the three tiers of government, duplication of roles among
government departments and agencies, corruption, fragmentation of the health
system, poorly motivated health manpower are a few of the reasons for poor

34
quality health care delivery. Since the return of the country to democratic
governance in 1999, health sector reforms have been widely advocated.
Drug supply to public health facilities has evolved over the years. In the colonial
and early pre-independence years, drugs were supplied by the Crown Agents
of the United Kingdom and distributed from a central store to government
hospitals. When the country was administered in regions and at independence,
stores were established in the three regions and the emerging indigenous
wholesale pharmaceutical companies serviced retail outlets. Drug supply was
steady and stores were usually well stocked. However, in 1984 import licences
for drugs were issued to all and sundry resulting in uncontrolled importation of
poor quality drugs and chaotic drug supply. Out-of-stock public stores led to the
proliferation of drug stores in the private sector.
To improve drug supply, the World Bank provided support under the World
Bank Assisted Essential Drug Program (WBAEDP), by providing funds for the
bulk purchase of drugs. It also provided technical support for such elements as
selection, quantification, and international procurement procedures. The
scheme was stalled by problems such as delayed port clearing from and poor
facilities for distribution of drugs from the central stores. In addition,
bureaucratic bottlenecks which delayed release of funds by the WB also
resulted in long delays in supply.
In 1997, the government attempted to fund drug supply through the Petroleum
Trust Fund (PTF). PTF assisted in establishing Drug Revolving Funds for
tertiary (federal) and secondary (state) institutions, as well as primary health
care centres in the country. This otherwise laudable exercise further frustrated
the drug situation because of poor drug management. For example, selection
and quantification procedures were inappropriate, thus stores were flooded with
drugs leading to overstretched storage facilities and wastage because of large
quantities of expired drugs. In addition, poor supplier management led to supply
of poor quality drugs while lack of technical support resulted in the collapse of
the DRFs that had been set up. The new democratic government scrapped the
PTF in 1999.

35
Since PTF was abolished, most PHC facilities have not received drugs from
official procurement mechanisms. A few of the PHC facilities admitted that they
purchased drugs from the private sector for the use of the few patients that visit
their health facility. It was, therefore, not surprising to find that the survey
results indicated low availability of drugs, especially in PHC centres. This was
also confirmed by the long stock- out duration recorded in the majority of this
category of facilities.
Although the warehouses have good storage facilities, drugs are still
unavailable due to the fact that most facilities tend towards decentralisation of
drug purchase. Thus, the stores do not perform the role of drug procurement for
distribution to the facilities. The reason may be due to the government policy of
allocating funds for health services rather than specifically for drug supply.
When funds are thus allocated for health services, the management of health
facilities allocate funds as they deem fit at the secondary and tertiary levels.
Most DRF programs have failed because proceeds are not dedicated solely to
drug procurement in the health facilities but subject to the whims and caprices
of the hospital management.
Apart from 53 out of 774 LGAs that were implementing the Bamako Initiative
(BI) in the country, the PTF intervention was the first opportunity at
institutionalising a structured drug supply and management system at the PHC
level. Unfortunately, training on drug management at that level was hardly
completed when the fund was scrapped.
About half of the PHC facilities had no means of keeping stock records, which
showed lack of accountability for drugs. It also indicates lack of monitoring and
supervision of drug use at the PHC facility level.
The results also indicated that drugs are affordable whether purchased from the
private or public sectors. This is not surprising, as there is appreciable local
production and importation of generic drugs, which create an environment of
competition. While affordability might not pose a problem of access to drugs,
ensuring the quality of drugs might be challenging to the drug regulatory
authority given the poor distribution network in the country.

36
As reflected in the household survey results, the preferred sources of
consultation were both formal and informal; with two-thirds of the respondents
patronising the private sector for their health needs. This is consistent with the
estimated percentage of the population utilising the private sector3. Of interest is
the large proportion of clientele (about a quarter) who utilise informal outlets
such as drug stores for both consultations and drug purchase.
Expenditure on drugs is quite high, relative to the total household expenditure.
Bearing in mind that family size is large within these communities, this high
expenditure on drugs is likely to have an adverse effect on the family food
budget. It is estimated that, about 66% of Nigerians live below the poverty line
of one USD per day4 and most households spend two-thirds of their income on
food alone while the poorest households may spend up to 90%4.
Quality and Safety The storage facilities were generally adequate in most state warehouses while
this was not the case in health facilities.
Expired drugs accounted for only a small percentage of drugs on the shelves of
stores in public health facilities while in the private sector; none of the drugs had
expired. This apparent compliance of the private sector should be viewed with
caution as re-labelling, concealing of stocks of expired drugs in stores are some
of the problems that the drug regulatory authority in Nigeria has to constantly
grapple with.
Rational Use of Drugs
The number of drugs per prescription, found in the study, far exceeds the
expected 1.6 considering the epidemiological profile of Nigeria5. This may be
due to a number of factors notably overuse of antibiotics, injections, analgesics,
NSAIDs and multivitamins etc. Absence of, and non-compliance, to standard
3 Health in Nigeria 1994/1995 Published by the Department of Planning Research and Statistics, Federal Ministry of Health, Abuja 4 Federal Office of Statistics 1999. Poverty Profile for Nigeria 1980 - 1996 5 Isah AO, Laing R, Quick J, Mabadeje AFB, Santoso B, Hogerzeil H, Ross Degnan D, The development of reference values for the WHO health facility core prescribing indicators West African Journal of Pharmacology and Drug Research 2002;18:6 – 11

37
treatment guidelines, appears to allow an unlimited choice of drugs for
treatment of diseases.
The percentage of patients prescribed antibiotics far exceeds the suggested
reference value of 20 – 26%5. Furthermore, numerous factors are at play
influencing the injudicious prescribing. Notable factors include the lack of
efficient laboratory services and the erroneous belief in a “give all – treat all”
philosophy or a blanket treatment policy to cover “possible infections” in patients
presenting with febrile states.
Transmission of diseases such as HIV/AIDS, Hepatitis B through reutilisation of
needles and accidental needle pricks amongst health workers should have led
to a decline in the popularity of injections. However, this is not the case as
injection use is still the preferred route of drug administration. Ideally, with the
morbidity profile of Nigeria, injection use should not be more than 13%5.
The high compliance with the EDL may be partly due to the large number of
drugs listed. During the second revision of the EDL, the list was enlarged to
accommodate most registered drugs for use in public and private health
institutions since the maiden list was perceived to be restrictive. The enabling
decree (No 43 of 1989) stipulated penalties for importation and use of drugs
outside the list.
Only a few prescriptions were found appropriate due to the inclusion of drugs
other than ORS/ORT in diarrhoea treatments. While it is desirable to treat
diarrhoea with only ORS/ORT, malaria, which is a major cause of morbidity and
mortality in under-fives, has been found to also present with diarrhoea as a
symptom. Therefore, health workers have been trained to suspect malaria when
a child has diarrhoea. It was however, difficult to judge whether the inclusion of
other drugs such as antimalarials was irrational or presumptive treatment for
malaria.
Only a few prescriptions for uncomplicated pneumonia were found to be
appropriate This may be attributed the treatment guideline in the Standing

38
Orders used at the PHC level which specifies administering crystalline penicillin
at the health facility and continuing with oral cotrimoxazole at home. In addition
prescriptions were obtained from case notes; therefore it may be difficult to
differentiate between prescriptions that were meant for patients admitted into
the wards from those belonging to outpatients.
CONCLUSIONS AND RECOMMENDED INTERVENTIONS Access and Quality There is poor access to essential drugs. The three – tier health care structure
operates independently resulting in lack of cohesion of various activities notably
procurement of medicines in a cost effective and sustainable manner. The state
level warehouses were generally well structured for drug storage but were not
being utilised for drug procurement and distribution. Drug procurement practices
were therefore unorganised and lack coordination with long stock out periods in
most health facilities. Documentation was poor with absence of stock cards in a
majority of facilities.
Patients had access to medicines from both formal and informal sources. The
quality of service delivery can be assured through effective regulatory control of
their activities.
To improve access the following are recommended:
Improve drug management with adequate documentation by:
Improving drug storage facilities and inventory management especially at
the PHC levels
Enhancing the efficiency of drug management through regular in-service
training of drug managers
Entrenching good procurement practices into the drug management system
Sustaining supervision and monitoring of drug management especially at the
PHC levels
Improving attendance to public health facilities through ensuring availability
of essential medicines and mobilising the community.
Strengthening the enforcement and monitoring roles of the pharmacists
regulatory authority

39
Rational Use of Drugs
The prescribing and dispensing of medicines were irrational. Although copies of
the EDL were not available in most health facilities, compliance to the drugs list
was almost total showing an EDL that contains both essential and non-essential
medicines. STGs were also lacking in most of the facilities surveyed. Therefore,
the following are recommended to improve the rational use of medicines:
Rationalisation of the EDL to include only essential medicines and not a list
of most drugs available in the country
Proper distribution of copies of the EDL to all levels of the health care
delivery system to guide selection of drugs.
The development and wide dissemination of standard treatment guidelines
to improve the use of medicines at all levels of health care
Institutionalisation of training on rational use of medicines for sustained
impact.
Public education on rational use of medicines with special emphasis on
reduction in injection and antibiotic use.
Establishment of drug information centres, and drugs and therapeutic
committees in secondary health facilities
Development and wide dissemination of guidelines for use of antimicrobials
Training of drug sellers in rational use of medicines for treatment of some
common priority diseases (malaria, diarrhoea) to improve service delivery
For sustainability, ensuring the inclusion of rational use of drugs in the
curriculum of all health professionals and strengthening the capacity of
trainers to provide both pre and post service training.

40
ANNEX 1
Forms for Level I Indicators

41
Questionnaire on structures and processes of country pharmaceutical situation
Country 133 Date (dd/mm/yyyy) Name of respondent(s)
Position(s)
2003 1. NATIONAL MEDICINES (DRUG) POLICY
(NMP)
1.1 Is there a National Medicines Policy (NMP) document? (See glossary for a definition of NMP.) If no, skip to 1.4.
Yes/No/Don’t Know
Is it an official or draft document? Official/Draft/Don’t Know What year was it last updated? Year
1.2 Is there an NMP implementation plan that sets activities, responsibilities, budgets, and timeline?
Yes/No/Don’t Know
If yes, when was it last updated? Year 1.3 Is the NMP integrated into a
published/official national health policy/plan? If yes, when was it last updated?
Yes/No/Don’t Know Year
1.4 Is there a national policy on traditional and complementary/ alternative medicine (TM/CAM) either as part of the medicines policy or health policy or as a separate document? (TM/CAM is defined in the glossary.)
Yes/No/Don’t Know
If yes, when was it last updated? Year 1.5 Has a national assessment/indicator study
been conducted? If yes, what areas have been studied and when was the most recent study covering each area conducted?
Yes/No/Don’t Know
Overall pharmaceutical situation: Yes/No/Don’t Know Year Rational use/prescription audit: Yes/No/Don’t Know Year
Access: Yes/No/Don’t Know Year 2. LEGISLATION/REGULATION
2.1 Is there a medicines law? If yes, when was it last updated? Which of the following areas are covered by medicines legislation and when was each last updated?
Yes/No/Don’t Know Year
Establishment of regulatory authority: Yes/No/Don’t Know Year Marketing authorisation of pharmaceuticals: Yes/No/Don’t Know Year
Manufacturing of medicines: Yes/No/Don’t Know Year Distribution of medicines: Yes/No/Don’t Know Year
Promotion & advertising of medicines: Yes/No/Don’t Know Year Importation of medicines: Yes/No/Don’t Know Year Exportation of medicines: Yes/No/Don’t Know Year
Licensing & practice of prescribers: Yes/No/Don’t Know Year Licensing & practice of pharmacy: Yes/No/Don’t Know Year

42
2003 Herbal medicines (See glossary for definition): Yes/No/Don’t Know Year
Empowers inspectors to enter premises and collect samples and documentation:
Yes/No/Don’t Know Year
Requires transparency, accountability and code of conduct in regulatory work:
Yes/No/Don’t Know Year
2.2 System and operation of medicines registration:
a) Is marketing authorisation required for medicines to be sold? If yes, how many medicinal products have been approved to be marketed? (express as number of dosage forms & strengths)
Yes/No/Don’t Know Total______
Is marketing authorisation required for herbal medicines to be sold? If yes, how many herbal medicinal products have been approved to be marketed? (express as number of dosage forms & strengths) (See glossary for a definition of herbal medicines)
Yes/No/Don’t Know Total______
b) Are there detailed written guidelines, including reference guidelines and criteria, for submitting applications for the registration of medicinal products? Are there guidelines covering the registration of herbal medicines?
Yes/No/Don’t Know Yes/No/Don’t Know
c) Is the WHO Certification Scheme certificate required as part of the marketing authorisation process?
Yes/No/Don’t Know
d) Is INN used in the registration of medicines?
Yes/No/Don’t Know
e) Is a list of all registered products publicly accessible? (Registered product is defined in the glossary.)
Yes/No/Don’t Know
2.3 Is there a computerised registration system that facilitates retrieval of information on registered products? (Registration system is defined in the glossary.)
Yes/No/Don’t Know
Is there a medicines regulatory authority website providing publicly accessible information on any of the following: legislation, regulatory procedures, prescribing information (such as indications, counterindications, side effects, etc.), authorised companies, and/or approved medicines?
Yes/No/Don’t Know
2.4 Is licensing a requirement? (Licensing is defined in the glossary.) If yes, is it based on site inspection of:
Yes/No/Don’t Know
Manufacturers: Yes/No/Don’t Know Importers/wholesalers: Yes/No/Don’t Know

43
2003 Retail distributors/pharmacies: Yes/No/Don’t Know
2.5 Are there written national guidelines/codes/checklists for the inspection of:
Manufacturers: Yes/No/Don’t Know Importers/wholesalers: Yes/No/Don’t Know
Retail distributors/pharmacies: Yes/No/Don’t Know 2.6 Is prescribing by generic name obligatory
in the:
Public sector: Yes/No/Don’t Know Private sector: Yes/No/Don’t Know
Is generic substitution permitted at: (Generic substitution is defined in the glossary.)
Public pharmacies: Yes/No/Don’t Know Private pharmacies: Yes/No/Don’t Know
2.7Is promotion/advertisement of medicines reg Company self-regulation: Yes/No/Don’t Know
Government agency or medicines regulatory authority:
Yes/No/Don’t Know
Are civil society/non-governmental organisations involved in review, assessment, or surveillance of promotion/ advertisement of medicines?
Yes/No/Don’t Know
Do regulations on promotion/advertisement of medicines include: (See glossary for the distinction between promotion and advertisement.)
Published ethical criteria for medicines promotion:
Yes/No/Don’t Know
Pre-approval for promotional materials: Yes/No/Don’t Know Pre-approval for advertisement
materials: Yes/No/Don’t Know
Explicit prohibition on advertising prescription medicines:
Yes/No/Don’t Know
Detailed restrictions on advertising non-prescription medicines:
Yes/No/Don’t Know
2.8 Are adverse drug reactions (ADR) monitored? If yes, what is the total number of each of the following for the most recent year for which data is available?
Yes/No/Don’t Know
Total number of validated ADR reports received:
____ (Year ) DK
Total number of reporting physicians: ____ (Year ) DK Total number of physicians in country: ____ (Year ) DK
Are ADR of herbal medicines monitored? Yes/No/Don’t Know 3. QUALITY CONTROL OF
PHARMACEUTICALS

44
2003 3.1 Testing of medicines samples collected last year for regulatory purposes (i.e. including drug registration and post-marketing surveillance, but excluding testing done in conjunction with procurement activities):
Total number of samples
Total number of samples collected: ____ Don’t Know Total number of samples tested: ____ Don’t Know
Total number of samples that failed identity or assay:
____ Don’t Know
3.2 Where have the above samples (see 3.1) been tested:
Percentage of total samples tested
Government quality control laboratory: % Don’t Know Local academic institutions: % Don’t Know
Quality control laboratory in another country: % Don’t Know Private quality control laboratory: % Don’t Know
4. ESSENTIAL MEDICINES LIST (EML) 4.1 Are there Essential Medicines Lists (EML)?
(An Essential Medicines List is a government-approved selective list of medicines or national reimbursement list)
Total number of medicines
Year of last update
National EML: Yes/No/DK
____
State or provincial list: Yes/No/DK
____
List for primary health care: Yes/No/DK
____
4.2 Are EMLs being used in: Public sector procurement:
Yes/No/Don’t Know
Public insurance reimbursement: Yes/No/Don’t Know Private insurance reimbursement: Yes/No/Don’t Know
4.3 Are local herbal medicines included on the national EML?
Yes/No/Don’t Know
5. MEDICINES SUPPLY SYSTEM 5.1 Who is
responsible for public sector drug procurement and distribution? What percentage of the total cost is each responsible for? Ministry/Department of Health:
Procurement Yes/No/DK %
Distribution Yes/No/DK %
Non-governmental organisation (NGO): Yes/No/DK %
Yes/No/DK %
Private institution contracted by the government:
Yes/No/DK %
Yes/No/DK %
Individual health institutions: Yes/No/DK %
Yes/No/DK %
5.2 Is government procurement limited to medicines on the EML?
Yes/No/Don’t Know
If no, is a percentage of the budget set aside for non-EML items?
Yes/No/Don’t Know
What is the percentage? %

45
2003 5.3 Type of tender and percentage of the
total cost for each: (Tender is the process by which competing bids are entered for a particular contract.) National competitive tender:
Yes/No/DK
Percentage of total cost %
International competitive tender: Yes/No/DK % Negotiation/direct purchasing: Yes/No/DK %
5.4 Is drug registration a prerequisite for government purchases?
Yes/No/Don’t Know
6. MEDICINES FINANCING 6.1 What is the total public or government
budget for medicines in US$ for the most recent year for which data is available?
$ ___________ , Year
6.2 Are there guidelines on medicines donations that cover the public sector, the private sector, or non-governmental organisations (NGO)?
Public Sector
Yes/No/DK
Private Sector Yes/No/DK
NGO Yes/No/DK
6.3 Which medicines are free at primary public health facilities:
All medicines are free of charge:
Yes/No/Don’t Know
Malaria medicines are free: Yes/No/Don’t Know Tuberculosis medicines are free: Yes/No/Don’t Know
Sexually transmitted diseases medicines are free:
Yes/No/Don’t Know
HIV/AIDS-related medicines are free: Yes/No/Don’t Know Medicines are free to those who cannot
afford them: Yes/No/Don’t Know
Medicines are free for children under 5 years of age:
Yes/No/Don’t Know
Medicines are free for pregnant women: Yes/No/Don’t Know Medicines are free for elderly persons: Yes/No/Don’t Know
No medicines are free of charge: (Don’t Know ) 6.4 Which fees are charged in public health facilities:
Registration/Consultation fees:
Yes/No/Don’t Know
Dispensing fees: Yes/No/Don’t Know Flat fees for medicines: Yes/No/Don’t Know
Flat rate copayments: Yes/No/Don’t Know Percentage copayments:
(Co-payments cover part of the cost of medicines, the other part being paid by an insurer or government.)
Yes/No/Don’t Know
6.5 Is revenue from fees or drug sales used to pay the salaries of public health personnel in the same facility?
Always/Frequently/Occasionally/Never/DK
6.6 Health insurance: (Health insurance is any prepayment scheme for health care costs additional to but excluding subsidies funded through the Ministry of Health budget.)
What percentage of the population has health insurance?
Public All/Some/None/
DK
Private
All/Some/None/DK

46
2003 Are medicines covered by health insurance? All/Some/None/
DK All/Some/None/DK
Of the covered medicines, what percentage of the cost is covered:
% %
6.7 Is there a pricing policy on medicines that covers the public sector, the private sector, or non-governmental organisations? If yes, does it apply to:
Public sector
Yes/No/DK
Private sector
Yes/No/DK
NGO
Yes/No/DK
All medicines, some or none: All/Some/None/DK
All/Some/None/DK
All/Some/None/DK
Is maximum wholesale mark up established in laws/regulations:
Yes/No/DK
Yes/No/DK
Yes/No/DK
If yes, amount: % % % Maximum retail mark up established in
laws/regulations: Yes/No/DK
Yes/No/DK
Yes/No/DK
If yes, amount: % % % Duty on imported raw pharmaceutical
materials:Yes/No/DK
Yes/No/DK
Yes/No/DK
Duty on imported finished pharmaceutical products:
Yes/No/DK
Yes/No/DK
Yes/No/DK
7. ACCESS TO ESSENTIAL MEDICINES 7.1 In your opinion, what percentage of the
population has regular access to essential medicines (i.e. minimum of 20 most essential medicines available and affordable at public and private facilities within a one-hour walking distance)?
%
7.2 What percentage of:
The population is within one-hour walking distance to:
Public health facility
%
Private health facility
%
Public or private retail drug
outlet %
Facilities have essential medicines available: % % % The population can afford essential medicines
at: % % %
8. PRODUCTION 8.1 What is the medicines production
capability in the country? Research and development of new active
substances:
Yes/No/Don’t Know
Production of pharmaceutical active starting materials:
Yes/No/Don’t Know
Formulation from pharmaceutical starting materials:
Yes/No/Don’t Know
Repackaging of finished dosage forms: Yes/No/Don’t Know 8.2 For each of the following types of local
production, indicate number of factories and total annual sales in US$ for the most recent year for which data is available: Starting materials:
Number of factories ____
Sales in US$ $ ____
Year
Don’t know DK

47
2003 Finished products: ___
_ $ ____
DK
Products containing active substances developed/marketed for the first time during the last 5 years:
____
$ ____
DK
8.3 What is the total volume and US$ value of the medicines market? Generic medicines compose what percentage of market volume and value?
Volume ____, Value $ ____ Volume ____%, Value ____%
9. RATIONAL USE OF MEDICINES 9.1 Are there standard treatment guidelines (STGs) produced by the health ministry/department for major conditions? (STGs are recommendations about how to treat a clinical condition.)
National STG:
Yes/No/DK
Number of condition
s/ diseases
____
Year of publication or review
STG for hospital level: Yes/No/DK
____
STG for primary health care level: Yes/No/DK
____
9.2 Is there a National Medicines Formulary manual? (A formulary manual contains summary drug information.) If yes, does it cover only medicines on the Essential Medicines List?
Yes/No/Don’t Know Yes/No/Don’t Know
What year was it last published/reviewed: Year 9.3 Are any of the following aspects of the essential medicines concept generally part of the basic curricula in most health training institutions/universities for: (Essential medicines are those that satisfy the priority health care needs of the population. See glossary for a definition of problem-based pharmacotherapy.) Doctors:
Essential Medicines
List
Yes/No/DK
Standard Treatment Guidelines
Yes/No/DK
Problem-based
pharmaco-therapy
Yes/No/DK
Rational prescribing
Yes/No/DK
Nurses: Yes/No/DK Yes/No/DK Yes/No/DK Yes/No/DK
Pharmacists: Yes/No/DK Yes/No/DK Yes/No/DK Yes/No/DK
Pharmacy assistants: Yes/No/DK Yes/No/DK Yes/No/DK Yes/No/DK
Paramedical staff: Yes/No/DK Yes/No/DK Yes/No/DK Yes/No/DK
9.4 Are there independent publicly or non-commercially funded obligatory continuing education programs which include use of medicines for: Doctors:
Yes/No/Don’t Know
Nurses/midwives/paramedical staff: Yes/No/Don’t Know Pharmacists: Yes/No/Don’t Know
Pharmacy aides/assistants: Yes/No/Don’t Know 9.5 Is there a public or independently funded
nationally accessible (e.g. by phone) medicines information centre or service co-ordinated by the Ministry of Health, academia, and/or a non-commercial non-governmental organisation that provides information on demand to:
Yes/No/Don’t Know

48
2003 Prescribers:
Dispensers: Yes/No/Don’t Know Consumers: Yes/No/Don’t Know
9.6 Has there been any public education campaign concerning rational medicines use in the previous two years conducted by Ministry of Health/non-governmental organisation/academia on the following topics: Use of antibiotics:
Yes/No/Don’t Know
Use of injections: Yes/No/Don’t Know Other topics/issues: Yes/No/Don’t Know
9.7 How often do the following personnel prescribe at the primary health care level in the public sector? Doctors:
Always/Frequently/Occasionally/Never/DK
Nurses/midwives/paramedical staff: Always/Frequently/Occasionally/Never/DK
Pharmacists: Always/Frequently/Occasionally/Never/DK
Pharmacy aides/assistants: Always/Frequently/Occasionally/Never/DK
Personnel with less than one month formal health training:
Always/Frequently/Occasionally/Never/DK
9.8 Is there a government department with a specific mandate to promote the rational use of medicines and co-ordinate medicines use policies?
Yes/No/Don’t Know
9.9 What proportion of facilities have a drugs and therapeutics committee? (A drugs and therapeutics committee promotes the safe and effective use of medicines in the facility or area under its jurisdiction) Referral hospitals:
All/Most/Half/Few/None/Don’t Know
General hospitals: All/Most/Half/Few/None/Don’t Know Regions/provinces: All/Most/Half/Few/None/Don’t Know
Is there a mandate for drugs and therapeutics committees in the national medicines policy?
Yes/No/Don’t Know
9.10 Is there a national strategy to contain antimicrobial resistance?
Yes/No/Don’t Know
Is there a national reference laboratory to coordinate epidemiological surveillance of antimicrobial resistance?
Yes/No/Don’t Know
Is there a funded national intersectoral task force to coordinate the implementation of interventions to promote appropriate use of antimicrobials and prevent the spread of infection?
Yes/No/Don’t Know
9.11 Are the following medicines sold over the counter without any prescription? Antibiotics:
Always/Frequently/Occasionally/Never/DK
Injections: Always/Frequently/Occasionally/Never/DK

49
2003
10. INTELLECTUAL PROPERTY RIGHTS PROTECTION AND MARKETING AUTHORIZATION
10.1 Is patent protection legally provided for pharmaceutical products? If yes, indicate:
Yes/No/Don’t Know
Year introduced: Type: Process/Product/Both/Don’t Know
Duration of patent validity: 10.2 Which intellectual property right
protection regime/activities are provided for traditional medical knowledge?
TRIPS:
Yes/No/DK
Year introduced
Duration of data
protection
Sui generis regimes: Yes/No/DK Digital library: Yes/No/DK
National inventory of medicinal plants: Yes/No/DK Others: Yes/No/DK
None: (DK ) 10.3 TRIPS Agreement (Agreement on Trade Related Aspects of Intellectual Property
Rights): a) Is your country a World Trade
Organization Member? If no, skip to 10.4 Yes/No/Don’t Know
b) Has national legislation been modified to implement the TRIPS Agreement? If yes, what year did it go into effect?
Yes/No/Don’t Know Year
c) Is your country availing itself of the transitional period provided by Article 65 of the TRIPS Agreement?
Yes/No/Don’t Know
d) If your country is a least-developing country (LDC), has it availed itself of the transitional period accorded to LDCs in Article 66 of the TRIPS Agreement?
Yes/No/DK/Country not an LDC
10.4 Have parallel importing provisions on pharmaceuticals been incorporated into national legislation? If yes, have these provisions been applied?
Yes/No/DK/Currently being discussed Yes/No/DK/Currently being discussed
10.5 Have compulsory licensing provisions for pharmaceuticals been incorporated into national legislation? If yes, under what conditions? National emergency:
Yes/No/DK/Currently being discussed Yes/No/Don’t Know
Public non-commercial use: Yes/No/Don’t Know Remedying anti-competitive practices: Yes/No/Don’t Know
Other: Yes/No/Don’t Know 10.6 Are generic pharmaceutical
manufacturers allowed to use patented inventions for the purpose of obtaining marketing approval prior to patent expiration?
Yes/No/DK/Currently being discussed

ANNEX 2
Survey Forms for Level II Indicators
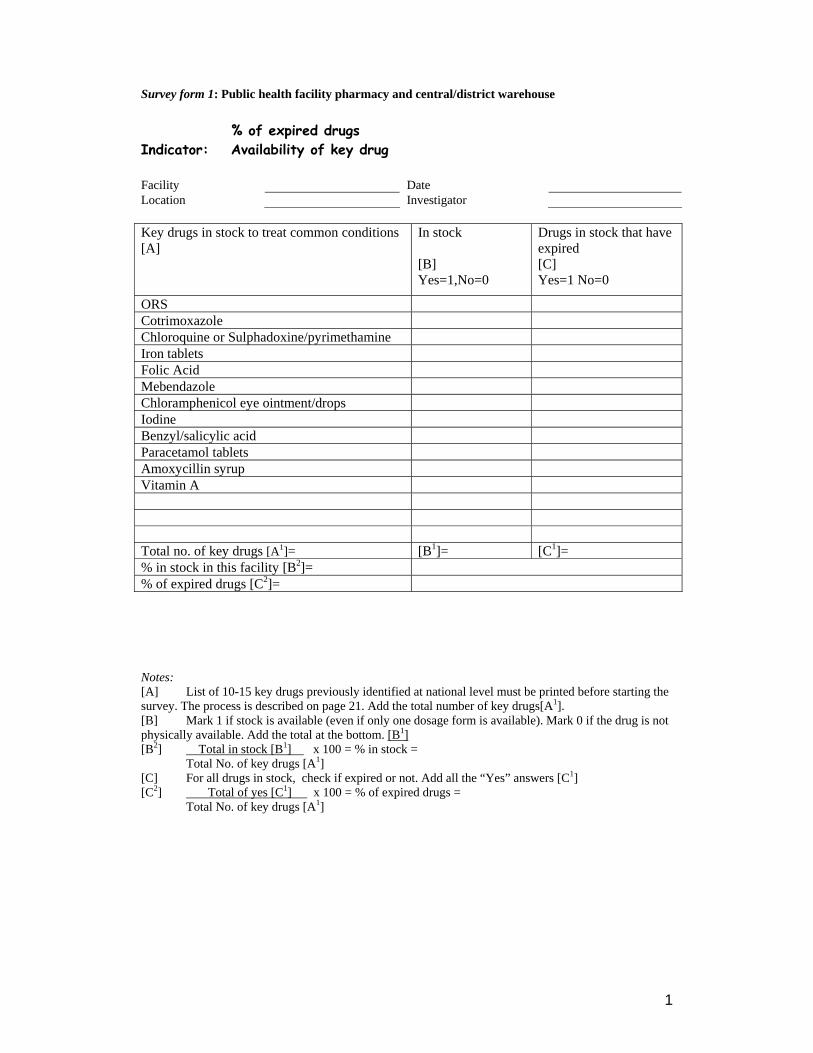
1
Survey form 1: Public health facility pharmacy and central/district warehouse % of expired drugs Indicator: Availability of key drug Facility Date Location Investigator Key drugs in stock to treat common conditions [A]
In stock [B] Yes=1,No=0
Drugs in stock that have expired [C] Yes=1 No=0
ORS Cotrimoxazole Chloroquine or Sulphadoxine/pyrimethamine Iron tablets Folic Acid Mebendazole Chloramphenicol eye ointment/drops Iodine Benzyl/salicylic acid Paracetamol tablets Amoxycillin syrup Vitamin A Total no. of key drugs [A1]= [B1]= [C1]= % in stock in this facility [B2]= % of expired drugs [C2]= Notes: [A] List of 10-15 key drugs previously identified at national level must be printed before starting the survey. The process is described on page 21. Add the total number of key drugs[A1]. [B] Mark 1 if stock is available (even if only one dosage form is available). Mark 0 if the drug is not physically available. Add the total at the bottom. [B1] [B2] Total in stock [B1] x 100 = % in stock = Total No. of key drugs [A1] [C] For all drugs in stock, check if expired or not. Add all the “Yes” answers [C1] [C2] Total of yes [C1] x 100 = % of expired drugs = Total No. of key drugs [A1]

2
Survey form 2: Private pharmacy Indicator: % of expired key drugs Facility Date Location Investigator
Drugs in stock that have expired [B]
Key drugs in stock to treat common conditions [A]
Yes=1 No=0 ORS Cotrimoxazole Chloroquine or Sulphadoxine/pyrimethamine Iron tablets Folic Acid Mebendazole Chloramphenicol eye ointment/drops Iodine Benzyl/salicylic acid Paracetamol tablets Amoxycillin syrup Vitamin A Total no. of key drugs[A1]= % of expired drugs [B2]=
[B1]=
Notes: [A] List of 10-15 key drugs previously identified at national level must be printed before the survey. The process is described on page 21. Add the total number of key drugs[A1]. [B] Check if expired or not. If any of the strengths has an expiry problem the answer for the drug should be “Yes”. [B1] Add all the “Yes” answers. [B2] Total of yes [B1] x 100 = % of expired drugs = Total No. of key drugs [A1]

3
Survey form 3: Public facility pharmacy/central district warehouse Indicator: Stockout duration Facility Date Location Investigator
Key drugs [A]
No. of days out of stock [B]
No. of review [C]
Equivalent no. of days/year (D)=B x 365/C
ORS Cotrimoxazole Chloroquine or Sulphadoxine/pyrimethamine
Iron tablets Folic Acid Mebendazole Chloramphenicol eye ointment/drops
Iodine Benzyl/salicylic acid Paracetamol tablets Amoxycillin syrup Vitamin A [A1]= Total no of key drugs (sum of A)=
[D1]=Sum of D [E] = Average number of stock out days=[D1/A1]
[D1]= [E]=
Notes: [A] List of 10-15 key drugs previously identified must already be printed in [A]. (see page 21). Review the stock cards of the key essential drugs listed. [B] Go through the stockcards covering the review period. Add the number of days that each of the key essential drugs are not available or marked “0” on the stockcard. A drug is considered in stock if it or its equivalent is available in either generic or branded form. Indicate in (B) the total number of days. [C] The review should cover a six month to one year period. If this is not possible then indicate the number of days covered by the review. Example: Key drugs [A]
No. of days out of stock [B]
Number of days covered by the review) [C]
Equivalent no. of days/year B x 365/C=(D)
Amoxycillin 58 120 days 58 x 365/120= 176 Cotrimoxazole 90 6 months 90x 365/180=182 Paracetamol 30 1year 30 x 365/365=30 A1= 3 keydrugs [A1]= Total no of key drugs =3
[E]= Average number of stock out days [D1/A1]=
129 days
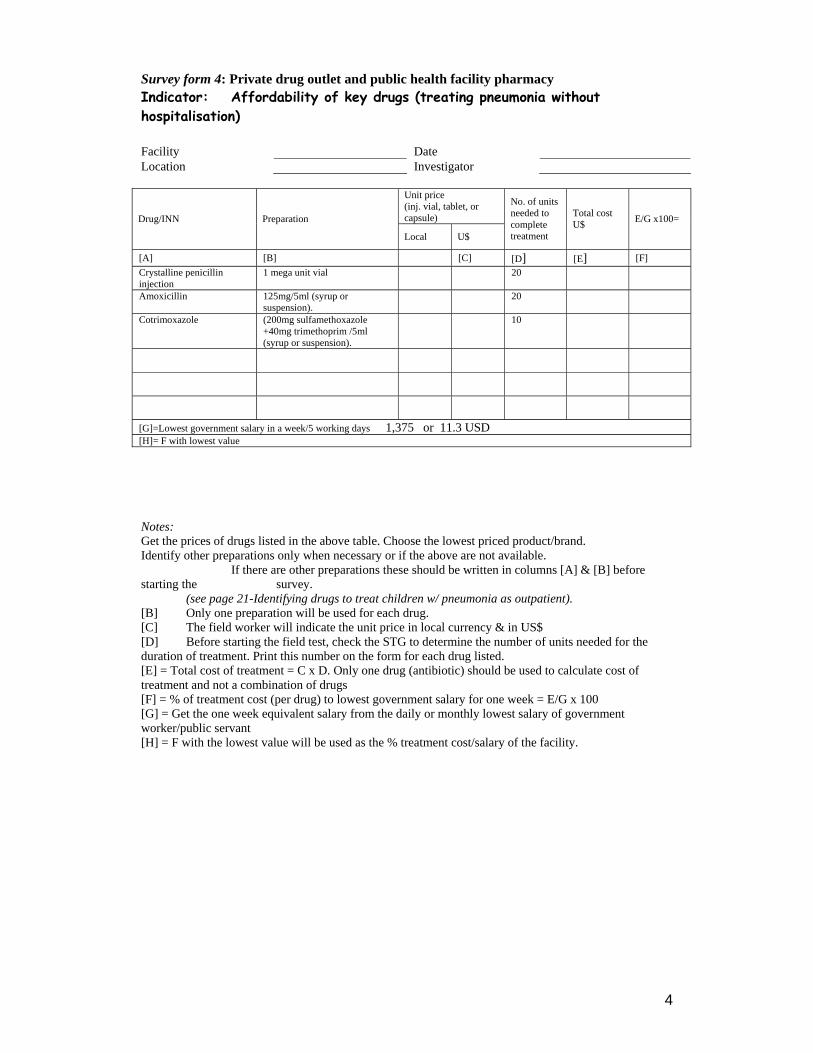
4
Survey form 4: Private drug outlet and public health facility pharmacy Indicator: Affordability of key drugs (treating pneumonia without hospitalisation) Facility Date Location Investigator
Unit price (inj. vial, tablet, or capsule) Drug/INN Preparation
Local U$
No. of units needed to complete treatment
Total cost U$ E/G x100=
[A] [B] [C] [D] [E] [F] Crystalline penicillin injection
1 mega unit vial 20
Amoxicillin 125mg/5ml (syrup or suspension).
20
Cotrimoxazole (200mg sulfamethoxazole +40mg trimethoprim /5ml (syrup or suspension).
10
[G]=Lowest government salary in a week/5 working days 1,375 or 11.3 USD [H]= F with lowest value Notes: Get the prices of drugs listed in the above table. Choose the lowest priced product/brand. Identify other preparations only when necessary or if the above are not available. If there are other preparations these should be written in columns [A] & [B] before starting the survey. (see page 21-Identifying drugs to treat children w/ pneumonia as outpatient). [B] Only one preparation will be used for each drug. [C] The field worker will indicate the unit price in local currency & in US$ [D] Before starting the field test, check the STG to determine the number of units needed for the duration of treatment. Print this number on the form for each drug listed. [E] = Total cost of treatment = C x D. Only one drug (antibiotic) should be used to calculate cost of treatment and not a combination of drugs [F] = % of treatment cost (per drug) to lowest government salary for one week = E/G x 100 [G] = Get the one week equivalent salary from the daily or monthly lowest salary of government worker/public servant [H] = F with the lowest value will be used as the % treatment cost/salary of the facility.

5
Survey form 5: Checklist for storage area in public pharmacy/warehouse Indicator: Adequate storage Facility Date Location Investigator
Storage Pharmacy Checklist (check the box if Yes)
Are there locks which are working in the storage area
ο ο
Storage and shelves area are clean (no dust and litter) ο ο No evidence of pests seen in the area ο ο There is a roof/ceiling ο ο There are windows that can be opened or there are air vents
ο ο
No direct sunlight should enter the area, glass window pane painted white, or with curtains/blinds to protect against sunrays
ο ο
Area free from moisture (leaking drains and taps). Drugs should not be stored directly on the floor
ο ο
There is a separate storage and dispensing area for issuing drugs
ο ο
Drugs are sorted in systematic way (alphabetical, first expiry-first out)
ο ο
There is stock record system ο ο There is a cold storage with temperature chart ο ο Rating for the facility: [A]+ [B]/2, if only one exists just use [A] or [B] =
[A]= [B]=
Facility storage Rating (check) Equivalent rating for quality of drugs Poor 0-3 ο Quality may be poor
Not adequate 4-5 ο Quality may be doubtful
Moderately adequate 6-7 ο Acceptable quality
Adequate 8-10 ο Acceptable quality
More than adequate 11 ο Good quality

6
Survey form 6: Rational drug use - Prescribing indicator form (public health facility) Indicators: average number of drugs % injection use % antibiotic use % drugs in EDL Facility Date Location Investigator Seq. Patient No.
Type (R/P) [A]
Date of Rx
N° drugs [B]
Antib (0=no, 1= yes) [C]
Injec. (0=no,1=yes) [D]
No. of Drugs on EDL [E]
Total B*= C*= D*= E*= Average B** Percentage C*/No. of
cases X 100 =
D*/No. of cases X 100 =
E*/B* X 100 =
Notes: [A] Select 30 outpatient patient seen within 6 months- one year period from the records (R=retrospective)/those being treated (P=prospective). Sample of cases can be a combination of P and R. (See page 20:Select patient encounters) [B] Count number of drugs prescribed for each case. (B*=Total no. of drugs) Count as 1 a drug given in different preparation (ex: paracetamol tablet and injection two brands of similar chemical entity/INN/generic name will be counted as 1 also [B**] Average No. of drus prescribed = B*/Number of cases [C] Indicate 0 if no antibiotic is prescribed and 1 if one or more type of antibiotic is given. (C*= Total of cases with antibiotics) [D] 0 if no injection and 1 if it was given. (D*=Total of cases with injection) [E] From the number of drug prescribed for the case, count those included in the EDL (E* = total number of drugs listed in EDL)
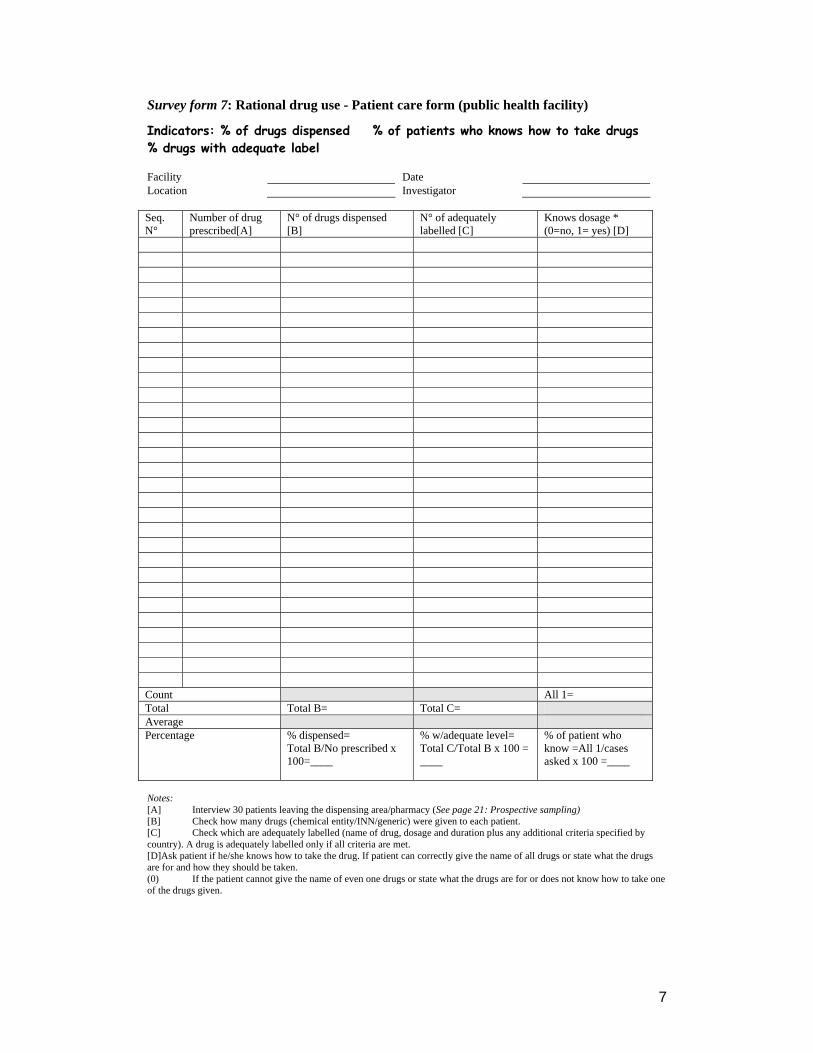
7
Survey form 7: Rational drug use - Patient care form (public health facility)
Indicators: % of drugs dispensed % of patients who knows how to take drugs % drugs with adequate label Facility Date Location Investigator Seq. N°
Number of drug prescribed[A]
N° of drugs dispensed [B]
N° of adequately labelled [C]
Knows dosage * (0=no, 1= yes) [D]
Count All 1= Total Total B= Total C= Average Percentage % dispensed=
Total B/No prescribed x 100=____
% w/adequate level= Total C/Total B x 100 = ____
% of patient who know =All 1/cases asked x 100 =____
Notes: [A] Interview 30 patients leaving the dispensing area/pharmacy (See page 21: Prospective sampling) [B] Check how many drugs (chemical entity/INN/generic) were given to each patient. [C] Check which are adequately labelled (name of drug, dosage and duration plus any additional criteria specified by country). A drug is adequately labelled only if all criteria are met. [D]Ask patient if he/she knows how to take the drug. If patient can correctly give the name of all drugs or state what the drugs are for and how they should be taken. (0) If the patient cannot give the name of even one drugs or state what the drugs are for or does not know how to take one of the drugs given.

8
Survey form 8: STG at public health facility Indicator: Availability of STG for common local conditions Availability of Essential Drug List (EDL) at the facility Facility Date Location Investigator Standard treatment guidelines available at facility (Yes/No) National STG STG for URTI STG for Diarrhoea STG for Pneumonia Malaria Tuberculosis Others: EDL available at the facility (Yes/No) National EDL Provincial/District Primary EDL Others:
STG is available in this facility Yes No
EDL is available in this facility Yes No Notes: The facility is considered to have STG if any of the above is available provided the STG was developed by an independent group and the document is not associated to promote pharmaceutical products. 2. Before the survey, the latest most updated version of EDL must be identified. The facility is considered to have EDL if one of the above is available.

9
Survey form 9: Treatment of diarrhoea, ARI, and pneumonia at public health facility Indicator: % tracer case treated using recommended treatment Facility Date Location Investigator Notes: Select at random 30 patients (diarrhea, ARI & pneumonia). Choose only single disease encounters. Always write 1 or 0 for all drugs enumerated. For assessment (level 1, 2) write A/ B/ C/ D/E on the appropriate spaces. Add total.
Cases (1=yes/ 0=no) Diseases/Drug prescribed 1 2 3 4 5 6 7 8 9 10
Total yes (1)/ cases x100
Diarrhoea in Children ORS Antibiotic Antidiarrheal Antispasmodic Other drugs given Level I assessment(A/B) A=___/B=___ Level 1 assessment: A=appropriate=(all criteria: ORS 1, antibiotic 0, antidiarrhoeal 0, antispasmodic 0, other drug 0)
B=not appropriate=(one or all criteria: ORS 0, antibiotic 1, antidiarrheal 1, antispasmodic 1, other drug 1)
Non-pneumoni- acute respiratory tract infection(ARI) Antibiotic prescribed Level 1 assessment(A/B) A=___/B=___ Antipyretic/analgesic Cough and/or cold drugs Other drugs given Level 2 assessment(C/D) C=___/D= Level 1 assessment: A= appropriate(antibiotic 0) B= not appropriate(antibiotic 1)
Level 2 assessment: only if level 1 is A C= appropriate (all criteria: antipyretic/analgesic 1 or 0, cough/cold 1 or 0, other drug 0) D= not appropriate (other drug 1)
Pneumonia Crystalline Penicillin inj. Amoxicillin Cotrimoxazole Number of other types of antibiotics:
0 1 >1 Level1 assessment(A/B/C) A___,B___,C__
Antipyretic/analgesic Cough and/or cold drugs Other drugs given Level 2 assessment(D/E) D=___/E=____ Level 1 assessment A=appropriate=(only one: procaine penicillin or amoxicillin or cotrimoxazole is 1, number of other types of antibiotic 0.) B= not certain = if none of procaine penicillin or amoxicillin or cotrimoxazole was prescribed, then number of other types of antibiotic can be 0 or 1. (the other antibiotic may be appropriate or not) C=not appropriate= (any combination of procaine penicillin, amoxicillin, cotrimoxazole and other type of antibiotics. It means > 1 type of antibiotic given in the case.
Level 2 assessment: only if level 1 is A D=appropriate= (all criteria: antipyretic/analgesic 1 or 0, cough/cold 1 or 0, other drug 0) E= not appropriate (other drugs 1)

10
Access and use of medicines Have you or any members of the household been ill in the last two weeks? (exclude hospital admission) ο Yes ο No Sex and age of person who has been ill ο Male ο Female Age: _____ year(s) What were the person’s symptoms? (mark one or more) ο Diarrhoea ο Cough ο Fever ο Others (symptoms or diagnosis) _____________________________________________________________________________ What was done for the person? (use numbers to indicate the order of actions taken) _____ Consulted traditional healer _____ Consulted public health clinic/hospital _____ Consulted private health clinic/hospital _____ Consulted pharmacist _____ Consulted drug seller
_____ Sought advice from friend/neighbour/family _____ Bought medicine without consultation _____ Used medicine left from another illness _____ Did nothing (If no one was consulted, skip to question 9)
Was medication prescribed? ο Yes ο No Which medicines were bought? ο All ο Some ο None
If not all, why not? (mark one or more) ο Price was too high ο Did not have enough money ο Not able to borrow enough money ο Too many medicines were prescribed ο Did not believe all the medicines were needed ο Started to feel better ο No time to get all the medicines
ο Traditional healer did not have all the medicines ο Public pharmacy did not have all the medicines ο Private pharmacy did not have all the medicines ο Drug seller did not have all the medicines ο Already had some of the medicines at home ο Other
How much of the prescribed medicine was taken? ο All ο Some ο None
Amount spent (write 0 if free)
Mark an X through the source as numbered (1–9) (1) Traditional healer (6) Local store/marketplace
What medicines were used? (include traditional medicines)
Local
US$
(2) Public health centre/hospital (3) Private health centre/hospital (4) Public pharmacy (5) Private pharmacy
(7) Friends/neighbours/family (8) Medicines already owned (9) Other
(1) (2) (3) (4) (5) (6) (7) (8) (9)
(1) (2) (3) (4) (5) (6) (7) (8) (9)
(1) (2) (3) (4) (5) (6) (7) (8) (9)
(1) (2) (3) (4) (5) (6) (7) (8) (9)
(1) (2) (3) (4) (5) (6) (7) (8) (9)
(1) (2) (3) (4) (5) (6) (7) (8) (9)
(1) (2) (3) (4) (5) (6) (7) (8) (9)
Estimated family weekly income OR total household expenses last week Local ____________________ US$ ____________________