basel iii disclosures for the year ended december 31, … · basel iii disclosures for the year...
TRANSCRIPT

Basel III Disclosures For the year ended December 31, 2015
I. Scope of Application The framework of disclosures applies to RBL Bank Limited, a scheduled commercial bank,
incorporated on August 6, 1943. The Bank does not have any subsidiary nor does it have any
interest in any insurance entity.
II. Capital Adequacy Regulatory capital assessment
The Bank is subjected to Capital Adequacy guidelines stipulated by Reserve Bank of India (RBI). In
line with RBI guidelines under Basel III, the Bank has adopted Standardized Approach for Credit
Risk, Standardized Duration Approach for Market Risk and Basic Indicator Approach for
Operational Risk while computing its Capital Adequacy Ratio (CAR).
As per capital adequacy guidelines under Basel III, by March 31, 2019 the Bank is required to
maintain a minimum CAR of 9% {11.5% including Capital Conservation Buffer (CCB)}, with
minimum Common Equity Tier I (CET I) CAR of 5.5% {8% including CCB}. These guidelines on Basel
III are to be implemented in a phased manner. The minimum CAR required to be maintained by
the Bank for the year ended March 31, 2016 is 9% {9.625% including CCB} with minimum CET I of
5.5% {6.125% including CCB}.
As on December 31, 2015, total CAR of the Bank stood at 12.89%, well above regulatory minimum requirement of 9%. Tier I CAR of the Bank stood at 12.50% and CET I CAR at 12.50%. Assessment of adequacy of Capital to support current and future activities
The Bank has a comprehensive Internal Capital Adequacy Assessment Process (ICAAP) which is
approved by the Board of Directors (Board). Under ICAAP, the Bank determines adequacy of
capital to meet regulatory norms, current and future business needs, including stress scenarios.
ICAAP evaluates and documents all risks and substantiates appropriate capital allocation for risks
identified under Pillar 1 (i.e. Credit, Market and Operational Risk) as well as Pillar 2.
ICAAP enables the Bank to ensure the adequacy of capital to take care of the future business
growth and various other risks that the Bank is exposed to, so that the minimum capital required
is maintained on a continuous basis and also at the times of changing economic conditions/
economic recession. The Bank takes into account both quantifiable and non-quantifiable risks
while assessing capital requirements. The Bank considers the following risks as material and has
considered these while assessing and planning its capital requirements:
Credit Risk
Market Risk
Operational Risk
Interest Rate Risk in banking Book RBL Bank Limited Page 1 of 19

Liquidity Risk
Credit Concentration Risk
Business Risk
Strategic Risk Compliance Risk
Reputation Risk
Technology Risk
The Bank has also implemented a Board approved Stress Testing Framework. This involves the
use of various techniques to assess the Bank’s vulnerability to plausible but extreme stress
events. The stress tests cover assessment of Credit Risk, Market Risk, Operational Risk, Liquidity
Risk as well as Interest Rate Risk under assumed ‘stress’ scenarios. Tolerance limits have also
been defined for these stress tests. The stress tests are used in conjunction with the Bank’s
business plans for the purpose of capital planning in ICAAP. The stress tests are performed at
periodic intervals and results are reported to the Board.
As per the Bank’s assessment, it believes that its current robust capital adequacy position,
adequate headroom available to raise capital, demonstrated track record for raising capital and
adequate flexibility in the balance sheet structure and business model, the capital position of the
Bank is expected to remain robust.
Capital requirements for various risks
A summary of Bank's capital requirement for credit, market and operational risk along with CAR as on December 31, 2015 is presented below:
(` In Millions)
SN Particulars 31.12.2015
(a) Capital requirements for Credit risk:
- Portfolios subject to standardized approach 16,137.21
- Securitization exposures -
(b) Capital requirements for Market risk:
Standardized duration approach
- Interest rate risk 1,876.69
- Foreign exchange risk (including gold) 117.00
- Equity risk 88.51
(c) Capital requirements for Operational risk:
- Basic indicator approach 927.70
(d) Capital Adequacy Ratios
- Total Capital Adequacy Ratio (%) 12.89 %
- Tier-1 Capital Adequacy Ratio (%) 12.50 %
- Common Equity Tier-1 Capital Adequacy Ratio (%) 12.50 %
RBL Bank Limited Page 2 of 19

III. Credit Risk: General Disclosures
Policy and Strategy for Credit Risk Management
Credit Risk is defined as the probability of losses associated with reduction in credit quality of
borrowers or counterparties leading to non-payment of dues to the bank. In the Bank's portfolio,
losses arise from default due to inability or unwillingness of a customer or counterparty to meet
commitments in relation to lending, trading, settlements, or any other financial transaction.
The Bank has put in place Commercial Credit Policy, Investment Policy, Recovery Policy, Risk
Management Policy, Policy on Transfer of Asset through Securitization & Direct Assignment of
cash flows, Retail Assets Credit Policy duly approved by the Board whereby credit risk can be
identified, quantified and managed within the framework that is considered consistent with the
scale, size of business and risk appetite of the Bank. These policies prescribe various methods for
credit risk identification, measurement, grading, monitoring, reporting, risk control / mitigation
techniques and management of problem loans/ credit.
Credit Risk Management is ensured through following initiatives:
A rigorous control framework from which only authorized departures are permitted;
Clear, agreed roles and responsibilities; Qualified, experienced and well-motivated personnel;
A predetermined credit risk measurement and monitoring methodology;
Consistent reporting and relevant MIS;
A statement of operating principles; Robust systems, applications and data warehousing architecture.
Organizational Structure for Credit Risk Management function
The organizational structure of the Bank for Credit Risk Management function has the Board of
Directors at the apex level that maintains overall oversight on the management of risks. The Risk
Management Committee of Board (RMCB) devises policy and strategy for integrated risk
management which includes credit risk. RMCB approves the Bank’s credit policies, prudential
exposure limits, business segments, credit assessment and approval system, margin and
collateral management, credit documentation, credit pricing framework, credit administration
and monitoring system, non-performing assets management policy, credit risk management
system and exception management.
At operational level, Management Credit Committee (MCC) is responsible for operationalizing the
credit policy and implementing credit framework as approved by the Board. The committee
recommends policies on standards for presentation of credit proposals, financial covenants,
ratings, prudential limits on large credit exposures, standards for loan collaterals, etc. MCC also
oversees portfolio risk management, loan review mechanism, risk concentrations, pricing of
loans, provisioning and other regulatory/ legal compliances. In addition, the committee has
financial authority to approve credit proposals in line with Board approved policy.
MCC is assisted by the Executive Credit Committee (ECC), which does not possess financial authority, but plays an important role towards setting portfolio quality standards. The committee
RBL Bank Limited Page 3 of 19

reviews portfolio underwriting standards, approves policy deviations and monitors various other portfolio quality metrics on a periodic basis.
The roles and responsibilities of the key functions involved in credit risk management are as detailed below:
Credit Risk Department (CRD) – The CRD has an independent reporting to Chief Risk Officer
(CRO) of the Bank and has credit recommendation and approval authorities at different
levels. The CRD takes decisions on all applications in accordance with policies applicable to
the specific proposal / product / scheme. To ensure complete independence, and to avoid
any conflict of interest, the CRD is not assigned any business targets. Credit Administration Department (CAD) – The CAD at Corporate / Regional level acts as the
third eye after business and CRD to ensure compliance with the Bank’s policies and prudent lending requirements.
Recoveries and Collections – The Recovery Department monitors NPA’s and manages
restructuring of advances after examining viability of the unit, follows up for recoveries very
closely and provides guidance to the Relationship Manager (RM’s) / Branch Managers
responsible for collections and actively participates in the recovery effort where warranted. Portfolio Risk – The primary responsibility of Portfolio Risk include overall portfolio analysis
and reporting the same to Board, review of internal rating system, monitoring prudential
limits and loan reviews.
Credit risk measurement, mitigation, monitoring & reporting systems
Credit Origination and Appraisal System
There are separate Credit Origination and Appraisal Processes for Wholesale and Retail
segments. Within the Wholesale segment, Bank has adopted underwriting standards for different
client segments that is based, inter alia, on internal risk ratings, availability of security and other
risk parameters. The credit sanctions are provided by experienced credit professionals and / or
credit committees with delegated approval authorities as per Bank’s Board approved credit
policy, basis detailed appraisal memorandum that takes into account business and financial risks
of the proposal. The Retail segment, on the other hand, relies largely on standardized product
programs for credit risk assessment and approvals.
Credit Rating Framework
The Bank has put in place an internal rating system for Wholesale segment. The rating system
uses various models, depending upon size of company as well as specialized models for Non-
Banking Finance Companies (NBFC), Micro Finance Institutions (MFI) and Traders. The internal
rating system is a step towards migration to Advanced Approach for Credit Risk as per Basel III.
The rating system is based on a two dimensional rating framework, Borrower Rating and Facility
Rating. The Borrower Rating is determined first, which is based on assessment of Industry Risk,
Business Risk, Management Risk and Financial Risk along with Project Risk / Conduct of Account
(if applicable). This is calibrated to the Probability of Default (PD). The Facility Rating is based on
RBL Bank Limited Page 4 of 19

Borrower Rating, and takes into account security structure, therefore is a combination of PD and LGD (Loss Given Default).
Besides, the Bank continues to endeavor to have all facilities above ` 5 crore, to have external
ratings.
Credit Documentation
The objective of credit documentation is to clearly establish the debt obligation of borrower to
the Bank. In most cases, standardized set of documents are used as applicable, depending upon
the type of credit facilities and the borrower entity. In cases of credit facilities for structured
finance/ customized credit facilities for which standard documents have not been prescribed of
are not appropriate, the documentation would be done on case to case basis in consultation with
the Legal department/ outside lawyers.
Delegation of powers
The Bank has adopted ‘Four Eyes’ principle for credit approval. The principle dictates that
generally at least two people must create, examine and approve a credit proposal. Most of the
loan proposals require Joint Signature Approvals (JSA). This helps to avoid credit approval based
on judgment of one functionary alone, ensures compliance and reduces risk from errors &
prejudices. The Bank has also adopted Committee Approach for sanctioning high value credit
proposals. Board Credit Committee (BCC), Management Credit Committee (MCC), Central Credit
Committee (CCC) and Regional Credit Committee (RCC) approves credit proposals as per
authority matrix.
Post Sanction Monitoring
The Bank has evolved a process to ensure end-use of funds is for the purpose for which credit
limits are sanctioned. Further, it is ensured that the security obtained from borrowers by way of
hypothecation, pledge, etc. are not tampered with in any manner and are adequate.
Early Warning System (EWS)
The Bank has an Early Warning System (EWS) for early identification of problem loan accounts
across business segments. EWS works on the basis of various pre-defined symptoms. Such
accounts are closely monitored by Relationship Managers (RMs), Credit Risk Department, Special
Mention Assets (SMA) Group and CAD. These accounts are also monitored by Executive Credit
Committee (ECC) on a monthly basis.
Accounts which the Bank wishes to monitor closely are tagged as “Watch list” accounts. Accounts
which exhibit severe stress are tagged as “Adverse Labeled” accounts. Both these categories of
accounts receive special management attention. Such accounts are monitored very closely by
Senior Management and Board/ RMCB.
Based on RBI guidelines pertaining to “Early Recognition of Financial Distress, the Bank has also introduced SMA tagging into following 3 categories.
RBL Bank Limited Page 5 of 19

SMA-0 Principal or interest not overdue for more than 30 days but account showing signs of incipient stress
SMA-1 Principal or interest overdue between 31-60 days
SMA-2 Principal or interest overdue between 61-90 days
As per exposure thresholds specified by RBI, information related to large credit exposures are
being reported to CRILC (Central Repository of Information on Large Credit) that has been set-up
by RBI. Additionally, any new SMA-2 is also being reported to CRILC as per guidelines.
Reporting of an account as SMA-2 by one or more lending banks/notified NBFCs will trigger the mandatory formation of a Joint Lenders’ Forum and formulation of a Corrective Action Plan
(CAP).
Review / Renewal of Loans
After a credit facility is sanctioned and disbursed, follow-up and reviews are conducted at
periodic intervals. All funded and non-funded facilities granted to a customer are reviewed at
least once a year or at more frequent intervals, as warranted.
Credit Pricing
Pricing of loans / advances / cash credit / overdraft or any other financial accommodation
granted / provided / renewed or discounted usance bills is in accordance with the directives on
interest rates on advances issued by RBI as well as internal policies of the bank. The Bank has also
adopted Risk Based Pricing for different categories of customers.
Credit Portfolio Analysis
Credit portfolio analysis is carried out at periodic intervals to review entire credit portfolio of the
Bank to monitor growth, distribution, concentration, quality, compliance with RBI guidelines &
policies of the Bank, accounts under Watch-List/ Adverse Labeled category etc. The same is
monitored / reviewed by Senior Management/ Board / RMCB.
Loan Review Mechanism (LRM) and Credit Audit
The Bank has implemented LRM and Credit Audit framework in line with RBI guidelines. The
primary objective includes monitoring effectiveness of loan administration, compliance with
internal policies of Bank and regulatory framework, monitor portfolio quality, concentrations,
post sanction follow-ups and appraising top management with information pertaining to the
audit finding for further corrective actions.
RBL Bank Limited Page 6 of 19

Non-performing Assets (NPA)
An asset, including a leased asset, becomes non-performing when it ceases to generate income for the Bank.
A non-performing asset (NPA) is a loan or an advance where: i) Interest and/ or installment of principal remain overdue for a period of more than 90 days
in respect of a term loan. Any amount due to the bank under any credit facility is ‘overdue’ if it is not paid on the due date fixed by the bank.
ii) The bill remains overdue for a period of more than 90 days in the case of bills purchased
and discounted; iii) Installment of principal or interest thereon remains overdue for two crop seasons for short
duration crops, and one crop season for long duration crops; iv) The account remains ‘out of order’ in respect of an Overdraft/ Cash Credit (OD/CC). An
account is treated as ‘out of order’ if:
a. the outstanding balance remains continuously in excess of the sanctioned limit / drawing power for more than 90 days; or
b. where outstanding balance in principal operating account is less than sanctioned
limit / drawing power, but there are no credits continuously for 90 days as on the date of balance sheet or credits are not enough to cover interest debited during the same period;
v) The regular/ ad hoc credit limits have not been reviewed/ renewed within 180 days from
the due date / date of ad-hoc sanction; vi) Drawings have been permitted in working capital account for a continuous period of 90
days based on drawing power computed on the basis of stock statements that are more than 3 months old, even though the unit may be working or the borrower’s financial position is satisfactory;
vii) Bank Guarantees/ Letters of Credits devolved on the Bank which are not reimbursed by the
customer within 90 days from the date of payment; viii) A loan for an infrastructure / non-infrastructure project will be classified as NPA during any
time before commencement of commercial operations as per record of recovery (90 days overdue), unless it is restructured and becomes eligible for classification as ‘standard asset’;
ix) A loan for an infrastructure (/ non-infrastructure) project will be classified as NPA if it fails
to commence commercial operations within 2 years (/ 6 months) from original date of commencement of commercial operations, even if it is regular as per record of recovery, unless it is restructured and becomes eligible for classification as ‘standard asset’.
x) The amount of liquidity facility remains outstanding for more than 90 days, in respect of a
securitization transaction undertaken in terms of RBI guidelines on securitization; xi) In respect of derivative transactions, the overdue receivables representing positive mark-
to-market value of a derivative contract, if these remain unpaid for a period of 90 days from the specified due date for payment.
RBL Bank Limited Page 7 of 19

Non- performing Investments (NPI)
NPI is one where: i) Interest / installment (including maturity proceeds) is due and remains unpaid for more
than 90 days; ii) The fixed dividend is not paid in case of preference shares; iii) In case of equity shares, in the event investment in shares of any company is valued at Re.1
per company on account of non-availability of latest balance sheet in accordance with RBI instructions;
iv) If any credit facility availed by the issuer is NPA in the books of the bank, investment in any
of the securities issued by the same issuer would be treated as NPI and vice versa; v) The investments in debentures / bonds which are deemed to be in the nature of advance
would also be subjected to NPI norms as applicable to investments.
Quantitative Disclosures
(a) Total gross credit risk exposures*, Fund based and Non-fund** based separately: (` In Millions)
Category 31.12.2015
Fund Based 257,338.94
Gross Advances 183,768.10
Investment in Banking book 45,085.46
All other Assets 28,485.38
Non-Fund Based 60,452.65
Total 317,791.59
* Represents book value as on 31st March including bill re-discounted. ** Guarantees given on behalf of constituents, Acceptances, Endorsements & other Obligations, Liability on account of outstanding forward exchange contracts (credit equivalent amount).
(b) Geographic distribution of exposure*, Fund based & Non- fund** based separately
(` In Millions)
Category
31.12.2015
Domestic
Overseas
Total
Fund Based 256,875.40 463.54 257,338.94
Non-Fund Based 60,256.01 196.64 60,452.65
Total 317,131.41 660.18 317,791.59
* Represents book value as on 31st March including bills re-discounted; ** Guarantees given on behalf of constituents, Acceptances, Endorsements & other Obligations, Liability on account of outstanding forward exchange contracts (credit equivalent amount).
RBL Bank Limited Page 8 of 19
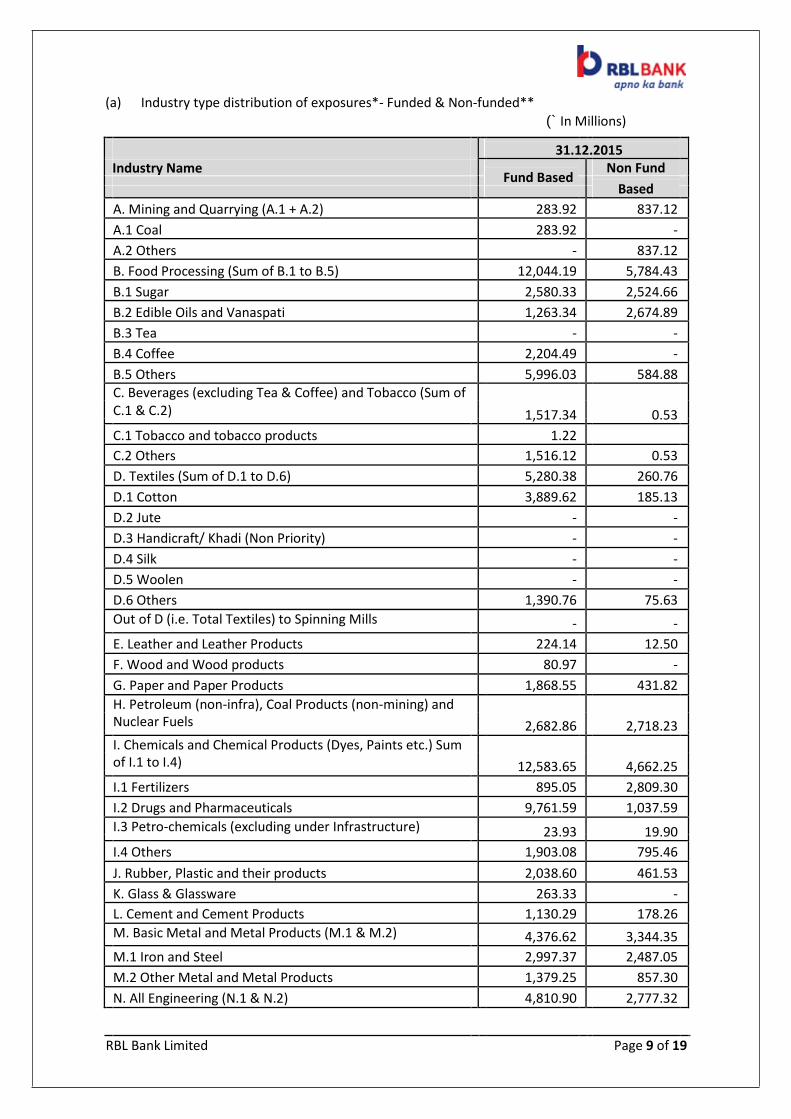
(a) Industry type distribution of exposures*- Funded & Non-funded** (` In Millions)
31.12.2015
Industry Name Fund Based
Non Fund
Based
A. Mining and Quarrying (A.1 + A.2) 283.92 837.12
A.1 Coal 283.92 -
A.2 Others - 837.12
B. Food Processing (Sum of B.1 to B.5) 12,044.19 5,784.43
B.1 Sugar 2,580.33 2,524.66
B.2 Edible Oils and Vanaspati 1,263.34 2,674.89
B.3 Tea - -
B.4 Coffee 2,204.49 -
B.5 Others 5,996.03 584.88
C. Beverages (excluding Tea & Coffee) and Tobacco (Sum of
C.1 & C.2) 1,517.34 0.53
C.1 Tobacco and tobacco products 1.22
C.2 Others 1,516.12 0.53
D. Textiles (Sum of D.1 to D.6) 5,280.38 260.76
D.1 Cotton 3,889.62 185.13
D.2 Jute - -
D.3 Handicraft/ Khadi (Non Priority) - -
D.4 Silk - -
D.5 Woolen - -
D.6 Others 1,390.76 75.63
Out of D (i.e. Total Textiles) to Spinning Mills - -
E. Leather and Leather Products 224.14 12.50
F. Wood and Wood products 80.97 -
G. Paper and Paper Products 1,868.55 431.82
H. Petroleum (non-infra), Coal Products (non-mining) and
Nuclear Fuels 2,682.86 2,718.23
I. Chemicals and Chemical Products (Dyes, Paints etc.) Sum
of I.1 to I.4) 12,583.65 4,662.25
I.1 Fertilizers 895.05 2,809.30
I.2 Drugs and Pharmaceuticals 9,761.59 1,037.59
I.3 Petro-chemicals (excluding under Infrastructure) 23.93 19.90
I.4 Others 1,903.08 795.46
J. Rubber, Plastic and their products 2,038.60 461.53
K. Glass & Glassware 263.33 -
L. Cement and Cement Products 1,130.29 178.26
M. Basic Metal and Metal Products (M.1 & M.2) 4,376.62 3,344.35
M.1 Iron and Steel 2,997.37 2,487.05
M.2 Other Metal and Metal Products 1,379.25 857.30
N. All Engineering (N.1 & N.2) 4,810.90 2,777.32
RBL Bank Limited Page 9 of 19

31.12.2015
Industry Name Fund Based
Non Fund
Based
N.1 Electronics 1,158.80 546.72
N.2 Others 3,652.10 2,230.60
O. Vehicles, Vehicle Parts and Transport Equipments 1,890.06 412.21
P. Gems and Jewellery 4,365.37 543.59
Q. Construction 9,285.54 7,064.72
R. Infrastructure (Sum R.1 to R.4) 7,125.67 12,319.89
R.1 Transport( Sum of R.1.1 to R.1.5) 860.00 1,358.37
R.1.1. Railways - 47.76
R.1.2 Roadways 750.00 487.39
R.1.3 Airport - -
R.1.4 Waterways - -
R.1.5 Ports 110.00 823.22
R.2 Energy (Sum of R.2.1 to R.2.4) 4,217.94 8,773.25
R.2.1 Electricity (generation-transportation and
distribution) 4,217.94 3,474.43
R.2.1.1 State Electricity Boards - -
R.2.1.2 Others - -
R.2.1.3 Power Generation 1,292.18 2,386.90
R.2.1.4 Power transmission / Distribution 2,925.76 1,087.53
R.2.1.5 Power -Non-Conventionalm Energy - -
R.2.2 Oil (storage and pipeline) - -
R.2.3 Gas/LNG (Storage and pipeline) - 5,298.82
R.2.4 Others - -
R.3 Telecommunication 1,976.71 2,188.27
R.4 Others 71.02 -
R.4.1 Water sanitation - -
R.4.2 Social & Commercial Infrastructure 71.02 -
R.4.3 Others - -
S. NBFC 10,868.45 603.76
T. Micro-Finance Institutions (MFI) 13,366.11 612.77
U. Housing Finance Companies (HFC) 3,572.03 230.41
V. Core Investment Companies (CIC) - 1,307.41
W. Traders 11,803.57 5,660.74
X. Other Services 21,145.85 3,061.73
Y. Other Industries 17,792.55 2,901.40
All Industries (Sum of A to Y) 150,400.94 56,187.73
Residuary Other Advances (to tally with book value) [a+b+c] 58,705.62 4,264.92
a. Education Loan 97.92 -
b. Aviation Sector 450.00 5.00
c. Other Residuary Advances 58,157.70 4,259.92
Total 209,106.56 60,452.65
RBL Bank Limited Page 10 of 19

As on December 31, the Bank's exposure to the industries stated below was more than 5% of the total gross credit exposure:
Percentage of the total
Sr. No. Industry classification gross credit exposure as
on 31-12-2015
1 Infrastructure 7.21%
2 Food Processing 6.61%
3 Traders 6.48%
4 Chemicals and Chemical Products (Dyes, Paints etc.) 6.40%
5 Construction 6.07%
6 NBFC (MFI) 5.19%
* Represents book value as on 31st December, gross advances and investments through credit substitutes;
** Guarantees given on behalf of constituents, Acceptances, Endorsements & other Obligations and Liability on account of outstanding forward exchange contracts (credit equivalent amount).
(b) Residual contractual maturity breakdown of assets as on 31.12.2015
(` In Millions)
Cash, balances Other assets
Maturity bucket with RBI and Investments Advances including
other banks fixed assets
1 day 5,818.12 4,370.24 3,829.70 -
2 to 7 days 744.41 3,822.69 3,740.45 363.06
8 to 14 days 345.72 4,068.89 2,671.98 254.90
15 to 28 days 468.69 2,741.96 5,904.96 -
29 days to 3 months 1,186.68 17,595.73 21,045.48 472.98
3 to 6 months 1,056.84 10,205.23 19,722.13 337.17
6 to 12 months 1,311.55 29,556.27 45,332.46 1,245.69
1 to 3 years 3,095.95 19,125.37 55,142.94 2,188.17
3 to 5 years 4,993.19 1,761.40 11,200.86 359.43
Over 5 years 275.96 7,435.01 14,405.67 3,966.88
Total 19,297.09 100,682.79 182,996.62 9,188.29
(Note: Classification of assets and liabilities under the different maturity buckets in the above table is based on the same estimates and assumptions as used by the Bank for compiling the return submitted to the RBI.)
RBL Bank Limited Page 11 of 19

(c) Asset Quality
NPA Ratios
(` In Millions)
Particulars 31.12.2015
Gross NPAs to gross advances 1.08% Net NPAs to net advances 0.69%
Net NPAs
(` In Millions)
Particulars 31.12.2015
Gross NPAs 1991.65
Less: Provisions 730.53
Net NPAs 1261.12
Classification of gross NPAs
(` In Millions)
Particulars 31.12.2015
Sub-standard 1,518.81
Doubtful* 262.41
Doubtful 1 223.33
Doubtful 2 30.06
Doubtful 3 9.02
Loss 210.43
Total Gross NPAs 1,991.65
* Doubtful 1, 2 and 3 categories correspond to the period for which asset has been doubtful viz., up to one
year (‘Doubtful 1’), one to three years (‘Doubtful 2’) and more than three years (‘Doubtful 3’), Note: NPAs include all assets that are classified as non-performing.
Movement of Gross NPAs
(` In Millions)
Particulars
31.12.2015
Opening balance as on 01.04.2015 1,112.35
Additions during the year 1,657.04
Reductions during the year 777.74
Closing balance 1,991.65
Movement of Provisions for NPAs
(` In Millions)
Particulars 31.12.2015
Opening balance as on 01.04.2015 726.39
Provisions made during the year 564.63
Write-off during the year 551.66
Any other adjustment, including transfer between provisions 0.00
Write-back of excess provisions 8.83
Closing balance 730.53
RBL Bank Limited Page 12 of 19

Recoveries from written off accounts aggregating of ` 6.60 Millions and write-offs aggregating ` 551.66 Millions have been recognized in the statement of profit and loss for 9 month ended 31.12.2015.
(d) Non-performing Investment (` In Millions)
Particulars 31.12.2015
Gross non-performing investments 155.00
Less: Provisions 38.75
Net non-performing investments 116.25
Provision for depreciation on Investment
(` In Millions)
Particulars 31.12.2015
Opening balance 24.30
Provisions made during the year 155.50
Write-off 0.00
Any other adjustment, including transfer between provisions 0.00
Write-back of excess provisions 31.30
Closing balance 148.50 Movement in provisions held towards depreciation on investments have been reckoned on a yearly basis
Provision for Standard Asset
(` In Millions)
Particulars 31.12.2015
Opening balance 655.01
Provisions made/reversed during the year 155.00
Any other adjustment, including transfer between provisions* 0.00
Closing balance 810.01 Refers to foreign currency translation adjustment relating to provision for standard assets in the Bank’s overseas branches. Geographic Distribution
(` In Millions)
Particulars 31.12.2015
Domestic
Overseas
Total
Gross NPA 1,991.66 0.00 1,991.66
Provisions for NPA 730.53 0.00 730.53
Provision for standard assets 810.01 0.00 810.01
(e) Industry-Wise Distribution (` In Millions)
For nine months ended
As on 31.12.2015 31.12.2015
Industry Name
Provision
Gross NPA Provisions for
Write offs Provisions
for NPA standard for NPA
assets
A. Mining and Quarrying (A.1 + A.2) - - 1.14 - -
A.1 Coal - - 1.14 - -
RBL Bank Limited Page 13 of 19

For nine months ended
As on 31.12.2015 31.12.2015
Industry Name
Provision
Gross NPA
Provisions for
Write offs
Provisions
for NPA standard for NPA
assets
A.2 Others - - - - -
B. Food Processing (Sum of B.1 to B.5) - - 46.42 1.34 -
B.1 Sugar - - 10.29 1.34 -
B.2 Edible Oils and Vanaspati - - 5.61 - -
B.3 Tea - - - - -
B.4 Coffee - - 4.94 - -
B.5 Others - - 25.58 - -
C. Beverages (excluding Tea & Coffee) and
Tobacco (Sum of C.1 & C.2) -
-
5.83 -
-
C.1 Tobacco and tobacco products - - - - -
C.2 Others - - 5.83 - -
D. Textiles (Sum of D.1 to D.6) - - 29.77 - -
D.1 Cotton - - 14.88 - -
D.2 Jute - - - - -
D.3 Handicraft/ Khadi (Non Priority) - - - - -
D.4 Silk - - - - -
D.5 Woolen - - - - -
D.6 Others - - 14.89 - -
Out of D (i.e.Total Textiles) to -
-
- -
-
Spinning Mills
E. Leather and Leather Products - - 0.81 0.64 -
F. Wood and Wood products 0.32 0.05 0.32 - 0.05
G. Paper and Paper Products 7.96 1.99 7.56 - 0.80
H. Petroleum (non-infra), Coal Products
(non-mining) and Nuclear Fuels -
-
10.89 -
-
I. Chemicals and Chemical Products (Dyes,
Paints etc.) Sum of I.1 to I.4) -
-
55.29 -
-
I.1 Fertilisers - - 5.36 - -
I.2 Drugs and Pharmaceuticals - - 41.11 - -
I.3 Petro-chemicals (excluding under - -
Infrastructure) 0.24 - -
I.4 Others - - 8.59 - -
J. Rubber, Plastic and their products - - 7.46 - -
K. Glass & Glassware - - 1.05 - -
L. Cement and Cement Products - - 4.44 - -
M. Basic Metal and Metal Products
(M.1 & M.2) 151.46 30.17
14.23 -
30.17
M.1 Iron and Steel - - 12.04 - -
M.2 Other Metal and Metal Products 151.46 30.17 2.19 - 30.17
N. All Engineering (N.1 & N.2) 403.59 160.95 24.45 - 163.92
RBL Bank Limited Page 14 of 19

For nine months ended
As on 31.12.2015 31.12.2015
Industry Name
Provision
Gross NPA
Provisions for
Write offs
Provisions
for NPA standard for NPA
assets
N.1 Electronics 1.94 0.29 5.72 - 0.40
N.2 Others 401.65 160.66 18.73 - 163.52
O. Vehicles, Vehicle Parts and Transport 14.67 2.20 9.72
Equipments -
2.20
P. Gems and Jwellery - - 18.56 - -
Q. Construction 41.66 11.64 47.52 121.51 0.01
R. Infrastructure (Sum R.1 to R.4) - - 26.87 - -
R.1 Transport( Sum of R.1.1 to R.1.5) - - 3.44 - -
R.1.1. Railways - - - - -
R.1.2 Roadways - - 3.00 - -
R.1.3 Airport - - - - -
R.1.4 Waterways - - - - -
R.1.5 Ports - - 0.44 - -
R.2 Energy (Sum of R.2.1 to R.2.4) - - 15.31 - -
R.2.1 Electricity (generation-transportation -
-
and distribution) 15.31 -
-
R.2.1.1 State Electricity Boards - - - - -
R.2.1.2 Others - - - - -
R.2.1.3 Power Generation - - 5.41 - -
R.2.1.4 Power Transmission/Distribution - - 9.90 - -
R.2.2 Oil (storage and pipeline) - - - - -
R.2.3 Gas/LNG (Storage and pipeline) - - - - -
R.2.4 Others - - - - -
R.3. Telecommunication - - 7.91 - -
R.4 Others - - 0.21 - -
R.4.1 Water sanitation - - - - -
R.4.2 Social & Commercial Infrastructure - - 0.21 - -
R.4.3 Others - - - - -
S. NBFC - - 23.94 - -
T. Micro-Finance Institutions (MFI) - - 38.28 - -
U. Housing Finance Companies (HFC) - - 7.56 - -
V. Core Investment Companies (CIC) - - - - -
W. Traders - - 41.05 - -
X. Other Services - - 90.93 - -
S. Other Industries 55.66 13.30 114.09 - 10.72
All Industries (Sum of A to S) 675.34 220.30 628.17 123.50 207.87
Residuary Other Advances (to tally with 1,316.31 510.23
book value) [a+b+c] 181.83 428.16 356.76
a. Education Loan 0.04 0.04 - - -
RBL Bank Limited Page 15 of 19

For nine months ended
As on 31.12.2015 31.12.2015
Industry Name
Provision
Gross NPA
Provisions for
Write offs
Provisions
for NPA standard for NPA
assets
b. Aviation Sector - - 3.38 - -
c. Other Residuary Advances 1,316.27 510.19 178.45 428.16 356.76
Total Loans and Advances
1,991.65 730.53 810.00 551.66 564.63
IV. Credit Risk: Disclosures for Portfolios Subject to the Standardized Approach
Ratings used under Standardized Approach:
As stipulated by RBI, the Bank makes use of ratings assigned to domestic counterparties by following Eligible Credit Assessment Institutions (ECAI’s) namely:
- CRISIL Limited; - CARE Limited
- India Ratings & Research Private Limited (earlier known as Fitch India); - ICRA Limited; - Brickwork Ratings India Pvt. Ltd (Brickwork); - SMERA.
The Bank is using the ratings assigned by the following international credit rating agencies, approved by the RBI, for risk weighting claims on overseas entities:
- Fitch Ratings - Moody’s - Standard & Poor’s
The Bank reckons external ratings for risk weighting purposes, if the external rating assessment complies with the guidelines stipulated by RBI.
Types of exposures for which each agency is used:
The Bank has used the solicited ratings assigned by the above approved credit rating agencies for
all eligible exposures, both on balance sheet and off balance sheet, whether short term or long
term, as prescribed in the RBI guidelines.
Process used for application of issue ratings to comparable assets in banking book:
Key aspects of the Bank’s external ratings application framework are as follows:
1. The Bank uses only those ratings that have been solicited by the counterparty;
2. Where the facility provided by the Bank possesses rating assigned by approved ECAI, the risk weight of the claim is based on this rating;
RBL Bank Limited Page 16 of 19

3. The Bank also reckons external rating at the borrower (issuer) level as follows:
a. In case the Bank does not have exposure in a rated issue, the Bank would use the
long term issue rating (inferred rating) for its comparable unrated exposures to the same borrower, provided that the Bank’s exposures is pari-passu or senior and of similar or shorter maturity as compared to the rated issue, then this rating is applied on all unrated facilities of the borrower;
b. Where a short term rating is used as an inferred rating for a short term un-rated
claim, the risk weight applied shall be one notch higher than corresponding to the risk weight of the inferred rating.
Quantitative Disclosures
For exposure amounts after risk mitigation subject to the standardized approach, amount of
Bank's exposure (rated and unrated) in the following three major risk buckets as well as those
that are deducted:
(` In Millions)
Particulars 31.12.3015
- Below 100% risk weight 201,548.39
- 100% risk weight 97,693.84
- More than 100% risk weight 18,549.35
- Deducted -
Treatment of undrawn exposures
As required by regulatory norms, the Bank holds capital even for the undrawn portion of credit
facilities which are not unconditionally cancellable without prior notice by the Bank, by
converting such exposures into a credit exposure equivalent based on the applicable Credit Conversion Factor (“CCF”). For credit facilities which are unconditionally cancellable without prior notice, the Bank applies a CCF of zero percent on the undrawn exposure.
Leverage Ratio Disclosure
The leverage ratio act as a credible supplementary measure to the risk based capital
requirement. The Bank’s Leverage Ratio as of Dec 31, 2015 is 7.56% as against minimum leverage
ratio of 4.5%. The Bank’s leverage ratio calculated in accordance with RBI guidelines under
consolidated framework is as follows:
1. Leverage ratio common disclosure as of December 31, 2015 (` In Millions)
S. No.
Leverage ratio framework
Amount
On-balance sheet exposures
1 On-balance sheet items (excluding derivatives and SFTs, but including collateral) 307,440.46
2 (Asset amounts deducted in determining Basel III Tier 1 capital) 300.70
RBL Bank Limited Page 17 of 19

3 Total on-balance sheet exposures (excluding derivatives and SFTs)
307,139.76
(sum of lines 1 and 2)
Derivative exposures
4 Replacement cost associated with all derivatives transactions (i.e. net
1,924.33
of eligible cash variation margin)
5 Add-on amounts for PFE associated with all derivatives transactions 4,235.10
6 Gross-up for derivatives collateral provided where deducted from the
-
balance sheet assets pursuant to the operative accounting framework
7 (Deductions of receivables assets for cash variation margin provided
-
in derivatives transactions)
8 (Exempted CCP leg of client-cleared trade exposures) -
9 Adjusted effective notional amount of written credit derivatives -
10 (Adjusted effective notional offsets and add-on deductions for written
-
credit derivatives)
11 Total derivative exposures (sum of lines 4 to 10) 6,159.43
Securities financing transaction exposures
12 Gross SFT assets (with no recognition of netting), after adjusting for
2,800.00
sale accounting transactions
13 (Netted amounts of cash payables and cash receivables of gross SFT
-
assets)
14 CCR exposure for SFT assets -
15 Agent transaction exposures -
16 Total securities financing transaction exposures (sum of lines 12 to 15) 2,800.00
Other off-balance sheet exposures
17 Off-balance sheet exposure at gross notional amount 97,708.43
18 (Adjustments for conversion to credit equivalent amounts) 55,142.60
19 Off-balance sheet items (sum of lines 17 and 18) 42,565.83
Capital and total exposures
20 Tier 1 capital 27,117.17
21 Total exposures (sum of lines 3, 11, 16 and 19) 358,665.01
Leverage ratio
22 Basel III leverage ratio 7.56%
RBL Bank Limited Page 18 of 19

2. Comparison of accounting assets and leverage ratio exposure
(` In Millions)
S.
Particulars
Amount
No.
1 Total consolidated assets as per published financial statements
312,164.79
Adjustment for investments in banking, financial, insurance or
2 commercial entities that are consolidated for accounting purposes but -
outside the scope of regulatory consolidation
Adjustment for fiduciary assets recognised on the balance sheet
3 pursuant to the operative accounting framework but excluded from the -
leverage ratio exposure measure
4 Adjustments for derivative financial instruments 4,235.10
5 Adjustment for securities financing transactions (i.e. repos and similar
-
secured lending)
Adjustment for off-balance sheet items (i.e. conversion to credit 42,565.83
6 equivalent amounts of off- balance sheet exposures)
7 Other adjustments
(300.70)
8
Leverage ratio exposure
358,665.01
3. Reconciliation of total published balance sheet size and on balance sheet exposure under common disclosure
(` In Millions)
S.
Particulars
Amount
No.
1 Total consolidated assets as per published financial statements 312,164.79
Replacement cost associated with all derivatives transactions, i.e. net 1,924.33
2 of eligible cash variation margin
Adjustment for securities financing transactions (i.e. repos and similar
3 secured lending) 2,800.00
4 Adjustment for entitles outside the scope of regulatory consolidation -
5
On-balance sheet exposure under leverage ratio (excluding
307,440.46
derivatives and SFTs)
RBL Bank Limited Page 19 of 19