barry shiver
TRANSCRIPT
Forestry Methods and ApplicationsObjective Timber Management: The
Key to Higher Returns
Barry D. Shiver
President, Smarter Forestry

Objective?
2
What I mean by Objective Decisions
• Decisions based on knowledge AND Data
• As a forestry student learned “symptoms” of when a stand needed to be thinned
• A Dr examines us when we are sick and makes prescriptions based on “symptoms” AND if possible test results (Data)
3

Objectives Change with Owners so Decision may Change given same Data
• A 75 year old private landowner likely views regeneration expenses differently than an institutional investor looking for situations in which to invest available capital
• Landowners have different primary objectives• Keep Land in Family• Aesthestics & Recreation• Wildlife Habitat• Financial Returns
4

Management Decisions Affect Stand Development
5
Age 6
Age 50
Only talking Plantations Management Decisions That are Made:
• Site Preparation
• Genetics
• Planting Density
• Herbaceous Weed Control
• Fertilization
• Woody Release
• Thinning• Number, Timing, Intensity, Which Trees
6

Factors that Impact Objective Decisions
• Markets• Remember ours is a long term investment and current markets are
not as important as what markets will be in 15-30 years
• High pulp stumpage prices may dictate no thins
• Low pulp stumpage prices may dictate thinning to produce solid wood
• No CNS or small log market (premium) may dictate 1 thin vs 2 thins
• Site Quality• Some sites are not high probability risks for responses
• Treatment Costs• These vary. Cost of bedding is different depending on location
7
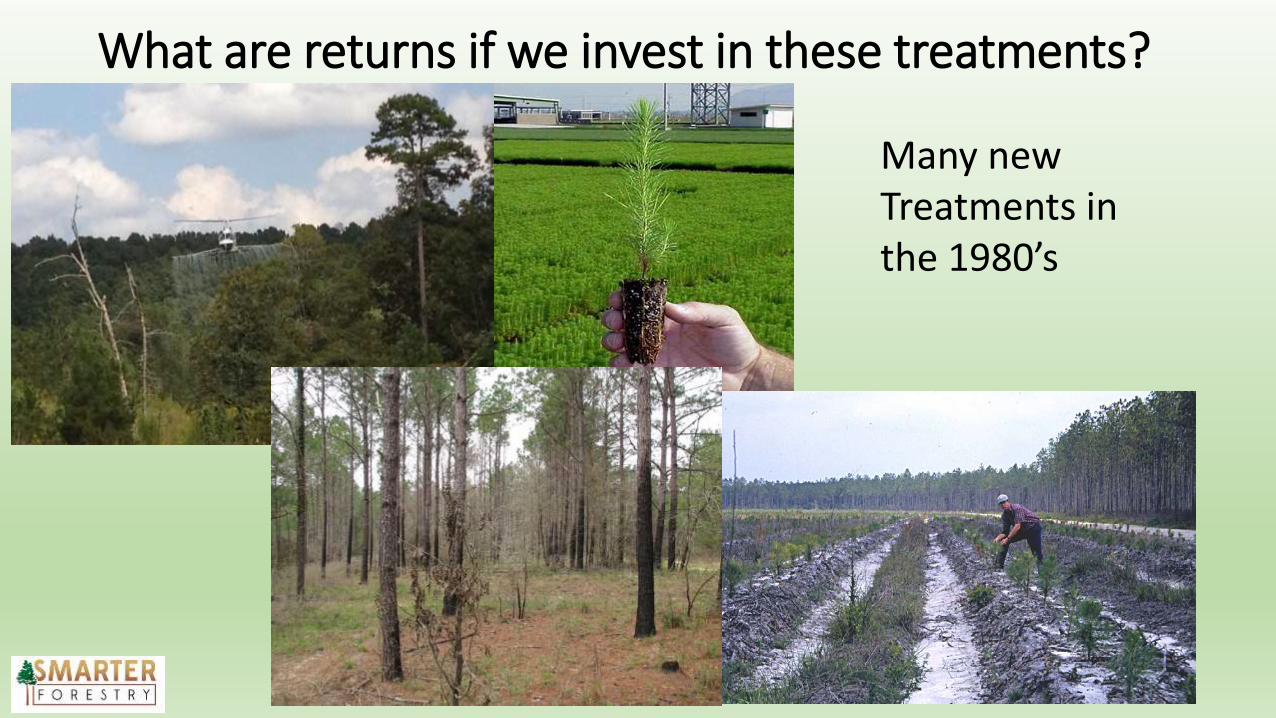
What are returns if we invest in these treatments?
8
Many new Treatments in the 1980’s
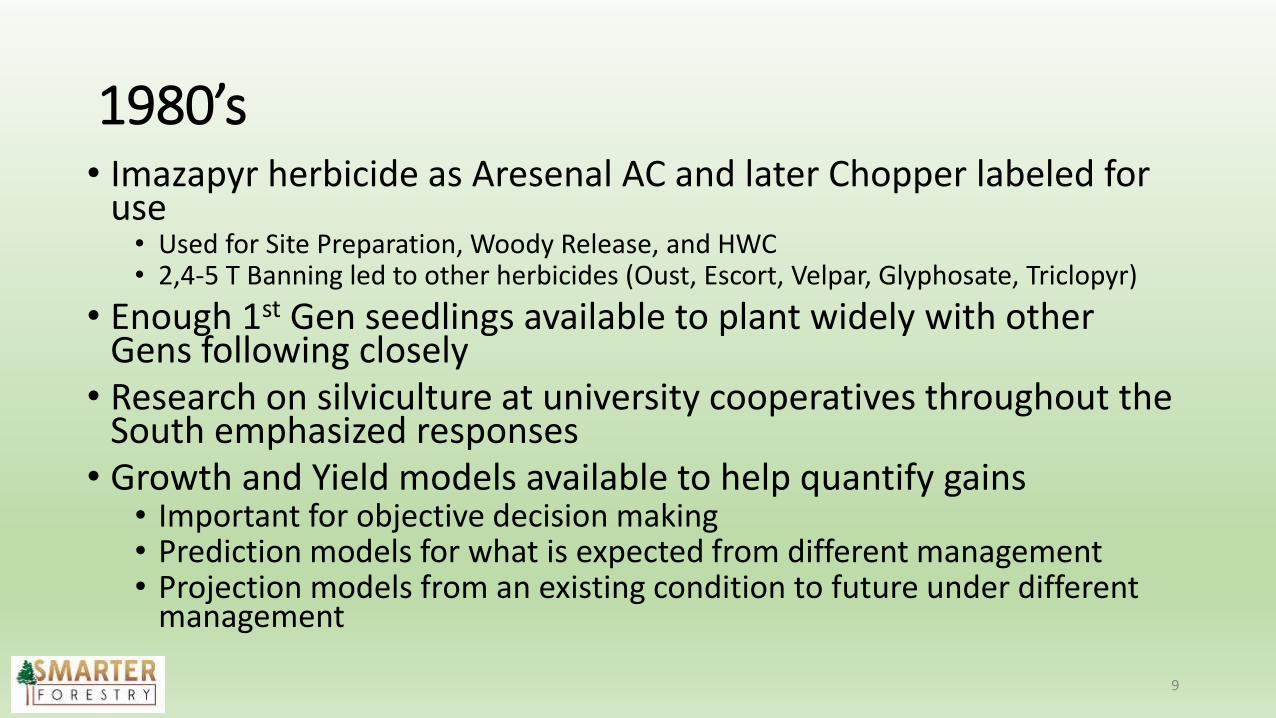
1980’s• Imazapyr herbicide as Aresenal AC and later Chopper labeled for
use• Used for Site Preparation, Woody Release, and HWC• 2,4-5 T Banning led to other herbicides (Oust, Escort, Velpar, Glyphosate, Triclopyr)
• Enough 1st Gen seedlings available to plant widely with other Gens following closely
• Research on silviculture at university cooperatives throughout the South emphasized responses
• Growth and Yield models available to help quantify gains• Important for objective decision making• Prediction models for what is expected from different management• Projection models from an existing condition to future under different
management
9

Foresters are Slow to Change• We have long term investments
• Mistakes made in Management Choices are usually slow to show up if they become apparent at all - Blame it on weather; poor site, etc.
• Especially if money is to be spent, we want proof
• Insurance companies mine Data to determine how we will age and ultimately when we will die
• On some of us they are wrong
• On the majority of us though, they get it right and in doing so make money
• Data and models in forestry are similar
10
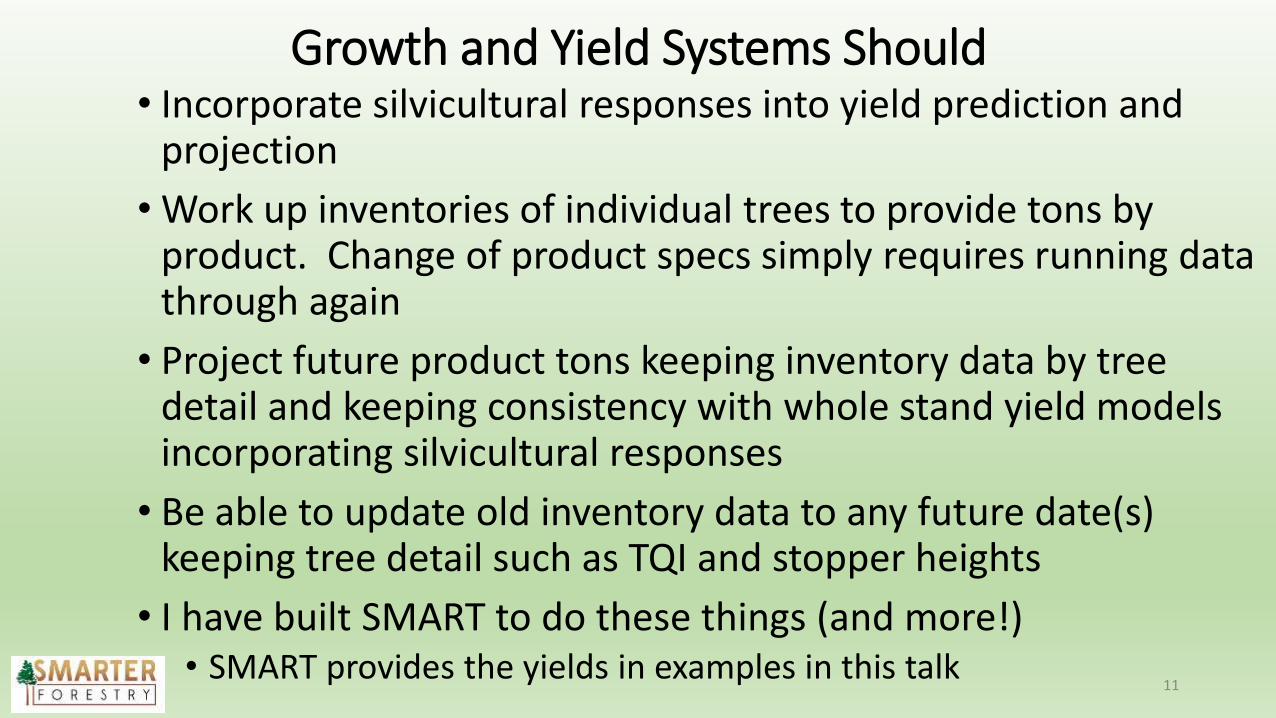
Growth and Yield Systems Should• Incorporate silvicultural responses into yield prediction and
projection
• Work up inventories of individual trees to provide tons by product. Change of product specs simply requires running data through again
• Project future product tons keeping inventory data by tree detail and keeping consistency with whole stand yield models incorporating silvicultural responses
• Be able to update old inventory data to any future date(s) keeping tree detail such as TQI and stopper heights
• I have built SMART to do these things (and more!)• SMART provides the yields in examples in this talk
11

General Types of Silvicultural Responses
0
1
2
3
4
5
6
0 5 10 15 20 25 30
Years since treatment
Res
po
nse A Resp
B Resp
C Resp
An A response keeps getting larger and larger from time of treatment forward
A B response gets larger for awhile and then levels out and maintains an absolute realized gain
A C response gains quickly, peaks, and the response falls back to or below (some call this a D) the level of the untreated stand

Stand Characteristics Impacted by Treatments• The two stand characteristics most often impacted by silvicultural
treatments are dominant height and basal area per acre
• Of course dominant height development influences estimation of site index and is partially why foresters change site index to estimate response
• This can cause real issues, especially if the silvicultural response is a C type response and height gets measured at or near the peak of the response.
• Can result in an overestimate of eventual site index obtained
14
0.0
10.0
20.0
30.0
40.0
50.0
60.0
70.0
80.0
90.0
5 6 7 8 9 10 11 12 13 14 15 16 17 18 19 20 21 22 23 24 25 26 27 28 29 30
Do
min
ant
Hei
ght
(ft)
Age
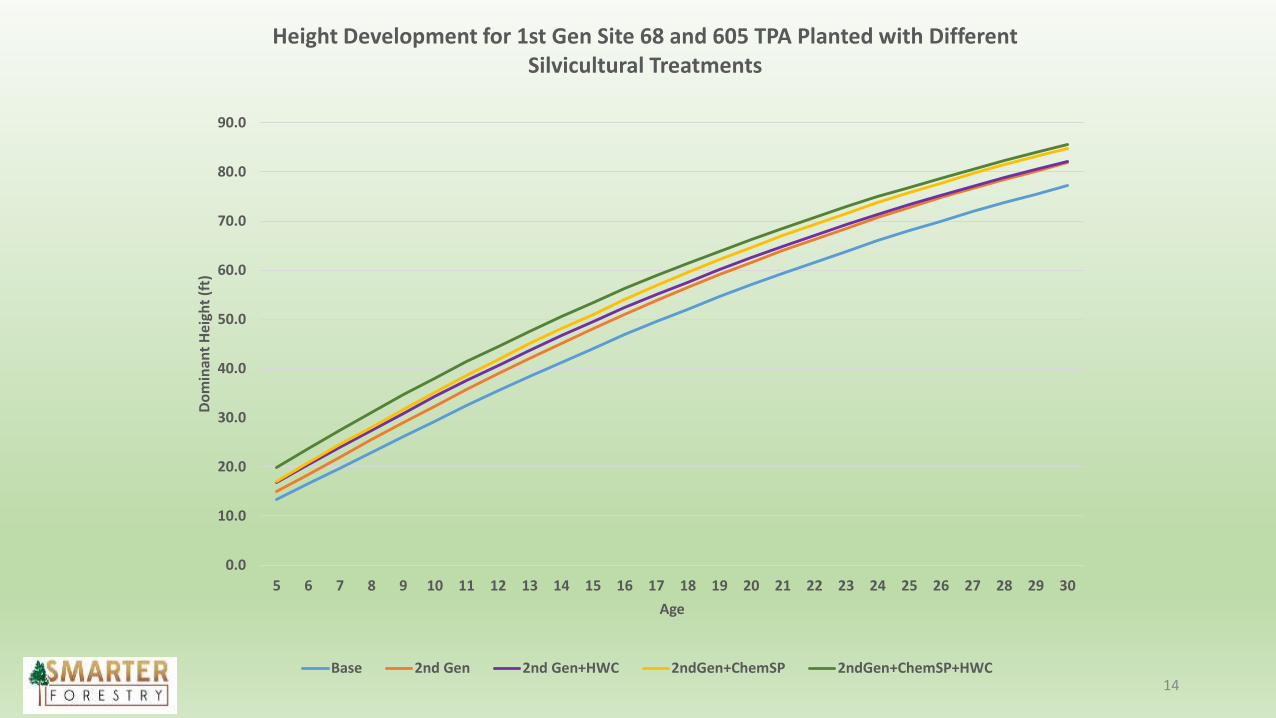
Height Development for 1st Gen Site 68 and 605 TPA Planted with Different Silvicultural Treatments
Base 2nd Gen 2nd Gen+HWC 2ndGen+ChemSP 2ndGen+ChemSP+HWC

Adding Height Automatically Adds Basal Area per Acre
• Stands that grow taller faster (higher site index) also develop dbh faster and therefore have a higher basal area
• For many silvicultural treatments adding height increment, even correctly, does not add enough basal area per acre increment
• So, a good treatment response estimate must take that into account

16
0.0
50.0
100.0
150.0
200.0
250.0
5 6 7 8 9 10 11 12 13 14 15 16 17 18 19 20 21 22 23 24 25 26 27 28 29 30
Bas
al A
rea/
Acr
e (f
t2)
Age
Basal Area Development for 1st Gen Site 68 and 605 TPA Planted with Different Silvicultural Treatments
Base 2nd Gen 2nd Gen+HWC 2nd Gen+ChemSP 2ndGen+ChemSP+HWC

With these adjusted height and basal area inputs
• Can estimate product yields for different
• Site Preparation• Mechanical and Chemical
• Genetics
• HWC
• These are all regeneration treatments (costs)
17
What about Existing Stands?
18
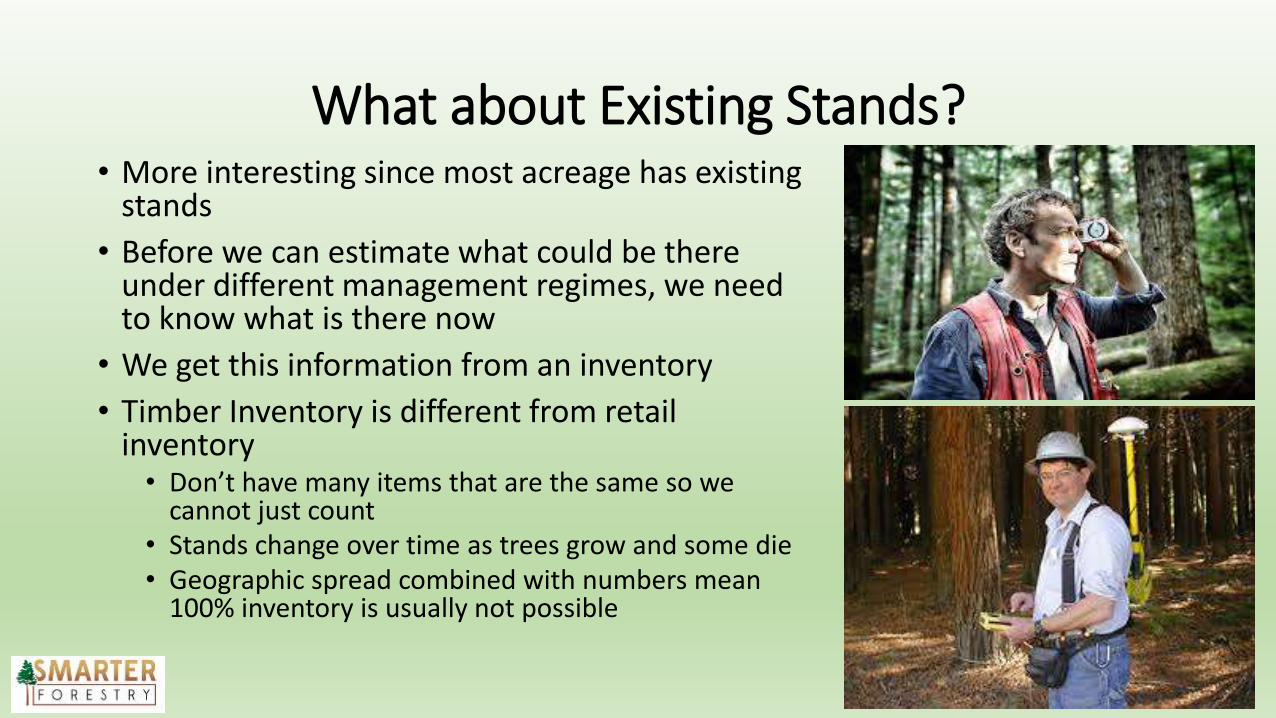
• More interesting since most acreage has existing stands
• Before we can estimate what could be there under different management regimes, we need to know what is there now
• We get this information from an inventory
• Timber Inventory is different from retail inventory• Don’t have many items that are the same so we
cannot just count• Stands change over time as trees grow and some die• Geographic spread combined with numbers mean
100% inventory is usually not possible

Inventory
• When integrated forest products companies owned a majority of the plantation acres, money spent on inventory was considered a cost
• Inventory did not have to be exact. The organization who owned the plantation also owned the pulp mill, sawmill, etc.
• Those organizations also bought wood and often had procurement foresters
• Procurement inventory needed a snapshot of timber value at current time – Future of stand not important
19

Procurement Inventory
• Typically, tally of trees by current product, dbh class (1 or 2 inch) and merchantable height (tally cards)
• Often “worked up” by hand after cumulative tally – no stats
• No consideration for future condition or value
• Often provided good current value information
20
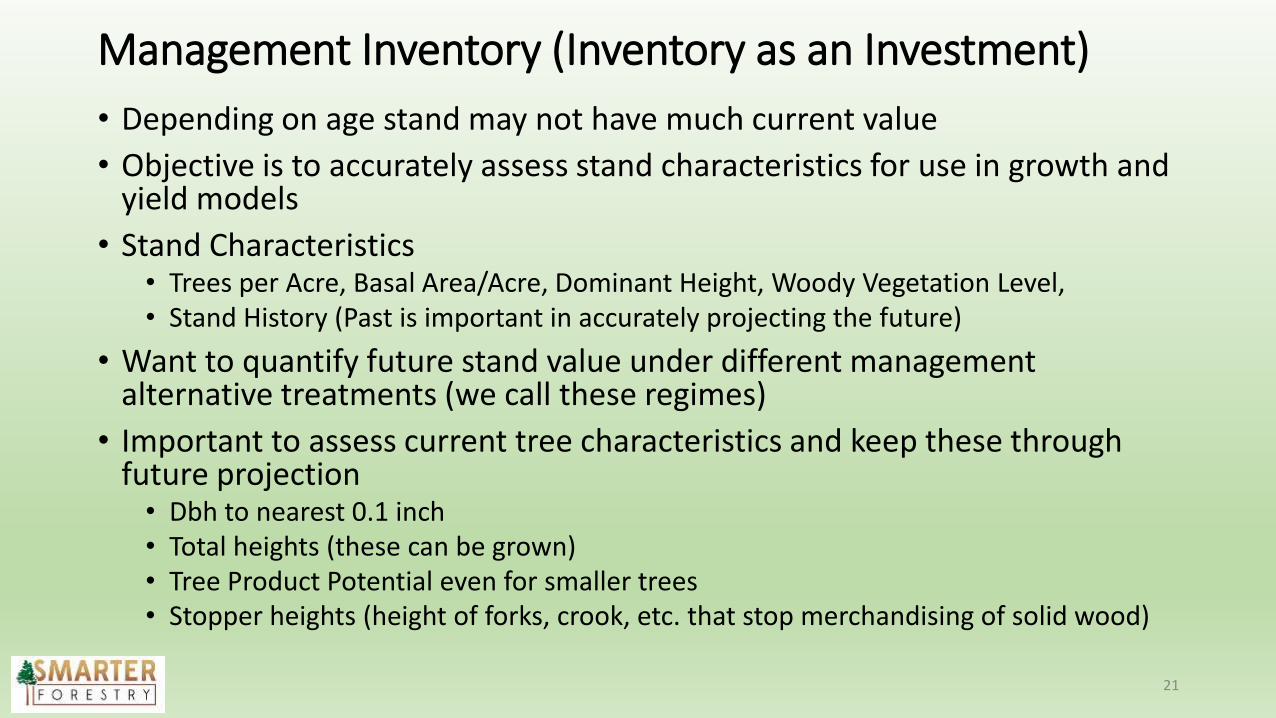
Management Inventory (Inventory as an Investment)
• Depending on age stand may not have much current value
• Objective is to accurately assess stand characteristics for use in growth and yield models
• Stand Characteristics• Trees per Acre, Basal Area/Acre, Dominant Height, Woody Vegetation Level,• Stand History (Past is important in accurately projecting the future)
• Want to quantify future stand value under different management alternative treatments (we call these regimes)
• Important to assess current tree characteristics and keep these through future projection• Dbh to nearest 0.1 inch• Total heights (these can be grown)• Tree Product Potential even for smaller trees• Stopper heights (height of forks, crook, etc. that stop merchandising of solid wood)
21

Management Inventory Projection• Important to keep tree information such as TQI, stopper heights, etc.
for each year going forward
• Want to determine value at each year going forward – need for dbh to nearest 0.1 is so all trees do not cross threshold to next dbh class at same time.
• Determine value to all future years for each potential management regime (thin, unthin, thin and then release, etc.)
• When to harvest stand (set rotation age) depends partially on the highest value among alternative management regimes
• Rest of decision depends on what we can replace the stand with • Sell land for an alternative high value use
• Replace with a stand with better genetics and silviculture that will grow faster
22

Existing Stand Valuation
• For an existing stand we calculate the NPV using the following approach:
FE NPVNPVNPV
NPV = overall NPV for the existing stand
NPVE = NPV for all expected cash flows for the existing stand
NPVF = NPV for all expected cash flows for the land following harvest of the existing stand

Existing Stand Valuation
• When the property is to stay in timber production following harvest of the existing stand “n” years in the future NPVF is the present value of the BLV of the stand that will be put into the ground following harvest:
n
F
i
BLV
FNPV)1(
• When the land will be sold following harvest of the existing stand “n” years in the future NPVF
is the present value of the land value that is expected at this point in time:
n
F
i
Land
FNPV)1(

Say we have the following stand information
25
Age 12
Trees per Acre 506
Basal Area 115.8
Dominant HT 41
Predicted Stand Table
Dbh TPA
1 0.0
2 0.4
3 5.1
4 26.1
5 79.2
6 151.5
7 161.0
8 73.0
9 9.7
506.0
Actual Stand TableDbh TPA TQI
2 1.0 33 12.0 34 43.0 35 90.0 36 127.0 37 23.4 37 106.6 18 10.2 38 62.8 19 2.6 39 21.4 1
10 0.5 310 5.5 1
506.0
What is TQI? If a tree will never make more than pulpwood in the opinion of the cruiser it is given a TQI of 3. This can be from form, defect, or size. If the tree will make solid wood the tree is given a TQI of 1.

Grow the stand to age 14
26
3. 5.63 3
4. 28.30 3
5. 65.81 3
6. 102.42 3
7. 66.32 3
8. 16.05 3
9. 6.68 3
10. 1.78 3
11. 0.32 3
7. 52.79 1
8. 80.23 1
9. 42.98 1
10. 14.90 1
11. 3.70 1
Left hand diameter distribution is from predictedRight hand is grown from actual inventory detail at age 12Many organizations use predicted to “update” their inventory – Not ideal
Dbh TPA
3 1.9
4 12.4
5 45.2
6 107.5
7 159.5
8 122.7
9 35.9
10 2.5
Dbh TPA TQI

Thin by size (no TQI) – a Spatial ThinningThinned to Basal Area 63
Hardly an economic thinning with only about
17 tons removed.
Cash flow at thinning: $114.70
TQI added for information – would not normally
know this
Dbh TQI Residual
3. 3 1.25
4. 3 8.12
5. 3 23.15
6. 3 42.67
7. 3 31.93
8. 3 9.11
9. 3 4.37
10. 3 1.32
11. 3 0.26
7. 1 25.41
8. 1 45.56
9. 1 28.12
10. 1 11.04
11. 1 3.06235.37

Another way would be to ignore the residual BA and take out 90% of TQI=3 and 20% of “1”s
Dbh TQI Residual
3. 3 0.6
4. 3 2.8
5. 3 6.6
6. 3 10.2
7. 3 6.6
8. 3 1.6
9. 3 0.7
10. 3 0.2
11. 3 0.0
7. 1 42.2
8. 1 64.2
9. 1 34.4
10. 1 11.9
11. 1 3.0185.0
The residual BA here is 63 which is why I used it for the previous thinning. Here, however, the tons removed is 35.6 tons/acThe cash flow from the thinning is $284.75AND, most importantly, the trees left have fewer trees left to compete with over time and with only 185 tpa dbh growth will be larger as compared with 235
Only 29 TQI 3 Trees Remaining
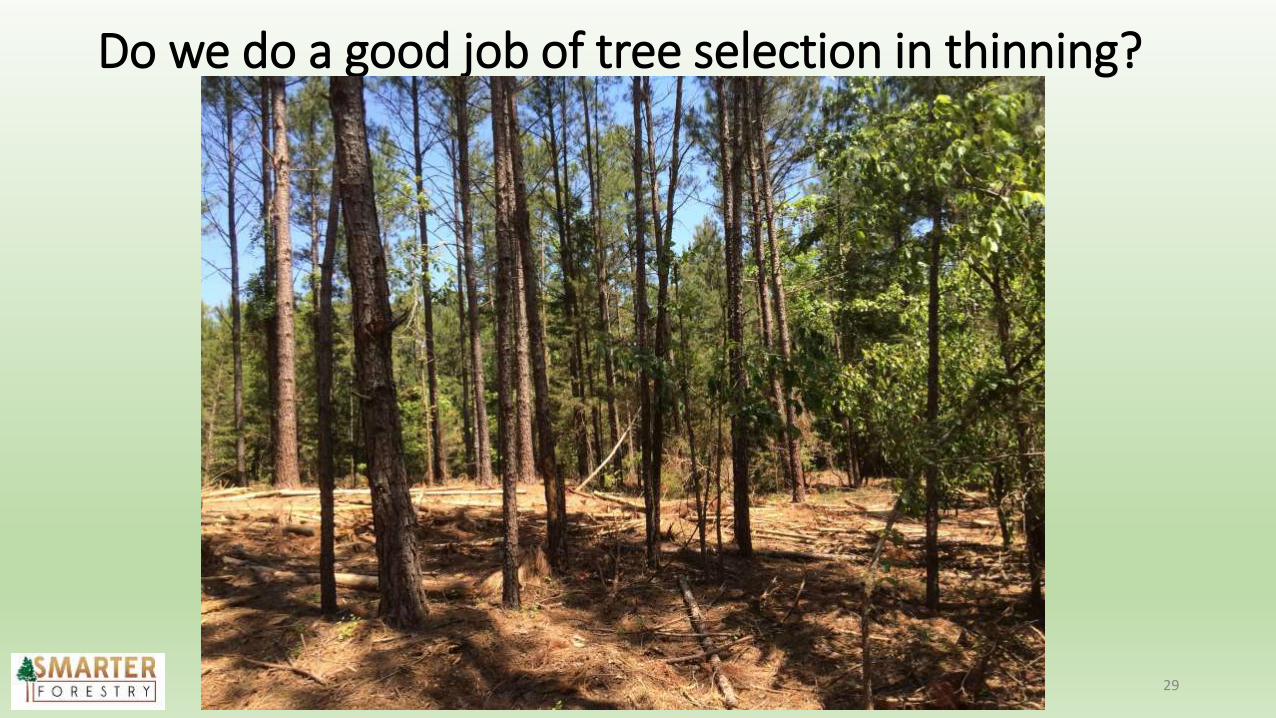
Do we do a good job of tree selection in thinning?
29

Do we do a good job of tree selection in thinning?
30
The average dbh tree in this stand is about the size of the tree on the right. Note the small and crooked tree to its left and the tree in the background that is two trees. This stand is not being thinned to maximize future value

Stumpage Prices for Valuation
31
Min Max StumpageProducts Dbh Dbh Prices ($/ton)Pulpwood 4.5 40.0 $8.00Chip-n-Saw 8.5 11.5 $13.00Sawtimber 11.5 40.0 $28.00
All first thin material valued as pulpwood at $8.00/ton

Differences in Financial Return by Choosing the Right Trees to Remove
Thin by TQI Thin by Size
Pulpwood (3) 17.6 tons 45.5
Pulpwood (1) 0.0 tons 0.0
CNS (1) 42.6 tons 24.3
Saw(1) 65.2 tons 48.1
Rotation Age 29 years 27
Harvest Value $2520 $2024
NPV $1289 $1094
The $1289 reflects the $284.75 cash flow at age 14 vs. $114.70
Would this make a difference in ranking management regimes?
• Without a doubt
• Underscores the importance of management inventory and using models to help make decisions
• Underscores the importance of growing inventory data while keeping tree information
• Without going through all of the details, the following management regimes results were obtained…..
33
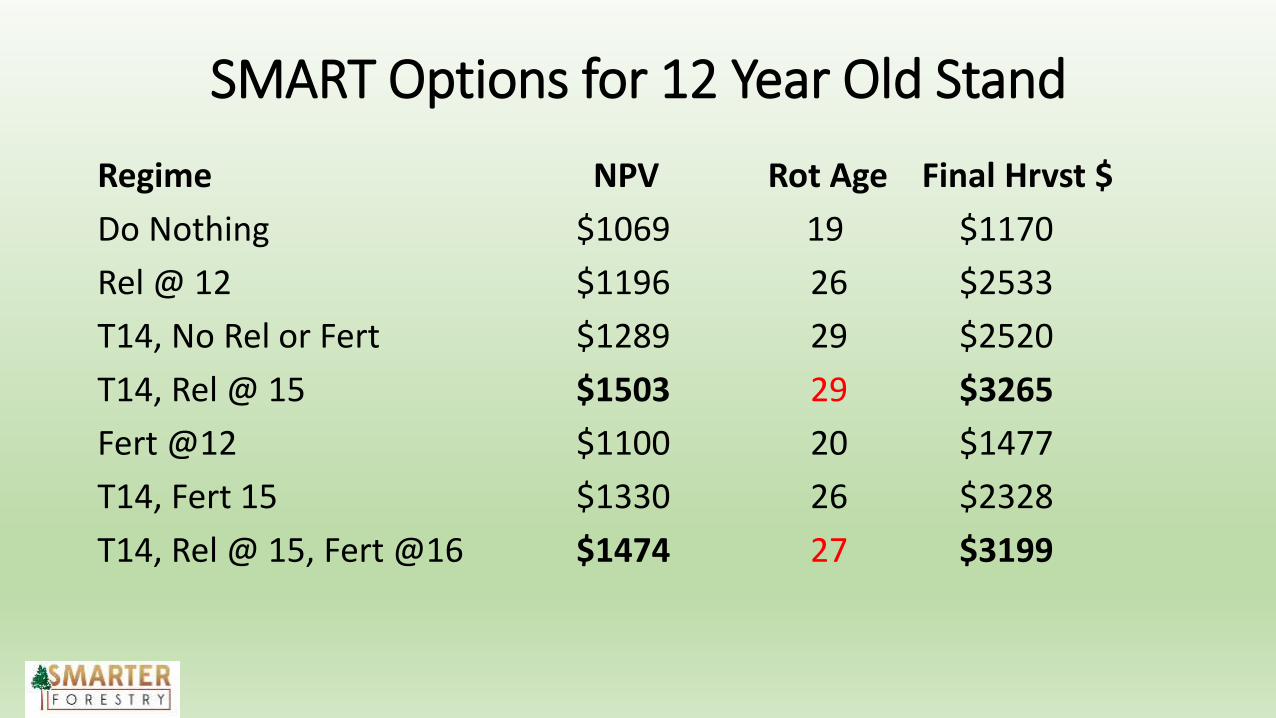
SMART Options for 12 Year Old Stand
Regime NPV Rot Age Final Hrvst $
Do Nothing $1069 19 $1170
Rel @ 12 $1196 26 $2533
T14, No Rel or Fert $1289 29 $2520
T14, Rel @ 15 $1503 29 $3265
Fert @12 $1100 20 $1477
T14, Fert 15 $1330 26 $2328
T14, Rel @ 15, Fert @16 $1474 27 $3199
Must remember that these are models!
• Sometimes what looks good on paper, does not look the same way in the woods. We can thin by TQI in the computer. How closely that is done in the woods impacts outcomes
• We still must remember the biology• If crowns are gone it will take much longer, if ever, to get a thin
response• There are differences in species; loblolly is more forgiving than
slash• Thinning when there are scarce nutrients available from the site
may require fertilization to get a response
35

36
Poor Crowns
To Make Objective Decisions
• Invest in Management Inventory to Obtain Good Data
• Use the Data in Models to Provide more Information for Decisions• Alternative Management Regime Results
• Be like an insurance company!
• Make certain the biology is realistic, then
• Choose the management that optimizes financial returns
37

Questions?