barriers to participation in educational programs as
TRANSCRIPT
Louisiana State UniversityLSU Digital Commons
LSU Doctoral Dissertations Graduate School
2003
Barriers to participation in educational programs asperceived by first-time enrolling freshmen in highereducationJulie Cason McDonaldLouisiana State University and Agricultural and Mechanical College
Follow this and additional works at: https://digitalcommons.lsu.edu/gradschool_dissertations
Part of the Human Resources Management Commons
This Dissertation is brought to you for free and open access by the Graduate School at LSU Digital Commons. It has been accepted for inclusion inLSU Doctoral Dissertations by an authorized graduate school editor of LSU Digital Commons. For more information, please [email protected].
Recommended CitationMcDonald, Julie Cason, "Barriers to participation in educational programs as perceived by first-time enrolling freshmen in highereducation" (2003). LSU Doctoral Dissertations. 534.https://digitalcommons.lsu.edu/gradschool_dissertations/534

BARRIERS TO PARTICIPATION IN EDUCATIONAL PROGRAMS AS PERCEIVED BY FIRST-TIME ENROLLING
FRESHMEN IN HIGHER EDUCATION
A Dissertation Submitted to the Graduate Faculty of the
Louisiana State University and Agricultural and Mechanical College
In partial fulfillment of the Requirements for the degree of
Doctor of Philosophy
in
The School of Human Resource Education and Workforce Development
by Julie Cason McDonald
B.S., Northwestern State University, 1979 M.S. Northwestern State University, 1985
May 2003

ii
© Copyright by Julie Cason McDonald 2003
All Rights Reserved

iii
DEDICATION This dissertation is dedicated to my mother, Ramona Cason, who stood by
me through all of my academic endeavors, encouraged me through all the tough
times when I wanted to quit, and who literally took on all my home responsibilities
for me. Mom, I couldn’t have finished this without you. Also, to my dad, Emmitt
Cason, I would like to say thanks so much for quietly encouraging me and for
sharing Mom with me so much over the past few years.
This manuscript is also dedicated to my husband, Kenneth, who had to
learn to manage on his own, and to my children, Kylie, Hollie, Raylie, and Adam,
who understood when their mom was not able to be at every extra-curricular
event. Thanks, guys, for helping out at home and for understanding when I just
had to put this work first.

iv
ACKNOWLEDGMENTS
I am indebted to Dr. Geraldine Holmes, my major professor, who always
answered my questions, whether by phone or email; and who always was a
source of encouragement, even when the tasks looked impossible and the
deadline was fast approaching. I also thank my committee members, Dr. Michael
Burnett, Dr. Satish Verma, Dr. Donna H. Redmann, and Dr. Yiping Lou. Your
comments and questions were very important to me.
I thank the faculty and staff of Northwestern State University, my employer
and my alma mater, for supporting and encouraging me as I completed my
doctoral work. Two members of the College of Business were especially helpful,
Dr. Joel Worley and Dr. Walter Creighton—thanks so much.
I also have to thank the other members of the LSU gang, Dr. Brenda
Hanson, Dr. Kathy Autrey, Dr. Steve Horton, and hopefully, soon-to-be a doctor,
Margaret Kilcoyne. And I couldn’t forget the unofficial sixth member of our
traveling group, Dr. Tom Hanson. Thanks to all of you for your friendships and all
the great memories.
A special thanks also goes to my extended family, my sister Sheila and
her family, my brother Randy and his family, and Mr. and Mrs. W. J. McCullough.
All of you knew when to push, when to encourage, and when to pray for me.
Thanks so much from the bottom of my heart.

v
TABLE OF CONTENTS
DEDICATION .....................................................................................................iii ACKNOWLEDGMENTS .....................................................................................iv LIST OF TABLES .............................................................................................viii ABSTRACT ........................................................................................................xi CHAPTER I
INTRODUCTION ........................................................................................... 1 Rationale for the Study .............................................................................. 1 Statement of the Problem .......................................................................... 6
Objectives of the Study .......................................................................... 7 Significance of the Study ........................................................................... 9 Definition of Terms .................................................................................... 9 CHAPTER II
REVIEW OF RELATED LITERATURE ........................................................ 11 Barriers to Educational Participation of First-time College Freshmen ...... 12
Situational Barriers............................................................................... 13 Institutional Barriers ............................................................................. 13 Dispositional Barriers ........................................................................... 14
Changing Demographics for Higher Education ........................................ 17 Retention and Academic Success of First-time Freshmen ...................... 19
Variables Affecting Success................................................................. 20 Summary.................................................................................................. 24
CHAPTER III
METHODS AND PROCEDURES ................................................................ 26 Research Design ..................................................................................... 26 Objective 1.......................................................................................... 26 Objective 2.......................................................................................... 27 Objective 3.......................................................................................... 27 Objective 4.......................................................................................... 27 Objective 5.......................................................................................... 27 Selection of the Instrument ...................................................................... 28
Approval to Conduct the Study ................................................................ 31 Population and Sample............................................................................ 31 Data Collection......................................................................................... 32 Data Analysis and Summary.................................................................... 34
CHAPTER IV
FINDINGS.................................................................................................... 39

vi
Overview.................................................................................................. 39 Data Analysis ........................................................................................... 41
Objective 1........................................................................................... 41 Age ............................................................................................... 42 Gender............................................................................................. 42 Family obligations ............................................................................ 42 Employment status .......................................................................... 42 Marital status.................................................................................... 42 Household income ........................................................................... 43 Enrollment status ............................................................................. 44 Ethnicity ........................................................................................... 44 Degree program............................................................................... 46
Objective 2........................................................................................... 46 Objective 3........................................................................................... 49 Objective 4........................................................................................... 54
Objective 4 (a).................................................................................. 54 Objective 4 (b).................................................................................. 56 Objective 4 (c).................................................................................. 57 Objective 4 (d).................................................................................. 59 Objective 4 (e).................................................................................. 62 Objective 4 (f)................................................................................... 64 Objective 4 (g) ................................................................................. 67 Objective 4 (h).................................................................................. 70 Objective 4 (i)................................................................................... 72
Objective 5........................................................................................... 76 CHAPTER V
SUMMARY, CONCLUSIONS AND RECOMMENDATIONS........................ 87 Summary of Methodology ........................................................................ 87 Population and Sample........................................................................ 88 Data Collection and Analysis ............................................................... 89 Summary of Findings ........................................................................... 90 Discussion and Conclusions .................................................................... 95 Recommendations ................................................................................. 100 Limitations.............................................................................................. 103
REFERENCES............................................................................................... 104 APPENDIX A: LETTER TO FIRST-TIME FRESHMEN STUDENTS ............. 110 APPENDIX B: BARRIERS TO PARTICIPATION IN EDUCATION FRESHEMEN STUDENT SURVEY........................................................... 111 APPENDIX C: DEMOGRAPHIC INFORMATION.......................................... 113 APPENDIX D: APPROVAL LETTER............................................................. 114
vii
APPENDIX E: BARRIER SUBSCALES......................................................... 115 APPENDIX F: FACTOR LOADINGS FOR SUBSCALES .............................. 116 APPENDIX G: ITEM MEANS AND FREQUENCY OF RESPONSES .......... 117 VITA .............................................................................................................. 119

viii
LIST OF TABLES
4.1 Family Obligations Reported as Number of Dependents in
Household of First-Time Freshmen at a Public University.................. 43 4.2 Current Employment Status of First-Time Freshmen Students at a Public University................................................................................43 4.3 Marital Status of First-Time Freshmen Students at a Public University .............................................................................................44
4.4 Household Income of First-Time Freshmen Students at a Public
University .............................................................................................45 4.5 Ethnicity of First-Time Freshmen Students at a Public University ........45 4.6 Degree Program of First-Time Freshmen Students at a Public
University .............................................................................................46 4.7 Ranked Item Means and Standard Deviations of First-Time Freshmen
in Barriers to Participation in Educational Programs Study ..................48 4.8 Ranked Means, Standard Deviations, Cronbach’s Coefficient Alpha,
Minimum and Maximum for the Three Barrier Subscales.....................51 4.9 Descriptive Statistics for Situational, Institutional, and Dispositional Subscale Mean Scores by Level of Concern........................................53 4.10 Independent Samples t-Test for Differences in Subscale Mean
Scores by Age Group ...........................................................................55 4.11 Comparison of Situational, Institutional, and Dispositional Subscale Means by Age Group ...........................................................................56 4.12 Independent Samples t-Test for Differences in Subscale Mean Scores by Gender ................................................................................57 4.13 Comparison of Situational, Institutional, and Dispositional Subscale
Means by Gender.................................................................................58 4.14 Pearson Product Moment Correlation Coefficients for Situational, Institutional, and Dispositional Mean Scores and Family Obligations...59 4.15 Independent Samples t-Test for Differences in Subscale Mean Scores by Employment Status .........................................................................60

ix
4.16 Comparison of Situational, Institutional, and Dispositional Subscale Means by Employment Status..............................................................61 4.17 Independent Samples t-Test for Differences in Subscale Mean Scores by Full-Time or Part-Time Employment Status.........................61 4.18 Comparison of Situational, Institutional, and Dispositional Subscale Means by Full-Time or Part-Time Employment Status .........................62 4.19 Analysis of Variance of Situational, Institutional, and Dispositional
Mean Scores by Marital Status ............................................................63 4.20 Analysis of Variance of the Situational Subscale by Marital Status..... 64 4.21 Situational Subscale Mean Scores by Marital Status ...........................64 4.22 Analysis of Variance of the Situational, Institutional, and
Dispositional Subscale Mean Scores by Household Income................65 4.23 Analysis of Variance of the Situational Subscale Mean Score by
Household Income ...............................................................................66 4.24 Situational Mean Subscale Scores for Household Income...................67 4.25 Analysis of Variance of the Situational, Institutional, and Dispositional
Subscale Mean Scores by Ethnicity .....................................................68 4.26 Analysis of Variance of the Situational Subscale by Ethnicity ..............69 4.27 Situational Mean Subscale Scores for Ethnicity ...................................69 4.28 Analysis of Variance of the Institutional Subscale by Ethnicity.............70 4.29 Institutional Mean Subscale Scores by Ethnicity ..................................71 4.30 Independent Samples t-Test for Differences in Subscale Mean Scores by Enrollment Status ................................................................72 4.31 Comparison of Situational, Institutional, and Dispositional Subscale Means by Enrollment Status ................................................................72 4.32 Analysis of Variance of the Situational, Institutional, and
Dispositional Subscale Mean Scores by Degree Program...................73 4.33 Analysis of Variance of the Situational Subscale by Degree Program .74 4.34 Situational Mean Subscale Scores by Degree Program.......................75
x
4.35 Analysis of Variance of the Dispositional Subscale by Degree
Program ...............................................................................................76 4.36 Dispositional Mean Subscale Scores by Degree Program...................76 4.37 Relationship Between Selected Demographic Characteristics and
the Situational Subscale Mean Scores.................................................79
4.38 Multiple Regression Analysis of the Situational Subscale Mean Scores on Selected Characteristics......................................................80
4.39 Relationship Between Selected Demographic Characteristics and
the Institutional Subscale Mean Scores ...............................................82 4.40 Multiple Regression Analysis of Institutional Subscale Mean Scores
on Selected Characteristics..................................................................83 4.41 Relationship Between Selected Demographic Characteristics and
the Dispositional Subscale Mean Scores .............................................84 4.42 Multiple Regression Analysis of Dispositional Subscale Mean
Scores on Selected Characteristics......................................................85

xi
ABSTRACT
Institutions of higher education face exceptional challenges in today’s
environment. College costs are increasing, funding is decreasing and/or limited,
public confidence is diminishing, the work-place is changing, and a shrinking pool
of traditional-age college students exists. This creates an environment where
colleges and universities find themselves competing for students. So that these
institutions of higher education may better understand how to recruit, advise, and
retain students, one must consider the barriers first-time freshmen encounter in
the pursuit of formal learning as they enter college.
The purpose of this study, therefore, was to determine the perceived
barriers to educational participation held by first-time enrolling college freshmen
at Northwestern State University, and further, to determine if a model exists that
would explain differences in these perceptions based on the variables age,
gender, family obligations, employment status, marital status, household income,
enrollment status, ethnicity, and degree program. The total number of first-time
freshmen analyzed as part of the study was 1,079.
Using a modification of a portion of a questionnaire by Carp, Peterson,
and Roelfs (1972), students were asked to indicate the level of concern they had
for an item perceived to be a possible barrier to their participation in higher
education. Items were further categorized using Cross’s conceptual framework of
barriers as being situational, institutional, or dispositional. Results showed that
although the model had only a minimal amount of variance that could be
explained, some statistical differences among groups was found. Multiple
regression analyses were used to determine the models that explained the

xii
subjects’ barriers to participation concern level. Results from the regression
models resulted in findings those financial concerns, which would include
household income, employment status, marital status, age, and family obligations
are determining factors in how barriers are perceived by students.
Variables which made significant contributions to the models included:
whether the student was Caucasian, age, household income, whether the
student was single/head of household, whether the student was undecided in
degree program, and family obligations (defined as the number of dependents).
1
CHAPTER I
INTRODUCTION
Rationale for the Study
Institutions of higher education face exceptional challenges in today’s
economic and education environment. College costs are increasing, funding is
decreasing and/or limited, public confidence is diminishing, the work place is
changing, and there is an increasingly shrinking pool of traditional-age college
students. This creates an environment in which many colleges and universities
find themselves competing for students. As this competition for students
increases, it is important for universities to find ways to retain the currently
enrolled students and also to attract new students to the campus (Altmaier,
Rapaport, & Seeman, 1983).
Demographics of the higher education student population are changing as
more “non-traditional” students occupy classrooms. Typical students of the future
will not be traditional 18-24 year-old recent high school graduates. Instead, a
large number of the students enrolling in postsecondary institutions are likely to
be older (over 25 years of age) (Gose, 1996; Hu, 1985). For this reason, higher
education administrators need to be aware of the possible difficulties that these
students may perceive as barriers, as they enter the college setting.
The first-time freshman experience can be difficult for all students, i.e.
financial aid, breaking home ties, managing dormitory life, making new friends,
battling with issues of independence and self esteem (Porter, 1990). Having little
or no prior experience with college, many may feel the college campus is like
entering a foreign country; there is a new language and culture to learn. Policies

2
and procedures can be confusing. Registration and course selection is
confounded by a lack of institutional savvy. Feelings of insecurity and inadequacy
may emerge as this student attempts to move through the bureaucracy of higher
education (Dwinell & Higbee, 1989; Kalsner, 1992).
Even after the students have decided to enroll in higher education, the
barriers that may have concerned them before enrollment may lead to another
one of the major problems facing colleges and universities nationwide—attrition.
Approximately 57% of the students entering a college or university in 1986 left
without receiving a degree. Although some students may eventually return,
approximately 75% of those leaving left higher education altogether. The
consequences of this exodus are not trivial for either the students or higher
education in general. Individuals leaving the system forfeit the occupational,
monetary and other societal rewards associated with having a degree. The
colleges and universities suffer the effects of declining enrollments (Tinto,
1987a).
Using Tinto's work, Gerdes and Mallinckrodt (1994) reported that more
than 40% of all college students leave without earning a degree, and 75% quit
within the first two years. Most post-secondary institutions can expect that 56% of
traditional first-time freshmen will not graduate (Gerdes & Mallinckrodt, 1994),
and 24% of non-traditional first time freshmen will also not graduate (Belchier,
1998). In many cases, these same students find themselves placed on
academic probation after the first semester and ultimately drop out (Gerdes &
Mallinckrodt, 1994). The important question is: “Are there appropriate changes
that can be made to accommodate this group of learners before they are lost to

3
the statistics of attrition?” Several reasons exist that justify higher education’s
need to re-evaluate their present programs, goals, and policies.
Since 1970, students over the age of 25 have been enrolling in colleges
and universities as full-time or part-time students in record numbers. When
counting both part-time and full-time enrolled adult students; the proportion of
college students over the age of 40 doubled from 1970 to 1993 (Gose, 1996).
In 1970, 72% of the students enrolled full-time in postsecondary
institutions were under the age of 25. Approximately 28% of the students were 25
or older. In 1985, 58% of the students enrolled were under 25, while 42% of the
students were 25 or older (Snyder, 1987). While the number of traditional age
college students enrolling in postsecondary institutions was declining, the
percentage of nontraditional students enrolling in colleges and universities during
the 1980s was steadily increasing (Hu, 1985). In the fall of 1995 only 54.5% of
students enrolled full-time in postsecondary institutions were under the age of 25
while the remaining 46% of students were 25 or older (Bureau of Census Report,
1990). This changing enrollment profile is predicted to continue into the 21st
century (Brazziel, 1989; Cross, 1986). With this change in the college campus
population, particular interest should be paid to the problems that may prohibit
this growing segment of students from being recruited, retained, and ultimately
graduated.
Other areas that have been proven to have a significant effect on
recruitment, retention, and attrition include attendance (full-time or part-time),
age, employment status (full-time or part-time), grade point average, ethnicity
(other than Asian), family obligations (defined as the number of dependents in

4
the student’s immediate household), financial concerns and gender (female)
(Belcheir, 1997; Bonham & Luckie, 1993; Kraemer, 1996; Lewallen, 1993).
Brawer (1996) built her research on the above findings but focused more on the
appropriate strategies for dealing with retention rather than focusing solely on
identifying attrition characteristics of non-persistors. After a perusal of these
findings, Brawer (1996) designed her research to identify factors associated with
reasons students leave college programs and to offer possible intervention
strategies. She determined that these previous studies found that the identifying
attrition characteristics of non-persistors, such as age, full- or part-time
attendance, employment status, family obligations, financial concerns and
gender, needed to be incorporated into efforts to raise retention rates while
simultaneously lowering attrition rates.
All the above-mentioned studies identified variables that significantly
affected retention, but were done post hoc. The higher education institution had
lost them, or was about to lose them already. What is being done to decrease the
attrition rate and address the problems faced by students as they start their
college careers? Is there something that can be done before they become a
statistic?
So that institutions of higher learning may better understand how to
recruit, advise and retain students, one must consider the barriers first time
enrolling freshmen in higher education encounter in the pursuit of formal learning
as they enter college. Findings in this area have been based on several studies
using the 1972 Carp, Petersen, and Roelfs’ questionnaire developed for the
Commission on Non-Traditional Study. The purpose of the original study was to

5
describe in detail the potential market for adult learning and to analyze the
learning activities of adults already engaged in learning (Carp, Petersen, &
Roelfs, 1973). A portion of the questionnaire dealt with barriers to participation in
learning activities. Cross, in a 1981 study, grouped the 24 non-participation items
and identified each statement as being situational, institutional, or dispositional in
nature.
According to Cross (1981) situational barriers are defined as those
barriers that relate to an individual’s life context at a particular time, including
both the social and physical environment surrounding one’s life. Issues revolving
around cost, childcare, and status of employment are grouped into this category.
Institutional barriers are those “erected by learning institutions that exclude or
discourage certain groups of learners because of such things as inconvenient
schedules, full-time fees for part-time students, restrictive locations and the like”
(Cross, 1979, p. 98). Dispositional barriers, also referred to as attitudinal barriers,
and in later work by Darkenwald (1982) as psychosocial barriers, are defined by
Cross (1981) as those individually held beliefs, values, attitudes or perceptions
that inhibit participation in organized learning activities.
In a later investigation, Byrd, (1990) using the 24 items relating to
perceived barriers from the Carp, Petersen, and Roelfs’ study and Cross’s
placement of these barriers, studied perceptions of barriers to undergraduate
education of non-traditional students at selected non-public liberal arts
institutions in the mid-south. Later, Green (1998) modified the 24 items and
conducted a study at a small rural public university in Montana. Green’s (1998)
study had a total of 30 statements. Some of the statements were rewritten into

6
two separate statements for clarity. Both Byrd (1990) and Green (1998) were
looking at the perceived barriers to educational participation held by non-
traditional students and whether certain demographic variables affected those
nontraditional students’ perceptions of barriers.
These studies were all addressed to the older, non-traditional age
students and moderate success was found in classifying variables into groups.
These were attempts to predict the participation of adult learners in higher
education and to determine if there was a certain type of learner who identify
certain items as barriers to educational participation. Since Cross’s (1981)
“barriers to educational participation” are similar to those “barriers” that affect
retention (Brawer, 1996; Brooks, 1991; Feldman, 1993; Heaney, 1996;
Mohammadi, 1996; Moore, 1995; Price, 1993; Windham, 1994), would an
exploratory study, using these same perceptions of educational barriers, be
successful in helping to identify problem areas for the first-time enrolling
freshmen in higher education?
Statement of the Problem
Current changes in the university student population affect organizational
structure, and the consequences for faculty and students can be significant. With
a decreasing pool of students to pick from, the focus on the role of student has
become prevalent in the field of research. Demographic changes, lack of
information about possible barriers to participation, and an attitude of “status quo”
have kept many institutions from providing services and programs aimed at
serving some of the special needs that these learners may have as they begin
their college career.

7
In this era of change, administrators, faculty, and professional staff are
recognizing the need to focus on the entering freshmen student, whether
traditional or non-traditional, full-time or part-time, married or single, as a viable
member of the college campus community. If new students are to be attracted
and retained, educators must have an understanding of these students’
perceptions of barriers to educational participation in an undergraduate program.
Only a small number of studies have investigated the perceived barriers held by
the students in the collegiate setting, and an even smaller number of them have
been directed to specific age or minority groups. This study sought to examine
the perceived barriers to participation in educational programs in higher
education held by first-time freshmen enrolled at Northwestern State University.
Objectives of the Study. The objectives of this study were to:
1. Describe first-time college freshmen enrolled at Northwestern State
University during the fall of 2000 in terms of the following demographic
variables: age, gender, family obligations (defined as the number of
dependents in the student’s immediate household), employment status (if
employed, number of hours worked per week), marital status, household
income, enrollment status (full- or part-time), ethnicity and degree
program.
2. Determine perceptions of first-time enrolling college freshmen at
Northwestern State University regarding potential barriers to participation
in educational programs as measured by the Barriers to Participation In
Education Freshmen Survey.

8
3. Describe first-time college freshmen at Northwestern State University on
selected Situational, Dispositional, and Institutional variables as measured
by the three subscale scores of the Barriers to Participation in Education
Freshmen Student Survey.
4. Determine if differences exist in perceptions of barriers to participation in
educational programs as measured by the Situational, Institutional, and
Dispositional subscale scores on the Barriers To Participation in Education
Freshmen Student Survey based on the following demographic
characteristics:
a. Age
b. Gender
c. Family obligations (defined as the number of dependents in the
student’s immediate household)
d. Employment status (if employed, number of hours worked per
week),
e. Marital status
f. Household income
g. Enrollment status (full- or part-time)
h. Ethnicity
i. Degree program
5. Determine if a model exists that explains a significant portion of the
variance in the mean subscale scores of the Barriers to Participation in
Education Freshmen Survey from the following measures: age, gender,

9
family obligations, employment status, marital status, household income,
enrollment status, ethnicity, and degree program.
Significance of the Study
Results from this study can provide data as to the attitudes and orientation
of first-time freshmen toward participation in educational programs in higher
education. Findings can assist educators in determining methods of educational
programming, recruitment, and retention, based on any differences by gender,
age, family obligations, employment status, marital status, household income,
enrollment status, ethnicity, or degree program. The initial rationale behind the
study is that it makes more sense in terms of efficiency to retain these potentially
successful students than to have to recruit new students from an increasingly
diminished pool (Boylan, 1983). The identification of students who may be
predisposed to barriers to participation will assist counselors and advisors in
developing appropriate intervention and guidance programs and administrators in
their efforts to sustain the mission of the university. Faculty and advisors to
increase the higher education student’s potential for success in the freshmen
year, and ultimately for successful completion of a degree could utilize
information gained from this study. The administration, admissions office, and
special population coordinator, to name a few, could also plan more effectively
for meeting the needs of a changing population of higher education students.
Definition of Terms
In order for the reader to have a basic understanding of this dissertation,
the following terms are defined:

10
Employment--For the purpose of this study, employment status is
categorized as full-time (32 or more hours per week), part-time (1-31 hours per
week) or not employed.
Freshman--For the purpose of this study, a freshman is defined as a
student who has earned between 1 and 30 hours in a higher education setting. A
first-time freshman is further defined as a student entering college for the first
time; this student has no earned college credit (Northwestern State University
General Catalog, 2000-2001). First-time enrolling freshman is further defined, in
this study, to be a student, who may have up to 30 hours of college credit, but
who earned those hours a minimum of ten years ago.
Full-time student--For the purpose of this study, a full-time student is
defined as one who is pursuing no less than 12 academic hours. A part-time
student is defined as one who is pursuing less than 12 academic hours
(Northwestern State University General Catalog, 2000-2001).
11
CHAPTER II
REVIEW OF RELATED LITERATURE The purpose of this review of related literature is to provide a foundation
for the identification of perceived barriers of first-time freshmen just beginning
their education. This foundation will provide a rationale for administrators to
utilize these identified barriers in an attempt to provide programming that will
better recruit and retain this most important segment of a university population.
Specifically, this review will identify and define these potential barriers, identify
and describe changing demographics of higher education, and address the areas
of retention and academic success of this population.
An aging population, together with a decline in college applicants between
the ages of 18-24 presents a challenge for postsecondary institutions as they
plan for this first decade of the new century. During the 1950s and 1960s, higher
education experienced high enrollments; in the 1970s and 1980s, however, the
trend was reversed. There was severe retrenchment (Porter, 1990), with more
students leaving college prior to completing a degree program than staying. For
many institutions of higher education, survival will depend upon their ability to
attract students from every social, ethnic, and economic background. An
awareness of the deterrents or barriers faced by first-time freshman students is
an essential first step in recruiting these students. Post-secondary institutions’
careful analysis of the deterrents/barriers this population encounters can provide
helpful information that can be utilized to attract and retain these students.

12
Barriers to Educational Participation of First-time College Freshmen
One of the most widely researched areas in education is the examination
of why students do or do not participate in education. Several researchers,
Cross, Byrd, Green, Johnstone and Rivera, to name a few, have closely
examined the reason given for non-participation. Using factor analysis as a
statistical method, many of these barriers have been identified within categories.
Johnstone and Rivera (1965) were the first of many researchers to provide
a factor analysis of barriers. They found that barriers to participation fell into two
categories: internal and external. Internal barriers included dispositional factors
and external barriers were situational in nature. Johnstone and Rivera found age,
gender and socioeconomic status to be of importance when determining the
barriers to educational participation. They also found that older adults cited more
dispositional barriers, while younger adults and women cited more situational
barriers. Individuals with low socioeconomic status cited both situational and
dispositional barriers as impacting their participation in educational activities.
In 1972, Carp, Peterson, and Roelfs of Educational Testing Service (ETS)
conducted a survey of adult learning for the Commission on Non-Traditional
Study. The purpose of this study was to describe in detail the potential market for
adult learning and to analyze the learning activities of adults already engaged in
learning (Carp, Petersen, & Roelfs, 1973). Using a questionnaire containing
multiple choice questions, respondents were asked to indicate their interests in
subject matter and learning modes, preferred place of study, time factors in
learning, reasons for learning, willingness to pay, guidance needs, and perceived
barriers to learning.

13
One portion of the questionnaire listed barriers to participation in learning
activities. The section on barriers contained 24 statements. The students
indicated, by circling, the statements that they felt were important to them. Data
from this section was analyzed by determining a percentage of responses to
each of the 24 items based on age, gender, race, marital status, age and gender,
race and gender, geographic region, and type of community in which they lived.
This study did not classify the barriers into categories but considered the effect of
selected variables and combinations of these variables upon perception of each
individual barrier. As in the Johnstone and Rivera study, age and gender were
shown to affect their results. Socioeconomic status was not a category in this
study. In a l981 study, Cross grouped the 24 non-participation items from the
Carp, Petersen, and Roelfs’ questionnaire and identified each statement as being
situational, institutional, or dispositional in nature.
Situational Barriers. Cross (1979) defined situational barriers as those
barriers, which relate to a person’s life context at a particular time, including both
the social and physical environment surrounding one’s life. Issues revolving
around cost and lack of time, lack of transportation, childcare and geographic
isolation were given as examples of situational barriers.
Institutional Barriers. Institutional barriers are those “erected by learning
institutions that exclude or discourage certain groups of learners because of such
things as inconvenient schedules, full-time fees for part-time students, restrictive
locations and the like” (Cross, 1979, p. 98). Other institutional barriers include the
lack of attractive or appropriate courses being offered and institutional policies
and practices that impose inconvenience, confusion or frustration for adult
14
learners. These barriers, mostly structural in nature, can be grouped into five
areas: scheduling problems; problems with location or transportation; lack of
courses that are interesting, practical, or relevant; procedural problems and time
requirements; and the lack of information about programs and procedures
(Cross, 1981). Informational barriers are often grouped under the heading of
institutional barriers. These barriers involve the failure in communicating
information on learning opportunities to students. Included in informational
barriers is also the failure of many adult learners, particularly the least educated
and poorest, to seek out or use the information that is available (Cross, 1981).
Dispositional Barriers. Dispositional barriers, also referred to as attitudinal
barriers, and described in later work by Darkenwald (1982) as psychosocial
barriers, are those individually held beliefs, values, attitudes or perceptions that
inhibit participation in organized learning activities. When adults say, “I am too
old to learn”, “I don’t enjoy school”, or “I’m too tired,” they are voicing
dispositional barriers. Dispositional barriers can relate to the learning activity as
well as the learner. When used in relation to the learning activity, dispositional
barriers can be expressed by the learner in terms of negative evaluations of the
usefulness, appropriateness and pleasurability of engaging in the learning. The
process of learning may be perceived as difficult, unpleasant or even frightening.
Lack of confidence in one’s ability to learn is a commonly voiced reason for non-
participation. Closely related to this perception are feelings that any effort to learn
will only result in failure. Low self-esteem and evidence of prior poor academic
performance are further examples of dispositional barriers (Cross, 1981).

15
Cross’s categorization of the 24 items was arbitrary. It should be noted
that many of the statements could fall within more than one of the three
categories (Cross, 1981). However, Cross’s placement of each of the 24-items
into one of three categories of barriers is supported by other authors (Brookfield,
1986; Byrd, 1990; Charner, 1980; Charner & Fraser, 1986; Cross & McCartan,
1984; Thiel, 1984).
In other studies, Darkenwald and Merriam noted four general categories of
barriers to participation: situational, institutional, psychosocial and informational
(Darkenwald & Merriam, 1982). Darkenwald and Merriam renamed and further
defined Cross’ dispositional barriers to psychosocial barriers. Psychosocial
barriers include beliefs, values, attitudes, and perceptions about education or self
as a learner. Darkenwald’s fourth category, informational, relates to the
availability and awareness of information about learning opportunities. This
category could reflect the learner’s lack of awareness as well as the institution’s
lack of effectively communicating information about student programs.
Byrd (1990), using the 24 items relating to perceived barriers from the
Carp, Petersen, and Roelfs’ study and Cross’s placement of these barriers,
conducted a study on the perceptions of barriers to undergraduate education by
non-traditional students at selected non-public, liberal arts institutions in the mid-
south. The purpose of Byrd’s study was to learn what barriers are experienced by
non-traditional students and how those variables of age, sex, marital status,
number of children, employment status, income, and race affect the perception of
situational, institutional, and dispositional barriers. She found that the number of
children, employment status, and race all impacted the respondents’ perceptions

16
of the barriers to participation. Six of the most frequently reported barriers were:
(1) not enough time, (2) amount of time required to complete the program, (3)
cost, (4) home responsibilities, (5) not enough energy or stamina, and (6) job
responsibilities.
In a more recent study, Green (1998) modified the 24 items and
conducted a study at a small rural public university in Montana. Green’s study
(1998) had a total of 30 statements. Some of the original 24 statements were
rewritten into two separate statements for clarity. With the exception of number of
children, and race, categories of perceived barriers were not useful in
distinguishing similar groups of non-traditional freshmen in the Green (1998)
study.
Both Byrd (1990) and Green (1998) were looking at the perceived barriers
to educational participation held by non-traditional students and whether certain
demographic variables affected those nontraditional students’ perceptions of
barriers. Their studies did not include traditional-age students’ perceptions of
barriers to participation in education. However, other studies have been
conducted to determine barriers to participation in the collegiate setting (Claus,
1986; Gallay & Hunter, 1979; Hengstler, Haas & Iovacchini, 1984; Scanlan &
Darkenwald, 1984).
The results of these studies were consistent with Cross’ categorization of
the three groups of barriers. Results of these studies indicated that costs of
attending school are a major situational barrier, along with conflict between family
obligations and job responsibilities, childcare, and transportation issues.
Institutional barriers of importance include a need for financial aid, access to

17
administrative services, strict entrance requirements, restrictive policies, and
perceptions of program benefits. Dispositional barriers reported were fear of
rejection, low self-esteem, fear of school itself, lack of interest and commitment,
unclear academic goals, and poor former academic achievement. It was further
indicated by these studies that variables such as age, gender, race, and marital
status affect perception of barriers to education of the non-traditional students
(Green, 1998); however, no traditional age students were included in these
studies.
Participation research and studies into barriers to participation are
numerous. Some researchers prefer the word “deterrent “ to “barrier,” with the
latter meaning “a static and insurmountable obstacle that prevents an otherwise
willing student from participating in higher education” (Valentine & Darkenwald,
1990, p. 30). Deterrents, on the other hand, are viewed as being “more fluid, less
conclusive and permanent.” No matter which word one chooses to use,
postsecondary institutions must examine the needs of the learner.
Changing Demographics for Higher Education
Adults now make up nearly 50% of higher education enrollments
(MacKinnon-Slaney, 1994), and their post-secondary participation is the focus of
a great deal of research. The most recent figures for undergraduate college
enrollment from the National Center for Education Statistics (1995) proved that
“the proportion of students 25 years old and over rose from 41.6 % in 1985 to
44.3 % in 1993” (p. 14). Further, they predict this proportion to be 50.7% by the
year 2005. These numbers reflect recent changes and future expectations in
society.

18
Students enrolled in higher education institutions typically fall into two
general categories: (1) students taking coursework not leading to the completion
of a degree or certification program and/or students enrolled in non-credit
courses, or (2) students seeking the completion of a degree or certification
program. In each of these categories, a student may be enrolled on a full- or part-
time basis. The student may be enrolled as a first-time freshman or as a
returning student who has stopped out of college for a period of time, but is still a
freshman according to credits earned.
Students who enroll in coursework that does not lead to the completion of
a degree or program certification are often admitted to the college on a non-
matriculated basis or are enrolled through a Continuing Education or Extended
Studies Program (Seaman & Fellenz, 1989). They possess a variety of prior
experiences and some of them may have already graduated from college and
successfully accomplished one or more career goals. A large number are still
working, and their reasons for enrolling may range from academic to purely
social. Many return to school in order to meet continuing education requirements
or for re-certification. This group is not looking for a two- or four-year program,
but instead they are looking for a course or courses that combine to provide the
means for a career enhancement or advancement.
Students enrolled as degree or certification-seeking have a particular
course of study that is directed by the university, and therefore their learning is
evaluated by the institution in a formalized manner. Their success is measured
by their forward progress towards the completion of their degree. Students in this
category may be enrolled either as a full- or part-time student. Many

19
postsecondary institutions offer degree credit programs for part-time students
through evening classes, summer school, or weekend programs (Darkenwald &
Merriam, 1982). Many postsecondary institutions are also putting all or part of
their degree programs “on-line” using the Internet and World Wide Web.
Students in the degree/non-degree seeking, and full/part-time categories
make up a broad cross-section of the population. These students have been
categorized as degree seekers, problem solvers, and enrichment seekers
(Pappas & Loring, 1985). People included in this group include a growing number
of women, displaced homemakers, career changers, immigrants, second career
retirees, single parent families, and individuals seeking professional development
(Cross, 1981).
The recruitment and retention of all students, especially the under-
represented student groups, to higher education will involve a careful study of the
institution’s assumptions about all students in the higher education environment.
Faculty, staff, and administrators need to understand and recognize the possible
barriers to educational participation of younger and older adult learners.
Curriculum, course content, method of delivery and assessment are all issues
directly related to the retention and ultimate academic success of the students in
postsecondary institutions.
Retention and Academic Success of First-time Freshmen
Academic success is a topic that is covered extensively in the educational
literature. Each study on the topic defines success differently. Common
definitions of a student’s success include faculty ratings, faculty advisor reports,
membership in honors programs, academic records, public recognition for

20
academic achievement, class rank, and standardized test scores (Anastasi,
Meade, & Schneiders, 1960; Richards, Holland, & Lutz, 1967; Whigham, 1985).
Other definitions included acquiring intellectual skills, independent scholarship,
timely graduation, social confidence (i.e., dealing with people), increased
awareness of moral issues, and creative works (Willingham, 1985). These
definitions were similar, and the differences among the definitions typically
existed because each of the definitions was centered on specific research
studies. For example, research describing academic achievement among male
engineering students might rely on standardized tests more than research
describing academic achievement among African American students.
Much has been written on the subject of persistence, academic success
and degree-attainment of college students. Indeed, Pascarella and Terenzini
(1991) found that “the volume of literature directly or indirectly addressing this
area of inquiry during the last 20 years is extensive to the point of being
unmanageable”, p. 387.
Any attempt to summarize the studies should begin by noting that most of
these studies have found that the single best predictor of persistence and
attainment of a degree is grades. The effects of advising, financial aid and
academic major have all resulted in mixed results (Belcheir, 1997). However, off-
campus employment consistently has been shown to have a negative effect on
persistence, while part-time employment on campus, however, appeared
beneficial (Belcheir, 1997).
Variables Affecting Success. When researching academic success and
retention the question of whether a student’s gender or race affect their academic

21
success is often asked. Most research studies claim that gender and race do
affect academic success, at least indirectly. For example, a woman may have
more difficulty being successful in the field of engineering because of the
pressure from advisors, parents, educators and peers (Whigham, 1985). At a
predominately white institution, African American students may be dealing with
racism and feelings of isolation, which would make it difficult to focus on being
academically successful (Willie & McCord, 1972).
Women often may have different academic experiences than men and
may react differently to the academic environment. Women tend to have different
academic characteristics than men. For example, women tend to show more
evidence of career maturity and a clear purpose (Dawson-Threat, 1993).
Ethnicity can also be an important factor in retention and academic
success. Minority students on predominately white campuses can feel isolated
and alone (Willie & McCord, 1972). The African American student population
typically has a higher attrition rate and a slower progression path toward
graduation (i.e., a second-year student may still be a freshman, a third-year
student may still be a sophomore). A study of student athletes produced results
describing differences between African American students and Caucasian
students in graduation rates and final examination preparation (Gosman,
Dandridge, Nettles, & Theony, 1983; Snyder, 1996).
For older students, a key to success has been linked to a supportive
environment (Belcheir, 1998). Students who had support from home were more
likely to succeed and were also listed as “top achievers.” Students in the Belcheir
(1998) study who had to “go it alone” were the ones who did not succeed.

22
In a perusal of earlier studies, Brawer (1996) reviewed ERIC documents of
the 1990s to identify factors associated with reasons students leave college
programs. Brawer (1996) found a 1995 study by Moore, and a 1994 study by
Windham reported students whom they classified as full-time were more likely to
persist than those who were part-time. The findings concerning the effects of age
on persistence may be conflicting. Brawer (1996) reported a 1993 study by Price
that found younger students were academically successful (persistors) and that
older students were conversely not successful (nonpersistors). In another 1993
study cited by Brawer, Feldman concluded that pre-enrollment predictors found
that students between the ages of 20 to 24 were more likely to drop out. A study
at Patrick Henry Community College in Virginia conducted by Mohammadi (1996)
concluded that after one year, attrition rates were higher for the students in the
age range of 23-25 and 45-50 years.
Heaney (1996) reported that learning and effective study techniques were
related to academic success among community college freshmen. Heaney’s
study found that adult learners were more successful than younger more
traditional aged students. Brooks (1991) reported that predictors of attrition in a
community college were identified as part time enrollment status, working full-
time, taking non-degree courses, and students over the age of 40 years. Full-
time employment, low grade-point average, being a member of an ethnic minority
other than Asian, family obligations, financial concerns, and female gender have
been shown to influence the student to leave college before completing a degree
(Bonham & Luckie, 1993; Lewallen, 1993). Retention of these students,

23
therefore, has become an area of great concern for the higher education
institution.
Student retention is a very important topic for many universities and is
directly related to academic success (Pascarella & Terenzini, 1991). Interest is
often sparked by the recognition that high rates of student departures may reflect
upon the survival of these institutions. A recent survey at Boise State University
revealed that 80% of the faculty and staff thought that their university should
attend to retention issues (Belcheir, 1997). There is an essential time element in
any retention strategy; three of every four dropouts leave during the first year of
college (Porter, 1990). The student’s uncertainty about what is expected creates
a multitude of transitional adjustment problems.
Tinto (1987b) argued that the key to retention lies not only with specific
retention strategies but also with the development of a commitment to the
educational process as a whole. Institutions with effective retention programs
focus on the communal nature of college life along with a strong commitment to
the students; in order to accomplish this, institutions must clarify their educational
mission and guard against incongruence between what the student needs and
what the institution is providing (Tinto, 1987b). Tinto’s model is being examined
and refined to determine whether it applies to adult learners, whose participation
is complicated by competing external factors—jobs, family responsibilities,
financial problems (Kerka, 1995).
Active participation in learning improves the retention of information
(Darkenwald & Merriam, 1982). Through this act of participation the learner is
able to integrate information with prior experience making it more meaningful,

24
accessible, and applicable at a later time. Active participation and integration of
learning is facilitated by encouraging learners to explore their needs and
interests, set goals, choose strategies for learning, and participate in assessment
of learning.
Educators facilitate this process of participation by first allowing the
student to explore their needs and interests. The retention of students at the
postsecondary level is enhanced when students are encouraged to participate in
their own learning; when they are validated for their prior experiences; when
information is meaningful and relevant; when the principles of self-directed-
learning are enhanced and developed; and when students are able to weigh,
choose, and act in ways that are self-enhancing. The facilitation of these
principles enables the first-time enrolling freshman in postsecondary institutions
to integrate, access, and apply information to their own lives, which in turn allows
them to transform and change their own future.
Summary If one walks into a college classroom today one will find not only the
traditional 18-24 year-old college student, but also housewives seeking new
identities, and engineers and business executives updating skills. Working
people, both skilled and unskilled, who had never thought to enter higher
education, have joined the ranks of returning students.
Adult learners in higher education have become the norm at American
colleges and universities. Comprising over 44 percent of all college
undergraduates, the adult learner has become a force to be reckoned with on
campus (Miller, 1991). In recent years, the diversity of the higher education

25
classroom has evolved to the point that understanding perceived barriers to
educational participation and meeting the needs of all incoming first-time
freshmen has become critical to institutions of higher education.
While many of the concerns of these students are the same, there remain
areas unique to specific groups. One of these areas is the perception of the
barriers to educational participation and its possible effect on recruitment,
retention and academic success. Understanding the relationship between these
variables is an area with little exploration in the literature.
This study attempted to explore and describe relationships between these
barriers, as perceived by first-time enrolling freshmen in higher education and to
determine if these relationships could provide a model to help explain variances
in those perceptions. If possible, a typology of student for whom certain barriers
are problematic will be identified. Information from this study will be used to help
institutions of higher education increase the retention rates in the higher
education setting by understanding the areas of concern for students as they
begin their college career.

26
CHAPTER III
METHODS AND PROCEDURES
Research Design
This study was designed as exploratory research, using a descriptive
research design. The purpose of the study was to determine the perceptions of
first-time enrolling freshmen in higher education regarding self-assessed
perceptions about possible barriers to participation in educational programs and
to compare those perception scores by: age, gender, family obligations (defined
as the number of dependents in the student’s immediate household),
employment status (if employed, 1-31 hours per week or over 32 hours per
week), marital status, household income, enrollment status, ethnicity, and degree
program. Descriptive research is most often used when gathering data to test
hypotheses or answer questions about the current status of the subject being
investigated (Gay, 1996). One method of collection is by questionnaires or
surveys that are used as self-reporting instruments. This method was chosen in
order to gather a profile of perceived barriers to participation in educational
programs at Northwestern State University, a small, rural, southern university,
from each responding first-time freshman. This study addressed the following five
objectives:
Objective 1. To describe first-time college freshmen enrolled at
Northwestern State University during the fall of 2000 in terms of the following
demographic variables: Age, Gender; Family obligations (defined as the number
of dependents in the student’s immediate household), Employment status (if

27
employed, number of hours worked per week), Marital status, Household income,
Enrollment status (full- or part-time), Ethnicity, and Degree program.
Objective 2. To determine perceptions of first-time enrolling college
freshmen at Northwestern State University regarding potential barriers to
participation in educational programs as measured by the Barriers to
Participation In Education Freshmen Survey.
Objective 3. To describe first-time college freshmen at Northwestern
State University on selected Situational, Dispositional, and Institutional variables
as measured by the three subscale scores of the Barriers to Participation in
Education Freshmen Student Survey.
Objective 4. To determine if differences exist in perceptions of barriers to
participation in educational programs, as measured by the Situational,
Institutional, and Dispositional subscale scores on the Barriers to Participation in
Education Freshmen Student Survey, based on the following demographic
characteristics: Age; Gender; Family obligations (defined as the number of
dependents in the student’s immediate household); Employment status (if
employed, number of hours worked per week); Marital status; Household income;
Enrollment status (full- or part-time); Ethnicity; and Degree program.
Objective 5. To determine if a model exists which explains a significant
portion of the variance in the mean scores of the Situational, Institutional, and
Dispositional subscales of the Barriers to Participation in Education Freshmen
Student Survey based on the following measures: age, gender, family
obligations, employment status, marital status, household income, enrollment
status, ethnicity, and degree program.
28
Selection of the Instrument
Perceived barriers of first-time enrolling college students were examined
in this study using Green's (1998) adaptation of a questionnaire, originally
developed by Carp, Peterson, and Roelfs in their 1972 study. Green used a
questionnaire with a Likert-type scale composed of 30 items to determine
respondents' levels of concern about barriers to educational participation. This
instrument used Cross' categorization of the items as situational, institutional, or
dispositional.
In Carp, Petersen, and Roelfs' original study, the respondents were
provided with a list of 24 previously identified barriers to adult participation and
asked to circle all of those that applied to them. Later, Cross (1981) categorized
these 24 items into three subscales of barriers: institutional, dispositional, and
situational barriers. In another study on barriers, Bryd (1990) added a Likert-type
scale to the original instrument used by Carp, Peterson, and Roelfs (1973) and
used Cross’s categorization of the 24 items as situational, institutional, or
dispositional barriers. Green (1998) adapted the instrument once again and
converted it into a 30-item survey with an anchored-scale, much like Bryd’s 1990
instrument. Respondents were given the 30 items and asked to indicate the
degree of concern each item held for them. A response of one indicated no
concern and a five indicated overwhelming concern. The current instrument
contains the same 30 items listed on the Green (1998) adaptation of the Carp,
Petersen, and Roelfs’ (1973) instrument, with a cover letter and a demographics
section prepared by the researcher. See Appendix A, B, and C.

29
Similar to the Byrd and Green investigations, respondents were asked to
indicate on an anchored scale whether an item is a concern. Items that are of no
concern were scored as one, items of minor concern a two, items of average
concern a three, items of major concern a four, and those items of overwhelming
concern were scored as a five. Each of the item responses were reported
individually and then placed in the appropriate subscale--Situational, Institutional,
or Dispositional. The instrument is brief and easy to understand, with no training
required for administration of the instrument.
The process of establishing validity for this questionnaire is very important.
Two types of validity were addressed in this study, construct validity and content
validity. Construct validity assesses the underlying theory of the questionnaire. It
is the extent to which the questionnaire can be shown to measure hypothetical
constructs that explain some aspect of human behavior (Borg & Gall, 1983, p.
280; Van Dalen, 1979, p. 137). The process of establishing construct validity for
this instrument consisted of a literature review and the examination of the prior
use of the questionnaire in multiple settings. The instrument addresses construct
validity by being based on the theoretical concepts of barriers, as addressed in
the literature by several research studies and therefore, had a solid theory base.
The content validity refers to the sampling adequacy of the content of the
questionnaire (Kerlinger, 1963, p. 458) and can be determined by expert
judgment (Gay, 1996, p. 140). The items within the current questionnaire were
those developed in the original Carp, Peterson, and Roelfs’ questionnaire. The
current instrument contains 30 items, with no substantive changes made to the
content of the original questionnaire. Six of the original twenty-four items from

30
the original study were reworded or split into two separate items in order to bring
further clarity to the item in the Green (1998) study. The current instrument
contains the same 30 items presented in the Green (1998) study. Thus, the
content validity, as established through use and expert opinion, was not affected
by any of these changes.
Cross’s categorization of the 24 items from the Carp, Peterson, and
Roelfs’ questionnaires into three distinct barriers was arbitrary. However, other
research in the literature does support the three-barrier typology (Brookfield,
1986; Charner, 1980; Charner & Fraser, 1986; Cross & McCartan, 1984; Thiel,
1984). Cross noted in her defense of these categories the obvious arbitrary
nature of placement and also the tendency for some of the items to overlap
categories (Cross, 1981).
The reliability of the instrument has only been noted in one study. The
internal consistency of the instrument on the three-factor scales was calculated
using a Cronbach alpha coefficient procedure. The reliability coefficient for the
Situational subscale was .68. This was slightly lower than the .70 standard
usually associated with instrument reliability (Gay, 1996, p. 147). The Institutional
subscale had a reliability coefficient of .79, and the Dispositional subscale a
reliability coefficient of .84. These scores indicated that the scales are generally
reliable for the three-factor solution (Green, 1998).
For the purpose of this study, the barrier items in each of the three
subscales were factor analyzed using a one-factor factor analysis to determine if
the item (variable) could be confirmed to measure a single construct. As
recommended by Hair, Anderson, Tatham, and Black (1998), the researcher

31
used the minimum acceptable factor loading of .30. See Appendix D for the items
in each of the three subscales and the calculated factor loadings for each item.
Approval to Conduct the Study
Appropriate prior approvals were necessary for conducting the study.
Sources of these approvals included the following:
1. The Committee on the Protection of Human Subjects in Research of
Northwestern State University (see Appendix D).
2. The Vice-President for Academic Affairs at Northwestern State
University.
Population and Sample
For the purpose of this study, the target population was all first-time
freshmen that enrolled at Northwestern State University during the Fall 2000
semester. Northwestern State University is a public, four-year, southern region
university, located in Natchitoches, Louisiana. According to Northwestern State
University Institutional Research Director, Dr. Cristi Carson, there were 1,952
entering freshmen during the fall 2000 semester (personal communication,
2003). The accessible population for this study was all students enrolled in the
freshmen orientation class (Orientation 1010), who were first-time freshmen
(those having earned no college hours prior to entering Northwestern State
University or those who had not earned college hours in the past ten years) on
the Natchitoches campus, the Shreveport campus, and the Fort Polk campus
during the fall semester of 2000. There were 50 sections of Orientation 1010
with 1,730 students enrolled. This class was selected because all entering
freshmen are advised to “take Orientation 1010 during their first period of

32
enrollment at NSU” (Northwestern State University General Catalog, 2000-
2001). Because of scheduling problems and/or class limits 222 of the entering
2000 freshmen did not schedule Orientation 1010 during the Fall 2000 semester.
The sample for the study included all the first-time freshmen from the
accessible population who were enrolled in a one credit hour course, Orientation
1010, during the Fall 2000 semester. Enrollment statistics and section availability
were retrieved from the university’s Student Information System.
Of the 1,730 students enrolled in Orientation 1010 that semester, 1,631
met the definition of first-time freshmen for this study (Carson, personal
communication, 2003). Of the 99 who did not meet the criteria, 19 had previous
hours at Northwestern State University and 80 were transfer students with college
credit hours. Because roll was not taken for each of the class sessions, there was
not an accurate count of how many students were absent on the day the survey
was administered, therefore an exact number of students actually present for the
class sessions could not be obtained. A total of 1,389 students (85% of the 1,631
students meeting the criteria), were given the survey instrument and 1,079 (78%)
of those surveys were returned.
Data Collection
The following steps occurred in the data collection procedure:
1. Using the Student Information System (SIS) of Northwestern State
University the researcher gathered enrollment statistics and retrieved a list of
section numbers and locations for all Orientation 1010 courses. When approval
for the research was granted, the researcher was directed to survey the
freshmen students during a two-day period (September 5 and 6, 2000), when all

33
of the Orientation classes would be having combined class meetings. The
combined classes were scheduled so that several different departments, relevant
to the freshmen year experience, could disseminate information to the students
at one time. The meetings were scheduled during the regular assigned class
meeting time, except the location was moved to a large ball room on campus to
accommodate a large number of students. All Orientation classes meet for 50-
minute class sessions, twice a week, either Mondays and Wednesdays or
Tuesdays and Thursdays. Each class period begins at the top of the hour; for
instance, 8 o’clock, 9 o’clock, 10 o’clock, etc. until 3 o’clock in the afternoon.
2. The researcher arranged with the Freshmen Orientation Director to
have a slot at the end of each of the classes. The survey instruments were
handed to each student as they entered the room. The researcher gave
directions at the appointed time on the schedule. Students were told to read the
cover letter and to voluntarily complete the instrument if they met the criteria
explained by the researcher, which was that they be a first time enrolling
freshmen, with no previous hours, or with no hours earned in the past ten years.
Instructions at the top of the survey read: “The following are some problems
reported by other students which might make participation in education difficult.
Please indicate the degree of concern that these are for you. Note. All
responses are confidential. Circle the appropriate level of concern as it applies to
you.” See Appendix B for a copy of the instrument.
3. The freshmen completed the demographic information regarding age,
gender, family obligations (defined as the number of dependents in the student’s
immediate household), employment status (if employed, 1-31 hours per week or

34
over 32 hours per week), marital status, household income, enrollment status,
ethnicity, and degree program. No name was asked for on the survey. The
student could request a copy of the results; however, none chose to do so.
4. The freshmen responded to each of the 30 items on the survey.
5. The freshmen returned the completed surveys to the researcher as
they exited the room.
6. Immediately following the last Orientation class meeting, the
researcher began the data analysis procedure.
Data Analysis and Summary
The first research objective was to describe freshmen enrolled at
Northwestern State University during the fall of 2000 in terms of the following
demographic variables: age, gender, family obligations (defined as the number of
dependents in the student’s immediate household), employment status (if
employed, full-time or part-time), marital status, household income, enrollment
status (full- or part-time), ethnicity, and degree program. The researcher
described the study participants by reporting the following nominal
measurements:
1. The total number of freshmen who completed the survey.
2. The number and percentage of female freshmen that completed the
survey.
3. The number and percentage of male freshmen that completed the survey.
4. The number and percentage of freshmen completing the survey grouped
by current employment status.

35
5. The number and percentage of freshmen completing the survey grouped
by current marital status.
6. The number and percentage of freshmen completing the survey grouped
by current enrollment status.
7. The number and percentage of freshmen completing the survey grouped
by ethnicity.
8. The number and percentage of freshmen completing the survey grouped
by degree program.
The researcher described the actual study participants by reporting the
following ordinal data:
1. Ages of freshmen (grouped in two age categories, 16-24 and 25 and
above)-percentage in each category.
2. Number of Family obligations (defined as the number of dependents in the
student’s immediate household).
3. Hours at job, if employed (by categories)--either 1-31 (part-time) or 32 and
above (full-time)—percentage in each category.
4. Household income (by categories)—percentage in each category.
The second objective was to determine perceptions of first-time enrolling
college freshmen at Northwestern State University regarding potential barriers to
participation in educational programs as measured by the Barriers to
Participation In Education Freshmen Survey. The scores for each of the thirty
items on the survey instrument were entered into a spreadsheet using the
SPSS® statistical software. The mean scores were then calculated and printed
for analysis by the investigator. Descriptive statistics including frequencies,
36
means, and standard deviations were calculated for each item. Item means were
examined for high and low mean scores and reported descriptively.
The third research objective was to describe first-time college freshmen at
Northwestern State University on selected Situational, Dispositional, and
Institutional variables, as measured by the three subscale scores of the Barriers
to Participation in Education Freshmen Student Survey. The Situational Mean
Score was calculated by taking the sum value of the following nine items: 1, 2, 7,
8, 13, 16, 17, 18, and 19 and dividing by 9. The Institutional Mean Score was
calculated by taking the sum value of the following 10 items: 3, 4, 5, 9, 11, 12,
14, 24, 25, and 29 and dividing by 10. The Dispositional Mean Score was
calculated by taking the sum value of the following eleven items: 6, 10, 15, 20,
21, 22, 23, 26, 27, 28, and 30 and dividing by 11. To accomplish this particular
objective, the scores on the subscales of the survey instrument for each
respondent were analyzed descriptively.
Objective 4 (a) sought to determine if there were significant differences in
subscale scores based on age. An independent samples t-test was used to meet
this objective.
Objective 4 (b) sought to determine if there were significant differences in
subscale scores based on gender. An independent samples t-test was used to
meet this objective.
Objective 4 (c) sought to determine if there were significant differences in
subscale scores based on family obligations. To address this objective, a
Pearson Product Moment correlation coefficient was used to analyze the data. A

37
scale by Hinkle, Wiersma and Jurs (1988), was used to evaluate the strength of
the correlation (p. 118).
Correlation Interpretation
+ .90 to + 1.00 Very high positive (negative) correlation
+ .70 to + .90 High positive (negative) correlation
+ .50 to + .70 Moderate positive (negative) correlation
+ .30 to + .50 Low positive (negative) correlation
+ .00 to + .30 Little if any correlation
Objective 4 (d) sought to determine if differences existed in subscale
scores based on employment status. Two t-tests for independent samples were
performed to analyze and report this data. The first t-test determined if there
were significant differences between the working and not working groups. The
second t-test looked for significant differences between the groups that worked
part-time and full-time.
Objective 4 (e), (f), (g) and (i) sought to determine if differences existed in
subscale scores based on marital status, household income, ethnicity and
degree program. A one-way analysis of variance (ANOVA) statistical procedure
was used to determine if significant differences existed. The independent
variables for these analyses were marital status, household income, ethnicity,
and degree program respectively, and the dependent variable was student
perception of barriers to participation in educational programs as measured be
the three subscale scores on the Barriers to Participation in Education Freshmen
Student Survey. To help determine where significant differences lie, appropriate
post hoc tests were used.

38
Objective 4 (h) sought to determine if differences existed in subscale
scores based on enrollment status. An independent samples t-test was used to
meet this objective.
Objective 5 sought to determine if a model existed which explained a
significant portion of the variance in the mean scores of the Situational,
Institutional, and Dispositional subscales of the Barriers to Participation in
Education Freshmen Student Survey based on the following demographic
measures: age, gender, family obligations, employment status, marital status,
household income, enrollment status, ethnicity, and degree program.
This objective was accomplished by using multiple regression analysis.
The three mean subscale scores served as the dependent variables. The
independent variables were age, gender, family obligations, employment status,
marital status, household income, enrollment status, ethnicity, and degree
program. The step-wise entry of variables into the model was used.
All statistical calculations were performed using SPSS® statistical
software for personal computers (SPSS ® for Windows, version 10.0).
Appropriate tables were used to report the data.
39
CHAPTER IV
FINDINGS
Overview
The purpose of this study was to investigate the perceived barriers to
participation in educational programs in higher education held by first-time
freshmen enrolled at Northwestern State University. This chapter presents the
findings, which are organized according to the five objectives.
The target population consisted of first-time entering freshmen at a public,
four-year university. There were 1,952 entering freshmen at Northwestern State
University during the fall semester of 2000 (Carson, personal communication,
2003). The accessible population was all first-time freshmen enrolled in the
freshmen orientation class (Orientation 1010), who had earned no college credit
hours prior to entering Northwestern State University or who had not earned
college credit hours in the past ten years. There were 50 sections of Orientation
1010 with 1,730 students enrolled. Because of scheduling conflicts and/or class
limits, 222 of the 1,952 entering 2000 freshmen did not schedule Orientation
1010 during the fall 2000 semester.
Of the 1,730 students enrolled in Orientation 1010 that semester, 1,631
met the criteria mentioned above (Carson, personal communication, 2003). Of
the 99 who did not meet the criteria, 19 had previous hours at Northwestern
State University and 80 were transfer students with college credit hours. A total
of 1,389 students (85% of the students actually enrolled in the course), that were
either first time freshmen at the university or had not been in higher education in
the past 10 years, were given the survey instrument at the end of one of the

40
scheduled orientation class sessions and asked by the researcher to voluntarily
complete the survey. Because roll was not taken for each of the class sessions,
there was not an accurate count of how many students were absent on the day
the survey was administered, therefore an exact number of students actually
present for the class sessions could not be obtained. Because the survey was
voluntary, some students chose to leave the room without completing the survey.
A total of 1,079 (77.7%) students returned the surveys. Eight (.01%) surveys
were unusable because the respondents did not complete any of the
demographic information. This left a total of 1,071 surveys that were used in this
study.
A one-factor factor analysis was also conducted with the data from the
sample to see if the items included in each of the subscales could be used to
confirm the factor structure of the instrument. The researcher used the minimum
acceptable factor loading of .30 (Hair et al., 1998). The factor analysis revealed
that the instrument did support the three factors proposed in earlier trials of the
instrument (Cross, 1981, Byrd, 1990; Green, 1998). All three of the subscales
reported acceptable factor loadings, supporting the three-factor solution. On the
Situational subscale, the 9 barrier items forced on one factor had factor loadings
of .70 to .41. On the Institutional subscale, the 10 barrier items forced on one
factor had factor loadings of .72 to .48. On the Dispositional subscale, the 11
barrier items had factor loadings of .68 to .44 (see Appendix F).
Instrument reliability for the Barriers to Participation in Educational
Programs Survey was validated by calculating a Cronbach Coefficient Alpha. The
Cronbach Coefficient Alpha measurement for the overall instrument was found to

41
be .90. The general reliability of the instrument, as a whole, had been noted by
Green (1998) in her study, but no empirical value was given. For each of the
three categories or subscales, the instrument was found to be reliable as well.
The Cronbach Alpha for the Situational subscale provided a slightly higher alpha
value, .73, than the value found in an earlier similar study by Green (1998). The
Institutional subscale and Green’s (1998) empirical trial of the instrument both
provided an alpha of .79. For the Dispositional subscale, α = .80, which was
slightly lower than the alpha value (α = .84) of Green’s (1998) study. These
scores indicate that the scales are generally reliable for the three-factor solution.
Data Analysis
The alpha level was set at .05 a priori. Procedures for statistical analysis
are discussed by objective.
Objective 1. The first objective was to describe first-time college
freshmen enrolled at Northwestern State University during the fall semester of
2000 in terms of the following demographic variables: age, gender, family
obligations (defined as the number of dependents in the student’s immediate
household), employment status (if employed, 1-31 hours per week or 32 or more
hours per week), marital status, household income, enrollment status (full- or
part-time), ethnicity and degree program. These variables are summarized using
frequencies and percentages.
Age. From the total number of respondents (n = 1,071), 1,069 answered the
age question. Students who were first-time freshmen at the time of the study (n =
1,069) had a mean age of 20.14, with a standard deviation of 5.92. Ages ranged
from 16 to 58. Two students did not supply an answer to the age question.
42
Actual age was collected and then grouped into two categories. A majority
of the students (n = 953 or 89.1%) indicated that they were16-24 years old, while
10.9% (n = 116) were 25 years old or older when entering as first-time freshmen.
Based on information found in the literature concerning age, these two groups of
freshmen are often called traditional and non-traditional. The 16-24 year old
group was called “traditional” students, while the 25 and above group was
referred to as “non-traditional”.
Gender. The majority (n = 732 or 68.3%) of the respondents were female.
Three hundred thirty-nine (31.7%) were male.
Family obligations. Family obligation was defined as the number of
dependents in the immediate household of the respondent at the time of the
study. A majority, (n = 928 or 86.6%) of the students indicated having zero (0)
dependents. Table 4.1 shows number of dependents in the household reported
by the respondents.
Employment status. Three choices, as shown in Table 4.2, were offered for
the current employment status. In response to this item, the majority (n = 655 or
61.9%) of the respondents indicated that they were not employed at the time of
the study.
Marital status. Five choices were offered in the marital status category:
single/head of household, married, widowed, divorced or separated, and single.
Table 4.3 indicates that the majority of the responding freshmen students (81.8%
or n = 876) were single.

43
Table 4.1
Family Obligations Reported as Number of Dependents in Household of First-Time Freshmen at a Public University
Number of Dependents n %0 928 86.51 65 6.12 46 4.33 22 2.14 6 0.65 3 0.36 1 0.1
Total 1,071 100.0 Table 4.2 Current Employment Status of First-Time Freshmen Students at a Public University
Employment Status
n %
Not employed 655 61.9
Employed Part-time 289 27.3
Employed Full-time 114 10.8
Total 1,058 100.0
Note. Thirteen participants did not answer the question concerning employment status.
Household income. Students were asked to indicate their current household
income by marking the correct category on the scale of income levels. The actual
question on the survey was, “Approximately what was the combined income of
you and your spouse (if married) last year (before taxes) or of your parents if a

44
dependent?” The most frequently occurring response was “Don’t know” (n =287
or 26.8%). From the other eight choices given to the respondent, the “Under
$10,000” category had the most respondents (n = 170 or 15.9%). The frequency
of the responses is presented in Table 4.4.
Table 4.3 Marital Status of First-Time Freshmen Students at a Public University
Marital Status n %
Single 876 81.9
Married 85 8.0
Single/Head of Household 79 7.4
Divorced or Separated 28 2.6
Widowed 1 0.1
Total 1,069 100.0Note. Two students did not respond to the variable marital status. Enrollment status. Respondents were asked to indicate whether they were
currently enrolled part-time or full-time at the university. Three (0.03%) of the
1,071 respondents did not complete this question. The majority of the
respondents (n = 988 or 92.5%) were full-time students taking 12 or more hours
the semester of the study. The remaining 80 (7.5%) were part-time students.
Ethnicity. Of the 1,071 respondents, the ethnic composition of the respondents
was predominately Caucasian. The second largest group (n = 293 or 27.5%) was
African American. Five surveys were missing the information about ethnicity, as
shown on Table 4.5.

45
Table 4.4
Household Income of First-Time Freshmen Students at a Public University
Household Income n %
Under $10,000 170 15.9
$10,000 to $19,999 116 10.8
$20,000 to $29,999 91 8.6
$30,000 to $39,999 88 8.2
$40,000 to $59,999 120 11.2
$60,000 to $74,999 74 6.9
$75,000 to $99,999 60 5.6
$100,000 and over 65 6.1
Don't know 286 26.7
Total 1,070 100.0 Note. One respondent did not respond to the variable household income Table 4.5 Ethnicity of First-Time Freshmen Students at a Public University
Ethnicity n %
Caucasian 715 67.1
African American 293 27.5
American Indian 26 2.4
Other 18 1.7
Hispanic 12 1.1
Asian 2 0.2
Total 1,066 100.0
Note. Five students did not respond to the variable ethnicity.

46
Degree program. Possible choices for degree program were “certificate
program”; “associate degree”; “bachelor degree”; “non-degree seeking student”;
and “have not decided on program”. Only 1,060 respondents answered this
question. The majority (n = 745 or 70.3%) indicated the “Bachelor Degree”
program (see Table 4.6).
Table 4.6
Degree Program of First-Time Freshmen Students at a Public University
Degree Program n %
Bachelor Degree program 745 70.3
Associate Degree program 155 14.6
Have not decided on program 120 11.3
Certificate Program 21 2.0
Non-degree seeking student 19 1.8
Total 1,060 100.0Note. Eleven students did not respond to the variable degree program.
Objective 2. The second objective sought to determine perceptions of first-
time enrolling college freshmen at Northwestern State University regarding
potential barriers to participation in educational programs as measured by the
Barriers to Participation In Education Freshmen Survey. For the purposes of this
study, the concern levels, 1, 2, 3, 4, and 5, were clarified as follows: (1) Not a
Concern; (2) Minor Concern; (3) Average Concern; (4) Major Concern; and (5)
Overwhelming Concern. Also, the following interpretative scale was used to
interpret the data:

47
1.00 – 1.50 – Not a concern
1.51 – 2.50 Minor concern
2.51 – 3.50 Average Concern
3.51 – 4.50 Major Concern
4.51 – 5.00 Overwhelming Concern
The respondents did not rank any one item on the instrument as either a
major or an overwhelming concern. The respondents ranked four item means as
an average concern. Twenty-one items were ranked as minor concerns, and the
remaining five items of the survey were ranked as not a concern (see Table 4.7).
The highest mean score of 3.47 (SD = 1.13) was found on the item “Costs of
such things as books, learning materials, childcare, transportation, or tuition”.
This mean score is interpreted as an average concern and it was one of four
items on the survey to have a mean score equal to an “Average concern”.
Ninety-three percent (n = 993) of the freshmen responded with some level of
concern (2, 3, 4, or 5) for this particular item; with 20% of the respondents (n =
212) ranking it as an overwhelming concern (5). Other individual items of concern
for the respondents were “Not enough time” and “Afraid I’ll fail”, with 62% (n =
665) of the respondents marking a 3, 4, or 5 (average, major, or overwhelming
concern) for the item “Not enough time”, and 489 (46%) of the respondents
marking a 3, 4, or 5 for “Afraid I’ll fail”. The item with the lowest mean score (M =
1.28 SD = .79) was “Afraid that I’m too old to begin”, indicating that this item was
not a concern. Using the interpretative scale derived for the instrument, four more
of the 30 items listed on the survey were also rated as “Not a concern”. See
Table 4.7 for the means and standard deviations of the responses to the 30 items

48
on the Barriers to Participation in Education Freshmen Survey. See Appendix G
for a list of the 30 items on the survey, with the frequency and percentage of
responses for each level of concern.
Table 4.7
Ranked Item Means and Standard Deviations of the First-Time Freshmen in Barriers to Participation in Educational Programs Study Level of Concern
Item # Possible Barrier n M SD
1 Cost for such things as books, learning materials, child care, transportation, or tuition
1,070 3.47 1.13
2 Not enough time 1,062 2.84 1.15 30 Afraid I’ll fail 1,071 2.52 1.44Average 3 Amount of time required to complete
the program 1,067 2.52 1.05
12 Not enough information about who to
contact 1,069 2.48 1.27
29 Financial aid applications are confusing 1,071 2.41 1.42 26 Don’t enjoy studying 1,068 2.40 1.25 5 Strict attendance requirements 1,070 2.38 1.22 6 Not sure what courses I’d like to take 1,069 2.31 1.19Minor 9 Courses I want aren’t scheduled when I
can attend 1,069 2.29 1.24
4 No way to get credit for a degree 1,057 2.25 1.24 14 Too much red tape in getting enrolled 1,069 2.24 1.23 19 Job responsibilities 1,070 2.23 1.34
20 Not enough energy and stamina 1,070 2.14 1.22 11 Not enough information about what
courses are available 1,069 2.10 1.18
18 Home responsibilities 1,071 2.08 1.24 27 Tired of going to school 1,068 2.06 1.23 25 Courses I want don’t seem to be
available 1,069 1.93 1.19
15 Hesitant to seem to ambitious 1,057 1.89 1.01 7 No place to study or practice 1,068 1.86 1.11
22 Low grades in the past 1,071 1.82 1.13 13 No transportation 1,069 1.77 1.31
(table cont’d)

49
Level of Concern
Item # Possible Barrier n M SD
23 Lack of self confidence 1,070 1.76 1.08 28 Don’t know how to use computers 1,068 1.75 1.13Minor 24 Don’t meet requirements to begin
program 1,068 1.52 .95
10 Don’t want to go to school full-time 1,064 1.43 .87 17 No encouragement from my friends 1,066 1.38 .84Not a Concern 8 No child care 1,069 1.34 .93 16 My family doesn’t like the idea 1,069 1.31 .75 21 Afraid that I’m too old to begin 1,069 1.28 .79Note. N = 1,071; Interpretative scale: Overwhelming Concern—4.51 – 5.0; Major Concern—3.51 – 4.50; Average Concern—2.51 – 3.50; Minor Concern—1.51 – 2.50; and Not a Concern—1.0 – 1.50. Instrument scale: Overwhelming Concern = 5; Major Concern = 4; Average Concern = 3; Minor Concern = 2; and Not a Concern = 1.
Objective 3. The third objective sought to describe first-time college
freshmen at Northwestern State University on selected Situational, Dispositional,
and Institutional variables as measured by the three subscale scores of the
Barriers to Participation in Education Freshmen Student Survey. Using the three
categories of barriers proposed in the Cross (1981) and Green (1998) studies
(Situational, Institutional, and Dispositional) the statements on the survey were
divided into three subscales to determine three mean scores for each
respondent. The three subscales were factor analyzed to determine if the item
(variable) could be confirmed to measure a single construct. The researcher
used the minimum acceptable factor loading of .30 (Hair et al., 1998). On the
Situational subscale, the 9 barrier items forced on one factor had factor loadings
of .70 to .41. On the Institutional subscale, the 10 barrier items forced on one
factor had factor loadings from .73 to .48. On the Dispositional subscale, the 11
barrier items had factor loadings of .68 to .44. See Appendix F.

50
The Cronbach alpha for each of the three subscales was calculated to
check for internal consistency of the instrument. The Situational subscale
provided an alpha value of .73; the Institutional subscale provided an alpha of
.79, and the Dispositional subscale alpha was .80. All three alphas were greater
than the minimum .70 required for this study.
To address this objective, the researcher created summated scales. “A
summated scale is a composite value for a set of variables calculated by such
simple procedures as taking the average of the variables in the scale” (Hair et al,
1998, p. 129). The Situational subscale mean for each respondent was
calculated by taking the sum value of the following nine items: 1, 2, 7, 8, 13, 16,
17, 18, and 19 from the Barriers to Participation in Education Freshmen Survey
and dividing by 9. The Institutional subscale mean for each respondent was
calculated by dividing by 10 the sum value of the following 10 items from the
Barriers to Participation in Education Freshmen Survey: 3, 4, 5, 9, 11, 12, 14,
24, 25, and 29. Likewise, the Dispositional subscale mean was calculated by
taking the sum value of the following eleven items from the Barriers to
Participation in Education Freshmen Survey: 6, 10, 15, 20, 21, 22, 23, 26, 27,
28, and 30 and dividing by 11. To facilitate the reporting of these findings, the
researcher established a scale to be used for the three subscales. The following
scale was used to guide the interpretation of the responses to coincide with the
five response categories provided to the respondents:
1.0 – 1.50 - Not a Concern
1.51 – 2.50 - Minor Concern
2.51 -- 3.50 - Average Concern

51
3.51 – 4.50 - Major Concern
4.51 – 5.00 - Overwhelming Concern
Table 4.8 presents the ranked means, standard deviations, Cronbach’s
Coefficient Alpha, and minimum and maximum response of each subscale of the
Barriers to Participation in Education Freshmen Student Survey. See Appendix B
for a copy of the survey instrument.
Table 4.8
Ranked Means, Standard Deviations, Cronbach’s Coefficient Alpha, Minimum and Maximum for the Three Barrier Subscales Subscale M SD Cronbach
Alpha Coefficient
Minimum Maximum
Institutional 2.21 .71 .79 1 5
Situational 2.03 .62 .73 1 5
Dispositional 1.94 .67 .80 1 5
Note. N = 1,071; Interpretative scale: Overwhelming Concern—4.51 – 5.0; Major Concern—3.51 – 4.50; Average Concern—2.51 – 3.50; Minor Concern—1.51 – 2.50; and Not a Concern—1.0 – 1.50. Instrument scale: Overwhelming Concern = 5; Major Concern = 4; Average Concern = 3; Minor Concern = 2; and Not a Concern = 1.
Using the interpretative scale, the computed mean scores of the three
subscales for each of the respondents were examined and placed into the
corresponding levels of concern. Frequencies and percentages were calculated
for each level of concern, on each of the three subscales and are presented in
Table 4.9.
The Situational subscale mean score was 2.03 (SD = .62). A cumulative
count of the Situational subscale mean scores revealed that 81.1% (n = 869) of
the respondents’ mean Situational subscale scores were classified as either “Not

52
a concern” or a “Minor Concern”. The remaining 18.9% (n = 202) of the
respondents’ Situational subscale mean scores were in the average, major, or
overwhelming concern levels (see Table 4.9).
When examining each of the nine items individually that made up the
Situational subscale, the item with the highest mean was “Cost for such things as
books, learning materials, child care, transportation, or tuition”. An overwhelming
majority (82.5% or n = 883) of the respondents indicated that they felt an
average, major, or overwhelming concern for this item The individual item on the
Situational subscale with the lowest mean score (M =1.31, SD =.75) and “Not a
Concern” for 874 (82%) of the respondents was “My family doesn’t like the idea”.
See Appendix G for individual item means and frequency of responses by level
of concern and Appendix F for a list of items in each of the Barrier Subscales.
On the Institutional subscale, the respondents had a subscale mean score
of 2.21 (SD = .71), with 70.5% of the respondents’ Institutional subscale scores in
the “Not a concern” or “Minor Concern” categories. This mean score (2.21) on
the Institutional subscale is interpreted as a minor concern. However, nearly 30%
(n = 316, 29.5%) of the respondents’ mean subscale scores did indicate an
average, major, or overwhelming level of concern for the items in the Institutional
subscale (see Table 4.9).
The individual items with the highest mean scores (those of most concern
on the Institutional subscale) were the items “Amount of time required to
complete the program” (M = 2.52, SD = 1.05); “Not enough information about
who to contact (M = 2.48, SD = 1.27) and “Financial Aid applications are
confusing” (M = 2.41, SD = 1.42). The item “Don’t meet requirements to begin

53
program” (M = 1.52, SD = .95) had the lowest mean score on the Institutional
subscale. See Appendix G for individual item means and frequency of responses
by level of concern and Appendix F for a list of items in each of the Barrier
Subscales.
On the subscale labeled Dispositional, the subscale mean score was 1.94
(SD = .67), indicating again a level of minor concern. A little more than 80% (n =
860) of the respondents’ mean scores were either “Not a concern” or “Minor
concern” for the items on this subscale. Almost 20% (n = 211) of the
respondents’ mean Dispositional subscale scores were interpreted as an
average, major, or overwhelming level of concern (see Table 4.9).
Table 4.9
Descriptive Statistics for Situational, Institutional, and Dispositional Subscales Mean Scores by Level of Concern Level of Concern Situational Institutional Dispositional
n % n % n %
Not a Concern 207 19.3 208 19.4 319 29.8
Minor Concern 662 61.8 547 51.1 541 50.5
Average Concern 179 16.8 271 25.3 186 17.4
Major Concern 22 1.8 40 3.7 22 2.0
Overwhelming Concern 3 0.3 5 0.5 3 .3
Totals 1,071 100.0 1,071 100.0 1,071 100.0
Note. N = 1,071; Interpretative scale: Overwhelming Concern—4.51 – 5.0; Major Concern—3.51 – 4.50; Average Concern—2.51 – 3.50; Minor Concern—1.51 – 2.50; and Not a Concern—1.0 – 1.50. Instrument scale: Overwhelming Concern = 5; Major Concern = 4; Average Concern = 3; Minor Concern = 2; and Not a Concern = 1.

54
The highest scored individual item on the Dispositional subscale was
“Afraid I’ll fail” (M = 2.52, SD = 1.44). The item “Afraid that I’m too old to begin”
was the item with the lowest individual item mean in this subscale (M = 1.28, SD
= .79). See Appendix G for individual item means and frequency of responses by
level of concern and Appendix E for a list of items in each of the barrier
subscales.
Overall, the group exhibited greater levels of concern for the items
grouped on the Institutional subscale. About 30% of the respondents indicated
from average to overwhelming concern for Institutional items, while 18.9% and
19.7% indicated those same levels of concern for the Situational and
Dispositional items respectively (see Table 4.9).
Objective 4. The fourth objective was to determine if differences existed in
perceptions of barriers to participation in educational programs, as measured by
the Situational, Institutional, and Dispositional subscale scores on the Barriers to
Participation in Education Freshmen Student Survey, based on the following
demographic characteristics: Age; Gender; Family obligations (defined as the
number of dependents in the student’s immediate household); Employment
status (if employed, 1-31 hours per week or 32 or more hours per week); Marital
status; Household income; Enrollment status (full- or part-time); Ethnicity; and
Degree program.
Objective 4 (a). Objective 4 (a) sought to determine if differences existed in
respondents’ scores on the three subscale means (Situational, Institutional, and
Dispositional) based on age. Respondents were placed into one of two age

55
groups (ages 16-24 and ages 25 and above) and then the three subscale scores
were compared using the t-test for independent samples statistical procedure.
Before performing the t-test for independent samples, Levene’s Test for
equality of variances was used to determine which result of the t-test to report.
There was no evidence to suggest that the Institutional or Situational variances
differed. However, on the Dispositional subscale mean score there was an
indication that the sample variances were different and that the homogeneity
assumption had been violated. The Levene’s test for equality of variances for the
Dispositional variable had an F value = 6.31 with a p = .01.
The data results from the independent samples t-test of the subscale
means by age revealed there was a significant difference on the Situational
subscale, (t = -4.01, df = 1,067, and p < .01). Table 4.10 presents the results of
the t-test. A comparison of mean scores on the Situational subscale showed that
those who were non-traditional students (25 and over) reported a significantly
higher mean score on the Situational subscale (M = 2.00, SD = .61) than did the
traditional group, ages 16-24 (M = 2.24, SD = .63). The Dispositional mean score
and Institutional mean score showed no significant differences based on age
(see Table 4.11).
Table 4.10
Independent Samples t-Test for Differences in Subscale Mean Scores by Age Group
Subscale t df pSituational -4.01 1,067 <.01
Institutional -.77 1,067 .44
Dispositional -1.68 137 .10

56
Table 4.11 Comparison of Situational, Institutional, and Dispositional Subscale Means by Age Group
Subscale Age Group n M SD
Situational Traditional 953 2.00 .61 Non-Traditional 116 2.24 .63
Institutional Traditional 953 2.20 .71 Non-Traditional 116 2.25 .70
Dispositional Traditional 953 1.92 .65 Non-Traditional 116 2.05 .75
Note. N = 1,069; Interpretative scale: Overwhelming Concern—4.51 – 5.0; Major Concern—3.51 – 4.50; Average Concern—2.51 – 3.50; Minor Concern—1.51 – 2.50; and Not a Concern—1.0 – 1.50. Instrument scale: Overwhelming Concern = 5; Major Concern = 4; Average Concern = 3; Minor Concern = 2; and Not a Concern = 1. Objective 4 (b). Objective 4 (b) sought to determine if differences existed in
respondents’ scores on the three subscales (Situational, Institutional, and
Dispositional) based on gender. To address this objective, independent samples
t-tests were used to analyze the data.
Before performing the t-test for independent samples, Levene’s Test for
the Equality of Variances was used to determine which t-test value to report.
There was no evidence to suggest that the Institutional or Dispositional groups’
variances differed. However, there was evidence that there was a difference in
the variances on the Situational subscale mean score (F = 4.64, p = .03);
therefore the t-test value for “variances not assumed” was used to report the
level of significance for that subscale. Results from the independent samples t-
test revealed no significant differences on any of the subscales relative to gender
(see Table 4.12).

57
Table 4.12
Independent Samples t-Test for Differences in Subscale Mean Scores by Gender
t df p
Situational -.66 587 .51
Institutional -1.88 1,069 .06
Dispositional -1.78 1,069 .08
For females, the mean score on the Situational subscale was M = 2.02,
SD = .59 (n = 732) and for males, the Situational mean score was M = 2.05, SD =
.68 (n = 339). Regarding the Institutional subscale score, the female mean score
was 2.18, (SD = .70) and for males, the mean Institutional subscale score was
2.27 (SD = .73). On the Dispositional subscale, the females’ mean scores
resulted in M = 1.91, SD = .66 and the males’ mean scores were M = 1.99, SD =
.68 (see Table 4.13).
Objective 4 (c). Objective 4 (c) sought to determine if differences existed in
respondents’ scores on the three subscales (Situational, Institutional, and
Dispositional) based on family obligations. A family obligation was defined as the
number of dependents living in the household with the respondent at the time of
the survey. The respondents were asked to give the number of dependents (if
any) on the survey. A large majority (86.5%) reported having no other
dependents and only one respondent indicated having six dependents. No one
reported more than six dependents in the household.
To address this objective, the Pearson Product Moment correlation
procedure was used to analyze the data. The correlation coefficients for family

58
Table 4.13
Comparison of Situational, Institutional, and Dispositional Subscale Means by Gender
Subscale Gender n M SD
Situational Female 732 2.02 .59
Male 339 2.05 .68
Institutional Female 732 2.18 .70
Male 339 2.27 .73
Dispositional Female 732 1.91 .66
Male 339 1.99 .68
Note. N = 1,071; Interpretative scale: Overwhelming Concern—4.51 – 5.0; Major Concern—3.51 – 4.50; Average Concern—2.51 – 3.50; Minor Concern—1.51 – 2.50; and Not a Concern—1.0 – 1.50. Instrument scale: Overwhelming Concern = 5; Major Concern = 4; Average Concern = 3; Minor Concern = 2; and Not a Concern = 1. obligation and each of the three subscale means indicated that a significant
relationship existed between the Situational subscale mean score and family
obligations (r(1,070) = .18, p <.01). The r-value of .18 indicated little, if any,
positive correlation (Hinkle, Wiersma & Jurs, 1988, p. 118).
The nature of the association between the variables was such that the
more dependents that the respondent reported having the higher the Situational
subscale mean score. The correlation between the Institutional and Dispositional
subscale mean scores and family obligations was not found to be statistically
significant (see Table 4.14).

59
Table 4.14
Pearson Product Moment Correlation Coefficients for Situational, Institutional, and Dispositional Mean Scores and Family Obligations n r p
Situational 1,070 .18 <.01
Institutional 1,070 .03 .29
Dispositional 1,070 .05 .10
Objective 4 (d). Objective 4 (d) sought to determine if differences existed in
respondents’ mean scores on the three subscales (Situational, Institutional, and
Dispositional) based on their employment status. Respondents were asked to
mark one of three choices on the survey. The first choice (coded with a 0)
indicated the student was not employed. The next two choices determined
whether the respondents worked 1-31 hours per week (coded with a 1) or 32 or
more hours per week (coded with a 2).
First, a t-test for independent samples was used to determine if
differences existed in the mean scores of the three subscales by employment
status (defined as whether the person was employed or not). Then, a second
independent samples t-test was performed to determine if differences existed
between the group that reported working part-time (1-31 hours per week) and the
group that reported working full-time (32 or more hours per week).
Before performing the first t-test for independent samples, the Levene’s
Test for the equality of variances was used to test the homogeneity of variance
assumption. Results indicated there was no evidence to suggest that the
Institutional or Situational groups’ variances differed. However, there was

60
evidence that there was a significant difference between the sample variances on
the Dispositional subscale (F = 4.06, p = .04), therefore the corresponding t-value
for “variances not assumed” was reported for that subscale.
The results of the first t-test indicate a significant difference on the
Situational mean score (t = 4.16, df = 1,056, and p < .01) and whether or not the
respondent was employed, as shown in Table 4.15. A comparison of mean
scores on the Situational subscale showed that those who were employed had a
significantly higher mean score on the Situational subscale than those who were
not employed (see Table 4.16). The Dispositional and Institutional subscale
scores showed no significant differences based on employment status (whether
or not the respondent was employed).
Table 4.15
Independent Samples t-Test for Differences in Subscale Mean Scores by Employment Status
t df p
Situational -4.16 1,056 <.01
Institutional -.02 1,056 .98
Dispositional -.93 794 .35
The second independent samples t-test was performed to determine if
differences existed between the group that reported working part-time (1-31
hours per week) and the group that reported working full-time (32 or more hours
per week) on their scores on the Situational, Institutional, and Dispositional
subscales. Based on results of the Levene’s test, the variances for the groups
are equal. Results of the t-test indicated a statistically significant difference was

61
Table 4.16
Comparison of Situational, Institutional, and Dispositional Subscale Means by Employment Status Subscale Employment
Status n M SD
Situational Not employed 655 1.97 .60 Employed 403 2.13 .64
Institutional Not Employed 655 2.20 .71 Employed 403 2.20 .71
Dispositional Not Employed 655 1.92 .64 Employed 403 1.96 .70
Note. N = 1,058; Interpretative scale: Overwhelming Concern—4.51 – 5.0; Major Concern—3.51 – 4.50; Average Concern—2.51 – 3.50; Minor Concern—1.51 – 2.50; and Not a Concern—1.0 – 1.50. Instrument scale: Overwhelming Concern = 5; Major Concern = 4; Average Concern = 3; Minor Concern = 2; and Not a Concern = 1. found for the Situational mean score (t = 2.74, df = 401, and p = .01), as shown in
Table 4.17. A comparison of the Situational subscale mean scores indicated that
the students working full time (more than 32 hours per week) had significantly
higher mean scores on the Situational subscale than those working part time (1-
31 hours per week). See Table 4.18 for a comparison of those Situational
subscale means.
Table 4.17 Independent Samples t-Test for Differences in Subscale Mean Scores by Full-Time or Part-Time Employment Status
t df p
Situational -2.74 401 .01
Institutional -.53 401 .60
Dispositional -.1.47 401 .14

62
Table 4.18 Comparison of Situational, Institutional, and Dispositional Subscale Means by Full-Time or Part-Time Employment Status Subscale n M SD
Situational
Full-Time 114
2.27 .59
Part-Time 289 2.07 .65
Institutional Full-Time 114 2.23 .68
Part-Time 289 2.19 .73
Dispositional Full-Time 114 2.04 .64 Part-Time 289 1.93 .72
Note. N = 403; Interpretative scale: Overwhelming Concern—4.51 – 5.0; Major Concern—3.51 – 4.50; Average Concern—2.51 – 3.50; Minor Concern—1.51 – 2.50; and Not a Concern—1.0 – 1.50. Instrument scale: Overwhelming Concern = 5; Major Concern = 4; Average Concern = 3; Minor Concern = 2; and Not a Concern = 1.
Objective 4 (e). Objective 4 (e) sought to determine if differences existed in
respondents’ scores on the three subscales (Situational, Institutional, and
Dispositional) based on marital status. The categories were coded as:
single/head of household = 1, married = 2; widowed = 3, divorced or separated =
4, and single = 5. Because the group “Widowed” had only one respondent it was
recoded into the “Single/Head of Household” group. A one-way analysis of
variance indicated that there was a statistically significant difference among the
marital status groups on the Situational subscale score. The ANOVA revealed no
significant differences for the Institutional and Dispositional scores by categories
of marital status. The Levene’s test indicated that the homogeneity of variance
assumption had not been violated and that the sample variances for the groups
were equal. See Table 4.19 for the results of the ANOVA for each of the three
subscale mean scores.

63
Table 4.19
Analysis of Variance of Situational, Institutional, and Dispositional Mean Scores by Marital Status
Subscale df F p
Situational 3, 1,065 14.05 <.01
Institutional 3, 1,065 0.76 0.52
Dispositional 3, 1,065 0.93 0.42 Note. N = 1,069
The ANOVA comparing the subscale mean scores by marital status
categories revealed a significant difference among the marital status categories
on the Situational subscale score (F(3,1,065 = 14.05, p < .01). Table 4.20
presents the analysis of variance information regarding the significant marital
status finding.
Using the Tukey’s multiple comparisons technique, significant differences
were found between single and single/head of household marital choice
categories on the Situational subscale mean score. Those respondents who
indicated they were single/head of household had a significantly higher mean (M
= 2.40, SD = .73) than those individuals who indicated they were single (M =
1.97, SD = .60). Therefore, the students who had indicated single/head of
household experienced a higher level of concern for the situational subscale
items, than did the students who were single. No statistically significant
differences were found between any of the other groups relative to Situational
subscale mean scores. For the entire sample of 1,071 students, the Situational
mean subscale score was 2.03. Table 4.21 provides the Situational mean

64
subscale scores and identifies the significant comparisons with superscript
annotations.
Table 4.20
Analysis of Variance of the Situational Subscale by Marital Status
Source df SS F p
Between Groups 3 15.71 14.05 <.01
Within Groups 1,065 397.00
Total 1,068 412.71
Table 4.21
Situational Subscale Mean Scores by Marital Status
Marital Status n M SD
Single/Head of Household 80 2.40b .73
Married 85 2.17ab .62
Divorced/Separated 28 2.17ab .56
Single 876 1.97a .60
Total 1,069 2.03 .62
Note. F (3, 1,065) = 14.04, p < .01. a, b Means not sharing a common superscript were significantly different at p < .05 (Tukey’s post hoc multiple comparisons test) Objective 4 (f). Objective 4 (f) sought to determine if differences existed in
respondents’ mean scores on the three subscales (Situational, Institutional, and
Dispositional) based on household income. The respondents were given nine
income ranges to choose from on the survey. They were coded as follows: Under
$10,000 = 1, $10,999 to $19,999 = 2, $20,000 to $29,999 = 3, $30,000 to
$39,999 = 4, $40,000 to $59,999 = 5, $60,000 to $74,999 = 6, $75,000 to

65
$99,999 = 7, $100,000 and over = 8, and “Don’t know” = 9. A one-way analysis of
variance (ANOVA) indicated that there was a statistically significant difference
between the household income groups on the Situational subscale (F(8,1,061 =
5.30, p < .01). The Levene’s test indicated that the homogeneity of variance
assumption had not been violated and that the sample variances for the groups
were equal. The ANOVA revealed no significant differences for the Institutional
and Dispositional scores by categories of household income (see Table 4.22).
Table 4.22 Analysis of Variance of the Situational, Institutional, and Dispositional Subscale Mean Scores by Household Income
df F p
Situational 8, 1061 5.30 <.01
Institutional 8, 1061 1.65 .11
Dispositional 8, 1061 0.40 .92
Note. N = 1,069
Tukey’s post hoc multiple comparisons test was used to follow up the
significant F value on the Situational subscale (F(8,1,061 = 5.30, p < .01) to
determine which groups were significantly different. Results of this procedure
revealed that the Situational subscale mean score for those students who chose
the “Under $10,000” (M = 2.21) level was significantly different than the subscale
mean scores of those students in the $40,000-$59,999 (M = 1.94), the $100,000
and over (M = 1.79), and the “Don’t Know” (M = 1.96) income groups. The
students in the “Under $10,000” income group indicated significantly higher
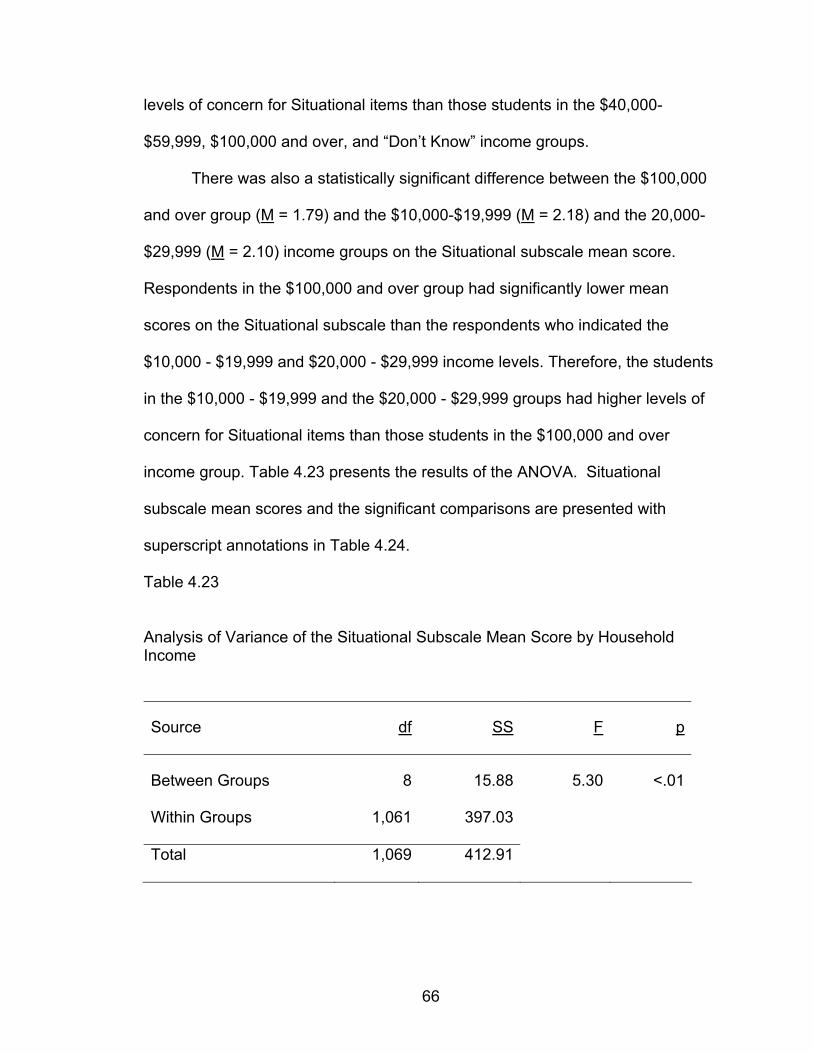
66
levels of concern for Situational items than those students in the $40,000-
$59,999, $100,000 and over, and “Don’t Know” income groups.
There was also a statistically significant difference between the $100,000
and over group (M = 1.79) and the $10,000-$19,999 (M = 2.18) and the 20,000-
$29,999 (M = 2.10) income groups on the Situational subscale mean score.
Respondents in the $100,000 and over group had significantly lower mean
scores on the Situational subscale than the respondents who indicated the
$10,000 - $19,999 and $20,000 - $29,999 income levels. Therefore, the students
in the $10,000 - $19,999 and the $20,000 - $29,999 groups had higher levels of
concern for Situational items than those students in the $100,000 and over
income group. Table 4.23 presents the results of the ANOVA. Situational
subscale mean scores and the significant comparisons are presented with
superscript annotations in Table 4.24.
Table 4.23 Analysis of Variance of the Situational Subscale Mean Score by Household Income
Source df SS F p
Between Groups 8 15.88 5.30 <.01
Within Groups 1,061 397.03
Total 1,069 412.91

67
Table 4.24 Situational Mean Subscale Scores for Household Income
Household Income n M SD
Under $10,000 170 2.21a .64
$10,000-$19,999 116 2.18ab .62
$20,000-$29,999 91 2.10ab .56
$30,000-$39,999 88 1.97ab .61
$40,000-$59,999 120 1.94b .54
$60,000-$74,999 74 1.99ab .53
$75,000-$99,999 60 1.96ab .75
$100,000 and over 65 1.79b .62
Don’t Know* 286 1.96b .62
Total 1,070 2.03 .62
Note. F (8, 1,061) = 5.30, p < .01. a, b Means not sharing a common superscript were significantly different at p < .05 (Tukey’s post hoc multiple comparisons test). *Don’t Know—Respondents marked that they did not know what the household income was for their family. Objective 4(g). Objective 4 (g) sought to determine if differences existed in
respondents’ mean scores on the three subscales (Situational, Institutional, and
Dispositional) by ethnicity. Analysis of variance (ANOVA) was used to determine
if there were significant differences among the groups labeled Caucasian, African
American, American Indian, Hispanic, Asian, and other. The results of the
ANOVA for each of the subscale scores are presented in Table 4.25. Significant
F-values were found on two of the three subscales examined, namely, the

68
Situational and Institutional subscales. There was no significant difference for the
Dispositional subscale mean score relative to ethnicity.
Table 4.25
Analysis of Variance of the Situational, Institutional, and Dispositional Subscale Mean Scores by Ethnicity
Subscale df F p
Situational 5, 1,060 5.86 <.01
Institutional 5, 1,060 5.73 <.01
Dispositional 5, 1,060 1.36 .24
When computing the ANOVA, comparing the mean subscale scores by
ethnicity of the students, a significant difference was found (F(5, 1,060) = 5.82, p
< .01) on the Situational subscale. The Levine statistic for the test of
homogeneity of variances was not significant for the Situational subscale mean
score, indicating that the homogeneity of variances assumption had not been
violated. Therefore, the Tukey’s HSD was used to determine the nature of the
differences among ethnic groups. This analysis revealed statistically significant
differences between students who were in the Caucasian (M = 1.96, SD = .58)
and African American (M = 2.16, SD = .69) ethnic groups. The Situational
subscale means of those students who had indicated the ethnic group Caucasian
was significantly lower than the students who indicated they were African
American. Table 4.26 presents the results of the ANOVA. Table 4.27 provides
the Situational mean subscale scores and identifies the significant comparisons
with superscript annotations.

69
Table 4.26 Analysis of Variance of the Situational Subscale by Ethnicity
Source df SS F p
Between Groups 5 11.10 5.86 <.01
Within Groups 1,060 401.85
Total 1,065 412.95 Table 4.27 Situational Mean Subscale Scores for Ethnicity
Ethnic Group n M SD
Asian 2 2.50ab .86
Other 18 2.28ab .63
American Indian 26 2.25ab .78
African American 293 2.16a .69
Caucasian 715 1.96b .58
Hispanic 12 1.93ab .42
Total 1,066 2.03 .63Note. F (5, 1,060) = 5.86, p < .01. a, b Means not sharing a common superscript were significantly different at p < .05 (Tukey’s post hoc multiple comparisons test)
When computing the ANOVA comparing the three subscale means by
ethnicity, a significant difference was also found on the Institutional subscale
mean score (F(5,1,060)=5.730, p < .01). Also of importance, the Levine statistic
for the test of homogeneity of variances proved significant for the Institutional
mean score, indicating that the homogeneity of variances assumption had been
violated. Because the sample size was large, a post hoc Tamhane’s T2 multiple

70
comparisons test was used to report significant differences. The Tamhane T2 test
is a conservative post hoc procedure, appropriate when the variances are
unequal. This analysis also revealed significant differences for the students who
were in the Caucasian (M = 2.13, SD = .66) and African American (M = 2.35, SD
= .80) ethnic groups. The Institutional subscale mean scores of those students
who had indicated the ethnic group Caucasian was significantly lower than the
students who indicated the African American ethnic group. Table 4.28 presents
the results of the ANOVA. Table 4.29 provides the Institutional subscale mean
scores and identifies the significant comparisons with superscript annotations.
Table 4.28
Analysis of Variance of the Institutional Subscale by Ethnicity
Source df SS F p
Between Groups 5 14.20 5.73 <.01
Within Groups 1,060 525.47
Total 1.065 539.67
Objective 4 (h). Objective 4 (h) sought to determine if differences existed in
respondents’ mean scores on the three subscales (Situational, Institutional, and
Dispositional) based on enrollment status. Two possible choices existed for this
variable—full-time or part time. To address this objective an independent
samples t-test was performed. Prior to performing the t-test, a Levene’s Test for
the Equality of Variances was used to determine if homogeneity of variance
could be assumed and which result of the independent samples t-test to report.
There was evidence to suggest that variances differed on the Dispositional

71
Table 4.29 Institutional Mean Subscale Scores by Ethnicity
Ethnic Group n M SD
Other 18 2.61 ab .69
American Indian 26 2.40 ab .80
African American 293 2.35 a .80
Asian 2 2.35 ab .21
Hispanic 12 2.14 ab .50
Caucasian 715 2.13 b .66
Total 1,066 2.21 .71
Note. F (5, 1,060) = 5.73, p < .01. a, b Means not sharing a common superscript were significantly different at p < .05 (TamhaneT2 post hoc multiple comparisons test)
subscale only (F = 5.86, p = .02), therefore, the t-test values for equal variances
not assumed was reported for that variable.
An independent samples t-test was calculated to compare the subscale
mean scores of the part-time and full-time students. The independent samples t-
test comparing the subscale mean scores of full-time and part-time students
found a significant difference between the means of the two groups on the
Dispositional subscale (t(90) = -2.06, p = .04 ). See Table 4.30 for independent
samples t-test results. The Dispositional subscale mean score of the part-time
students was significantly higher (M = 2.10, SD = .74) than the mean of the full-
time students (M = 1.92, SD = .66). Part-time students indicated higher levels of

72
concern for the items listed on the Dispositional subscale than did the full-time
students in this study (see Table 4.31).
Table 4.30
Independent Samples t-Test for Differences in Subscale Mean Scores by Enrollment Status
Subscale t df p
Situational -1.91 1,065 .06
Institutional -1.30 1,065 .19
Dispositional -2.06 90 .04
Table 4.31
Comparison of Situational, Institutional, and Dispositional Subscale Means by Enrollment Status Subscale Enrollment Status n M SD
Situational Full-Time 987 2.01 .62 Part-Time 80 2.15 .59
Institutional Full-Time 987 2.20 .71 Part-Time 80 2.30 .72
Dispositional Full-Time 987 1.92 .66 Part-Time 80 2.10 .74
Note. N = 1,067; Interpretative scale: Overwhelming Concern—4.51 – 5.0; Major Concern—3.51 – 4.50; Average Concern—2.51 – 3.50; Minor Concern—1.51 – 2.50; and Not a Concern—1.0 – 1.50. Instrument scale: Overwhelming Concern = 5; Major Concern = 4; Average Concern = 3; Minor Concern = 2; and Not a Concern = 1
Objective 4(i). Objective 4 (i) sought to determine if differences existed in
respondents’ mean scores on the three subscales (Situational, Institutional, and
Dispositional) by degree program. To make these subscale comparisons by
degree program, the ANOVA procedure was used. The degree program was

73
grouped based on the following categories: Certificate program, Associate
Degree, Bachelor Degree, Non-Degree Seeking Student, and Have Not Decided.
The results of the ANOVA for each of the subscale scores are presented in Table
4.32. Significant F values were found for two of the three subscales examined,
namely the Situational and Dispositional. Each of these comparisons is
presented in a relevant ANOVA table with accompanying post-hoc comparisons.
Table 4.32
Analysis of Variance of the Situational, Institutional, and Dispositional Subscale Mean Scores by Degree Program
df F p
Situational 4, 1,055 2.54 .04
Institutional 4, 1,055 .65 .62
Dispositional 4, 1,055 6.67 <.01
Note. N = 1,060
When computing the ANOVA comparing the degree program choices of
the students, a significant difference was found among the degree program
choices (F(4,1,055) = 2.58, p = .04) on the Situational subscale. The Levine
statistic for the test of homogeneity of variances was not significant for the
Situational subscale mean score, indicating that the homogeneity of variances
assumption had not been violated. Therefore, the Tukey’s HSD was used to
determine the nature of the differences among degree programs.
This analysis revealed that those students who had indicated the
Associate Degree choice had Situational subscale mean scores that were
significantly higher than only one other group, the Bachelor Degree group. The

74
Situational subscale mean scores of those students in the Associate Degree
program were significantly higher than those students in the Bachelor Degree
program. Therefore, the students in the Associate Degree program indicated
higher levels of concern for the Situational subscale items than those students in
the Bachelor Degree program. Those students who listed the degree program
“Certificate”, “Non-degree seeking”, and “Have not Decided” were not
significantly different from any of the other degree program groups. Table 4.33
presents the results of the ANOVA. Table 4.34 provides the Situational mean
subscale scores and identifies the significant comparisons with superscript
annotations.
Table 4.33 Analysis of Variance of the Situational Subscale by Degree Program
Source df SS F p
Between Groups 4 3.96 2.58 .04
Within Groups 1,055 404.07
Total 1,059 408.03
When computing the ANOVA comparing the degree program choices of
the students, a significant difference was found among the degree program
choices (F(4,1,055) = .6.68, p < .01) on the Dispositional subscale. The Levine
statistic for the test of homogeneity of variances was not significant for the
Dispositional subscale mean score, indicating that the homogeneity of variances
assumption had not been violated. Therefore, the Tukey’s HSD was used to
determine the nature of the differences among degree programs.

75
Table 4.34 Situational Mean Subscale Scores by Degree Program
Degree Program n M SD
Associate Degree 155 2.17 a .64
Have not Decided 120 2.04ab .57
Non-Degree Seeking 19 2.00ab .54
Bachelor Degree 745 1.99 b .62
Certificate Program 21 1.95ab .68
Total 1,060 2.02 .62Note. F (4, 1,055) = 2.58, p = .04 a, b Means not sharing a common superscript were significantly different at p < .05 (Tukey’s post hoc multiple comparison test)
This analysis revealed that those students who chose the “Have not
decided” option scored significantly higher than those students in the Associate
and Bachelor Degree programs on the Dispositional subscale. The Dispositional
subscale mean scores of those students in the “Have not Decided” degree
program group were significantly higher than those students in the Associate
Degree Program and the Bachelor Degree Program. Therefore, the students in
the “Have not decided” group indicated a higher level of concern for Dispositional
items than those students in the Associate and Bachelor degree programs.
Those students in the certificate and “non-degree seeking” programs were not
significantly different from any of the other degree program groups. Table 4.35
presents the results of the ANOVA. Table 4.36 provides the Dispositional mean
subscale scores and identifies the significant comparisons with superscript
annotations.

76
Table 4.35
Analysis of Variance of the Dispositional Subscale by Degree Program
Source df SS F p
Between Groups 4 11.58 6.67 <.01
Within Groups 1,055 457.51
Total 1,059 469.09
Table 4.36 Dispositional Mean Subscale Scores by Degree Program
Degree Program n M SD
Have not Decided 120 2.20 a .73
Non-Degree Seeking 19 2.14ab .59
Associate Degree 155 1.96 b .71
Bachelor Degree 745 1.88 b .64
Certificate Program 21 1.79ab .62
Total 1,060 1.93 .67
Note. F (4, 1,055) = 6.68, p < .01. a, b Means not sharing a common superscript were significantly different at p < .05 (Tukey’s post hoc multiple comparison test)
Objective 5. Objective 5 sought to determine if a model existed which
explained a significant portion of the variance in the mean scores of the
Situational, Institutional, and Dispositional subscales of the Barriers to
Participation in Education Freshmen Student Survey based on the following
demographic variables: age, gender, family obligations, employment status,

77
marital status, household income, enrollment status, ethnicity, and degree
program.
This objective was accomplished by using multiple regression analysis.
The three mean subscale scores served as the dependent variables. The
independent variables were age, gender, family obligations, employment status,
marital status, household income, enrollment status, ethnicity, and degree
program. Because there were three separate subscales, three separate analyses
were calculated. Because of the exploratory nature of this part of the study, a
stepwise entry of the variables was used in this model. All three regression
equations included variables that contributed at least one percent to the
explained variance, as long as the overall model remained significant.
The dependent variables in this analysis were the mean scores on each of
the subscales of the survey, Situational, Institutional, and Dispositional. Three of
the independent variables, ethnicity, marital status, and degree program, were
transformed into numerous variables that were dichotomous in nature. Ethnicity
was transformed into six new variables. They were (1) Caucasian, (2) African
American, (3) American Indian, (4) Hispanic, (5) Asian, or (6) Other ethnic group.
The independent variable marital status was transformed into four new variables,
(1) single/head of household, (2) married, (3) Divorced/Separated, and (4) single.
The transformation of the independent variable degree program resulted in five
new variables. They were (1) certificate program, (2) associate degree, (3)
Bachelor Degree, (4) non-degree seeking student, and (5) Have not decided on
degree. The process of coding the dichotomous variables consisted of recoding
the original variable in SPSS® and assigning a “1” if the responded indicated a

78
presence of the characteristic and a “0” if the respondent indicated an absence of
the characteristic.
The independent variables included in the analysis were examined for the
presence of multicollinearity. The preferred method of assessing multicollinearity
according to Lewis-Beck (1980) is to regress each independent variable on all
other independent variables so that the relationship of each of the independent
variables with all of the other independent variables is considered. If the R2 from
any of the equations which result from this procedure is near 1.0, there is high
multicollinearity. In doing the analysis to check if the cumulative R2 approached
1.0, the following variables were found to have perfect collinearity: Single,
Single/Head of Household, Married, and Divorced/Separated. Each of these four
dichotomous variables created from the variable marital status was found to be
perfectly collinear with the combination of the other three variables. For example,
the variable whether or not the student was single was perfectly collinear with the
combination of the variables whether or not the students were single/head of
household, whether or not the students were married, and whether or not the
students were divorced/separated. Therefore, one of the four variables had to be
eliminated from the analysis. The variable that was found to have the lowest
relationship with the dependent variables was selected for elimination from the
analyses. This was the variable whether or not the student was single. Therefore,
this variable was eliminated from the analyses, and the multicollinearity check
was redone to verify that this procedure eliminated the collinearity problem in the
data.

79
The first regression analysis, involved regressing the independent
variables against the dependent variable Situational subscale mean score was
conducted using stepwise entry of the variables. For descriptive purposes, the
two-way correlations between factors used as independent variables in the
regression and the Situational subscale mean score are presented in Table 4.37.
At least twelve of these independents variables were found to have significant
bivariate correlations with the mean scores on the Situational subscale.
Table 4.37
Relationship Between Selected Demographic Characteristics and the Situational Subscale Mean Scores Characteristic r p Household Income -.21 <.01 Family Obligations .20 <.01 Single/Head of Household .19 <.01 Age .16 <.01 Employment Status .16 <.01 Caucasian -.16 <.01 African American .14 <.01 Associate Degree Program .11 <.01 Bachelor Degree Program .09 <.01 Married .08 .02 American Indian .07 .03 Asian .06 .04 Divorced/Separated .06 .06 Other Ethnic .05 .09 Hispanic -.04 .15 Gender -.04 .16 Enrollment Status .03 .17 Certificate Degree Program .02 .30 Have not Decided Degree -.02 .34 Non-Degree Seeking .01 .43
The results of the first regression analysis, which involved regressing the
independent variables against the dependent variable situational mean score,
resulted in a significant model, F(3, 765) = 25.27, p < .01. The regression model

80
summary shows that the independent variables household income, number of
dependents, and single/head of household entered into the model. Table 4.38
presents the results of the multiple regression analysis. The first variable that
entered the regression model, household income, tended to be associated with a
decrease in mean scores on the Situational subscale (Beta = -.16). This variable
explained 4.5% of the variance in Situational subscale mean scores.
Two more variables explained an additional 4.5% of the variance in the
Situational subscale mean scores. These variables were family obligations
(defined as number of dependents in the household, Beta = .15) and whether or
not the respondents were single/head of household marital status (Beta = .14).
Both of these variables tended to be associated with an increase in Situational
subscale mean scores. Collectively, all three variables explained a total of 9% of
the variance in Situational subscale mean scores (see Table 4.38).
The second regression analysis which involved regressing all of the
independent variables against the dependent variable Institutional score resulted
in a significant model, F(3, 763) = 8.41, p < .01. For descriptive purposes, the
two-way correlations between factors used as independent variables in the
regression and the Institutional subscale mean score are presented in Table
4.39. At least four of these variables were found to have significant bivariate
correlations with the mean scores on the Institutional subscale.
In this second regression analysis, the independent variable whether or
not the student was Caucasian entered the regression model first and tended to
be associated with a decrease in mean scores on the Institutional subscale (Beta
= -.14). Whether or not the student was Caucasian provided explanation of only

81
Table 4.38
Multiple Regression Analysis of the Situational Subscale Mean Scores on Selected Characteristics
Source df SS F p
Regression 3 26.61 25.27 <.01
Residual 765 268.49
Total 768 295.10
Variables in the Equation
Variables R2 Cumulative R2 Change
F Change
p Change
Beta
Incomea .045 .045 36.30 .000 -.16 Dependentsb .071 .026 21.81 .001 .15 Single/headc .090 .019 15.59 .000 .14
Note. aHousehold income, bFamily Obligations, and cWhether or not student was single/head of household martial status.
Variables not in the Equation
Variables t Sig.
Employment Status 2.78 .01Caucasian -2.55 .01African American 1.85 .07Other Ethnic 1.56 .12American Indian 1.51 .13Enrollment Status -1.27 .21Hispanic -1.20 .23Bachelor Degree Program -1.00 .32Asian .96 .34Certificate Degree Program .60 .55Associate Degree Program .52 .60Undecided Degree Program .51 .61Age .49 .62 (table cont’d)

82
Non-Degree Seeking .32 .75Married .07 .94Gender .05 .96Div/Sepa -.04 .97
Note. aDivorced/Separated
Table 4.39
Relationship Between Selected Demographic Characteristics and the Institutional Subscale Mean Scores Characteristic r P Caucasian -.14 <.01 African American .12 <.01 Household Income -.12 <.01 Age .09 <.01 Other Ethnic .06 .06 Single/Head of Household .05 .08 American Indian .05 .09 Divorced/Separated .05 .09 Family Obligations .04 .12 Associate Degree Program .04 .15 Bachelor Degree -.04 .14 Employment Status .03 .21 Student Status .03 .24 Gender .03 .25 Asian .02 .33 Non-Degree Seeking .02 .33 Hispanic -.02 .26 Married .01 .36 Have not Decided Degree .01 .39 Certificate Degree Program -.01 .39
2% of the variance in mean scores on the Institutional subscale. No other
independent variable entered the model that explained at least 1% of the total
variance of the Institutional subscale mean score. Table 4.40 presents the results
of the multiple regression analysis.
The third regression analysis, which involved regressing the independent
variables against the dependent variable of Dispositional subscale mean score,

83
resulted in a significant model, F(2, 766) = 15.87, p < .01. For descriptive
purposes, the two-way correlations between factors used as independent
variables in the regression and the Dispositional subscale mean are presented in
Table 4.41. At least five of these variables were found to have significant
bivariate correlations with the mean scores on the Dispositional subscale.
Table 4.40
Multiple Regression Analysis of Institutional Subscale Mean Scores on Selected Characteristics
Source df SS F p
Regression 1 7.50 15.50 <.01
Residual 767 371.35
Total 768 378.85
Variables in the Equation
Variables R2 Cumulative
R2 Change F Change
p Change
Beta
Caucasiana .020 .020 15.50 .<.01 -.14
aWhether or not student was Caucasian ethnic group
Variables not in the Equation Variables t Sig.
Age 2.25 .02Divorced/Separated 1.39 .16Single/Head of Household 1.03 .30Gender .95 .34Other Ethnic .88 .38Family Obligations .79 .43Employment Status .76 .45Associate Degree Program .76 .45Undecided Degree Program .62 .54 (table cont’d)

84
Enrollment Status .59 .56American Indian .36 .72Married .33 .74Non-Degree Seeking .31 .76Asian .22 .83Certificate Degree Program -.22 .82African American -.25 .80Bachelor Degree Program -1.03 .30Hispanic -1.23 .22Household Income -2.23 .03
Table 4.41
Relationship Between Selected Demographic Characteristics and the Dispositional Subscale Mean Scores Characteristic r pHave not Decided Degree .17 <.01Age .12 <.01Bachelor Degree Program -.12 <.01American Indian .06 .05Asian .06 .05Family Obligations .06 .06Employment Status .06 .06Enrollment Status .05 .10Hispanic -.05 .10Single/Head of Household .05 .11Non-Degree Seeking .05 .11Household Income -.04 .13Divorced/Separated .04 .15Married .03 .22African American -.03 .22Gender .02 .27Caucasian .01 .39Associate Degree Program .01 .47Certificate Degree Program .00 .47Other Ethnic .00 .49
The regression model summary shows that the independent variables
whether or not the student was undecided on degree program and age entered
into the model. Table 4.42 presents the results of the multiple regression
analysis. The variable that entered the regression model first was whether or not

85
the student was undecided on degree program. This variable explained 2.7% of
the variance in mean scores on the Dispositional subscale and tended to be
associated with an increase in mean scores for this subscale (Beta = .16).
The only other variable that entered the model was age, which explained
an additional 1.3% of the variance in the mean subscale scores and tended to be
associated with an increase in mean scores on the Dispositional subscale (Beta
= .11). In total, these two variables explained 4.0% of the variance in mean
scores on the Dispositional subscale (see Table 4.42).
Table 4.42
Multiple Regression Analysis of Dispositional Subscale Mean Scores on Selected Characteristics
Source df SS F p
Regression 2 13.15 15.87 <.01
Residual 766 317.35
Total 768 330.50
Variables in the Equation
Variables R2 Change
R2 Cumulative
F Change p Change
Beta
Undecideda .027 .027 21.65 .000 .16 Age .013 .040 9.84 .002 .11 Note. aUndecided regarding degree program
(table cont’d)

86
Variables not in the Equation
Variables t Sig.
American Indian 1.69 .09 Asian 1.65 .10 Non-Degree Seeking 1.57 .12 Employment Status .89 .37 Single/Head of Household .88 .38 Gender .71 .48 Certificate Degree Program .28 .78 Enrollment Status .26 .79 Caucasian .12 .91 Other Ethnic .11 .91 Bachelor Degree Program -.05 .96 Divorced/Separated -.15 .88 Family Obligations -.24 .81 Associate Degree Program -.54 .59 Married -.65 .52 African American -.67 .50 Hispanic -1.18 .24 Household Income -1.32 .19
87
CHAPTER V
SUMMARY, CONCLUSIONS, AND RECOMMENDATIONS
Summary of Methodology
This research was designed to determine perceptions of barriers to
participation in educational programs among first-time entering college freshmen
based on their self-assessed scores on the Barriers to Participation in Education
Freshmen Survey and to further determine if differences existed among those
freshmen’s scores based on a number of independent variables. Information
gained from this study could be utilized by faculty and advisors to increase
student recruitment, retention, and success. Specifically, the objectives of the
study were to:
1. Describe first-time college freshmen enrolled at Northwestern State
University during the fall semester of 2000 in terms of the following
demographic variables: age, gender, family obligations, employment
status (if employed, part-time or full-time), marital status, household
income, enrollment status (full- or part-time), ethnicity and degree
program.
2. Determine perceptions of first-time enrolling college freshmen at
Northwestern State University regarding potential barriers to participation
in educational programs as measured by the Barriers to Participation In
Education Freshmen Survey.
3. Describe first-time college freshmen at Northwestern State University on
selected Situational, Dispositional, and Institutional variables as measured

88
by the three subscale scores of the Barriers to Participation in Education
Freshmen Student Survey.
4. Determine if differences exist in perceptions of barriers to participation in
educational programs, as measured by the Situational, Institutional, and
Dispositional subscale scores on the Barriers to Participation in Education
Freshmen Student Survey, based on the following demographic
characteristics: Age; Gender; Family obligations, Employment status (if
employed, part-time or full-time); Marital status; Household income;
Enrollment status (full- or part-time); Ethnicity; and Degree program.
5. Determine if a model exists which explained a significant portion of the
variance in the mean scores of the Situational, Institutional, and
Dispositional subscales of the Barriers to Participation in Education
Freshmen Student Survey based on the following demographic variables:
age, gender, family obligations, employment status, marital status,
household income, enrollment status, ethnicity, and degree program.
Population and Sample. The study was conducted at Northwestern State
University, a public-funded four-year state university located in northwest
Louisiana, with an enrollment of approximately 9,000 students. The target
population for the study was all first-time enrolling freshmen or freshmen who
had not earned credit hours at a college or university in the past ten years (N =
1,952). The accessible population included students enrolled in the freshmen
orientation class (OR 1010) during the fall 2000 semester who met the qualifying
criteria. There were 50 sections of Orientation 1010 with 1,730 students enrolled.

89
Data Collection and Analysis. All data for the study were collected from
the respondents’ answers to The Barriers to Participation in Education Freshmen
Survey. This survey contained a demographic section and a list of 30 anchored-
scaled items originally taken from a portion of the “Learning Interests and
Experiences of Adults Inventory” published by Carp, Peterson, & Roelfs (1972)
and later modified by Cross (1981), Byrd (1990), and Green (1998). The
respondents were then scored on three separate subscales—Situational,
Institutional, and Dispositional.
Data were collected during a two-day period when the freshmen students
attended consolidated orientation class sessions. Questionnaires were
distributed to all freshmen enrolled in Orientation 1010, who were present in
those consolidated class meetings. A total of 1,389 surveys were distributed and
1,079 of the students responded, with a total of 1,071 (85%) of the surveys being
used.
Data were analyzed using descriptive statistics appropriate for describing
the subjects with regard to each of the independent variables specified in the
objectives. An independent samples t-test was utilized to address objective 4 (a),
(b), (d), and (h), which sought to determine differences between the sample
means of two independent sets of data. The Pearson Product Moment
Correlation procedure was used to analyze objective 4 (c) and one-way analysis
of variance was used for the remainding parts of the objective. ANOVA tests the
overall hypothesis of difference between more than two groups. Appropriate post
hoc tests were performed for each of the ANOVAs. In order to determine if a
model existed that explained a significant portion of variance in the subscale

90
mean scores. Multiple regression analysis was used to investigate the final
objective. A one-factor factor analysis was conducted on the subscales, with all
three of the subscales producing acceptable factor loadings for each of the items
on the three subscales. An analysis of the items on the instrument and of the
subscales was conducted using the Cronbach Alpha Coefficient procedure.
Results produced acceptable levels of reliability that were equal to, greater than,
or slightly lower than values in a previous analysis (Green, 1998) of the survey
instrument. The Statistical Package for the Social Sciences (SPSS®) was used
for all data analysis.
Summary of Findings. In describing the particular characteristics of those
responding to the study, 89.1% or 953 students indicated that they were in the
traditional freshmen age group of 16-24 years of age. The remaining10.9% or
116 respondents were 25 years old and above, and were generally considered to
be in the non-traditional age group for first-time enrolling college freshmen. Over
two-thirds (68.3%) of the respondents in this study were female and the
remaining 339 (31.7%) were male. A majority, (86.6%) of the students indicated
having no dependents and most of them (81.8%) were single. Over 60% of the
respondents were not employed at the time of the study and of the 403 students
that indicated that they were employed, over two-thirds of them worked only part-
time—up to 31 hours per week. Just over 10% of the respondents indicated
working at a full-time job—over 32 hours per week. When asked about
household income, over one-fourth of the students responded with a “Don’t
Know” answer. Of the freshmen that did indicate one of the household income
categories, the largest percentage (15.9%) was found in the “Under $10,000”

91
income level. Almost all (92.2%) of the responding freshmen were full-time
students taking 12 or more hours the semester of the study. The largest two
ethnic groups represented in the study were Caucasian (67.1%) and African
American (27.5%). The most often selected program of study, with 745 of the
1,071 students, was the four-year Bachelor’s degree.
When the respondents’ individual item mean scores for each of the 30
items were computed, the analysis showed that the respondents indicated that
four items were of average concern, 21 items were of minor concern, and 5 items
were of no concern. No items were ranked as either a major or an overwhelming
concern. The highest item mean score of 3.47 (SD = 1.13) was found on “Costs
of such things as books, learning materials, childcare, transportation, or tuition”.
The lowest mean score of 1.28 (SD = .79) was for “Afraid that I’m too old to
begin”. These scores indicated that these students have from “average” to
“minor” concern levels for the possible barriers to participation in educational
programs. All individual item mean scores are presented in Appendix G.
The mean score for the Situational subscale score was 2.03. The
Institutional subscale mean score was ranked the highest at 2.21 and the
Dispositional subscale mean score was the lowest at 1.94. All three subscale
means were interpreted as “minor” concerns. Overall, the group exhibited greater
levels of concern for the items grouped on the Institutional subscale. About 30%
of the respondents indicated from average to overwhelming concern for
Institutional items, while 18.9% and 19.7% indicated those same levels of
concern for the Situational and Dispositional items, respectively.

92
Statistically significant differences were observed when comparing the
subscale mean scores and the independent variables (demographic
characteristics). The independent samples t-test provided significant findings
between the two age groups (16-24 and 25 and above) on the Situational
subscale. The non-traditional students (25 and above) had significantly higher
mean scores than did the younger students. Significant differences were also
found for employment status. When compared to students who were
unemployed, the students who were employed had significantly higher mean
scores on the Situational subscale. The same was true for the students who were
employed full-time. Results of the independent samples t-test for enrollment
status indicated a significant difference on the Dispositional subscale mean score
only. Those students who were part-time had a significantly higher subscale
mean score than those students who were enrolled full-time.
The statistical procedure to determine differences between the mean
subscale scores and the variable that was considered continuous (family
obligations) was the Pearson Product Moment correlation. The engagement of
this analysis, determined that there was a significant relationship between the
number of dependents the respondent reported having in their household and the
Situational subscale mean score. Those subjects with a higher number of
dependents have more concern for the Situational subscale items. No significant
findings were found on the other subscales.
The one-way ANOVA procedure was used to determine if significant
relationships existed between the subscale mean scores and categorical
variables with three or more groups. The categorical variables included in this

93
study were marital status, household income, ethnicity, and degree program. No
significant differences were found relative to marital status and household
income in the Institutional or Dispositional categories. Statistically significant
differences were found between marital status and household income and the
Situational subscale mean scores. Single/Head of household respondents were
found to score significantly higher than the single students. Respondents in the
income level “Under $10,000” scored significantly higher than the $40,000 to
$59,000, the $100,000 and over, and the “Don’t know” income groups. There
was also a significant difference in the mean scores of the $100,000 and over
group and the second and third lowest income groups ($10,000-$19,999 and
$20,000-$29,999). The highest income level respondents indicated significantly
lower levels of concern for the items in the Situational category, which included
items that dealt with money.
With regard to ethnicity, the ANOVA procedure revealed significant
differences in the mean subscale scores of the Situational and Institutional
categories. African American students scored significantly higher on both
subscales than did the respondents who indicated Caucasian as their ethnic
group. A final ANOVA found significant differences in the subscale mean scores
on two of the subscales—Situational and Dispositional. When considering items
of the Situational nature, Associate degree students indicated significantly higher
mean scores than those students in the Bachelor degree program. As for the
differences in the Dispositional subscale, the students who had indicated the
“have not decided” choice scored significantly higher than both the Associate and
Bachelor degree groups.

94
The Multiple Regression Analysis procedure was employed to determine if
a model existed which explained a significant portion of the variance in the mean
subscale scores of the Barriers to Educational Participation Freshmen Student
Survey from the selected demographic variables collected and measured in this
study. Three separate regressions were calculated to correspond with the three
distinct subscales of the instrument. Ethnicity, marital status, and degree
program were transformed into new variables that were dichotomous in nature to
perform these analyses.
The regression models developed through these analyses were
considered significant but explained a minimal amount of the variance. The first
regression model analyzed the Situational subscale and all of the demographic
variables. A total of 9% of the variance in mean subscale scores was explained
by the variables household income, family obligations, and whether or not the
student was single/head of household marital status. The second regression
model involved regressing all of the independent variables against the
Institutional subscale mean scores. Whether or not the respondent was
Caucasian was the only variable to enter the model and explained only 2% of the
variance in mean subscale scores. The third and final regression model analyzed
the Dispositional subscale and all of the demographic characteristics. Whether
or not the student indicated the “Have not decided” degree program choice and
age entered the model and explained 4% of the variance in mean subscale
scores. Several conclusions were drawn based on the findings of the study and
the related literature.

95
Discussion and Conclusions
Based on the first-time enrolling college freshmen’s subscale mean scores
on the Barriers to Participation in Educational Programs survey, the students
possess a minor level of concern for the possible barriers that may make
participation in education difficult. This finding indicates that, overall, the college
freshmen in this study do not perceive the items listed as possible barriers to be
of average, major or overwhelming concern.
There were significant relationships in perceptions of barriers with regard
to age, gender, family obligations, employment status, marital status, household
income, enrollment status, ethnicity and degree program. There were no
significant findings in perceptions of barriers for gender.
Students were most concerned with issues relating to cost, as evidenced
by the mean score of 3.47 on the item “Cost for such things as books, learning
materials, child care, transportation, or tuition”. Of least concern to the
respondents, who were mostly under the age of 25, was the item “Afraid that I’m
too old to begin”.
Mean subscale scores suggested that situational, institutional, and
dispositional barriers were of minor concern to freshmen. The Situational
subscale mean score, which consisted of items such as cost, lack of time, lack of
transportation, childcare and geographic isolation, was 2.03, a minor level of
concern. For example, transportation to school was of very little concern to the
students, which indicated that most of them can get to and from this rural
commuter campus. Although the overall Institutional subscale mean score
indicated only a minor level of concern for the items that the university is deemed

96
responsible for, over 30% of the respondents did indicate average, major, or
overwhelming concern for these items. On the Dispositional subscale, the items
as a whole were again, generally of only minor concern. “Being afraid to fail” was,
however an item that the respondents scored as an average concern.
Statistically significant differences were observed when comparing the
subscale scores and the demographic variables. Students between the ages of
16 and 24 indicated a significantly lower level of concern for the barriers
classified as Situational. The items that dealt with job and family responsibilities,
cost of schooling and child care issues, and course availability were the items
that were ranked of more concern for the non-traditional students (25 and
above).
In the Situational and Institutional subscales, African American students
indicated significantly higher levels of concern. These students reported more
concern for barriers they felt the institutions had erected. Lack of information
about policies and procedures, and generally not understanding the requirements
for enrolling concerned this group. Financial aid availability and transportation, as
well as, time issues were also of concern to this group of students.
Significant findings were indicated most often on the Situational subscale.
All the demographic characteristics, except gender and enrollment status, had
significant results. The older students, the full-time employed group, the single
head of household students, the under $10,000 household income group, the
African American students, the students in the Associate Degree program of
study, and the students with family obligations, all indicated higher levels of
concerns on the Situational subscale.

97
Much of the literature has focused on age differences in perceptions of
barriers. The review of literature showed that several studies (Byrd, 1990; Cross,
1981; & Green, 1998) found significant relationships between age and the
perceived difficulty of participation in educational programs of higher education.
Students in the older age group (25 and above) of this study also had higher
levels of concern for items involving costs and time. Lack of money and lack of
time were some of the highest scoring items. Financial concerns, jobs, and family
responsibilities were listed as factors that affect adult learners’ participation in
education and the respondents in this study tended to agree with those findings
(Kerka, 1995; Porter, 1990).
Results of the study also confirmed prior research that suggested ethnicity
might be a determining factor in the level of concern students place on barriers to
participation (Willie & McCord, 1972). African American students felt more
strongly about issues they perceived to be “erected by the institution” (Cross,
1981). A lack of information about policies and procedures and generally not
understanding the requirements for enrolling at the university concerned this
group. Many of these students may be first generation college students and may
not have role models or family support. Students who have support from home
are more likely to succeed (Belcheir, 1998). Financial aid availability and
transportation, as well as, time issues were also of concern to this group of
students. These issues, coupled with being a member of an ethnic minority, other
than Asian, have been shown to be attributes that influence students to drop out
of college (Bonham & Luckie, 1993; Lewallen, 1993). Institutions concerned

98
about retention and attrition need to address the areas of concern listed by the
African American students of this study.
Students enrolled part-time (less than 12 hours) felt a higher level of
concern for items of the psychosocial nature. Many times these were the
students who were undecided about their major. Many may not want to go to
school full time because of job responsibilities, or because of family
responsibilities. In many studies, being classified as “part-time” has resulted in
students leaving the college campus without a degree (Brawer, 1996). Many
times these students are enrolled in the two-year Associate degree or simply
have not decided on a program of study. These findings also were congruent
with earlier findings by Green (1998) that showed that the Associate degree
students and those who were still undecided about a degree program had higher
levels of concern for the barriers that were more intrinsic in nature, such as lack
of self-confidence, fear of failure, uncertainty of the future, and lack of energy.
Previous studies affirm that the costs of attending school are a major
barrier (Claus, 1986; Gallay & Hunter, 1979; Hengstler, Haas & Iovacchini, 1984;
Scanlan & Darkenwald, 1984) and the students in this study were no different.
Students in the lower income brackets were more concerned than the higher
income students about many of the barriers listed in the study, as evidenced by
the higher mean scores in both the Situational and Institutional subscales. These
students were not only concerned about the costs involved in school, both in
money and time, but also, about the financial aid applications and attendance
requirements of higher education. Failure to seek out or use the information that

99
is available in institutions of higher education is a common problem of many
students, particularly the least educated and poorest (Cross, 1981).
Results from the regression models confirmed the findings of previous
studies, that financial concerns, which would include household income,
employment status, marital status, and family obligations, are determining factors
in how barriers are perceived by students. Money is an issue in all of these
variables. Students who are from lower income socioeconomic levels or who are
a single heads of household with dependents will often have to work to support
themselves and their families. Each of these student characteristics was found to
be of importance when looking at the variance in student scores. Also, age and
ethnicity were validated in the model as characteristics of freshmen students who
are more likely to have higher levels of concern for barriers to educational
participation and who without university intervention, are often reported as “drop-
out” statistics (Porter, 1990).
Older students, and those who have not decided on a degree program,
showed the most concern on the items on the Dispositional subscale, which
included such issues as fear and insecurity, lack of self-confidence, and low self-
esteem. These feelings may be the result of prior poor academic performance
(Cross, 1981).
The majority of first-time enrolling freshmen at Northwestern State
University had only a minor level of concern for the barriers to participation in
educational programs items listed in this particular study. It is refreshing to see
that university freshmen, in general, perceive only minor barriers to their
participation in higher education program. Results from this study should

100
strengthen university faculty and administrators’ confidence that freshmen are
entering the university without the handicap of a great deal of concern for the
possible barriers that might be deterrents to participation in higher education.
However, these results do indicate a need for university officials to investigate
the needs of the groups of students who do feel higher levels of concern for
these barriers. Intervention and retention strategies are needed so that these
students will remain viable members of the college campus until their graduation.
Recommendations
Considering the findings and conclusions of this study, the following
recommendations were made.
1. It is recommended that Institutions concerned about retention and attrition
address the areas of concern listed by the African American students of
this study. Significant findings for African American students included all
the items listed on the Institutional subscale. These items included the
items that are “erected by the institution” such as confusing financial aid
forms, too much red tape, attendance requirements, not enough
information about who to contact, policies and procedures of the
university, and course availability. Small focus groups of incoming
freshmen could help pinpoint specific areas of concern and identify
specific ways to improve communication with this group of students. Also,
academic advisors should be encouraged to initiate more one-to-one
advising and counseling sessions with these first-time enrolling freshmen.
2. It is recommended that the offices of Student Support Services and
Career Placement and Counseling make a proactive effort to identify and

101
provide appropriate services for non-traditional age freshmen (25 and
above) and students who are have not declared a degree program. These
two groups of students showed the most concern for the Dispositional
items, which included such issues as fear and insecurity, lack of self-
confidence, and low self-esteem.
3. It is recommended that future researchers consider an exploratory factor
analysis of the items on the instrument. Although the factor loadings were
considered adequate for the three-factor structure of the instrument,
several items seemed to overlap and could have been moved to another
subscale. Additionally, the first item on the instrument “Cost for such
things as books, learning materials, child care, transportation, or tuition”
could possibly be spilt into several different statements. This could provide
more detailed information about the respondents. Also, the item on the
demographic portion of the survey that asked for income level should be
revised for a more equitable distribution of the income levels, or possibly
be omitted, since a large portion of the entering freshmen did not know the
household income.
4. It is recommended that future studies include students who are not
enrolled in an institution of higher education. The population of this study
was already enrolled in higher education, and as a group, indicated only
minor levels of concern for the barriers listed in the study. These
respondents may have overcome the perceived barriers addressed in this
study.

102
5. It is recommended that this study be replicated at Northwestern State
University in three years to see if the perceptions of the respondents of
this study change over time and to see if these students persist until
graduation. From the review of literature and the findings of this study,
many of the identified significant relationships involved students who are
often listed as at-risk (nontraditional aged, economically disadvantaged,
part-time students, and students of ethnic backgrounds other than
Caucasian) for dropping out of higher education before graduation.
6. It is recommended that the depth of the study be increased to follow-up
significant relationships found in this study. Future studies should include
discussion of the barriers to participation in educational programs in focus
groups of first-time freshmen, especially with regard to ethnicity and age,
and socioeconomic status.
7. It is recommended that future research expand this study to include
universities in other parts of the country to determine if similar results
occur.
8. It is recommended that marketing, recruitment, and retention efforts of the
university be designed to target specific groups of freshmen at
Northwestern State University, including the non-traditional aged students
and the single/head of household students.
9. It is recommended that the university offer a more flexible course
scheduling, with more evening, weekend, and Internet class options. The
Institutional subscale mean score was ranked the highest of the three

103
subscales and over 30% of the respondents indicated average, major, or
overwhelming concern for the items on the Institutional subscale.
Limitations
Inferences from this study are limited to the specific population in one
geographic region of the state of Louisiana. A study of barriers to participation in
educational programs among first-time enrolling freshmen in higher education in
other regions of the country would be needed to generalize to all university
freshmen in this country. Data gathering was limited to those freshmen at
Northwestern State University, an open-admissions state university, enrolled in a
freshmen orientation class during one semester. All of the information used in
this study was self-reported by the students. The responses may be general and
not accurate. Therefore, the validity of the answers depends on the truthfulness
of the students.
The study was limited in its use of the instrument used to collect data. The
30 items that were originally taken from a portion of the “Learning Interests and
Experiences of Adults Inventory” published by Carp, Peterson, & Roelfs (1972)
and later modified by Cross (1981) and Green (1998), was developed and
normed on non-traditional college students. The items on the instrument may
need to be revised to better assess the barriers to educational participation as
perceived by both the traditional and the non-traditional college freshmen.

104
REFERENCES
Anastasi, A., Meade, M. J. & Schneider, A. A. (1960). The validation of a biographical inventory as a predictor of college success. College Entrance Examination Board: New York. Belcheir, M. J. (1998). Who Stays? Who leaves? Results from a qualitative freshman study. Research Report 98-05. Boise State University: Office of Institutional Assessment. Belcheir, M. J. (1997). An evaluation of the early impacts of the cluster program and first year experience seminar on new freshmen. Research report 97-02. Boise State University: Office of Institutional Assessment. Bonham, L. A., & Luckie, J. I. (1993). Taking a break in schooling: Why Community College students stop out. Community College of Research and Practice. 17 (3), 257-70. Borg, W. R., & Gall, M. D. (1983). Educational research. (4th ed.). New York: Longman. Boylan, H. (1983). Is developmental education working: An analysis of research. A research report prepared for the National Association for Remedial-Developmental Studies in Post Secondary Education. Brawer, F. B. (1996). Retention-Attrition in the Nineties. ERIC Digest. Los Angeles, CA: ERIC Clearinghouse for Community Colleges. (ERIC Document Reproduction Service No. ED 393 510).
Brazziel, W. F. (1989). Older students. Shaping higher education’s future: Demographic realities and opportunities 1900-2000 (A. Levine, Ed.) San Francisco: Jossey-Bass. Brookfield, S. (1986). Understanding and facilitating adult learning. San Francisco: Jossey Bass.
Brooks, L.C. (1991). Demographics and academic factors associated with first-to-second-term retention in a two-year college (Report No. JC 505 563). Community Junior College Quarterly of Research and Practice; v15 n1 57-59. (ERIC Document Reproduction Service No. EJ 421 793)
Bureau of Census Report (1990). Statistical abstract of the United States
(1996) .Washington, DC: US Department of Commerce.

105
Byrd, S. R. (1990). Perceptions and barriers to undergraduate education by nontraditional students at selected non-public, liberal arts institutions in the mid-south. Paper presented at the Annual Conference of the Mid-South Educational Research Association. New Orleans: LA.
Carp, A., Petersen, R., & Roelfs, P. (1973). Learning interests and experiences of adult Americans. Berkley: Educational Testing Service. (ERIC Document Reproduction Service No. ED 097 421).
Charner, L. (1980). Patterns of adult participation in learning activities.
Washington, DC: National Institute for Work and Learning. Charner, L. & Fraser, B. (1986). Different strokes for different folks:
Access and barriers to adult education and training. Washington, DC: National Institute for Work and Learning.
Claus, J. F. (1986). Adult students in community college: Learning to
manage the learning process. Paper presented at the 10th Annual Meeting of the American Educational Research Association. Ithaca: Cornell University. (ERIC Document Reproduction Service No. ED 269 113)
Cross, K. P. (1979). Adult learners: Characteristics, needs and interests.
Lifelong learning in America: An overview of current practices. Available resources and failure prospects (R. E. Petersen, & Association, Eds.). San Francisco: Jossey-Bass.
Cross, K. P. (1981). Adults as learners: Increasing participation and
facilitating learning. San Francisco: Jossey-Bass. Cross, K. P., & McCartan, A. (1984). Adult learning: State policies and institutional practices. Washington, DC: Association of the Study of Higher Education. (ASHE-ERIC Higher Education Research Report No. 1)
Cross, K. P. (1986). Adults as learners. San Francisco: Jossey-Bass. Darkenwald, G. G. & Merriam, S. B. (1982). Adult education: Foundations of practice. New York: Harper Row. Dawson-Threat, J. (1993). Career maturity of college seniors as a function of gender, sex-role identifications, and choice of major. Dissertation. Ames, Iowa: Iowa State University. Dwinell, P. & Higbee, J. (1989). The relationship of affective variables to student performance: Research findings. Paper presented at the annual conference of the National Association of Developmental Education, Cincinnati, Ohio.
106
Feldman, M. J. (1993). Factors associated with one-year retention in a community college. Research in Higher Education, 34 (4), 503-12. Frerichs, A. & Eldersveld, P. (1981). Predicting successful and unsuccessful developmental mathematics students in community colleges. Paper presented at the annual meeting of the American Educational Research Association, Los Angeles, CA. Gallay, R., & Hunter, R. V. (1979). Why adults are pursuing a part-time college education. Collegiate News and Views, 32(2), 13-16. Gay, L. R. (1996). Educational research: Competencies for analysis and application (5th ed.). Englewood Cliffs: Prentice Hall, Inc. Gerdes, H., & Mallinckrodt, B. (1994). Emotional, social, and academic adjustment of college students: A longitudinal study of retention. Journal of Counseling & Development, 72. 281-288. Gose, Ben (1996). The Chronicle of Higher Education, 43, A44. Gosman, E. J., Dandridge, B. A., Nettles, M. T., & Theony, A. R. (1983). Predicting student progression: The influences of race and other student and institutional characteristics on college student performance. Research in Higher Education, 18, 209-237. Green, C. L. (1998). An investigation of the perceived barriers to undergraduate education for nontraditional students at Montana State University-Northern. Dissertation Abstracts International, 59 04A. (University Microfilms No. AAI9830106) Hair, J. F., Jr. Anderson, R. E., Tatham, R. L., & Black, W. C. (1998). Mutlivariate data analysis (5th ed.) Upper Saddle River, NJ: Prentice Hall. Heaney, M. J. (1996). Learning and study strategies, cognitive indicators, and demographic factors as related to academic achievement and retention among college freshmen. Dissertation Abstracts International, 57 04A. (University Microfilms No. AAI962d8898) Hengstler, D. D., Haas, W. H., & Iovacchini, E. V. (1984). Andragogy in public universities: Understanding adult education needs in the 1980s. Ashville, NC: University of North Carolina. (ERIC Document Reproduction Service No. ED 246 777) Hinkle, D., Wiersma, W., & Jurs, S. (1988). Applied statistics for the behavioral sciences. (2nd ed.). Boston: Houghton Mifflin Co.

107
Hu, M. (1985). Determining the needs and attitudes of nontraditional students. College and University, 60, 201-209. Johnstone, J. W., Rivera, R. J. (1965). Volunteers for learning. Chicago: Aldine. Kalsner, L. (1991). Issues in college student retention. Higher Educational Extension Service Review, 3 (2), 43-56. Kerka, S. (1995). Adult Learner Retention Revisited. ERIC Digest No. 166. Columbus, OH: ERIC Clearinghouse on Adult Career and Vocational Education (ERIC Document Reproduction Service No. ED 389 880) Kerlinger, F. (1963). Foundations of behavioral research. (2nd ed.). New York: Holt, Rinehart & Winston, Inc. Kraemer, B. (1996). Meeting the needs of nontraditional students: Retention and transfer studies. Paper presented at the Annual Meeting of the North Central Association, Chicago, IL. (ERIC Document Reproduction Service No. ED 395 603).
Lewallen, W. C. (1993). Early Alert: A report on two pilot projects at Antelope Valley College. Lancaster, CA: Antelope Valley College. (ERIC Document Reproduction Service No. ED 369 452).
Lewis-Beck, M. S. (1980). Applied regression: An introduction. Beverly
Hills and London: Sage Publications. MacKinnon-Slaney, F. (1994). The adult persistence in learning model.
Journal of Counseling and Development, 72(3), 268-275. Miller, R. (1991, Winter). Persistence in higher education: A review of the
literature for continuing educators. Journal of Continuing Higher Education, 39(1), 19-22.
Mishler, C., Fredrick, D. Hogan, T. & Moody, S. (1982). Adult student’s
pace toward graduation. College and University, 58(1), 31-41. Mohammadi, J. (1996). Exploring retention and attrition in a two-year
public community college. Martinsville, VA: Patrick Henry Community College. (ERIC Document Reproduction Service No. ED 382 257).
Moore, N. (1995). Persistence and attrition at San Juan College. Office of
Institutional Research, Grant Development, and Planning. Farmington, NM: San Juan College. (ERIC Document Reproduction Service No. ED 380 159).

108
National Center for Education Statistics. (1995). Projections of education statistics to 2000. Washington, DC: United States Government Printing Office. Northwestern State University General Catalog 2000-2001. Natchitoches: University Press. Pappas, J. P., Loring, R. K. (1985). Returning learners. Increasing student retention (L. Noel, R. Levitz, & D. Saluri, Eds.). San Francisco: Jossey-Bass. Pascarella, E. T., & Terenzini, P. T. (1991). How college affects students. San Francisco: Jossey-Bass. Price, L. A. (1993). Characteristics of early student dropouts at Allegany Community College and Recommendations for early intervention. Cumberland, MD: Allegany Community College. (ERIC Document Reproduction Service No. ED 361 051). Porter, O. (1990). Undergraduate Completion and Persistence at Four-Year Colleges and Universities: Detailed Findings. Washington, DC: National Institute of Independent Colleges and Universities. Richards, Jr., J. M., Holland, J. L. & Lutz, S. W. (1967). Prediction of student accomplishment in college. Journal of Educational Psychology, 58(6), 343-355. Scanlan, C. & Darkenwald, G. (1984). Identifying deterrents to participation in continuing education. Adult Education Quarterly, 34(3), 155-166. Seaman, D. F., & Fellenz, R. A. (1989). Effective strategies for teaching adults. Columbus, OH: Macmillan. Snyder, P. L. (1996). Comparative levels of expressed academic motivation among Anglo and African American university student athletes. Journal of Black Studies, 26(6), 651-667. Snyder, T. D. (1987). Digest of Educational Statistics. Washington, DC: United States Government Printing Office. SPSS® 10.0 for Windows© (2000). SPSS, Inc.; Chicago, IL. Tinto, V. (1987a). Leaving college: Rethinking the causes and cures of student attrition. Chicago: University of Chicago Press. Tinto, V. (1987b). The principles of effective retention. Paper presented at the Fall Conference of the Maryland College Personnel Association, Largo, Maryland.

109
Thiel, K. (1984). The gap between needs and services for adult students in higher education. (ERIC Document Reproduction Service No. ED 251 619). Van Dalen, D. (1979). Understanding educational research. New York: McGraw-Hill. Valentine, T. & Darkenwald, G. (1990). Deterrents to participation in adult education: Profiles of potential learners. Adult Education Quarterly, 41, 29-41. Whigham, M. A. (1985). Variables related to the academic success of women engineering students. Dissertation. Iowa State University: Ames, Iowa. Willie, C., & McCord, A. (1972). Black students at white colleges. New York: Praeger Publishers. Willingham, W. W. (1985). Success in college: The role of personal qualities and academic ability. New York: College Entrance Examination Board. Windham, P. (1994). The relative importance of selected factors to attrition at public community colleges. Paper presented at the 23rd Annual Conference of the Southeastern Association for Community Colleges, Savannah, GA. (ERIC Document Reproduction Service No. ED 373 833).

110
APPENDIX A
LETTER TO FIRST-TIME FRESHMEN STUDENTS
September 5, 2000 To: First-time freshmen students: Entering college for the first time is a very exciting time in your life. However, there are many barriers that may have influenced your educational participation. Gaining a better understanding of the things that can influence a student’s success is important to colleges/universities so that they can better serve the needs of the entering freshman. You have been chosen to participate in this study because you recently enrolled at Northwestern State University. Your participation will involve completing and returning the enclosed questionnaire. The information provided by you is crucial to the success of the study. We ask that you respond to each question completely and honestly, and that you return the survey to your instructor. Your participation in this survey is voluntary and return of a completed questionnaire will indicate your consent to participate. This survey will not be a part of your records at Northwestern and services currently provided to you by the university will not be affected by your participation or failure to participate. The results of this study will be used by Northwestern State University to improve its services for freshmen students. If you would like to receive a copy of the results, please write “copy of the results requested” on the bottom of the personal information page and print your name and address below it. Please do not write this information on the questionnaire itself. Thank you for your assistance! Sincerely, Julie McDonald Study Director

111
APPENDIX B BARRIERS TO PARTICIPATION IN EDUCATION FRESHMEN STUDENT SURVEY
The following are some problems reported by other students that might make participation in education difficult. Please indicate the degree of concern that these are for you. Note. All your responses are Confidential. Circle the appropriate level of concern as it applies to you. 1=NOT A CONCERN 2=A MINOR CONCERN 3=AVERAGE CONCERN 4= A MAJOR CONCERN 5=OVERWHELMING CONCERN
Not a Concern
Minor Concern
Avg. Concern
Major Concern
Overwhelming Concern
1. Cost for such things as books, learning materials, child care, transportation, or tuition
1
2
3
4
5
2. Not enough time 1 2 3 4 5
3. Amount of time required to complete the program
1
2
3
4
5
4. No way to get credit for a degree 1 2 3 4 5
5. Strict attendance requirements 1 2 3 4 5
6. Not sure what courses I’d like to take 1 2 3 4 5
7. No place to study or practice 1 2 3 4 5
8. No child care 1 2 3 4 5
9. Courses I want aren’t scheduled when I can attend
1
2 3 4 5
10. Don’t want to go to school full-time 1 2 3 4 5
11. Not enough information about what courses are available
1 2 3 4 5
12
Not enough information about who to contact
1 2 3 4 5
13. No transportation 1 2 3 4 5

112
Not a Concern
Minor Concern
Avg. Conce
rn
Major Concern
Overwhelming Concern
14. Too much red tape in getting enrolled 1
2
3
4
5
15. Hesitant to seem to ambitious 1 2 3 4 5
16. My family doesn’t like the idea 1 2 3 4 5
17. No encouragement from by friends 1 2 3 4 5
18. Home responsibilities 1 2 3 4 5
19. Job responsibilities 1 2 3 4 5
20. Not enough energy and stamina 1 2 3 4 5
21. Afraid that I’m too old to begin 1 2 3 4 5
22. Low grades in the past 1 2 3 4 5
23. Lack of self confidence 1 2 3 4 5
24. Don’t meet requirements to begin program
1
2
3
4
5
25. Courses I want don’t seem to be available 1
2
3
4
5
26. Don’t enjoy studying 1 2 3 4 5
27. Tired of going to school 1 2 3 4 5
28. Don’t know how to use computers 1 2 3 4 5
29. Financial aid applications are confusing 1
2
3
4
5
30. Afraid I’ll fail 1 2 3 4 5

113
Barriers to Participation in Education Freshmen Student Survey For use in interpreting your responses, answers to the following questions are necessary. 1. Gender 2. Age ______ 3. Ethnicity ____Female _____African American ____Male _____Caucasian _____American Indian _____Hispanic
____Asian ___Other 4. Marital Status 5. Number of Dependents
_____ _____Single Head of Household Please list ages of dependents:
_____Married _____ _____ _____ _____Widowed _____Divorced or separated ________ _________ _____Single
1. Approximately what was the combined income of your parents or you and your spouse (if
married) last year (before taxes)?
______under $10,000 _____$40,000 to $59,000 ______$10,000 to $19,999 ______$60,000 to $74,999 ______$20,000 to $29,999 ______$75,000 to $99,999 ______$30,000 to $39,999 ______$100,000 and over ______Don’t Know
6. How many hours per week do you work at a paid job?
______not currently employed ______1-31 hours ______over 32 hours
7. Please check the status of your current enrollment at Northwestern State University. ______full time (enrolled 12 credit hours or more) ______part-time (enrolled less than 12 credit hours)
8. Please check the type of program in which you are currently enrolled.
______a certificate program ______an associate degree program ______a bachelor degree program ______non-degree seeking student (not enrolled in any program of study just taking classes) ______haven’t decided on a program of study
APPENDIX C DEMOGRAPHIC INFORMATION

114
APPENDIX D APPROVAL LETTER
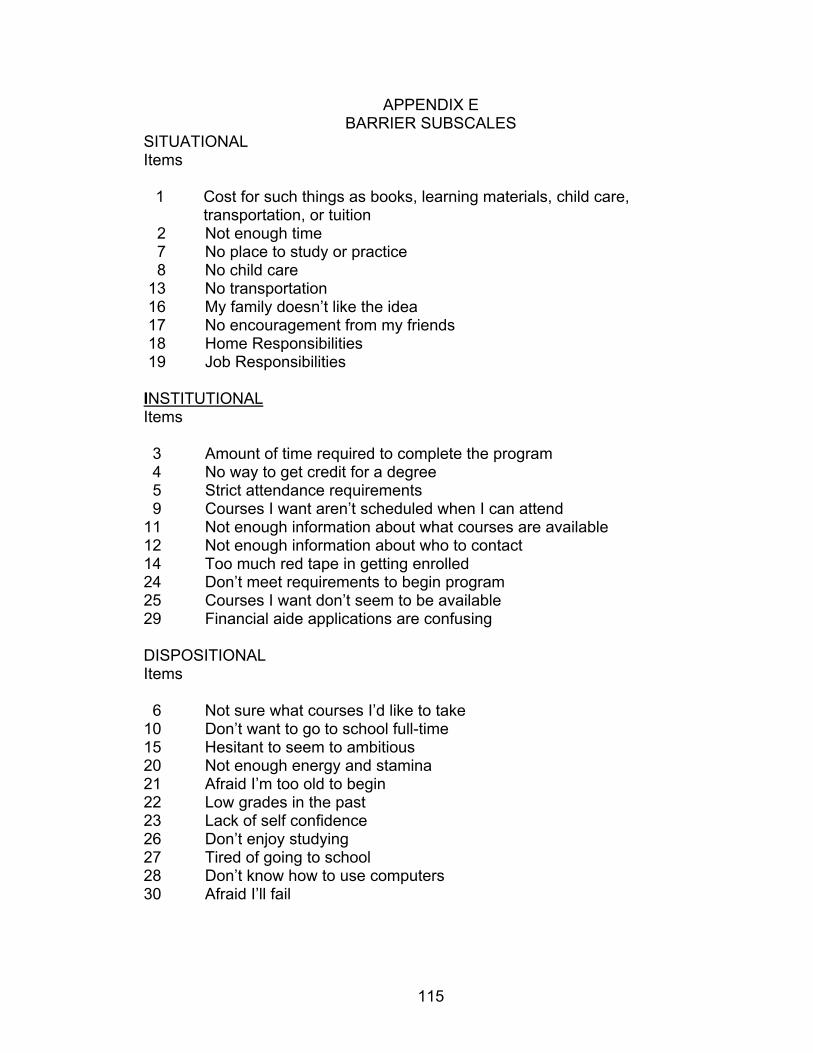
115
APPENDIX E BARRIER SUBSCALES
SITUATIONAL Items
1 Cost for such things as books, learning materials, child care, transportation, or tuition
2 Not enough time 7 No place to study or practice 8 No child care 13 No transportation 16 My family doesn’t like the idea 17 No encouragement from my friends 18 Home Responsibilities 19 Job Responsibilities INSTITUTIONAL Items 3 Amount of time required to complete the program 4 No way to get credit for a degree 5 Strict attendance requirements 9 Courses I want aren’t scheduled when I can attend 11 Not enough information about what courses are available 12 Not enough information about who to contact 14 Too much red tape in getting enrolled 24 Don’t meet requirements to begin program 25 Courses I want don’t seem to be available 29 Financial aide applications are confusing DISPOSITIONAL Items 6 Not sure what courses I’d like to take 10 Don’t want to go to school full-time 15 Hesitant to seem to ambitious 20 Not enough energy and stamina 21 Afraid I’m too old to begin 22 Low grades in the past 23 Lack of self confidence 26 Don’t enjoy studying 27 Tired of going to school 28 Don’t know how to use computers 30 Afraid I’ll fail

116
APPENDIX F FACTOR LOADINGS FOR SUBSCALES Item
# Situational Subscale Items Factor
Loading % of
Variance18 Home Responsibilities .70 33.4717 No encouragement from my friends .69 16 My family doesn’t like the idea .67 7 No place to study or practice .64
19 Job Responsibilities .57 8 No child care ..52 1 Cost for such things as books, learning
materials, child care, transportation, or tuition .47
2 Not enough time .46 13 No transportation .41
Item
# Institutional Subscale Items Factor
Loading % of
Variance11 Not enough information about what courses
are available .73 35.32
12 Not enough information about who to contact
.68
25 Courses I want don’t seem to be available .63 4 No way to get credit for a degree .62 9 Courses I want aren’t scheduled when I can
attend .60
14 Too much red tape in getting enrolled .57 24 Don’t meet requirements to begin program .56 3 Amount of time required to complete the
program .52
29 Financial aid applications are confusing .50 5 Strict attendance requirements .48
Item # Institutional Subscale Items Factor Loading % of Variance
23 Lack of Self Confidence .69 34.6030 Afraid I’ll Fail .67 15 Hesitant to seem to ambitious .64 26 Don’t enjoy studying .63 20 Not enough energy and stamina .62 22 Low grades in the past .60 27 Tired of going to school .58 6 Not sure what courses I’d like to take .54
10 Don’t want to go to school full-time .52 28 21
Don’t know how to use computers Afraid that I’m too old to begin
.51
.44

117
Not a Concern
Minor Concern
Avg. Concern
Major Concern
Overwhelming Concern
1. Cost for such things as books, learning materials, child care, transportation, or tuition (3.47)
77 110 324 347 212
2. Not enough time (2.84) 158 239 367 212 86
3. Amount of time required to complete the program (2.52)
215 278 412 126 36
4. No way to get credit for a degree (2.25) 405 225 243 123 61
5. Strict attendance requirements (2.38) 336 260 270 137 36
6. Not sure what courses I’d like to take (2.31)
371 223 288 143 44
7. No place to study or practice (1.86) 559 246 160 62 41
8. No child care (1.34) 907 59 38 30 35
9. Courses I want aren’t scheduled when I can attend (2.29)
395 223 257 132 62
10. Don’t want to go to school full-time (1.43)
800 130 94 22 18
11. Not enough information about what courses are available (2.10)
453 247 224 99 46
12. Not enough information about who to contact (2.48)
330 218 281 162 78
13. No transportation (1.77) 738 81 94 69 87
APPENDIX G ITEM MEANS AND FREQUENCY OF RESPONSES

118
Not a Concern
Minor Concern
Avg. Concern
Major Concern
Overwhelming Concern
14. Too much red tape in getting enrolled (2.24)
402 249 252 96 70
15. Hesitant to seem to ambitious (1.89) 496 270 227 42 22
16. My family doesn’t like the idea (1.31) 874 91 78 16 10
17. No encouragement from my friends (1.38)
838 116 69 28 16
18. Home responsibilities (2.08) 503 197 219 90 62
19. Job responsibilities (2.23) 491 141 219 141 78
20. Not enough energy and stamina (2.14) 455 231 221 104 59
21. Afraid that I’m too old to begin (1.28) 925 52 52 21 19
22. Low grades in the past (1.82) 613 180 173 64 41
23. Lack of self confidence (1.76) 622 201 161 52 34
24. Don’t meet requirements to begin program (1.52)
762 141 108 34 23
25. Courses I want don’t seem to be available (1.93)
563 199 178 76 53
26. Don’t enjoy studying (2.40) 337 251 281 116 83
27. Tired of going to school (2.06) 486 254 176 84 68
28. Don’t know how to use computers (1.75)
653 174 138 59 44
29. Financial aid applications are confusing (2.41)
418 195 187 141 130
30. Afraid I’ll fail (2.52) 377 205 211 116 162

119
VITA
Julie Cason McDonald was born in Natchitoches, Louisiana. She is the
daughter of Emmitt Cason and Ramona Cason, who is a retired
teacher/administrator in the Louisiana school system. She graduated from
Fairview Alpha High school in 1976, received a Bachelor of Science degree in
business and distributive education from Northwestern State University in 1979,
and a master’s degree in business education in 1985. She completed a plus 30
certification in 1986, also from Northwestern State University.
She began her first teaching assignment in Campti, Louisiana, a small
town in northern Natchitoches parish in the fall of 1979. She taught business
education classes there for ten years and was also the sponsor on the Future
Business Leaders of America organization for those ten years. In 1989, she
joined the faculty of Northwestern State University as an instructor. Since that
time she has been promoted to assistant professor of business and office
administration, has co-advised the Phi Beta Lambda student organization, and
has become active in many professional and civic organizations.
She is married to Kenneth J. McDonald, a control room operator for
International Paper Company. They reside in Red River Parish. They have four
children, Kylie, Hollie, Raylie, and Adam and one grandchild, David Rogers
Shaw.