barotropic instability in the tropical cyclone outer...
TRANSCRIPT

QUARTERLY JOURNAL OF THE ROYAL METEOROLOGICAL SOCIETYQ. J. R. Meteorol. Soc. 135: 851–864 (2009)Published online 9 April 2009 in Wiley InterScience(www.interscience.wiley.com) DOI: 10.1002/qj.408
Barotropic instability in the tropical cyclone outer region
Jiayi Peng,a* Tim Li,a,b Melinda S. Pengc† and Xuyang Gea
aInternational Pacific Research Center, University of Hawaii at Manoa, Honolulu, Hawaii, USAbDepartment of Meteorology, University of Hawaii at Manoa, Honolulu, Hawaii, USA
cNaval Research Laboratory, Monterey, California, USA
ABSTRACT: The growth of asymmetric perturbations and their interactions with the symmetric flow are investigated forwind profiles in a tropical cyclone with instability in its outer region. Three tangential wind profiles are examined: TC1,a strong barotropic instability profile in the outer region; TC2, a stable wind profile; and TC3, a weaker instability profilecomparing to TC1 with a larger distance between the inner negative and the outer positive vorticity gradient centres.
An eigenvalue analysis indicates that azimuthal wave-number two is the most unstable mode in both TC1 and TC3, withan e-folding time-scale of about 1 and 9 days, respectively. Numerical simulations using a linear barotropic model, with aninitial asymmetry specified in the outer region, confirm the eigenvalue analysis. A mechanism is provided to explain thedifference between simulations in TC1 and TC2. In both the stable and unstable case, an inner asymmetry is induced bythe initial outer asymmetry acting on the symmetric vorticity gradient. Subsequently, the newly generated inner asymmetryfeeds back positively to the outer asymmetry with the unstable profile. Because of this positive feedback, the inner andthe outer asymmetries maintain an up-shear phase tilting, leading to a continuous energy transfer from the symmetric flowto the asymmetric perturbation. In the stable TC2, the inner asymmetry could not amplify the outer initial asymmetry asthere is no basic-state radial vorticity gradient there. Also due to this feedback process, disturbances grow faster wherethe (absolute) basic-state vorticity gradients are large. Therefore, the position of an initial disturbance plays a minor rolein determining the outcome of the system.
Simulations with a nonlinear barotropic model and a primitive equation model further confirm the significant weakeningof the maximum tangential wind due to the positive feedback process in TC1. Simulations for TC3 show a smaller changeof the symmetric tangential wind, as expected. Copyright c© 2009 Royal Meteorological Society
KEY WORDS tropical cyclone intensity; asymmetric perturbations; barotropic instability
Received 14 August 2008; Revised 15 February 2009; Accepted 23 February 2009
1. Introduction
The stability analysis of discrete modes in symmetric vor-tices is a topic of broad interest. Barotropic instabilitywas suggested by Staley and Gall (1979) as a possiblemechanism for destructive suction spots imbedded withintornados. Gent and McWilliams (1986) examined severaldifferent ocean current profiles for instability using thequasi-geostrophic potential vorticity equation and foundthat the most unstable mode can be internal or exter-nal, depending on the sharpness of the wind profile.Observational and model studies (e.g. Moller and Smith,1994) show that a tropical cyclone (TC) may have anannular ring of high potential vorticity (PV) with lowPV in the central region. Concentric eyewall patternsare frequently observed in radar reflectivity (Black andWilloughby, 1992). Deep convection within the innereyewall (large vorticity region) is surrounded by a nearly
∗Correspondence to: Jiayi Peng, International Pacific Research Center,University of Hawaii at Manoa, 1680 East West Road, Honolulu, HI96822, USA.E-mail: [email protected]†The contribution of Melinda S. Peng to this article was prepared as partof her official duties as a United States Federal Government Employee.
echo-free moat (low vorticity region), and further sur-rounded by an outer ring of deep convection (relativelyenhanced vorticity region). The reversal of the radial PVgradient near an eyewall might cause barotropic insta-bility (Montgomery and Shapiro, 1995). The stability inan annular vorticity region, representing an eyewall, wasexamined within the framework of a linear and nonlinearbarotropic non-divergent model (Schubert et al., 1999).Polygonal eyewalls are shown to form as a result ofbarotropic instability near the radius of maximum winds(RMW). Kossin et al. (2000) investigated both the insta-bility across the outer ring of enhanced vorticity and theinstability across the moat. The former occurs when theouter ring is sufficiently narrow and the circulation of thecentral vortex is sufficiently weak. The latter occurs whenthe radial extent of the moat is sufficiently narrow so thata positive feedback may occur between the central vortexand the inner edge of the ring.
Most previous studies were focused on the instabil-ity near the TC inner eyewall region (e.g. Nolan andMontgomery, 2000, 2002; Kossin and Schubert, 2001;Nolan et al., 2001; Terwey and Montgomery, 2002; Nolanand Grasso, 2003). However, recent singular vector (SV)diagnostics by Peng and Reynolds (2006) indicate that the
Copyright c© 2009 Royal Meteorological Society

852 J. PENG ET AL.
(a) (b)
(c) (d)
Radius
Radius Radius
Radius
Figure 1. Radial (unit: 1000 km) profiles of the symmetric TC vortex from NOGAPS analysis for hurricane Isabel on 10 September 2003:(a) tangential wind (unit: 50 m s−1), (b) angular velocity (unit: 5 × 10⁻⁵ s−1), (c) vorticity (unit: 5 × 10⁻⁵ s−1), and (d) vorticity gradient (unit:
5 × 10⁻¹¹ m−1 s−1).
TC intensity forecasts are most sensitive to the initial statewhere the PV gradient changes sign in the outer region,located roughly 500 to 700 km away from the TC centre(an example is given in Figure 1). This sign change repre-sents a necessary condition for the barotropic instability(Rayleigh, 1880) in the outer region. The SV analysissuggests a possible new energy source/sink for TC inten-sity changes, that is, the unstable growth of perturbationsassociated with the instability in the outer region. Thisstudy is dedicated to a theoretical investigation of howasymmetric perturbations can grow under this type ofunstable mean profile and modify the mean state. Wewill explore the specific process that causes the energytransfer from the symmetric mean flow to the asymmet-ric perturbation, as well as the interaction between theperturbation and the symmetric mean flow.
The paper is organized as follows. Section 2 containsthe eigenvalue stability analysis for three different TCwind profiles. In section 3, we discuss the dynamic pro-cesses associated with asymmetric perturbation growthbased on the analysis of a linear non-divergent barotropicmodel simulation. Nonlinear non-divergent barotropicmodel simulations are discussed in section 4. Section 5describes the results from a three-dimensional full physicsmodel. Simulations with initial disturbances placed at dif-ferent radial positions are discussed in section 6. Theinvestigation for an unstable profile with a smaller scale
is discussed in section 7. Conclusion and discussion aregiven in section 8.
2. Linear stability analysis
The SV analysis by Peng and Reynolds (2006) indicatesthat the intensity forecast of a TC is most sensitiveto initial conditions at regions where the PV gradientchanges sign. An example is given in Figure 1 from theNavy Operational Global Atmospheric Prediction System(NOGAPS) analysis for hurricane Isabel on 10 September2003. This vortex profile satisfies the necessary conditionfor barotropic instability (Rayleigh, 1880). An analyticexpression is constructed to approximate the observedwind profile with the following mathematic formula,specified by the symmetric vorticity gradient:
∂ζ
∂r= a1 exp[−0.5 × {(r − r1)/0.08}2]
+a2 exp[−0.5 × {(r − r2)/0.08}2], (2.1)
where r is the radial distance. Three different profilesare investigated with different specifications of a1, a2, r1and r2, where r1 and r2 determine the positions of theminimum and maximum and a1 and a2 determine theirmagnitudes. For TC1 (Figure 2, solid line), a1 = −40.0and a2 = 6.0, that give the minimum vorticity gradient at
Copyright c© 2009 Royal Meteorological Society Q. J. R. Meteorol. Soc. 135: 851–864 (2009)DOI: 10.1002/qj

BAROTROPIC INSTABILITY IN THE TC OUTER REGION 853
(a) (b)
(c) (d)
Radius
Radius Radius
Radius
Figure 2. Radial profiles of the idealized vortices for non-dimensional (a) tangential wind, (b) angular velocity, (c) vorticity, and (d) vorticitygradient for TC1 (solid), TC2 (dashed) and TC3 (dash-dotted line).
r1 = 0.3 and the maximum vorticity gradient at r2 = 0.6.There is a sign change of the vorticity gradient near theradius of 0.5. For TC2, a2 = 0.0, so that there is no signchange in the radial vorticity gradient and it correspondsto a stable profile (Figure 2, dashed line). For TC3, allparameters are the same as TC1 except r1 = 0.25. Thisresults in a larger distance between the locations of theminimum and maximum vorticity gradient centres and asmaller vorticity gradient (Figure 2(d), dash-dotted line).TC1 has a maximum non-dimensional tangential wind of0.80 (or a dimensional value of 40 m s−1) located at theradius of 0.3 (300 km); TC2 has a maximum tangentialwind of 1.0 (50 m s−1) situated at the radius of 0.3(300 km); and TC3 has a maximum tangential wind of0.64 (32 m s−1) at the radius of 0.25 (250 km).
The instability of the three symmetric wind profilesis examined with the eigenvalue analysis of a linearnon-divergent barotropic vorticity equation. The timetendency of the perturbation stream function ψ ′(r, λ, t)
in cylindrical coordinates is governed by:
(∂
∂t+ v
∂
r∂λ
)∇2ψ ′ − ∂ψ ′
r∂λ
dζ
dr= 0, (2.2)
where v(r) is the basic-state (symmetric) tangential wind,ζ (r) = d(rv)/rdr is the basic-state relative vorticity,(u′, v′) = (−∂ψ ′/r∂λ, ∂ψ ′/∂r) is the perturbation radialand tangential wind, and ζ ′ = ∇2ψ ′ = ∂(rv′)/r∂r −
∂u′/r∂λ is the perturbation vorticity. Assume that theperturbation stream function has a solution in the formof ψ ′(r, λ, t) = ψ(r)ei(kλ−ωt), where k is the azimuthalwave number and ω the complex frequency, we obtainfrom (2.2) an ordinary differential equation for ψ(r):
{r
d
dr
(r
dψ
dr
)− k2ψ
}ω
= kv
r
{r
d
dr
(r
dψ
dr
)− k2ψ
}− kr
dζ
drψ, (2.3)
where ω = a + bi. For a given wave number k, b >
0 denotes that this wave is unstable and the non-dimensional growth rate is b. To solve (2.3), a centraldifference is applied to approximate the radial derivatives,with vanishing stream function and its gradient as theboundary conditions at the radial end points.
Figure 3(a) shows the growth rate as a function ofthe wave number for the three radial wind profiles, TC1,TC2, and TC3. As expected, the TC2 profile is stable. ForTC1, the wave-number two is unstable with a growth rateb = 0.21283, corresponding to an e-folding time-scale of26 hours. A weaker wave-number two instability is foundin TC3, with a growth rate b = 0.02590 and the e-foldingtime-scale of 215 hours.
In TC1, the most unstable mode has a maximumlocated at r = 0.3 where the (absolute) maximum vor-ticity gradient is located, and a second, much weaker,
Copyright c© 2009 Royal Meteorological Society Q. J. R. Meteorol. Soc. 135: 851–864 (2009)DOI: 10.1002/qj

854 J. PENG ET AL.
Wavenumber
Azimuthal angle
Azimuthal angle
(a)
(b)
(c)
Figure 3. (a) Growth rates as a function of wave number for TC1 (solidline), TC2 (dashed line) and TC3 (dash-dotted line) and the vorticity
patterns of the most unstable mode for (b) TC1 and (c) TC3.
maximum located at r = 0.55 (Figure 3(b)). In TC3, thelocations of the maxima are slightly inward than in TC1.The result suggests that, even if the unstable profile isin the outer region, the asymmetric perturbation devel-ops most rapidly in the inner region near the maximumnegative vorticity gradient centre.
3. Linear barotropic model simulations
Schubert et al. (1999) and Kossin et al. (2000) have theanalytic solution for a given piecewise-constant vorticityprofile for a TC-like vortex with the instability near theTC inner core region. The eigenvalue analysis we carriedout for instability in the TC outer region indicates anunstable growth of the asymmetric perturbation, withits maximum growth near the radius of the maximum
wind. How does a rather weak outer instability leadto the growth of inner asymmetries? This motivatesus to further conduct linear non-divergent barotropicmodel simulations to understand how the asymmetricperturbation gains energy from the symmetric vortex.
The governing equations for a linear non-divergentbarotropic model on an f -plane (f = 5 × 10⁻⁵ s−1) are:
∂u′
∂t+ u
∂u′
∂x+ v
∂u′
∂y+ u′ ∂u
∂x+ v′ ∂u
∂y− v′ = −∂φ′
∂x,
∂v′
∂t+ u
∂v′
∂x+ v
∂v′
∂y+ u′ ∂v
∂x+ v′ ∂v
∂y+ u′ = −∂φ′
∂y,
∂
∂x
(u
∂u′
∂x+ v
∂u′
∂y+ u′ ∂u
∂x+ v′ ∂u
∂y
)
+ ∂
∂y
(u
∂v′
∂x+ v
∂v′
∂y+ u′ ∂v
∂x+ v′ ∂v
∂y
)− ζ ′ = −∇2ϕ′,
(3.1)
where u and v are the zonal and meridional windcomponents, φ the geopotential height, and ζ the relativevorticity. Variables with an overbar represent the basicstate and those with a prime are perturbations.
All model variables have been non-dimensionalizedwith a characteristic time-scale of T = 1/f = 2 × 10⁴ s(a non-dimensional time t = 0.18 corresponds to 1 hour)and characteristic velocity and horizontal length scaleof C = 50 m s−1 and L = CT = 1000 km, respectively.The numerical technique employed includes a fourth-order Runge–Kutta time-integration scheme with a timeincrement of 0.002 (40 s), a Matsuno advection scheme(Shen et al., 2003), and a second-order central differencescheme for space derivatives. The model covers a 4 by4 (4000 km by 4000 km) domain with a grid resolutionof 0.004 (4 km) in both x and y directions. The lateralboundary condition is a radiative boundary. All thesimulations are carried out to time 8.64 (48 hours). Mostof the results shown are up to 4.32 (24 hours) duringwhich wave–mean flow interactions occur.
The three symmetric tangential wind profiles, TC1,TC2 and TC3 as specified in section 2 (Figure 2(a)),are investigated. An initial wave-number two asymmetricperturbation is introduced with the following structure:
ς ′ = A × exp{−0.5 × (10r − 6)2} cos(2λ), (3.2)
where r is the radial distance, λ the azimuthal angle, andA the amplitude of the perturbations. The maximum ofthe perturbation is placed at the radius of 0.6 (600 km) inthe outer region of the TC. A modest initial perturbation,A = 0.5, is specified. This corresponds to a perturbationvorticity that is 7.4% of the basic-state maximum vor-ticity. All model outputs are interpolated to a cylindricalcoordinate system about the vortex centre and they aredecomposed into a symmetric and an asymmetric com-ponent for further diagnosis.
The temporal evolution of both the asymmetric vor-ticity amplitude and asymmetric kinetic energy (KE) forthe three experiments are displayed in Figure 4. Although
Copyright c© 2009 Royal Meteorological Society Q. J. R. Meteorol. Soc. 135: 851–864 (2009)DOI: 10.1002/qj

BAROTROPIC INSTABILITY IN THE TC OUTER REGION 855
Radius Radius
(a) (d)
(b) (e)
(c) (f)
Figure 4. The time–radius cross-section of the wave-number two vorticity amplitude (left panels) and the asymmetric kinetic energy (rightpanels) in the linear barotropic model experiments for TC1 (top), TC2 (middle) and TC3 (bottom).
the initial perturbation is located at r = 0.6, the max-imum growth of the asymmetric perturbation in TC1 issituated at the inner region (near r = 0.3), where the neg-ative vorticity gradient is the largest (see Figure 2(d),solid line). The non-dimensional growth rate in the innerregion is 0.3, which corresponds to an e-folding time-scale of 18 hours. The location of maximum growth andthe growth rate agree well with the eigenvalue analysisin the previous section. The evolution of the asymmetryin TC3 is very similar to the one in TC1, except with asmaller growth. While the asymmetric perturbations con-tinue to grow in the unstable profiles TC1 and TC3, theinner asymmetry in the stable TC2 grows initially andthen decays and the outer asymmetry has little change(Peng et al., 2008).
The cause for the growth of new asymmetry insidethe initially specified asymmetry is due to the interac-tion between the initial perturbation radial wind and thebasic vorticity gradient, while its subsequent decay under
a stable symmetric wind profile (such as TC2) is due tovortex axisymmetrization as studied previously by Mont-gomery and Kallenbach (1997) and Peng et al. (2008). Ina vortex with differential rotation, an up-shear tilting ofthe perturbation would lead to an energy transfer from thesymmetric vortex to the asymmetric perturbation, whilea down-shear tilting would lead to an opposite energytransfer. Figure 5 illustrates the evolution of the asym-metric vorticity pattern (shaded area) in TC2, plotted inthe radial and azimuthal coordinates for better viewing ofthe phase tilt. A phase line is defined by connecting theinner and outer asymmetric vorticity centres, and a lineparallel to the radial axis has no phase tilt with respectto the tangential wind shear (note that the angular veloc-ity decreases monotonically with radius (Figure 2(b))).Initially, an outer vorticity perturbation is introduced atr = 0.6. Quickly, an asymmetric perturbation developsin the inner region with its maximum located at r = 0.3where the basic vorticity gradient is largest. At t = 0.54,
Copyright c© 2009 Royal Meteorological Society Q. J. R. Meteorol. Soc. 135: 851–864 (2009)DOI: 10.1002/qj
856 J. PENG ET AL.
Azimuthal angle
(a)
(b)
(c)
(d)
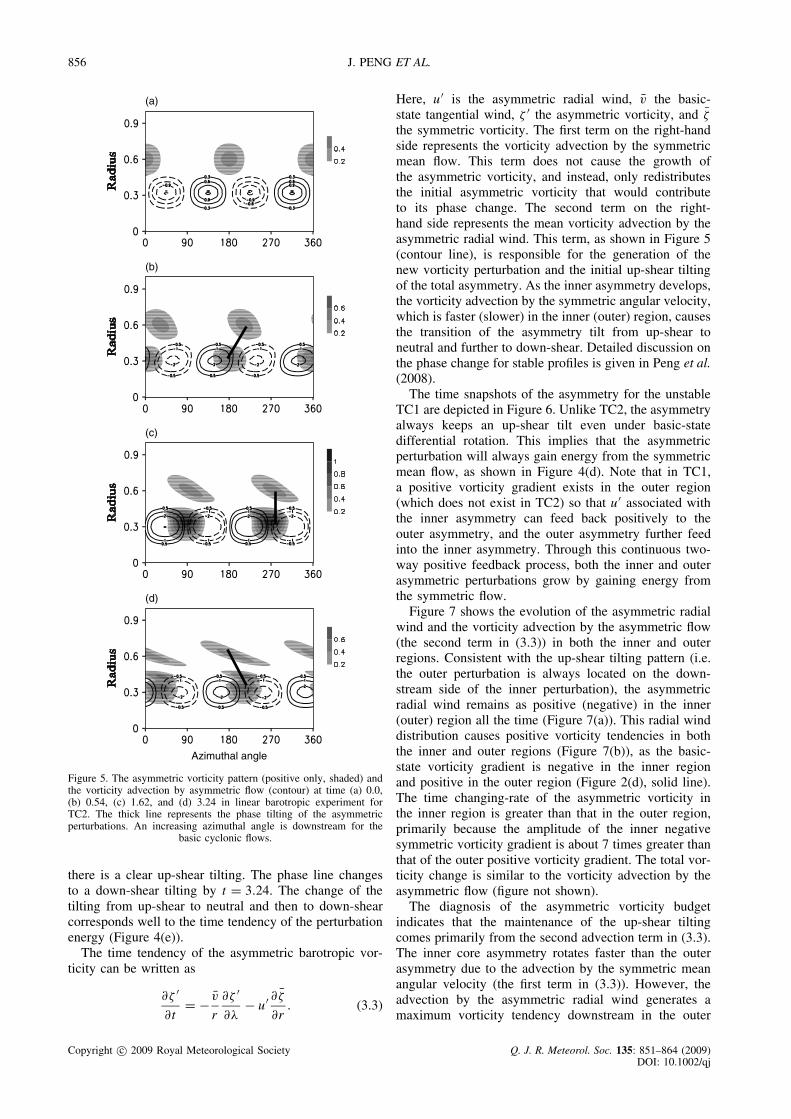
Figure 5. The asymmetric vorticity pattern (positive only, shaded) andthe vorticity advection by asymmetric flow (contour) at time (a) 0.0,(b) 0.54, (c) 1.62, and (d) 3.24 in linear barotropic experiment forTC2. The thick line represents the phase tilting of the asymmetricperturbations. An increasing azimuthal angle is downstream for the
basic cyclonic flows.
there is a clear up-shear tilting. The phase line changesto a down-shear tilting by t = 3.24. The change of thetilting from up-shear to neutral and then to down-shearcorresponds well to the time tendency of the perturbationenergy (Figure 4(e)).
The time tendency of the asymmetric barotropic vor-ticity can be written as
∂ζ ′
∂t= − v
r
∂ζ ′
∂λ− u′ ∂ζ
∂r. (3.3)
Here, u′ is the asymmetric radial wind, v the basic-state tangential wind, ζ ′ the asymmetric vorticity, and ζ
the symmetric vorticity. The first term on the right-handside represents the vorticity advection by the symmetricmean flow. This term does not cause the growth ofthe asymmetric vorticity, and instead, only redistributesthe initial asymmetric vorticity that would contributeto its phase change. The second term on the right-hand side represents the mean vorticity advection by theasymmetric radial wind. This term, as shown in Figure 5(contour line), is responsible for the generation of thenew vorticity perturbation and the initial up-shear tiltingof the total asymmetry. As the inner asymmetry develops,the vorticity advection by the symmetric angular velocity,which is faster (slower) in the inner (outer) region, causesthe transition of the asymmetry tilt from up-shear toneutral and further to down-shear. Detailed discussion onthe phase change for stable profiles is given in Peng et al.(2008).
The time snapshots of the asymmetry for the unstableTC1 are depicted in Figure 6. Unlike TC2, the asymmetryalways keeps an up-shear tilt even under basic-statedifferential rotation. This implies that the asymmetricperturbation will always gain energy from the symmetricmean flow, as shown in Figure 4(d). Note that in TC1,a positive vorticity gradient exists in the outer region(which does not exist in TC2) so that u′ associated withthe inner asymmetry can feed back positively to theouter asymmetry, and the outer asymmetry further feedinto the inner asymmetry. Through this continuous two-way positive feedback process, both the inner and outerasymmetric perturbations grow by gaining energy fromthe symmetric flow.
Figure 7 shows the evolution of the asymmetric radialwind and the vorticity advection by the asymmetric flow(the second term in (3.3)) in both the inner and outerregions. Consistent with the up-shear tilting pattern (i.e.the outer perturbation is always located on the down-stream side of the inner perturbation), the asymmetricradial wind remains as positive (negative) in the inner(outer) region all the time (Figure 7(a)). This radial winddistribution causes positive vorticity tendencies in boththe inner and outer regions (Figure 7(b)), as the basic-state vorticity gradient is negative in the inner regionand positive in the outer region (Figure 2(d), solid line).The time changing-rate of the asymmetric vorticity inthe inner region is greater than that in the outer region,primarily because the amplitude of the inner negativesymmetric vorticity gradient is about 7 times greater thanthat of the outer positive vorticity gradient. The total vor-ticity change is similar to the vorticity advection by theasymmetric flow (figure not shown).
The diagnosis of the asymmetric vorticity budgetindicates that the maintenance of the up-shear tiltingcomes primarily from the second advection term in (3.3).The inner core asymmetry rotates faster than the outerasymmetry due to the advection by the symmetric meanangular velocity (the first term in (3.3)). However, theadvection by the asymmetric radial wind generates amaximum vorticity tendency downstream in the outer
Copyright c© 2009 Royal Meteorological Society Q. J. R. Meteorol. Soc. 135: 851–864 (2009)DOI: 10.1002/qj

BAROTROPIC INSTABILITY IN THE TC OUTER REGION 857
Azimuthal angle
(a)
(b)
(c)
(d)
Figure 6. Same as Figure 5 except for TC1.
region (Figure 8(a)) and a maximum vorticity tendencyupstream in the inner region (Figure 8(b)). This offsetsthe effect of differential rotation by the mean flow (partof axisymmetrization). As a result, the up-shear tiltingof the asymmetry is kept, which can be clearly seenfrom the phase between the inner and outer vorticitycentres (Figure 8(c)), and the asymmetry is able to drawenergy continuously from the basic flow in a linearsense. It is this positive feedback that leads to thebarotropic instability of the symmetric mean flow in TC1.The analytic eigenvalue solution for a piecewise-constantvorticity profile by Schubert et al. (1999) showed how theinner and outer disturbances located near the two jumps of
their vorticity profile would move in opposite directions,as shown in our phase and vorticity diagrams.
The overall pattern and evolution of the asymmetricvorticity and kinetic energy in TC3 are very similar tothose in TC1 except that the growth rates are smaller(Figure 4). The non-dimensional growth rate for thewave-number two perturbation in TC3 is 0.16 (corre-sponding to an e-folding time-scale of 148 hours), whichis consistent with the eigenvalue analysis but signifi-cantly smaller than that in TC1. The weaker instabilityin TC3 is attributed to the larger distance between theinner region of negative vorticity gradient and the outerregion of positive vorticity gradient. This greater distanceleads to a weaker mutual amplification of the inner andouter asymmetries through perturbation winds acting onthe basic-state vorticity gradient.
4. Nonlinear barotropic model simulations
While the linear experiments above illustrate how theinstability occurs, they do not allow the change of per-turbations feeding back to the symmetric vortex. In thissection, we examine how the evolution of asymmetricperturbation impacts the symmetric vortex in a nonlinearbarotropic model. The governing equations for a nonlin-ear non-dimensional non-divergent barotropic model onan f -plane may be written as:
∂u
∂t+ u
∂u
∂x+ v
∂u
∂y− v = −∂φ
∂x,
∂v
∂t+ u
∂v
∂x+ v
∂v
∂y+ u = −∂φ
∂y,
−2J(u, v) − ζ = −∇2ϕ,
(4.1)
where J(u, v) = ∂u
∂x
∂v
∂y− ∂v
∂x
∂u
∂yand ζ = ∂v
∂x− ∂u
∂y.
The same initial condition as in the linear cases is used.The diagnostics for the energy exchange is made with thefollowing symmetric KE equation:
∂K
∂t= −∂(ruK)
r∂r− u
∂(ru′2)r∂r
− v∂(u′v′)
∂r
+uv′2
r− 2v
ru′v′ − u
∂φ
∂r, (4.2)
where the first term on the right-hand side of (4.2) is theflux divergence of K by the symmetric radial flow, thesum of the second, third, fourth and fifth terms representsthe symmetric KE change by wave–wave interactions,and the sixth term is the energy conversion from thesymmetric potential energy into the symmetric kineticenergy. The first and the last terms on the right-handside are not related to the energy transfer between theasymmetry and the symmetry.
Figure 9 shows the evolution of the asymmetric vortic-ity, the symmetric vorticity gradient, the symmetric kin-etic energy and the total energy transfer between the sym-metric and asymmetric flows in TC1. The initial wave-number two perturbation in the outer region (r = 0.6)
Copyright c© 2009 Royal Meteorological Society Q. J. R. Meteorol. Soc. 135: 851–864 (2009)DOI: 10.1002/qj

858 J. PENG ET AL.
Time Time
(a) (b)
Figure 7. Evolution of the non-dimensional (a) asymmetric radial wind at the inner (r = 0.3, solid line) and outer (r = 0.6, dashed line) maximumasymmetric vorticity centres, (b) vorticity advection by the asymmetric flow (−u′∂ζ /∂r) in linear experiment for TC1.
grows until t = 2.16 and weakens slightly afterwards,while the inner asymmetric perturbation induced by theouter asymmetry continues to grow until t = 3.24 andthen remains quasi-steady (Figure 9(a)). Compared to thelinear case, the reduced growth rates in both the inner andouter regions are attributed to the modification of the sym-metric vorticity gradient (Figure 9(b)), as the increaseddistance between the inner negative vorticity gradientcentre and the outer positive vorticity gradient centreleads to a weaker instability. As the inner asymmetrygrows, the symmetric kinetic energy and tangential windnear the radius of maximum wind decrease with time(Figure 9(c)). The symmetric KE change by wave–waveinteractions is given in Figure 9(d). The diagnosis of thesymmetric energy budget shows that the symmetric flowstransfer kinetic energy to the asymmetric perturbationsin the inner core region due to the up-shear tilt of theasymmetry (figure not shown). Such an energy transferbecomes weaker as the symmetric positive vorticity gra-dient centre shifts outwards.
Only the rate of energy transfer is shown for TC2 andTC3 (Figure 10). The symmetric flows transfer energyto the asymmetric perturbations before t = 1.62 (whenthe up-shear tilt is present), and gain energy from theasymmetric perturbation afterwards as the asymmetrychanges its phase to a down-shear tilt (Figure 10(a)).Details of this can be found in Peng et al. (2008). Thetime evolution of the energy exchange in TC3 is verysimilar to the one in TC1, but weaker in magnitude(Figure 10(b)).
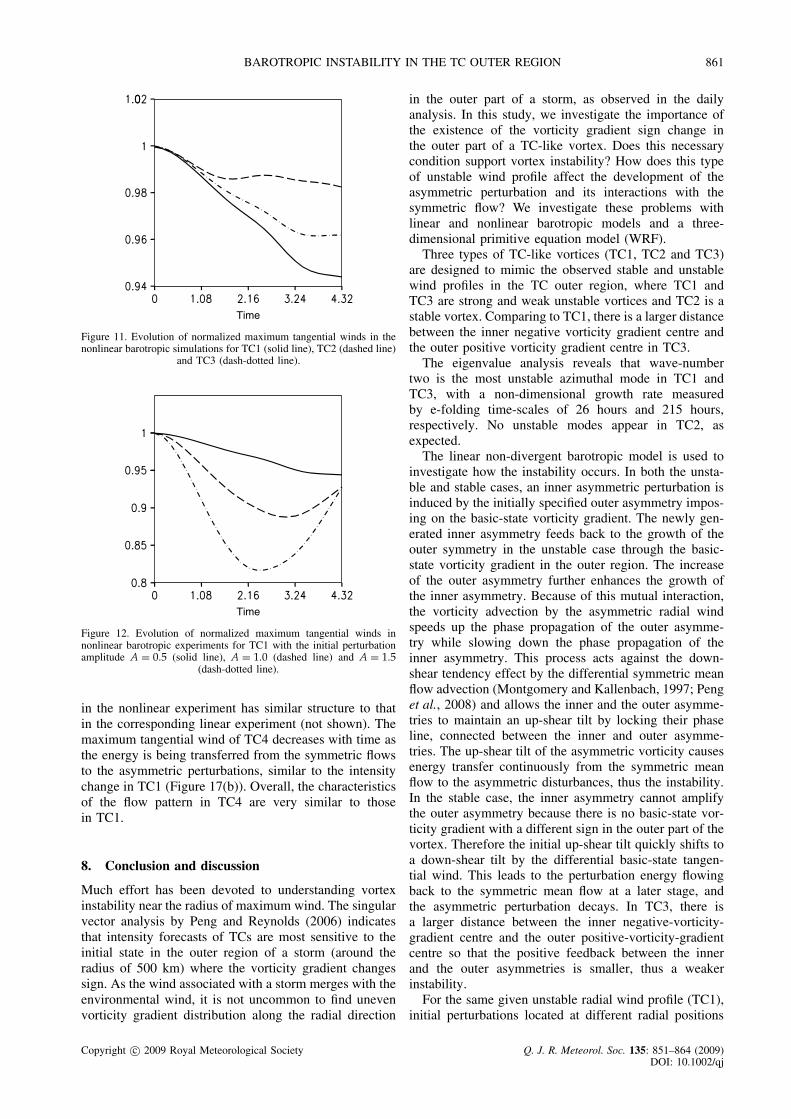
Figure 11 shows quantitatively to what extent thesymmetric vortex intensity is influenced by the imposedinitial asymmetric perturbation for wind profiles TC1,TC2 and TC3 after 24 h. For easier comparison, themaximum tangential wind has been normalized so thatthe weakening rate can be readily estimated. It turns outthat the intensity reduction rate in TC1 is about threetimes as large as that in TC2, whereas the weakeningrate in TC3 is about twice as large as in TC2.
The amplitude of the initial perturbation in the afore-mentioned experiments is modest (A = 0.5, a perturba-tion vorticity that is 7.4% of the basic-state maximum
vorticity). Two additional experiments with A = 1.0 andA = 1.5 are conducted to examine the sensitivity toamplitude of the initial perturbations. Figure 12 depictsthe evolution of the maximum tangential wind in the con-trol and the two new sensitivity experiments. While themaximum tangential wind decreases by 6% in the con-trol experiment by 24 hours, a twice (three-times) largerinitial asymmetric perturbation causes the decrease of thesymmetric wind amplitude by 11% (18%) within 18 (12)hours. Therefore, the stronger the initial asymmetric per-turbation is, the weaker the unstable symmetric vortexTC1 becomes. It is interesting to note that the TC1 vortexhas its maximum wind increased after time 2.2 with thelarge initial asymmetry (Figure 12, dash-dotted line). Inthat case, the vortex is intensified by the much inducedasymmetry near the RMW. However, the overall max-imum tangential wind decreases with time due to theunstable growth of the asymmetry in the early stage.
5. Three-dimensional model simulations
We further examine three-dimensional simulations usingthe dry dynamics of the Weather Research and Forecastmodel (WRF), version 2.2. A horizontal grid spacing of5 km is applied for a domain of 2000 km by 2000 km. Themodel extends to 10 hPa with 28 vertical sigma levels.The initial thermal profile is a mean tropical sounding, thesame as the one used in Li et al. (2006). Diabatic physicsprocesses in the model (such as convective and radiation)are turned off. The model is integrated for 48 hours at atime step of 15 s. The Coriolis parameter is set to bea constant f = 5 × 10⁻⁵ s−1 at 20◦N, the same as inthe previous barotropic simulations. The upper and lowerboundaries are free slip, and the lateral boundaries arefixed at their initial values.
The three-dimensional (3D) model was initialized withthe balanced unstable vortex TC1 or stable vortex TC2at the surface, decreasing to zero at the top modellevel (Li et al., 2006). A wave-number two perturbation,with its maximum located at the radius of 600 km, isspecified initially as in the barotropic simulations. The
Copyright c© 2009 Royal Meteorological Society Q. J. R. Meteorol. Soc. 135: 851–864 (2009)DOI: 10.1002/qj

BAROTROPIC INSTABILITY IN THE TC OUTER REGION 859
Azimuthal angle
(a)
(b)
(c)
Figure 8. The time–azimuth cross-section of the wave-number twovorticity (positive only, shaded) and the vorticity tendency associatedwith the asymmetric radial wind advection (contour) at (a) r = 0.6 and(b) r = 0.3. The bottom panel (c) shows the phase relationship betweenthe inner (r = 0.3, shaded) and outer (r = 0.6, contour) maximum
asymmetric vorticity perturbations in linear experiment for TC1.
maximum wind of the asymmetric perturbation is 10%of the symmetric mean flow.
Figure 13 shows the evolution of the wave-number twoperturbation at hours 0, 3, 9 and 18 in TC1. Similar tothe 2D simulations, an inner-core asymmetry is generatedby the initial perturbations in the outer region and thereis phase lock between the inner asymmetry and the outerasymmetry. The interaction between the inner and theouter asymmetric perturbation causes the perturbations tocontinue gaining energy from the symmetric mean flow.The inner asymmetry grows much faster than the outerone, in agreement with the barotropic experiments.
For the stable vortex TC2, an inner-core asymmetry isalso triggered by the initial outer asymmetry. It grows
during the first 9 hours and then weakens afterwards (fig-ure not shown). No unstable development of asymmetricperturbations is observed in this experiment, as expected.The time evolution of the normalized maximum symmet-ric tangential wind in the two experiments is shown inFigure 14. A larger change of the mean vortex occurs inthe unstable wind profile TC1 that agrees with the non-linear barotropic model result shown in Figure 11, butthe overall changes of the symmetric winds are smallerin the 3D simulations.
6. Disturbances at different initial positions
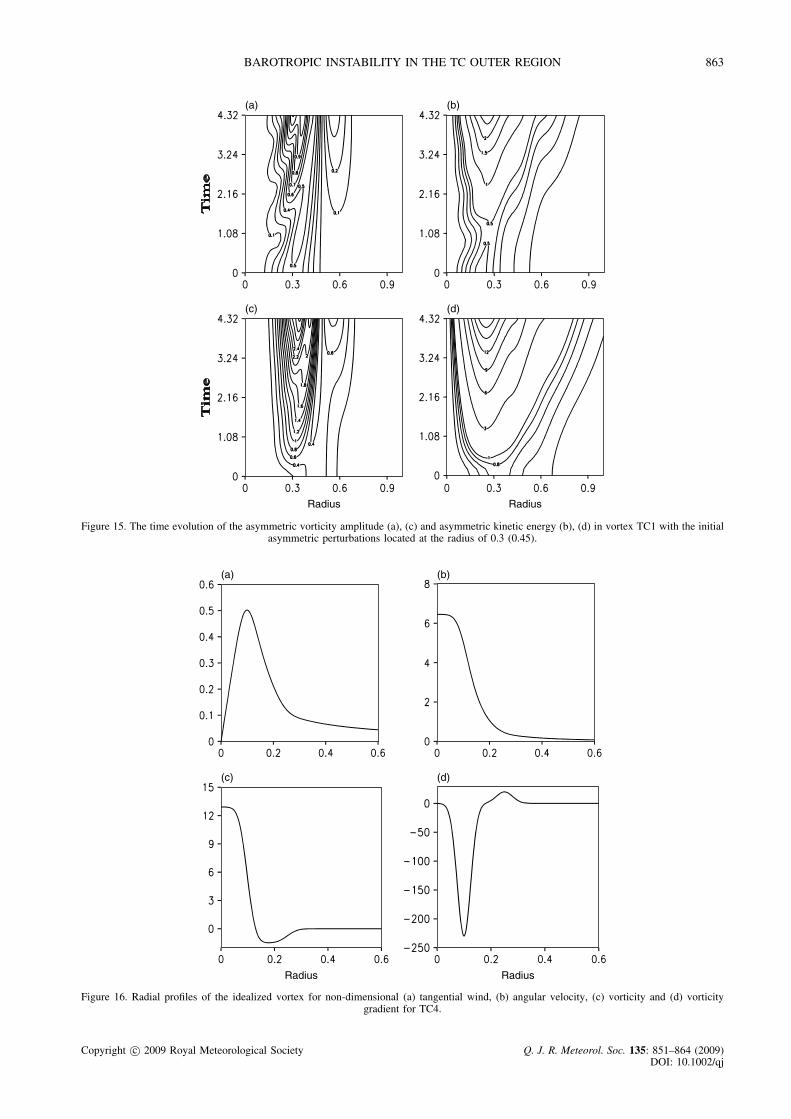
Peng et al. (2008) shows that the impact of an asym-metric disturbance on a stable vortex through axisym-metrization depends critically on where the asymmetryis located initially. So far, we have investigated theinstability with the initial perturbations specified in theouter region near where the basic-state vorticity gradientchanges sign. What happens if the initial perturbations areplaced at other locations? Two additional linear experi-ments for the basic vortex TC1 are carried out to answerthis question. Experiment TC1L03 has the initial wave-number two perturbations located at the radius of 0.3where the maximum vorticity gradient resides. In exper-iment TC1L45, the initial asymmetry is placed at radius0.45, between the radii of maximum vorticity gradient.The evolution of the asymmetric vorticity amplitude andasymmetric kinetic energy for these two experiments areshown in Figure 15. The initial asymmetric perturbationin experiment TC1L03 propagates slightly outward, whileadditional asymmetry is induced inside the initial asym-metry (Peng et al., 2008). In addition, new asymmetrygrows in the outer region where local vorticity gradi-ent has its second maximum. As the outer asymmetrygrows, asymmetry near the inner radius of maximum vor-ticity gradient also grows through the feedback processas discussed for TC1. In TC1L45, even though the initialdisturbance is placed between the inner and outer local(absolute) vorticity gradient maxima, the growth of theasymmetry is still concentrated at the two locations withlarge local vorticity gradient and the phase lock keeps thetotal asymmetry growing at the expense of the asymmet-ric part.
Putting all three experiments, TC1, TC1L03 andTC1L45 (Figures 4(d), 15(b) and 15(d)), into perspec-tive, it becomes clear that all three have very similarbehaviour, irrespective of the different positions of theirinitial asymmetry. As expected, asymmetries grow largestwhere the local basic-state vorticity gradient is largest(in an absolute sense). Because of the change of signfrom one local vorticity gradient maximum to another,the asymmetries have a phase lock and grow under theinstability.
7. Vortex with a smaller radius
The basic profiles we have examined so far are designedbased on the NOGAPS model analysis, which has a
Copyright c© 2009 Royal Meteorological Society Q. J. R. Meteorol. Soc. 135: 851–864 (2009)DOI: 10.1002/qj

860 J. PENG ET AL.
Radius Radius
(a) (b)
(c) (d)
Figure 9. The time–radius cross-section of (a) the asymmetric vorticity amplitude, (b) the symmetric vorticity gradient, (c) the symmetric kineticenergy and (d) the rate of energy transfer from the asymmetric to symmetric flows in the nonlinear barotropic simulation for TC1.
Radius Radius
(a) (b)
Figure 10. The time–radius cross-section of the rate of energy transfer from the asymmetric to symmetric flows in the nonlinear barotropicsimulations for (a) TC2 and (b) TC3.
coarse resolution, and the TC profile typically has alarge radius of maximum wind (200–300 km). To ensurethe generality of our results, another unstable tropicalcyclone profile is investigated. TC4 has its maximumtangential wind 0.5 (dimensional value, 25 m s−1) locatedat the radius of 0.1 (100 km). The negative vorticity-gradient centre is situated at the radius of 0.1 while thepositive vorticity-gradient centre is located at 0.25 (seeFigure 16).
The initial perturbations are also given by (3.2) withthe amplitude A = 0.5 and their maximum centre locatedat r = 0.25. Both linear and nonlinear experiments are
carried out, in comparison with the results from theunstable TC1. The initial perturbations located at r =0.25 grow slowly till time 2.16, and decay afterwards inthe linear simulation (Figure 17(a)). Meanwhile, the innerasymmetric perturbations are generated and intensifyquickly to their maximum around time 1.0 and thenweaken. While the asymmetries grow along the radiusof local vorticity gradient extremes as seen in TC1(Figure 9), the inner asymmetry grows much faster thanthe outer asymmetry in TC4 as the basic-state vorticitygradient near the radius of the maximum wind in TC4is greater than that in TC1. The asymmetric component
Copyright c© 2009 Royal Meteorological Society Q. J. R. Meteorol. Soc. 135: 851–864 (2009)DOI: 10.1002/qj
BAROTROPIC INSTABILITY IN THE TC OUTER REGION 861
Time
Figure 11. Evolution of normalized maximum tangential winds in thenonlinear barotropic simulations for TC1 (solid line), TC2 (dashed line)
and TC3 (dash-dotted line).
Time
Figure 12. Evolution of normalized maximum tangential winds innonlinear barotropic experiments for TC1 with the initial perturbationamplitude A = 0.5 (solid line), A = 1.0 (dashed line) and A = 1.5
(dash-dotted line).
in the nonlinear experiment has similar structure to thatin the corresponding linear experiment (not shown). Themaximum tangential wind of TC4 decreases with time asthe energy is being transferred from the symmetric flowsto the asymmetric perturbations, similar to the intensitychange in TC1 (Figure 17(b)). Overall, the characteristicsof the flow pattern in TC4 are very similar to thosein TC1.
8. Conclusion and discussion
Much effort has been devoted to understanding vortexinstability near the radius of maximum wind. The singularvector analysis by Peng and Reynolds (2006) indicatesthat intensity forecasts of TCs are most sensitive to theinitial state in the outer region of a storm (around theradius of 500 km) where the vorticity gradient changessign. As the wind associated with a storm merges with theenvironmental wind, it is not uncommon to find unevenvorticity gradient distribution along the radial direction
in the outer part of a storm, as observed in the dailyanalysis. In this study, we investigate the importance ofthe existence of the vorticity gradient sign change inthe outer part of a TC-like vortex. Does this necessarycondition support vortex instability? How does this typeof unstable wind profile affect the development of theasymmetric perturbation and its interactions with thesymmetric flow? We investigate these problems withlinear and nonlinear barotropic models and a three-dimensional primitive equation model (WRF).
Three types of TC-like vortices (TC1, TC2 and TC3)are designed to mimic the observed stable and unstablewind profiles in the TC outer region, where TC1 andTC3 are strong and weak unstable vortices and TC2 is astable vortex. Comparing to TC1, there is a larger distancebetween the inner negative vorticity gradient centre andthe outer positive vorticity gradient centre in TC3.
The eigenvalue analysis reveals that wave-numbertwo is the most unstable azimuthal mode in TC1 andTC3, with a non-dimensional growth rate measuredby e-folding time-scales of 26 hours and 215 hours,respectively. No unstable modes appear in TC2, asexpected.
The linear non-divergent barotropic model is used toinvestigate how the instability occurs. In both the unsta-ble and stable cases, an inner asymmetric perturbation isinduced by the initially specified outer asymmetry impos-ing on the basic-state vorticity gradient. The newly gen-erated inner asymmetry feeds back to the growth of theouter symmetry in the unstable case through the basic-state vorticity gradient in the outer region. The increaseof the outer asymmetry further enhances the growth ofthe inner asymmetry. Because of this mutual interaction,the vorticity advection by the asymmetric radial windspeeds up the phase propagation of the outer asymme-try while slowing down the phase propagation of theinner asymmetry. This process acts against the down-shear tendency effect by the differential symmetric meanflow advection (Montgomery and Kallenbach, 1997; Penget al., 2008) and allows the inner and the outer asymme-tries to maintain an up-shear tilt by locking their phaseline, connected between the inner and outer asymme-tries. The up-shear tilt of the asymmetric vorticity causesenergy transfer continuously from the symmetric meanflow to the asymmetric disturbances, thus the instability.In the stable case, the inner asymmetry cannot amplifythe outer asymmetry because there is no basic-state vor-ticity gradient with a different sign in the outer part of thevortex. Therefore the initial up-shear tilt quickly shifts toa down-shear tilt by the differential basic-state tangen-tial wind. This leads to the perturbation energy flowingback to the symmetric mean flow at a later stage, andthe asymmetric perturbation decays. In TC3, there isa larger distance between the inner negative-vorticity-gradient centre and the outer positive-vorticity-gradientcentre so that the positive feedback between the innerand the outer asymmetries is smaller, thus a weakerinstability.
For the same given unstable radial wind profile (TC1),initial perturbations located at different radial positions
Copyright c© 2009 Royal Meteorological Society Q. J. R. Meteorol. Soc. 135: 851–864 (2009)DOI: 10.1002/qj

862 J. PENG ET AL.
(a) (b)
(c) (d)
Figure 13. The wave-number two vorticity fields at time (a) 0 h, (b) 3 h, (c) 9 h and (d) 18 h in the WRF model experiment for TC1. Thevorticity unit is 10−5 s−1 and the horizontal scale is 100 km.
Figure 14. The temporal change of the normalized maximum tangentialwinds in the WRF model experiments for TC1 (dashed line) and TC2
(solid line).
result in similar growth of the asymmetry and similarevolution of the symmetry. This is due to the fact that,irrespective of the position of the initial disturbance,new asymmetries would always be induced where thereis a basic-state vorticity gradient. When the basic-statevorticity gradient changes sign somewhere, the inner andthe outer asymmetries can evolve in a lock-in phase tiltand maintain the instability. It is the profile of the basic-state vorticity gradient that determines the outcome of
the imposed asymmetry, not its position. This is verydifferent for a stable profile in which the position of theinitial asymmetry plays a critical role in determining theoutcome (Peng et al., 2008).
The impact of an initially specified asymmetric pertur-bation on the symmetric vortex is examined in a nonlinearbarotropic model. The growing of the asymmetric per-turbation weakens the symmetric vorticity gradient andreduces the barotropic instability gradually. The unstablegrowth of the asymmetric perturbation in TC1 can lead toa significant reduction of the symmetric vortex, depend-ing on the magnitude of the initial disturbance. The 3Dsimulations are similar to the results from the nonlinearbarotropic model.
Previous studies such as Montgomery and Kallenbach(1997) suggest that axisymmetrization may be an impor-tant mechanism that will feed energy from asymmetries tosymmetric basic-state and increase the maximum inten-sity or outer part of the wind for a TC-like vortex (Penget al., 2008). The present study suggests that the existenceof instability in the outer part of the wind profile (thoughit may be very weak) can cause a significant weakening ofthe basic-state vortex. Nolan et al. (2007) suggested thatasymmetric heat sources would lead to eventual weaken-ing of the symmetric wind in most situations with a stableprofile. Therefore a TC-like vortex may require continu-ing injection of energy from convection to maintain andenhance its intensity.
Copyright c© 2009 Royal Meteorological Society Q. J. R. Meteorol. Soc. 135: 851–864 (2009)DOI: 10.1002/qj
BAROTROPIC INSTABILITY IN THE TC OUTER REGION 863
Radius Radius
(a) (b)
(c) (d)
Figure 15. The time evolution of the asymmetric vorticity amplitude (a), (c) and asymmetric kinetic energy (b), (d) in vortex TC1 with the initialasymmetric perturbations located at the radius of 0.3 (0.45).
Radius Radius
(a) (b)
(c) (d)
Figure 16. Radial profiles of the idealized vortex for non-dimensional (a) tangential wind, (b) angular velocity, (c) vorticity and (d) vorticitygradient for TC4.
Copyright c© 2009 Royal Meteorological Society Q. J. R. Meteorol. Soc. 135: 851–864 (2009)DOI: 10.1002/qj

864 J. PENG ET AL.
Radius Radius
(a) (b)
Figure 17. The temporal evolution of the (a) asymmetric vorticity amplitude in the linear experiment for TC4 and (b) symmetric kinetic energyin the nonlinear experiment for TC4.
Acknowledgements
This work was supported by ONR grantsN000140710145, N000140810256, N00173061G031,PE 0602435N and NSFC Grants 40628006/40675054.The International Pacific Research Center is sponsoredby the Japan Agency for Marine–Earth Science andTechnology (JAMSTEC), NASA (NNX07AG53G) andNOAA (NA17RJ1230). This is SOEST contributionnumber 7638 and IPRC contribution number 588.
References
Black ML, Willoughby HE. 1992. The concentric eyewall cycle ofhurricane Gilbert. Mon. Weather Rev. 120: 947–957.
Gent PR, McWilliams JC. 1986. The instability of barotropic circularvortices. Geophys. Astrophys. Fluid Dyn. 35: 209–233.
Kossin JP, Schubert WH. 2001. Mesovortices, polygonal flow patterns,and rapid pressure falls in hurricane-like vortices. J. Atmos. Sci. 58:2196–2209.
Kossin JP, Schubert WH, Montgomery MT. 2000. Unstableinteractions between a hurricane’s primary eyewall and a secondaryring of enhanced vorticity. J. Atmos. Sci. 57: 3893–3917.
Li T, Ge X, Wang B, Zhu Y. 2006. Tropical cyclogenesis associatedwith Rossby wave energy dispersion of a preexisting typhoon. PartII: Numerical simulations. J. Atmos. Sci. 63: 1390–1409.
Moller JD, Smith RK. 1994. The development of potential vorticity ina hurricane-like vortex. Q. J. R. Meteorol. Soc. 120: 1255–1265.
Montgomery MT, Kallenbach RJ. 1997. A theory for vortex Rossby-waves and its application to spiral bands and intensity changes inhurricanes. Q. J. R. Meteorol. Soc. 123: 435–465.
Montgomery MT, Shapiro LJ. 1995. Generalized Charney–Stern andFjortoft theorems for rapidly rotating vortices. J. Atmos. Sci. 52:1829–1833.
Nolan DS, Grasso LD. 2003. Nonhydrostatic, three-dimensionalperturbations to balanced, hurricane-like vortices. Part II: Symmetricresponse and nonlinear simulations. J. Atmos. Sci. 60: 2717–2745.
Nolan DS, Montgomery MT. 2000. The algebraic growth ofwavenumber one disturbances in hurricane-like vortices. J. Atmos.Sci. 57: 3514–3538.
Nolan DS, Montgomery MT. 2002. Nonhydrostatic, three-dimensionalperturbations to balanced, hurricane-like vortices. Part I: Linearizedformulation, stability, and evolution. J. Atmos. Sci. 59: 2989–3020.
Nolan DS, Montgomery MT, Grasso LD. 2001. The wavenumber-oneinstability and trochoidal motion of hurricane-like vortices. J. Atmos.Sci. 58: 3243–3270.
Nolan DS, Moon Y, Stern DP. 2007. Tropical cyclone intensificationfrom asymmetric convection: Energetics and efficiency. J. Atmos.Sci. 64: 3377–3405.
Peng MS, Reynolds CA. 2006. Sensitivity of tropical cyclone forecastsas revealed by singular vectors. J. Atmos. Sci. 63: 2508–2528.
Peng J, Peng MS, Li T. 2008. Dependence of vortex axisymmetrizationon the characteristics of the asymmetry. Q. J. R. Meteorol. Soc. 134:1253–1268.
Rayleigh L. 1880. On the stability, or instability, of certain fluidmotions. Proc. London Math. Soc. 9: 57–70.
Schubert WH, Montgomery MT, Taft RK, Guinn TA, Fulton SR,Kossin JP, Edwards JP. 1999. Polygonal eyewalls, asymmetric eyecontraction, and potential vorticity mixing in hurricanes. J. Atmos.Sci. 56: 1197–1223.
Shen TL, Tian YX, Ge XZ, Lu WS, Chen DH. 2003. Numericalweather prediction. Beijing Meteorology Press (in Chinese).
Staley DO, Gall RL. 1979. Barotropic instability in a tornado vortex.J. Atmos. Sci. 36: 973–981.
Terwey WD, Montgomery MT. 2002. Wavenumber-2 andwavenumber-m vortex Rossby wave instabilities in a generalizedthree-region model. J. Atmos. Sci. 59: 2421–2427.
Copyright c© 2009 Royal Meteorological Society Q. J. R. Meteorol. Soc. 135: 851–864 (2009)DOI: 10.1002/qj