barotropic tides in the bab el mandab strait-numerical
TRANSCRIPT

Available online at www.sciencedirect.com
SCIENCE cd) DIRECT* CONTINENTAL SHELF
RESEARCH
ELSEVIER Continental Shelf Research 25 (2005) 1225-1247www.elsevier.com/locate/csr
Barotropic tides in the Bab el Mandab Strait-numericalsimulations
E. Jarosza'*, C.A. Blainb, S.P. Murraya'l, M. Inouea'Coastal Studies Institute, Louisiana State University, Baton Rouge, LA 70803, USA
bNaval Research Laboratory, Stennis Space Center, MS 39529, USA
Received 9 January 2004; received in revised form 8 December 2004; accepted 21 December 2004Available online 10 March 2005
Abstract
A two-dimensional barotropic finite element model with the grid resolution varying between 0.2 and 2 km and forcedby eight principle constituents (Q1, 01, P1, K1, N2 , M2 , S2, and K2) was used to compute tidal elevations and currents inthe Bab el Mandab Strait. Good agreement is achieved with the available observations for both diurnal and semidiurnaltidal currents and diurnal elevations; however, the model performs less satisfactorily for the semidiurnal elevationsmainly due to the errors between the observed and computed phases in the region where there are amphidromic pointsfor the M 2, S2, and N 2 constituents in the Strait. The results indicate that the largest amplitudes of the tidal elevationsand the strongest currents are present in the southern part of the Strait. Residual circulation induced by the barotropictides is rather weak in the major part of the Strait, and its contribution to the Red Sea water transport is small. Themodel results also show that barotropic energy fluxes are not very large and their direction depends on the constituent.All diurnal and one semidiurnal (N2) constituent have one major source of energy, which is the flux from the Gulf ofAden, while there are two sources of energy for the M 2, S 2, and K2 components: one from the Gulf and another fromthe Red Sea. Very small energy fluxes from the Strait to the adjacent basins indicate that almost all tidal energy isdissipated within the Strait. The distribution of the rate of energy dissipation due to bottom friction implies that themajor area of dissipation is located between Perim Narrows and the Assab-Mocha line.Published by Elsevier Ltd.
Keywords: Barotropic tides; Bab el Mandab Strait; Numerical model; Residual circulation; Tidal energy flux
1. Introduction*Corresponding author. Oceanography Division (Code
7332), Naval Research Laboratory, Stennis Space Center, MS The Bab el Mandab Strait is located in the39529-5004, USA. Tel.: + 1 228 6884292; fax: + 1 228 6884759. southern part of the Red Sea and extends from
E-mail address: [email protected] (E. Jarosz).'Current affiliation: Office of Naval Research, 800 N. Quincy Perim Island in the south to the Hanish Islands in
St., Arlington, VA 22217, USA. the northwest (Fig. 1). This Strait is the only
0278-4343/$-see front matter Published by Elsevier Ltd.doi: 10.101 6/j.csr.2004.12.017
20060619020
1226 E Jarosz el al. / Continental Shelf Research 25 (2005) 1225-1247
Zafa ranq.Hn30N - 7E 114 A0N
RaGhan' 0ToS Ahrafl Isa]
26N Ousel 13.5N
24N
22N - Jaddah Peri Narr
Muhamma 12.5N inn 141and
20N- Port Sudan Bab el Mandab Strait 0 t L
S18N - 42.0E 42.5E 43.0E 43.5E 4.
Harmll I otS~l as00
16N - Massawamran.a Khthlb * •
14NAs• ocha •
12N
1 ON110N- Bar .0
8N ' t
SN
31E 33E 35E 37E 39E 41E 43E 45E 47E 49E 51E 53E 55E 57E 59ELongitude
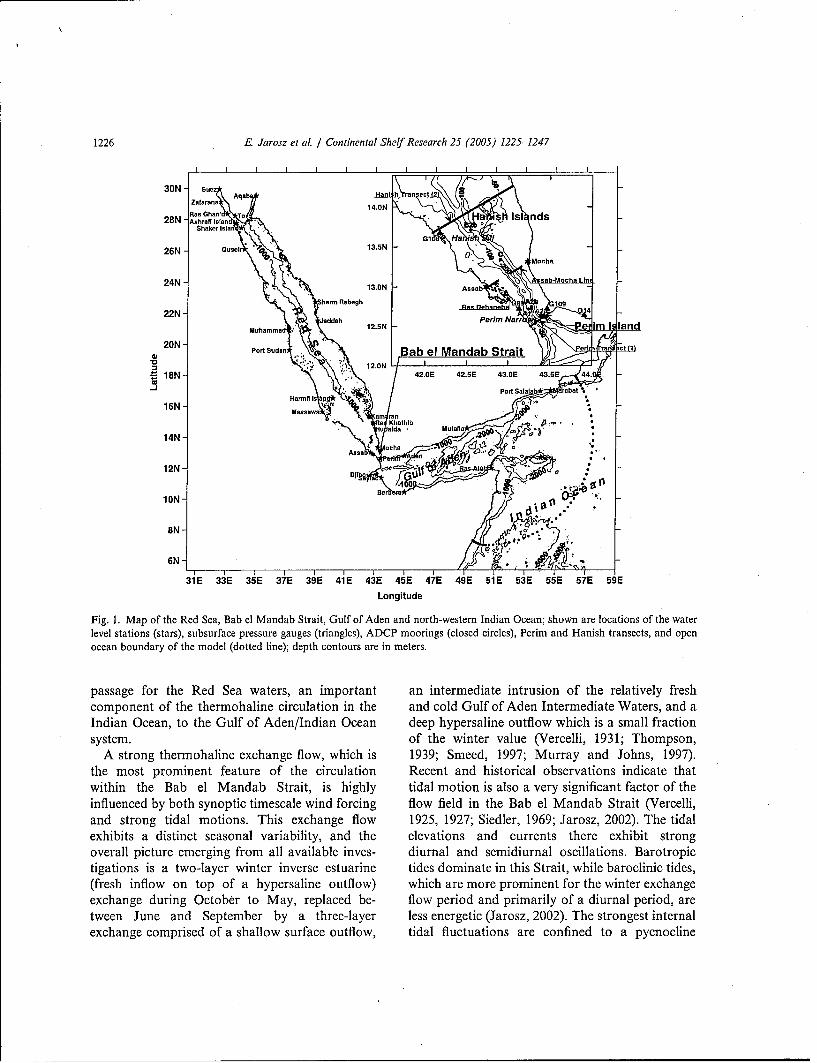
Fig. 1. Map of the Red Sea, Bab el Mandab Strait, Gulf of Aden and north-western Indian Ocean; shown are locations of the waterlevel stations (stars), subsurface pressure gauges (triangles), ADCP moorings (closed circles), Perim and Hanish transects, and openocean boundary of the model (dotted line); depth contours are in meters.
passage for the Red Sea waters, an important an intermediate intrusion of the relatively freshcomponent of the thermohaline circulation in the and cold Gulf of Aden Intermediate Waters, and aIndian Ocean, to the Gulf of Aden/Indian Ocean deep hypersaline outflow which is a small fractionsystem. of the winter value (Vercelli, 1931; Thompson,
A strong thermohaline exchange flow, which is 1939; Smeed, 1997; Murray and Johns, 1997).the most prominent feature of the circulation Recent and historical observations indicate thatwithin the Bab el Mandab Strait, is highly tidal motion is also a very significant factor of theinfluenced by both synoptic timescale wind forcing flow field in the Bab el Mandab Strait (Vercelli,and strong tidal motions. This exchange flow 1925, 1927; Siedler, 1969; Jarosz, 2002). The tidalexhibits a distinct seasonal variability, and the elevations and currents there exhibit strongoverall picture emerging from all available inves- diurnal and semidiurnal oscillations. Barotropictigations is a two-layer winter inverse estuarine tides dominate in this Strait, while baroclinic tides,(fresh inflow on top of a hypersaline outflow) which are more prominent for the winter exchangeexchange during October to May, replaced be- flow period and primarily of a diurnal period, aretween June and September by a three-layer less energetic (Jarosz, 2002). The strongest internalexchange comprised of a shallow surface outflow, tidal fluctuations are confined to a pycnocline

E Jarosz et al. / Continental Shelf Research 25 (2005) 1225-1247 1227
layer, i.e. to depths within the water column where This paper is organized as follows. In Section 2,the greatest density gradients are observed. In the numerical model and finite element mesh isaddition, analyses of historical data led to the briefly described. Model-data comparisons areconclusion that there is an amphidrome for the M2 presented in Section 3. Variability of tidal eleva-tidal wave in the Bab el Mandab Strait (Vercelli, tions and currents are discussed in Section 4.1925; Defant, 1961). Residual circulation is described in Section 5, with
The available observations, however, are spa- energy fluxes and dissipation rate distributiontially scattered and too sparse to examine tidal presented in Section 6. Section 7 summarizes thedynamics in the Bab el Mandab Strait in more findings of the study.detail. It is rather difficult with these data toconclude, for instance, whether there are alsoamphidromic points for other major tidal consti- 2. Model descriptiontuents and where these points are located. Withthis data set, it is also difficult to evaluate tidal The model domain, shown in Fig. 1, includesresidual currents, their variability and possible not only the Bab el Mandab Strait but also thecontribution to the transport of the Red Sea entire Red Sea, Gulf of Aden and northwesternwaters to the Gulf of Aden/Indian Ocean system part of the Indian Ocean. Such a large model areaor to estimate barotropic tidal energy. To better was chosen primarily to reproduce tidal wavesunderstand the tidal dynamics in the Bab el propagating from the Indian Ocean, which is aMandab Strait and address some of the posed major forcing of tidal motion in the Strait and Redquestions, a numerical model with a very high Sea as discussed by Defant (1961). A secondspatial resolution is implemented. Specific objec- motivation was to avoid a necessity of having twotives are to (1) quantify the spatial variability of open boundaries at the northern and southernthe barotropic tidal elevations and currents in the ends of the Strait. The tidal elevation data outsideBab el Mandab Strait, (2) evaluate the barotropic and within the Strait are limited, thus estimationtidal residual circulation and its contribution to of the reliable tidal elevation harmonic constantsthe transport of the Red Sea waters, and (3) at the open boundaries located near the Straitestimate the barotropic energy fluxes and dissipa- would be difficult.tion rates for this Strait. Bathymetry for the model was obtained from
The barotropic tides in the Strait are numeri- two sources: the Naval Oceanographic Officecally simulated with a two-dimensional form Digital Bathymetric Data Base-Variable Resolu-of the finite element hydrodynamic model tion (DBDB-V) (NAVOCEANO, 1997) and chartscalled ADvanced CIRCulation Model for Shelves, published by the Defense Mapping Agency inCoasts and Estuaries (ADCIRC) developed by 1992. The bathymetry from the charts wasLuettich et al. (1992) and Westerink et al. (1994). digitized, and this data set (of resolution -0.11F')Selection of a finite element model is justified is limited to an area slightly larger than the Straitby its grid flexibility, which allows easy incorpora- itself, while the DBDB-V data with a resolution oftion of the complex coastline and high levels of 2' cover the remainder of the model domain.refinement near shallow coastal areas and in The finite element grid used in computations isregions of rapid bathymetric change. It also displayed in Fig. 2. It consists of 37,436 nodes andpermits coarsening of the grid over deeper 70,733 elements. Nodal spacing for this meshwaters to extend the domain boundaries varies throughout the modeled region and rangesaway from the primary region of interest, between 0.2 and 55.5 km with the highest refine-Furthermore, finite element models have a history ment present in the Strait where the minimum andof accuracy in modeling barotropic tides (Walters, maximum nodal spacing are 0.2 and 2km,1987; Werner and Lynch, 1987; Walters and respectively. The coarsest resolution is located inWerner, 1989; Westerink et al., 1989, 1992; Fore- deep waters of the Gulf of Aden and Indianman et al., 1995). Ocean.

1228 E. Jarosz et at. / Continental Shelf Research 25 (2005) 1225-1247
31N *' 1 *! "1'' • t , I ' 1 I t
3IN29N
27N
25N
23N
21N
.• 19N
15N
13N
llN
9N
7N
5N1 3 4 4 7 1 E 5 T .9 .
H1E 33F 35E 37F 39E 41E 43E, 45E 47E 49E SIP S3E 559 Sig 59E 619Longitude
Fig. 2. Model finite element grid.
The two-dimensional form of the ADCIRC model is the total water column depth, h is the bathymetricis based on vertically integrated equations of motion depth relative to the geoid, f = 2Q sin (p is theand continuity, which, in a spherical coordinate Coriolis parameter, Q2 is the angular speed of thesystem, are defined as follows (Gill, 1982): Earth, Po is a reference density, g is the acceleration
due to gravity, a is the Earth elasticity factora U U a u VaU f UV sin(0 approximated as 0.69 for all tidal constituents as
at R cos R s( used by other investigators including Schwiderski_ g a b(la (1980) and Hendershott (1981); however, its value
R cos 4A poH has been shown to be constituent-dependent (Wahr,1981), n is the Newtonian equilibrium tidal potential,
av U aV V av UV sin and TbA, Tbp are the bottom stresses taken as:RCos58A Ra R cosq
_ g a aq) _ b__ (Ib) TbA=PoCdUU •U-•"+ V2 ,R a( poH Tbo = POCd VVU 2 +V 2 , (2)
a( 1 8(UH) 1 a(VH cos d0) 0 where Cd denotes the bottom drag coefficient. Theat R cos 0 a2 ? R cos a " equilibrium tidal potential is expressed as (Reid,
(0c) 1990)
where t represents time, A, Io denote degrees oflongitude and latitude, C is the free surface elevation, q(_' ,, t) Cjfj(to)Lj6k) cos [27r@ -
U, V are the depth-averaged horizontal east-west
and north-south velocities, respectively, H = C + h +j) + j(01o)], (3)

E Jarosz et al / Continental Shelf Research 25 (2005) 1225-1247 1229
where t is time relative to to, which is the reference drying option is not included in these simulations.time, Cjn is a constant characterizing the amplitude The model simulations were carried out for 1 yearof a tidal constituent n of species j, fi is the time- to generate a long time series that allows thedependent nodal factor, vj, is the time-dependent separation of PI and K2 constituents from K1 andastronomical argument, j = 0, 1, 2 are the tidal S2, respectively. The amplitudes and phases of thespecies (j = 0 declinational; j = 1 diurnal, j = 2 tidal constituents were obtained through thesemidiurnal), L0 = 3 sin 2 q' - 1, L1 = sin (29), L2 = standard harmonic analysis (Foreman, 1977,cos2 q, and Tjn is the period of a constituent n for 1978).speciesj. The tidal loading and self-attraction are notincluded in the model equations.
Prior to being discretized, the continuity and 3. Validation of computed tidesmomentum equations are combined into a general-ized wave continuity equation (GWCE), which has Tidal harmonic constants at 29 water levelbeen shown to have superior numerical properties stations and four subsurface pressure gauges asto a primitive continuity equation when a finite well as estimates of the barotropic tidal currentselement method is used in space (Lynch and Gray, obtained from the measurements at five ADCP1979). The final forms of the GWCE and moorings collected during the project entitledmomentum equations, which are solved by the "Observation and Modeling-an Integrated Studymodel, are given in Blain and Rogers (1998); while of the Transport through the Strait of Bab elnumerical discretization of these equations is Mandab" (the BAM project) (Murray and Johns,described in detail by Luettich et al. (1992) and 1997) were used to evaluate computed tidalKolar et al. (1994). elevations and currents. The ADCP observations
No-normal flow and free tangential slip condi- were vertically averaged before they were com-tions are imposed at the land boundary nodes. pared to the modeled currents (see Jarosz (2002)Furthermore, at the open ocean boundary, the for more details regarding pressure gauge andtidal elevation generated by four diurnal (Ka, O, ADCP data processing and analyses). Geographi-P 1, Q1) and four semidiurnal (M 2, S2 , N2, K2) cal locations of the water level stations, for whichconstituents is specified (Dirichlet condition). The only the tidal harmonic constants were obtainedtidal harmonic constants used to generate the from the International Hydrographic Organiza-elevation along the open boundary are linearly tion (1979), and pressure gauges, deployed for theinterpolated onto the boundary nodes using data BAM project, are listed in Table I and displayed infrom the World Ocean Tide Model database Fig. I. All observed tidal amplitudes and phasesFES95.2 (Le Provost et al., 1994). In addition, come from near-coastal areas leaving no possibi-an equilibrium tidal potential forcing within the lity of verifying the model predictions of the tidaldomain is applied for the same eight constituents. elevations in open waters. In addition, at some
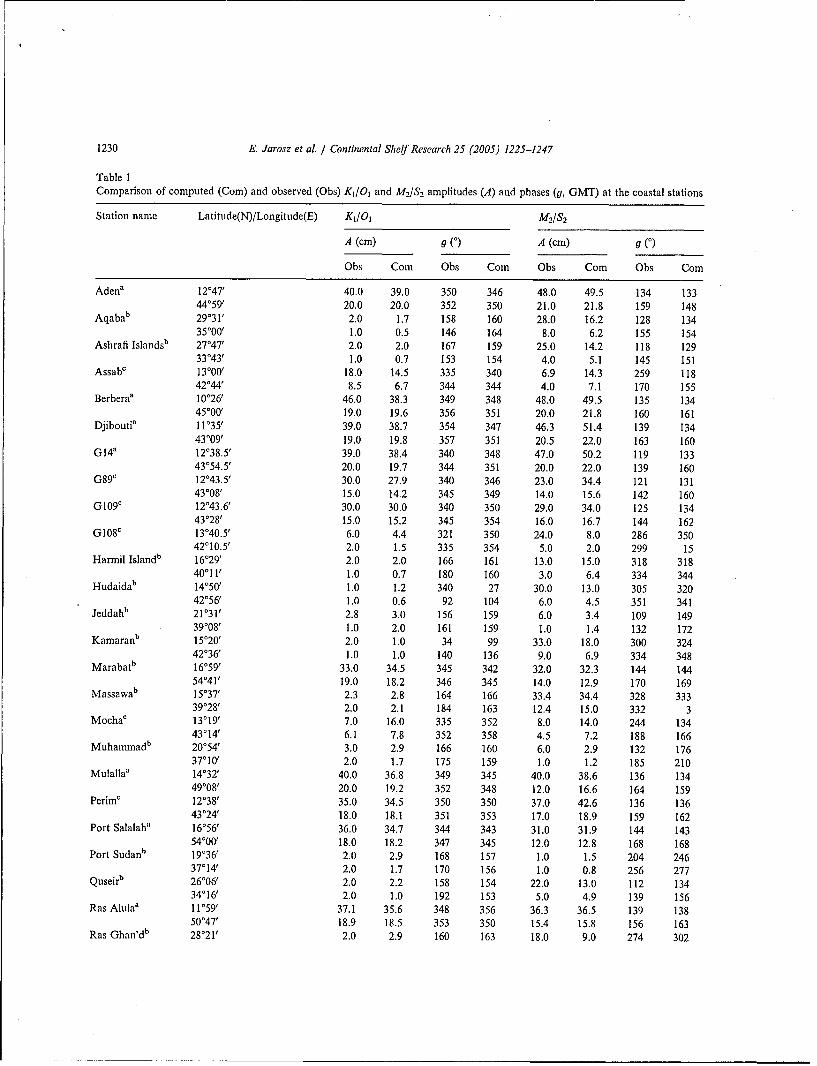
A constant value for the bottom friction water level stations only a few tidal constituentscoefficient, equal to 0.003, was applied throughout were available for the comparison; the commonthe domain. Several bottom friction coefficients constituents for all stations were K1, 01, M2, andwere tried, and the value of 0.003 gave the best S2.agreement with the observations. A time step of Major features of the diurnal tidal elevations,30s was used to ensure model stability based on such as larger amplitudes in the Gulf of Aden andthe Courant number criterion. The parameter r0, much smaller ones in the Red Sea proper, arewhich weights the primitive and GWCE form of qualitatively captured by the model when com-the continuity equation, was estimated from a pared to the available observations (Table 1).formula given by Westerink et al. (1994) and set Similarly, well represented are major features ofequal to 0.001. Finally, the minimum depth was the semidiurnal tidal elevations. Such semidiurnalassigned to be 2m to eliminate any potential features include higher amplitudes in the Gulfdrying of computational nodes since wetting and of Aden, Aquaba and Suez, very small M2
1230 E. Jarosz et al. / Continental Shelf Research 25 (2005) 1225-1247
Table IComparison of computed (Coin) and observed (Ohs) K1/0 1 and M2/S2 amplitudes (A) and phases (g, GMT) at the coastal stations
Station name Latitude(N)/Longitude(E) K 1/01 M 2/S 2
A (cm) g( 0 ) A (cm) g (0)
Ohs Com Ohs Coin Obs Corn Obs Com
Aden' 12047' 40.0 39.0 350 346 48.0 49.5 134 13344059' 20.0 20.0 352 350 21.0 21.8 159 148
Aqabab 29031F 2.0 1.7 158 160 28.0 16.2 128 13435000' 1.0 0.5 146 164 8.0 6.2 155 154
Ashrafi Islandsb 27047, 2.0 2.0 167 159 25.0 14.2 118 12933043' 1.0 0.7 153 154 4.0 5.1 145 151
Assab0 13'00' 18.0 14.5 335 340 6.9 14.3 259 11842044, 8.5 6.7 344 344 4.0 7.1 170 155
Berbera' 10026' 46.0 38.3 349 348 48.0 49.5 135 13445000' 19.0 19.6 356 351 20.0 21.8 160 161
Djibouti' 11035' 39.0 38.7 354 347 46.3 51.4 139 13443009' 19.0 19.8 357 351 20.5 22.0 163 160
GI4a 12038.5' 39.0 38.4 340 348 47.0 50.2 119 13343054.5' 20.0 19.7 344 351 20.0 22.0 139 160
G89c 12043.5' 30.0 27.9 340 346 23.0 34.4 121 13143008' 15.0 14.2 345 349 14.0 15.6 142 160
G109c 12043.6' 30.0 30.0 340 350 29.0 34.0 125 13443028' 15.0 15.2 345 354 16.0 16.7 144 162
G108c 13040.5' 6.0 4.4 321 350 24.0 8.0 286 35042010.5' 2.0 1.5 335 354 5.0 2.0 299 15
Harmil Islandb 16029' 2.0 2.0 166 161 13.0 15.0 318 31840011' 1.0 0.7 180 160 3.0 6.4 334 344
Hudaidab 14050' 1.0 1.2 340 27 30.0 13.0 305 32042056' 1.0 0.6 92 104 6.0 4.5 351 341
Jeddahb 21031' 2.8 3.0 156 159 6.0 3.4 109 14939008' 1.0 2.0 161 159 1.0 1.4 132 172
Kamaranb 15020' 2.0 1.0 34 99 33.0 18.0 300 32442036' 1.0 1.0 140 136 9.0 6.9 334 348
Marabatb 16059' 33.0 34.5 345 342 32.0 32.3 144 14454041' 19.0 18.2 346 345 14.0 12.9 170 169
Massawab 15037' 2.3 2.8 164 166 33.4 34.4 328 33339028' 2.0 2.1 184 163 12.4 15.0 332 3
Mocha' 13019' 7.0 16.0 335 352 8.0 14.0 244 13443'14' 6.1 7.8 352 358 4.5 7.2 188 166
Muhammadb 20054' 3.0 2.9 166 160 6.0 2.9 132 17637010' 2.0 1.7 175 159 1.0 1.2 185 210
Mulalla' 14032' 40.0 36.8 349 345 40.0 38.6 136 13449008' 20.0 19.2 352 348 12.0 16.6 164 159
Perimc 12038' 35.0 34.5 350 350 37.0 42.6 136 13643024' 18.0 18.1 351 353 17.0 18.9 159 162
Port Salalah' 16056' 36.0 34.7 344 343 31.0 31.9 144 14354000' 18.0 18.2 347 345 12.0 12.8 168 168
Port Sudanb 19036' 2.0 2.9 168 157 1.0 1.5 204 24637014' 2.0 1.7 170 156 1.0 0.8 256 277
Quseirb 26006' 2.0 2.2 158 154 22.0 13.0 112 13434016' 2.0 1.0 192 153 5.0 4.9 139 156
Ras Alula' 11059' 37.1 35.6 348 356 36.3 36.5 139 13850047' 18.9 18.5 353 350 15.4 15.8 156 163
Ras Ghan'db 28021' 2.0 2.9 160 163 18.0 9.0 274 302

E. Jarosz et al. / Continental Shelf Research 25 (2005) 1225-1247 1231
Table I (continued)
Station name Latitude(N)/Longitude(E) K1/01 M2/S2
A (cm) g (0) A (cm) g (0)
Obs Com Obs Com Obs Corn Obs Corn
33007' 2.0 0.9 157 154 7.0 3.0 302 318
Ras Khathibb 14'55' 4.0 1.2 69 25 26.0 13.0 294 31842054' 1.0 0.6 82 82 7.0 4.5 339 339
Saylac' 11022' 40.0 38.9 348 348 50.0 51.6 137 13343028' 20.0 19.9 356 351 20.0 22.6 153 161
Shaker Islandb 27027' 2.0 2.0 167 154 25.0 14.0 117 13234002' 1.0 0.7 178 151 4.0 5.1 144 154
Sherm Rabeghb 22044' 4.0 2.7 156 160 11.0 6.1 124 14238'58' 4.0 1.4 162 163 2.0 2.5 165 164
Siqa 12040' 35.0 33.0 338 346 23.0 27.0 139 14054'04' 17.0 17.3 339 349 13.0 11.4 156 164
Suezb 29056' 4.5 3.3 158 162 56.0 26.0 278 30032033' 1.3 0.8 170 152 14.0 8.7 306 319
Torb 28014' 4.0 2.6 164 157 8.0 3.2 205 21333037' 2.0 0.8 159 152 1.0 1.6 230 211
Zafaranab 29'07' 3.0 3.3 165 163 42.0 21.0 280 30032040' 1.0 0.9 199 152 12.7 6.9 301 320
'Stations located in the Gulf of Aden and Indian Ocean.bStations located in the Red Sea.'Stations located in the Bab el Mandab Strait.
amplitudes near Port Sudan and Jeddah resulting Table 2
from the presence of the anticlockwise amphidro- Correlation coefficients (Corr) and standard deviations (SD)between the computed and measured tidal amplitudes andmic system, and the M2 amphidrome in the Bab el pae
Mandab Strait (Defant, 1961).
A measure of the agreement between the Tidal constituent N Amplitude Phase H (cm)modeled and observed elevations is achieved by Corr SD(cm) Corr SD(deg)examining correlation coefficients between com-puted and measured amplitudes and phases. Table Q1 10 0.97 0.4 0.90 11 0.532 lists these coefficients together with the number 0o 33 0.99 0.8 0.99 16 1.15
of stations used in the comparison and the P1 17 0.99 0.6 0.98 22 0.93K1 33 0.99 2.4 0.86 17 2.45respective standard deviations of the differences N2 23 0.73 3.2 0.85 42 4.49
between the modeled and observed values. In M2 33 0.83 9.3 0.85 39 9.39addition, the parameter His presented, which is an S2 33 0.94 2.5 0.79 18 2.99average difference between the observations and K2 20 0.91 1.1 0.75 28 1.68
model solution and measures overall model N is the number of the stations; H is an average differenceperformance. This parameter is estimated from between the observations and computed solution.
the following expression (Davies et al., 1997):
1N, COS gwhere N is the number of the water level stations, AH = •Z[(Aobs cos gobs - Acom cos gcom) 2 and g are amplitudes and phases, respectively, and
k=1 suffixes "com" and "obs" denote the computed and+ (A~bs sin gs - Acorn sin gCOM , (4) observed harmonic constants, respectively.
1232 E Jarosz et at. / Continental Shelf Research 25 (2005) 1225-1247
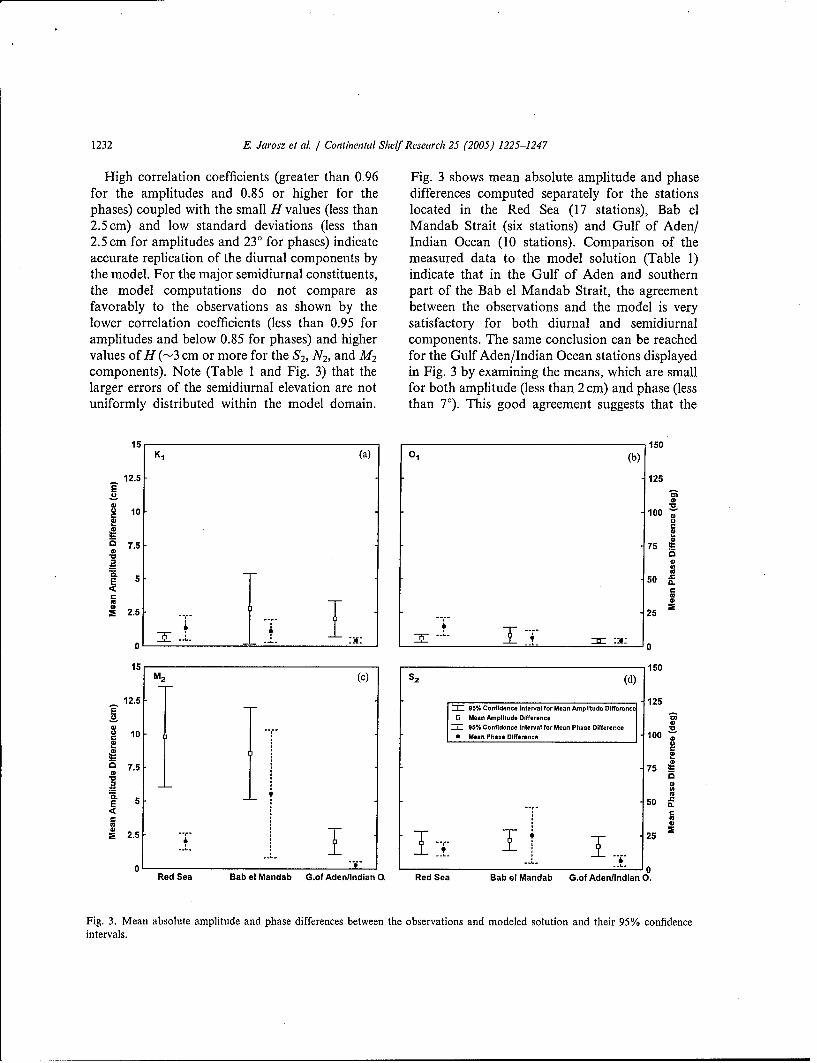
High correlation coefficients (greater than 0.96 Fig. 3 shows mean absolute amplitude and phasefor the amplitudes and 0.85 or higher for the differences computed separately for the stationsphases) coupled with the small H values (less than located in the Red Sea (17 stations), Bab el2.5cm) and low standard deviations (less than Mandab Strait (six stations) and Gulf of Aden/2.5 cm for amplitudes and 230 for phases) indicate Indian Ocean (10 stations). Comparison of theaccurate replication of the diurnal components by measured data to the model solution (Table 1)the model. For the major semidiurnal constituents, indicate that in the Gulf of Aden and southernthe model computations do not compare as part of the Bab el Mandab Strait, the agreementfavorably to the observations as shown by the between the observations and the model is verylower correlation coefficients (less than 0.95 for satisfactory for both diurnal and semidiurnalamplitudes and below 0.85 for phases) and higher components. The same conclusion can be reachedvalues of H (-'3 cm or more for the S2, N2, and M2 for the Gulf Aden/Indian Ocean stations displayedcomponents). Note (Table 1 and Fig. 3) that the in Fig. 3 by examining the means, which are smalllarger errors of the semidiurnal elevation are not for both amplitude (less than 2 cm) and phase (lessuniformly distributed within the model domain, than 70). This good agreement suggests that the
15 150K1 (a) 01 (b)
12.5 125
10 100
S7.5 75* U=
2. ...:. 25'
0 0
15 150M, (C) s, (d)
12.5 T-T 125
'E m •' 95 CofidnceIntrva fo Mean Amplitude Difference
=.-- 95% Confidenc e Inteoval for Mean Phase Difference is
7.5 75 i
E 50 -r Mn
~0 a).. -S22.5 ~1 -1 25
01 0Red Sea Bab el Mandab G.of Aden/Indian O, Red Sea Bab el Mandab G.of AdeniIndian 0.
Fig. 3. Mean absolute amplitude and phase differences between the observations and modeled solution and their 95% confidenceintervals.

E Jarosz et at. Continental Shelf Research 25 (2005) 1225-1247 1233
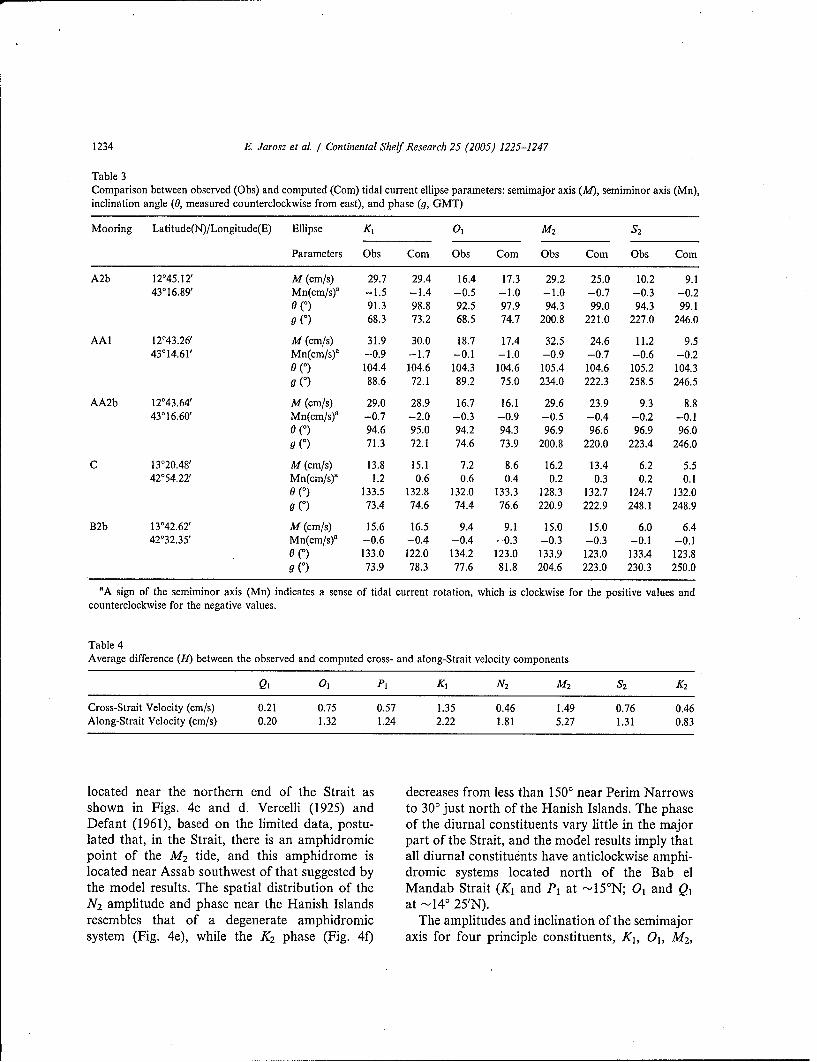
tidal elevation constants taken from the World is good for both semidiurnal and diurnal consti-Ocean Tide Model (Le Provost et al., 1994) tuents. The largest error for the semimajor axis isrepresent well the tidal wave incoming from the found for the M 2 at Perim Narrows (mooringsIndian Ocean. Therefore, the open ocean bound- A2b, AA1, and AA2b) where the computedary forcing is not likely to be a major source of the amplitudes are, on average, 20% smaller thanerrors observed north of Perim Narrows where the the measured ones. For other constituents atsemidiurnal waves are not well simulated, espe- Perim Narrows as well as for all tidal componentscially with regard to their phases. The largest at C mooring and the Hanish Sill (mooring B2b)phase discrepancies are found in the Strait near the the difference between computed and observedamphidrome for the M 2 (Assab, G108 and Mocha) semimajor axes is always less than 20% of thosewhere the difference between the computed and estimated solely from the observations. Theobserved phases can be as large as 140'. modeled semiminor axes are very small (2cm/s
A set of experiments, in which alternate bathy- or less) and comparable with those computed frommetric values were assigned at the nodes within the the observations. The difference between theStrait, indicates that the phase errors are partly model and observed inclinations is, on average,related to the bathymetry. A 10m decrease of 4% of the observed inclination angles (measureddepth in the deep channel and a 5m decrease of counterclockwise from east), while the phasedepth in the shoals (at mesh nodes with depths of difference is always smaller than 1 h for all7 m or more) between Perim Narrows and Assab- considered constituents. Additionally, the H va-Mocha line resulted in a 15% increase of the M2 lues computed separately for along and cross-straitphase, reducing the phase error and causing small velocity components are listed in Table 4. The Hchanges in the K1 phase. An increase of the bottom values, except the M 2 component, are smallfriction coefficient (Cd) to values of 0.05 or larger (<2.30cm/s), indicating that in the Strait, thefor the original bathymetric configuration had barotropic tidal currents are well simulated by thesimilar effects on the M 2 phase error, i.e. a model.reduction. Additionally, it was shown by Grenieret al. (1995) that in regions with strong rectilinearcurrents, the standard quadratic formulation for 4. Tidal elevations and currents in the Straitthe friction term might not be sufficient toproperly describe damping of the tidal waves. Fig. 4 displays computed coamplitudes (in cm)Since the tidal currents in the Strait are quite and cophases (in degrees, GMT) of the tidalstrong and very rectilinear, the quadratic bottom elevations for the K1, 01, M 2 , S2, N2, and K 2
friction formulation could be introducing an constituents. Similar to findings from data ana-additional error into the computations. This error, lyses (Vercelli, 1925, 1927; Siedler, 1969; Jarosz,however, is likely small in comparison to errors 2002), K, (01, P1 and Q, amplitudes are, onassociated with other forms of tidal dissipation average, 50%, 31%, and 9%, respectively, of thesuch as form drag, turbulence, internal tide Kl) and M 2 (amplitudes of the S2, N2 and K2 are,generation, and interaction with nontidal currents, on average, 45%, 48%, and 9%, respectively, ofwhich are not represented in the two-dimensional the M2) are the dominant constituents in thebarotropic model. Strait. Furthermore, the amplitudes of all tidal
Locations (see Fig. 1 and Table 3 for the components show very similar behavior in themooring locations) with observational estimates Strait, i.e. little variability in the cross-strait(5) of the barotropic tidal currents are limited to direction and rapid attenuation of the amplitudesthe Bab el Mandab Strait. In Table 3, the observed in the along-strait direction. The largest values areand calculated K1, 01, M2, and S2 tidal currents found near Perim Narrows and the smallest onesare described by the parameters of the tidal ellipse are present at the northern end of the Strait. The(Pugh, 1987). In general, the agreement between amplitude and phase distributions indicate that thecomputed and measured tidal currents in the Strait M 2 and S2 waves have amphidromic systems
1234 E. Jarosz et a[. / Continental Shelf Research 25 (2005) 1225-1247
Table 3Comparison between observed (Obs) and computed (Coin) tidal current ellipse parameters: semimajor axis (M), semiminor axis (Mn),inclination angle (0, measured counterclockwise from east), and phase (g, GMT)
Mooring Latitude(N)/Longitude(E) Ellipse K1 01 M2 S 2
Parameters Obs Com Obs Com Obs Corn Obs Com
A2b 12'45.12' M (cm/s) 29.7 29.4 16.4 17.3 29.2 25.0 10.2 9.143016.89' Mn(cm/s)" -1.5 -1.4 -0.5 -1.0 -1.0 -0.7 -0.3 -0.2
0 (0) 91.3 98.8 92.5 97.9 94.3 99.0 94.3 99.1g (0) 68.3 73.2 68.5 74.7 200.8 221.0 227.0 246.0
AA1 12'43.26' M (cm/s) 31.9 30.0 18.7 17.4 32.5 24.6 11.2 9.543014.61' Mn(cm/s)a -0.9 -1.7 -0.1 -1.0 -0.9 -0.7 -0.6 -0.2
0 (0) 104.4 104.6 104.3 104.6 105.4 104.6 105.2 104.3g (0) 88.6 72.1 89.2 75.0 234.0 222.3 258.5 246.5
AA2b 12'43.64' M (cm/s) 29.0 28.9 16.7 16.1 29.6 23.9 9.3 8.843016.60' Mn(cm/s)a -0.7 -2.0 -0.3 -0.9 -0.5 -0.4 -0.2 -0.1
0 (0) 94.6 95.0 94.2 94.3 96.9 96.6 96.9 96.0g (0) 71.3 72.1 74.6 73.9 200.8 220.0 223.4 246.0
C 13020.48' M (cm/s) 13.8 15.1 7.2 8.6 16.2 13.4 6.2 5.542054.22' Mn(cm/s)a 1.2 0.6 0.6 0.4 0.2 0.3 0.2 0.1
0 (0) 133.5 132.8 132.0 133.3 128.3 132.7 124.7 132.0g (0) 73.4 74.6 74.4 76.6 220.9 222.9 248.1 248.9
B2b 13042.62' M (cm/s) 15.6 16.5 9.4 9.1 15.0 15.0 6.0 6.442032.35' Mn(cm/s)0 -0.6 -0.4 -0.4 -0.3 -0.3 -0.3 -0.1 -0.1
0 (0) 133.0 122.0 134.2 123.0 133.9 123.0 133.4 123.8g (0) 73.9 78.3 77.6 81.8 204.6 223.0 230.3 250.0
'A sign of the semiminor axis (Mn) indicates a sense of tidal current rotation, which is clockwise for the positive values and
counterclockwise for the negative values.
Table 4Average difference (H) between the observed and computed cross- and along-Strait velocity components
Ql 0, PI K1 N2 M2 S2 K2
Cross-Strait Velocity (cm/s) 0.21 0.75 0.57 1.35 0.46 1.49 0.76 0.46Along-Strait Velocity (cm/s) 0.20 1.32 1.24 2.22 1.81 5.27 1.31 0.83
located near the northern end of the Strait as decreases from less than 1500 near Perim Narrowsshown in Figs. 4c and d. Vercelli (1925) and to 300 just north of the Hanish Islands. The phaseDefant (1961), based on the limited data, postu- of the diurnal constituents vary little in the majorlated that, in the Strait, there is an amphidromic part of the Strait, and the model results imply thatpoint of the M2 tide, and this amphidrome is all diurnal constituents have anticlockwise amphi-located near Assab southwest of that suggested by dromic systems located north of the Bab elthe model results. The spatial distribution of the Mandab Strait (K1 and PI at --,15'N; 01 and Q,N 2 amplitude and phase near the Hanish Islands at -14' 25'N).resembles that of a degenerate amphidromic The amplitudes and inclination of the semimajorsystem (Fig. 4e), while the K 2 phase (Fig. 4f) axis for four principle constituents, K1, O1, M 2,

E. Jarosz et al. / Continental Shelf Research 25 (2005) 1225-1247 1235
S(a) it\ -J "-
14.ON - I: I
a I IN ,
13.5N Is ' j0
a-P
-j 13.ON - '2
12.5N
12.0N K1 0 1
be(c) *' 20 (d)
14.ON - 6 -6a 240\ 8 200
---- / / 60
- / ~40 .
13.5N - ~ s0012
-J 13.0N - . '6
36iOp
12.5N -
12.ON M2 ,0 S2
"•. ~~~(e)_,o -(
14.ON -. I-
13.5N - - - 4
13.0N -
12.5N -
12.ON N, K242.OE 42.5E 43.OE 43.5E 44.0E 42.OE 42.5E 43.OE 43.5E 44.OE
Longitude Longitude
Fig. 4. Model coamplitudes (in cm; solid line) and cophases (deg, GMT; dashed line) for the (a) K1, (b) O, (c) M 2, (d) S2, (e) N2 , and() K2 constituents.

1236 E. Jarosz et al. / Continental Shelf Research 25 (2005) 1225-1247
and S2 are displayed in Fig. 5 (inclination arrows respectively, of those associated with the K1) andare shown at a subsampled number of the model M2 (semimajor axis amplitudes of the S2, N2, andnodes for clarity). For all eight tidal components, K2 are, on average, 41%, 25%, and 5%, respec-distributions of the semimajor axis amplitudes tively, of those associated with the M2). Further-show amplification of tidal currents as they flow more, the amplitudes of the K, and M2 currentsinto the Bab el Mandab Strait from the Gulf of are comparable. The most energetic flow is presentAden. The strongest currents are generated by the in the narrowest part of the Strait (between PerimK, (semimajor axis amplitudes of the 01, PI, and Narrows and Assab-Mocha line) with the max-Q, are, on average, 55%, 38%, and 10%, imum modeled amplitudes found near the Perim
S(a) 'x(b)
14.ON g
13.5N-
K1 012.ON
13.5N -
12.5N t \ "
M2ON 352
20N42.0E 42.5E 43.0E 43.5E 44.0E 42.0E 42.5E 43.01= 43.5E 44.0OE
Longitude Longitude
Fig. 5. Model amplitudes (cm/s; a color scale) and direction (arrows) of the current semimajor axis for the (a)/K 1, (b) Oi, (c) M2 , and(d) S2 constituents.
E. Jarosz et al. / Continental Shelf Research 25 (2005) 1225-1247 1237
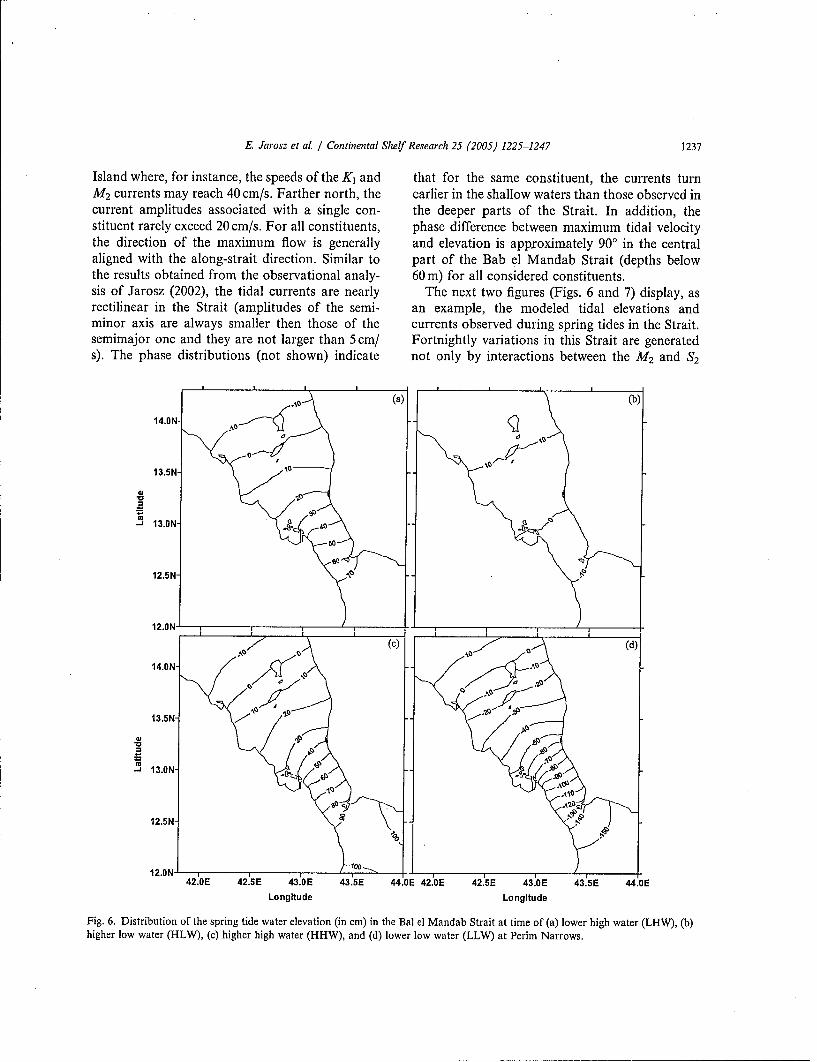
Island where, for instance, the speeds of the Kt and that for the same constituent, the currents turnM2 currents may reach 40 cm/s. Farther north, the earlier in the shallow waters than those observed incurrent amplitudes associated with a single con- the deeper parts of the Strait. In addition, thestituent rarely exceed 20 cm/s. For all constituents, phase difference between maximum tidal velocitythe direction of the maximum flow is generally and elevation is approximately 900 in the centralaligned with the along-strait direction. Similar to part of the Bab el Mandab Strait (depths belowthe results obtained from the observational analy- 60 m) for all considered constituents.sis of Jarosz (2002), the tidal currents are nearly The next two figures (Figs. 6 and 7) display, asrectilinear in the Strait (amplitudes of the semi- an example, the modeled tidal elevations andminor axis are always smaller then those of the currents observed during spring tides in the Strait.semimajor one and they are not larger than 5cm! Fortnightly variations in this Strait are generateds). The phase distributions (not shown) indicate not only by interactions between the M2 and S2
.D(a) (b)
14.ON "D
13.5N- AD
I a
13.ON
50
60 '
12.5N"
12.ON ,
at () (d)14.ON -
13.5N- OZ
'UJ13.ON-
12.5N-
12.ON' 100
42.0E 42.5 E 43.OE 43.51E 44.OE 42.01E 42.5E 43.01E 43.5E 44.OELongitude Longitude
Fig. 6. Distribution of the spring tide water elevation (in cm) in the Bal el Mandab Strait at time of (a) lower high water (LHW), (b)higher low water (HLW), (c) higher high water (HHW), and (d) lower low water (LLW) at Perim Narrows.

1238 E. Jarosz et at. / Continental Shelf Research 25 (2005) 1225-1247
12.5N-• I12 ....N ... ,.
-.............. . . . .. (c ... , ,.,V V,,,• V .',."....(d....13.0N ".
1..ON..
...............
13.5N - .. ... ... ... .. .'.... - _
..... ..... .. . .
13.ON .i.
12.5N
12.ON I
42.0E 42.5E 43.0E 43.5E 44.0E 42.0E 42.5E 43.0E 43.5E 44.0E
Longitude Longitude
Fig. 7. Spring tide currents in the Bab el Mandab Strait (a) •4 h after LHW, (b) -'3 h after HLW, (c) --3 h after HHW, and (d) --4 hafter LLW at Perim Narrows.
components, but also by interactions between the fluctuations are dominated by the semidiurnalK1 and O1 constituents; for convenience of this tides. South of the islands, these maxima anddiscussion, we refer to the largest tides generated minima are more and more dissimilar due to theby all considered constituents in the fortnightly changing character of the tides from semidiurnalcycle as spring tides as opposed to the lowest tides to mixed. The distributions of the tidal elevationthat we refer to as neap tides. For all displayed for both high water stages of the spring tides (Figs.plots the times of the high or low waters are 6a and c) are fairly similar. They both show thereferenced to those observed at Perim Narrows. largest elevations in the southern part of the Strait
The spring tides in this Strait are characterized with magnitudes of -'-'70 and '--90 cm near Perimby two high and two low waters. Two nearly equal Narrows for lower high water (LHW) and higherhigh and low water stages are mainly observed high water (HHW), respectively. Furthermore, thenear the Hanish Islands where the tidal elevation large elevation gradients are present in the along-

E. Jarosz et al. / Continental Shelf Research 25 (2005) 1225-1247 1239
strait direction while simultaneously showing little expected, is a magnitude of the tidal elevations,or no variability in the cross-strait direction. which is lower in the Strait for the neap tides.Similar to the high water stages, the low water During these tides, the maximum speeds of theelevation distributions show little variability in the flood/ebb flow associated with HHW/LLW arecross-strait direction and large variations in the generally between 25 and 35cm/s south of thealong-strait direction; largest elevation gradients Assab-Mocha line. Farther north, they do notare present during lower low water (LLW) and exceed 20cm/s. Similar to the HHW flood or LLWmuch smaller ones occur at higher low water ebb of the spring tides, there is little variability in(HLW). Furthermore, when LLW is observed at the direction of these tidal flows, which generallyPerim Narrows (Fig. 6d), the low water (negative show inflow and outflow, respectively, across thevalues) is generally present throughout the entire entire Strait. If the second flood and ebb areStrait, while for the HLW stage (Fig. 6b), only the observed, the currents are even weaker, and theirpart of the Strait between Perim Narrows and the direction is quite variable.Assab-Mocha line is actually in the low waterstage. Farther north, the tidal elevation distribu-tion implies rather high water stage. 5. Tidal residual circulation in the Strait
The currents are in the flood stage about 4 hafter LHW at Perim (Fig. 7a). The direction of the Due to variable bathymetry, the tidal flow mayflow shows some variability, but in general, the generate residual currents through nonlinearbarotropic currents flow into the Strait with the interactions (Zimmerman, 1978). These tidalspeeds rarely exceeding 20cm/s. Fig. 7b displays residual currents often play an important role inthe speed and direction approximately 3 h after the local mean circulation, and in the case of theHLW at Perim Narrows. Similar to the previous Bab el Mandab Strait, they may also contribute tostage, the speeds are weak and rarely reach 15 cm/ the transport of the Red Sea waters to the Gulf ofs. The flow direction varies greatly and the well- Aden/Indian Ocean system.defined outflow (speed between 10 and 15 cm/s) is To extract the time-averaged residual motion,generally confined to the deep channel. About 3 h which is induced by the eight primary tidalafter HHW, the tidal currents are at the maximum constituents (K1, 01, P1, Qi, M2, S2 , N2, and K2)flood stage (Fig. 7c). The flow is very energetic in in the Strait, the computed currents were averagedthe entire Strait with the maximum velocity over a 29-day period (Kowalik and Polyakov,reaching above 100 cm/s at Perim Narrows. The 1998), and the results of this averaging are showndirection of the flood flow is nearly uniform in Fig. 8. In general, the residuals are weak with anshowing the well-defined inflow across the entire average speed below 1 cm/s. In the deep channel,Strait. Finally, about 4 h after LLW at Perim to which the Red Sea water outflow is confinedNarrows (Fig. 7d), the currents are at the (Murray and Johns, 1997), the residual currentmaximum outflow. The direction of the flow varies speeds are even lower and do not exceed 0.5cm/s.very little and the outflow is observed across the At the Perim transect (see Fig. 1 for its location),entire Strait with the speeds comparable to those for instance, the transport generated by theof the maximum flood currents. residual flow in the deep channel (depths of 50 m
During 24 h of neap tides, one may see one low or more) is directed towards the Gulf of Aden butand one high water or, similar to the spring tides, it is very small (-3.45 x 10⁻³ Sv, ISv = 106 m3/s)two high and two low waters (data not shown). when compared with the volume transport ofThe general features of the elevation distribution, 0.37 Sv associated with the mean circulationsuch as higher magnitudes near Perim Narrows, (Murray and Johns, 1997). The strongest residuallarge gradients in the along-strait direction, little flow is generally found near the islands and in thevariability in the cross-shore direction, are iden- shallow parts of the Strait located between Perimtical to those observed during the high and low Narrows and Assab-Mocha line. Near Perim orwater of the spring tides. The only difference, as the Hanish Islands, for instance, the speed of the

1240 E Jarosz et al. / Continental Shelf Research 25 (2005) 1225-1247
14.ON
13.6N
12 cm/s
"13.2N - 0
8
12.8N -.e
2+
012.4W
42.OE 42.4E 42.8E 43.2E 43.6E
Longitude
Fig. 8. Time-averaged residual tidal flow in the Bab el Mandab Strait (a color scale-speeds in cm/s; arrows--direction).
residual currents can be as high as 20cm/s. These amplitudes of these currents (not shown) arehigh speeds observed near the islands and head- slightly lower than those of the time-averagedlands may be partly generated by sharp changes in flow, with the maximum amplitudes being belowthe coastline associated with the model grid despite 15 cm/s. Similar to the time-averaged residual flow,its high resolution. The time-averaged residual the most energetic currents are again observedflow also displays several small clockwise and near the Perim and Hanish Islands. Additionally,counterclockwise eddies such as those located west small eddies are present in the time-dependentof Mocha or south-east of Ras Dehaneba (see flow, and these eddies are better developed duringcirculation patterns inside the black rectangles in the spring tides. These time-dependent fluctuationsFig. 8). A lack of high resolution in situ observa- are dominated by a fortnightly cycle. Spectraltions in these areas prohibits verification of the analysis indicates that most of the energy at lowexistence of these eddies, frequencies is indeed in the fortnightly frequency
In addition to the time-averaged residual and some in the monthly frequency. None of thecurrents, the time-dependent residual flow was low frequency constituents is included in thealso analyzed. These residuals were extracted from forcing. Thus, in this region, they arise throughthe model computed time series by removing interactions between those constituents, which aremotions with periods less than 2 days. The used to force the model. The results indicate that

E. Jarosz et al. / Continental Shelf Research 25 (2005) 1225-1247 1241
(a) (b)
14.ON-
13.5N-
'U
-.i 13.ON
12.5N
12.ON42.OE 42.5E 43.OE 43.5E 44.OE 42.OE 42.5E 43.OE 43.5E 44.OE
Longitute Longitute
0.0 1.0 2.0 3.0 4.0 5.0 6.0 cm/s
Fig. 9. Amplitudes (in cm) of the semimajor axes of (a) the fluctuations generated by the K1 and O interactions and (b) the Msrconstituent.
among these long period tidal constituents, the ME where h is the water depth, ý is the tidal elevation,(M2 and S2 interactions) and tide having a 13.66- Po is representative seawater density (= 1026 kg/day period (generated by K, and 01 nonlinear in3 ), U is the current velocity vector, and g is theinteractions) are dominant components in the acceleration due to gravity. This energy fluxStrait. Such K1 and 01 interactions have been also includes the contribution of both kinetic andobserved in other ocean regions as described by potential energy. In the Bab el Mandab Strait,Brink (1995) and Kowalik and Polyakov (1998). the flux of the kinetic energy is always smaller thanFig. 9 shows the spatial structure of the semimajor that for the potential energy, on average, by fouraxes of the Msf and 13.66-day components as orders of magnitude. For example, the flux of theobtained from the harmonic analyses of a 1-year- K1 kinetic energy is, on average, 7 x 10- 2W/mlong model time series. The amplitudes of this axis while the average flux of the K1 potential energy isvary between 0.01 and 5.30cm/s for the Msf and 13.9 x 10² W/m. The same fluxes for M2 arebetween 0.01 and 5.48cm/s for the 13.66-day 5 x 10⁻² and 8.5 x 10² W/m, respectively.component. Additionally, the amplitudes of the The average energy fluxes over a tidal period forMsf constituent in the Strait are generally smaller the KI and M2 constituents are shown in Fig. 10.than those associated with the oscillations gener- For each constituent, the average energy flux wasated by the Kl and 01 tidal components. computed by averaging the flux time series
obtained from Eq. (5) over the constituent period.Additionally, the elevations and currents, required
6. Barotropic energy flux and dissipation for the flux time series computations, weregenerated using the model harmonic constants
The energy flux (Kowalik and Proshutinsky, and a time interval of I min. It is very apparent1 ;Foreman et aL, 1995) is given by that the average fluxes associated with two
1993; Fdominant tidal components display different
P = (h + ý)po(0.5 + g± oT (5) behavior in the Strait. The K, constituent hasgenerally one source of energy (Fig. 10a), which is

1242 E. Jarosz et al. / Continental Shelf Research 25 (2005) 1225-1247
.. ................. (a))..............
. .... . . . . ... .. . .
1. ....... , . ..
14.. .- . . .......
\.... ............. . .........
12.8N
42.OE 42 4E 42.8E 43.2E 43.6E 44.OE 42.OE 42.4E 42.8E 43.2E 43.6E 44.OELongitude Longitude
Fig. 10. Mean tidal energy flux per unit length (in W/m) for the (a) K, and (b) M 2 constituents.
the advective flux from the Gulf of Aden into the the tidal energy into the Strait is again from theStrait. The additional contribution of the K, Gulf of Aden.energy from the Red Sea proper is negligible Table 5 lists tidal power fluxes normal to twobecause the fluxes associated with this source are transects that are located near Perim Narrows andat least two orders of magnitude smaller than the Hanish Sill (see Fig. 1 for their locations). Allthose from the Gulf. Similar to the K1, other estimates are the net fluxes through the transectsdiurnal constituents also have one major source of with the flux into the Strait being positively definedenergy, which is flux from the Gulf of Aden.In and the flux out of the Strait being negativelycontrast, there are two comparable sources of defined. In addition to the constituent fluxes,energy for the M 2 constituent (Fig. 10b): one is the Table 5 lists fluxes of the spring and neap tidesflux directed from the Gulf of Aden and another is (spring/neap). The spring and neap values are thethe flux from the Red Sea proper. The S2 and K2 averages calculated over 25 h periods beginning athave two fairly comparable energy sources as that 00:00 GMT on June 12, 1995 and ending at 00:00for the M2. For the N2, however, the computed on June 20, 1995, respectively, including all eightfluxes from the Red Sea are, on average, one order constituents.of magnitude smaller than those from the Gulf. The values listed in Table 5 indicate thatAdditionally, Fig. 11 shows the average energy regardless of the constituent or spring/neap tide,fluxes for the spring and neap tides (both spring energy is generally advected to the Strait. Theand neap fluxes are 25-h averages). These spring outgoing fluxes (see, for instance, diurnal compo-and neap fluxes, which give estimates for a nent and neap fluxes) are observed only along themaximum and a minimum of the barotropic tidal Hanish transect and their values are just a smallfluxes in the Strait as generated by eight principle fraction of those transmitted through the Perimconstituents, clearly indicate that the major flux of transect. In general, the majority of the barotropic

E. Jarosz et al. / Continental Shelf Research 25 (2005) 1225-1247 1243
).. .. .: . .. . . ... ( ) (b)
14.•M . .t t
. .. ............
.................. * * .a~13.6N-
""' . . . . ...
12.8N.
12.4N -Spring Tides '. NeapnTdes .......
12.0N8 %I It "Nt ." ..
42.OE 42.4E 42.8E 43.2E 43.6E 44.OE 42.OE 42.4E 42.8E 43.2E 43.6E 44.0ELongitude Longitude
Fig. 11. Mean tidal energy fluxes (25-h averages; in W/m) for (a) spring and (b) neap tides.
Table 5Net power flux (in Gigawatts) normal to the transects shown in Fig. I
Transect K, 0, P1 QS M2 S 2 N2 K2 Spring Neap
Perim (1) 0.248 0.091 0.032 0.004 0.111 0.032 0.017 0.001 1.472 0.288Hanish (2) -0.022 -0.007 -0.002 -0.0003 0.091 0.005 -0.002 0.001 0.128 -0.003
tidal energy is advected to the Bab el Mandab that the K2 energy flux from the Red Sea to theStrait from the Gulf of Aden where both diurnal Strait is zero at the Hanish transect, while that ofand semidiurnal tides are strong. Since the tides in the M 2 flux is extremely small and equal tothe Red Sea are weaker than those of the Gulf of 1.9039 x 10⁻⁵ GW at the same location. TheseAden and semidiurnal in nature it is not un- findings imply that the M 2 and K 2 energy fluxesexpected that the contribution of energy from this across the Hanish transect are directly generated inSea would be small, especially for the diurnal the Red Sea by the equilibrium tides.components. The net energy fluxes along the Due to the small outflowing fluxes, almost allHanish transect are indeed small with the excep- tidal energy is dissipated within the Strait. Energytion of those associated with the M 2 and K2 dissipation for all cases is estimated as a net powerconstituents, which are comparable with the flux into a polygon encompassed by Perim andenergy input from the Gulf as reflected at the Hanish transects and the coastline of the Strait.Perim Narrows transect (Table 5). In addition, the Note that only one dissipation mechanism, bottommodel simulation with the equilibrium tidal friction, is included in this particular implementa-potential excluded from the computations shows tion of the ADCIRC model. Lateral and vertical

1244 E Jarosz et al. / Continental Shelf Research 25 (2005) 1225-1247
mixing and energy lost to the generation of reaches values of or greater than 0.01W/m 2 forinternal tides are not included. When the dissipa- both K, and M2 . Farther north, where the tidaltion process is viewed in terms of each constituent, flow is weaker, the dissipation rate is generally onmore, on average, semidiurnal energy (M 2-98%, the order of 10-3W/m 2. The dissipation rateS2-98%, N2-85%, and K2 -95%) than diurnal estimates for other constituents are at least one(K 1-90%, O1-91%, P1-92%, and Q1-92%) is order of magnitude smaller than those of the K,lost within the Strait (95% versus 91% of that and M2 . The spatial patterns of the dissipation ratewhich enters). A high percentage of dissipation is associated with the spring and neap tides (Figs. 12calso observed during the chosen spring tide period and d) are very similar to those of the diurnal and(98%). The dissipation during neap tides is slightly semidiurnal constituents, and in case of the neaplower but still large, equal to 96%. Within the tides, the absolute values of the dissipation ratespolygon encompassed by the chosen transects, the are comparable to those of the K1 and M 2. For thedissipation is estimated as 0.226, 0.084, 0.03, and spring tides, however, the dissipation rate esti-0.0037 GW for the diurnal constituents K1 , 01, P1 , mates are generally one order of magnitude largerQj,, and 0.202, 0.037, 0.015, and 0.002 GW for the than those associated with the KI, M 2, or neapsemidiurnal constituents M 2 , S 2 , N 2, and K 2. For tides.spring and neap tides, the dissipation is 1.6 and0.282 GW, respectively.
To investigate further the dissipation of the 7. Summary and conclusionsbarotropic tides in the Bab el Mandab Strait, i.e.to identify areas with high tidal energy losses and Recent observations (Jarosz, 2002) indicate thatfind differences, if any, in a dissipation pattern tidal motion is a fundamental, clearly non-among different constituents, a rate of energy negligible, aspect of the flow field in the Bab eldissipation was computed. This rate is defined as Mandab. The available measurements, however,(Tsimplis et al., 1995; Munk, 1997): are spatially dispersed and too sparse to examine
in detail the tidal dynamics in this Strait. Thus,T barotropic tides in the Bab el Mandab Strait are
d = f CdPo(U2 + V2) 3/2 dt, (6) numerically simulated with the high resolution,T0 two-dimensional form of the finite element hydro-
dynamic model ADCIRC (Luettich et al., 1992;where Cd is the bottom drag coefficient (= 0.003), Westerink et al., 1994) to examine (1) variability ofP. is the seawater density (= 1026 kg/mi3), U, V the barotropic tidal elevations and currents, (2)are the velocity components at a given grid point, residual tidal circulation and its possible contribu-and T is the tidal period. Fig. 12 displays, as an tion to the Red Sea water outflow, and (3) toexample, the spatial distribution of this rate due to estimate barotropic energy fluxes and energythe K1, M2 , spring and neap tides. The spatial dissipation rates. To our knowledge, this modeldistributions of the dissipation rate demonstrate is the first numerical attempt focused on tides inthat there are similarities in the dissipation pattern this Strait.of the diurnal and semidiurnal tides. Furthermore, Comparisons with the available observationsthe dissipation processes are not uniform in the indicate that the model simulates well the diurnalStrait. The maximum rate of energy dissipation, tidal elevations when compared to the observedfor the K1 and M 2 tides displayed in Figs. 12a and values. Furthermore, the comparison betweenb, is generally found in the narrowest part of the observed and computed tidal currents shows thatstudy area located between Perim Narrows and the the tidal currents are also well replicated in theAssab-Mocha line, i.e. in the region with the Strait for both semidiurnal and diurnal constitu-maximum tidal velocities. The same pattern holds ents. The model performance, however, for thetrue for the other tidal constituents considered. In semidiurnal elevations is less satisfactory mainlythis region of the maximum dissipation, the rate due to the errors between observed and computed

E Jarosz et al. / Continental Shelf Research 25 (2005) 1225-1247 1245
rI
(a) (b)
14.0N-
13.5N
• 13.0N.
12.5N-
MNK1 M2
14.ON -
CF
Spring Tides Neap Tides12.0N
42.0E 42.5E 43.OE 43.5E 44.0E 42.OE 42.5E 43.OE 43.5E 44.OELongitude Longitude
I I'll I -T1•? ,,•i •0 10-5 10-4 10-3 10-2 10-1 10 0 Wlm 2
Fig. 12. Tidal energy dissipation rate (W/m2 ) for the (a) K I, (b) M 2, (c) spring, and (d) neap tides.
phases in the region of amphidromic systems for generated by the eight primary constituents havethese tides in the Strait. These discrepancies the largest amplitudes between Perim Narrows andbetween observed and computed phases are not Assab-Mocha line where their combined speedsunexpected in such regions because small errors in are above I m/s. Farther north, the currentthe position of the amphidrome usually lead to amplitudes are reduced by approximately 50% oflarge phase errors. those observed in the narrow southern part of the
The model computations indicate that the tidal Strait. The amphidromic points for the M2, $2, N2elevation range varies between approximately 2 m in the Strait and the amphidromes for the Q1, O,near Perim Narrows to less than 1 m near the P1, K1, and K2 constituents just north of theHanish Islands. The barotropic tidal currents Hanish Islands together with nearly 90' phase

1246 E Jarosz et al. / Continental Shelf Research 25 (2005) 1225-1247
difference between the tidal elevations and cur- topics that need to be addressed in the future. Therents imply that the tides in the Strait have some most urgent of these is to develop an under-characteristics of standing waves, standing of the baroclinic tidal motion and how
Residual circulation induced by the barotropic this motion interacts with water mass exchangetidal currents is rather weak with the speeds often between the Red Sea and Gulf of Aden/Indianless than I cm/s in the major part of the Strait, and Ocean. Future work then will focus on internalit contributes little to the overall transport of the tides and the application of a baroclinic modelRed Sea waters to the Gulf of Aden/Indian Ocean would be a useful tool to help understand theirsystem. This residual circulation consists of mean generation, propagation, and dissipation in this(time-averaged) and fluctuating (deviation from region.the mean) components. The fluctuating residualflow is dominated by fortnightly oscillations,which are generated by the interactions of the Kland 01 constituents as well as the interaction Acknowledgementsbetween the Ml2 and S2 components.
The mean energy fluxes are small mainly due to This research was supported by the Office ofthe approximately 90' phase difference between Naval Research under contracts N00014-94-1037tidal velocity and elevation, which is observed in awarded to Louisiana State University and ONR
the major part of the Strait; however, these flux Award no. N00014-02-WX-20834 to the Naval
estimates should be very useful for comparison Research Laboratory. This research was in part
with future calculations of the energy loss by performed while the first author held a National
internal tide generation or/and turbulent mixing in Research Council Research Associateship Award
the Strait. Our model results show that the diurnal at Naval Research Laboratory. This work is Naval
constituents have one major source of energy, the Research Laboratory contribution no. NRL/JA/
advective flux from the Gulf of Aden. In contrast, 7320/04/0010.
two comparable sources of energy are identifiedfor the M 2, and K2 constituents: one is theadvective flux from the Gulf of Aden and another Referencesis the flux from the Red Sea proper. The latterfluxes for both tidal components are directly Blain, C.A., Rogers, W.E., 1998. Coastal Tide Prediction Usingthe ADCIRC-2DDI Hydrodynamic Finite Element Model:generated in the Red Sea by the equilibrium tides. Model Validation and Sensitivity Analyses in the Southern
For the N2 and S2, the major flux comes from the North Sea/English Channel. Formal Report NRL/FR/
Gulf of Aden. Furthermore, very small fluxes from 7322-98-9682. Naval Research Laboratory, Stennis Space
the Strait to the adjacent basins indicate that the Center, MS 92pp.
Strait is a very dissipative environment. Almost all Brink, K.H., 1995. Tidal and lower frequency currents aboveFieberling Guyot. Journal of Geophysical Research 100,
tidal energy, 85% or more for all considered cases, 10,817-10,832.is lost within the Strait. The distribution of the rate Davies, A.M., Kwong, S.C.M., Flather, R.A., 1997. A three-
of energy dissipation due to bottom friction dimensional model of diurnal and semi diurnal tides on the
implies that the major area of dissipation is European shelf. Journal of Geophysical Research 102,
located between Perim Narrows and the Assab- 8625-8656.
Mocha line. Defant, A., 1961. Physical Oceanography. Pergamon Press,Oxford 598pp.
In conclusion, the model results presented here Foreman, M.G.G., 1977. Manual for tidal heights analysis and
and analyses of the available observations (Ver- prediction. Pac. Mar. Sci. Rep. 77-10. Institute of Ocean
celli, 1925, 1927; Siedler, 1969; Jarosz, 2002) have Sciences, Patricia Bay, BC, Canada 101pp.
significantly improved our understanding of the Foreman, M.G.G., 1978. Manual for Tidal Currents Analysis
tidal frequency motion and its importance for the and Prediction. Pac. Mar. Sci. Rep. 76-6. Institute of OceanSciences, Patricia Bay, BC, Canada 70pp.
observed circulation in the Bab el Mandab Strait; Foreman, M.G.G., Walters, R.A., Henry, R.F., Keller, C.P.,
however, they have also brought to light several Dolling, A.G., 1995. A tidal model for eastern Juan de Fuca

E Jarosz et at. / Continental Shelf Research 25 (2005) 1225-1247 1247
Strait and the southern Strait of Georgia. Journal of Schwiderski, E.W., 1980. On charting global ocean tides.Geophysical Research 100, 721-740. Reviews in Geophysics 18, 243-268.
Gill, A.E., 1982. Atmosphere-Ocean Dynamics. Academic Siedler, G., 1969. On the fine structure of density and currentPress, New York 662pp. distribution and its short-time scale in different areas.
Grenier, R.R., Luettich, R.A., Westerink, J.J., 1995. A Progress in Oceanography 5, 81-94.comparison of the nonlinear frictional characteristics of Smeed, D., 1997. Seasonal variation of the flow in the Strait oftwo-dimensional and three-dimensional models of a shallow Bab el Mandeb. Oceanologica Acta 20, 773-781.tidal embaymcnt. Journal of Geophysical Research 100, Thompson, E.F., 1939. Chemical and physical investigations.13,719-13,735. The exchange of the water between the Red Sea and the
Hendershott, M.C., 1981. Long waves and ocean tides. Gulf of Aden over the "Sill". John Murray ExpeditionEvolution of Physical Oceanography. MIT Press, Cam- 1933-34, Scientific Reports, vol. 2, 105pp.bridge, MA, pp. 292-341. Tsimplis, M.N., Proctor, R., Flather, R.A., 1995. A two-
International Hydrographic Organization (IHO), Tidal Con- dimensional tidal model for the Mediterranean Sea. Journalstituent Bank, 1979. Station Catalogue. Ocean and Aquatic of Geophysical Research 100, 16,223-16,239.Sciences, Dept. of Fisheries and Oceans, Ottawa, Canada. Vercelli, F., 1925. Richerche di oceanografia fisica eseguite della
Jarosz, E., 2002. Tidal dynamics in the Bab el Mandab Strait. R. N. AMMIRAGILIO MAGNAGHI (1923-24), Part I,Ph.D. thesis, Louisiana State University, Baton Rouge, Correnti e mare. Annali Idrografici 11, 1-188.Louisiana. Vercelli, F., 1927. Richerche di oceanografia fisica eseguite
Kolar, R.L., Gray, W.G., Westerink, J.J., Luettich, R.A., 1994. della R. N. AMMIRAGILIO MAGNAGHI (1923-24),Shallow water modeling in spherical coordinates: equation Part IV, La temperatura e la salinita. Annali Idrografici 11,formulation, numerical implementation, and application. 1-66.Journal of Hydraulic Research 32, 3-24. Vercelli, F., 1931. Le Nuove recherche sulli correnti marine nel
Kowalik, Z., Polyakov, I., 1998. Tides in the Sea of Okhotsk. Mar Rosso. Annali Idrografici 12, 1-74.Journal of Physical Oceanography 28, 1389-1409. Wahr, J., 1981. Body tides on an elliptical, rotating, elastic and
Kowalik, Z., Proshutinsky, A.Y., 1993. Diurnal tides in the oceanless Earth. Geophysical Journal of Royal Astronom-Arctic Ocean. Journal of Geophysical Research 98, ical Society 64, 677-703.16,449-16,469. Walters, R.A., 1987. A model for tides and currents in the
Le Provost, C., Genco, M.L., Lyard, F., Vincent, P., Canceil, English Channel and southern North Sea. Advances inP., 1994. Spectroscopy of the world ocean tides from a finite Water Resources 10, 138-148.element hydrodynamics model. Journal of Geophysical Walters, R.A., Werner, F.E., 1989. A comparison of twoResearch 99, 24,777-24,797. finite element models of tidal hydrodynamics using a
Luettich, R.A., Westerink, J.J., Scheffner, N.W., 1992. AD- North Sea data set. Advances in Water Resources 12,CIRC: an advanced three-dimensional circulation model for 84-93.shelves, coasts and estuaries, Report 1: theory and Werner, F.E., Lynch, D.R., 1987. Field verification of wavemethodology of ADCIRC-2DDI and ADCIRC-3DL. equation tidal dynamics in the English Channel andDredging Research Program Technical Report DRP-92-6, southern North Sea. Advances in Water Resources 10,US Army Engineers Waterways Experiment Station, 115-130.Vicksburg, MS, 137pp. Westerink, J.J., Luettich, R.A., Baptista, A.M., Scheffner,
Lynch, D.R., Gray, W.G., 1979. A wave equation model for N.W., Farrar, P., 1992. Tides and storm surge predictionsfinite element tidal computations. Computers and Fluids 7, using a finite element model. Journal of Hydraulic207-228. Engineering 118, 1373-1390.
Munk, W., 1997. Once again: once again-tidal friction. Westerink, J.J., Blain, C.A., Luettich, R.A., Scheffner, N.W.,Progress in Oceanography 40, 7-35. 1994. ADCIRC: an advanced three-dimensional circulation
Murray, S.P., Johns, W., 1997. Direct observations of seasonal model for shelves, coasts and estuaries; Report 2: usersexchange through the Bab el Mandab Strait. Geophysical manual for ADCIRC-2DDI. Dredging Research ProgramResearch Letters 24, 2557-2560. Technical Report DRP-92-6, US Army Engineers Water-
Naval Oceanographic Office (NAVOCEANO), 1997. Data base ways Experiment Station, Vicksburg, MS, 156pp.description for Digital Bathymetric Data Base-Variable Westerink, J.J., Stolzembach, K.D., Connor, J.J., 1989. GeneralResolution (DBDB-V), Version 1.0. Internal Report, Naval spectral computations of the nonlinear shallow water tidalOceanographic Office, Stennis Space Center, MS. interactions within the Bight of Abaco. Journal of Physical
Pugh, D.T., 1987. Tides, Surges and Mean-Sea Level. Wiley, Oceanography 19, 1350-1373.New York 486pp. Zimmerman, J.T.F., 1978. Topographic generation of residual
Reid, R.O., Herbich, J. (Eds.), 1990. Handbook of Coastal and circulation by oscillatory (tidal) current. Geophysical andOcean Engineering. Gulf Publishing, Houston, TX. Astrophysical Fluid Dynamics 11, 35-47.

REPORT DOCUMENTATION PAGE Form ApprovedI OMB No. 0704-0188
.The public reporting burden for this collection of information is estimated to average 1 hour per response, including the time for reviewing instructions, searching existing data sources,00thering and maintaining the data needed, and completing and reviewing the collection of information. Send comments regarding this burden estimate or any other aspect of this collection ofrnformatlon, Including suggestions for reducing the burden, to the Department of Defense, Executive Services and Communications Directorate (0704-0188). Respondents should be awaretbat ppwtithstanding any other provision of law, no person shall be subject to any penalty for failing to comply with a collection of information if it does not display a currently valid OMBcqourol number.PLEASE DO NOT RETURN YOUR FORM TO THE ABOVE ORGANIZATION..1. REPORT DATE (DD-MM-YYYY) 2. REPORT TYPE 3. DATES COVERED (From - To)
07-06-2006 Journal Article (refereed)
4. ý TITLE AND SUBTITLE 5a. CONTRACT NUMBER
4arotropic Tides in the Bab el Mandab Strait--Numerical Simulations
5b. GRANT NUMBER
5c. PROGRAM ELEMENT NUMBERPE0601153N
6, AUJTHOR(S) 5d. PROJECT NUMBERg, JarQsz, C.A. Blain, S.P. Murray, M. Inoue
5e. TASK NUMBER
5f. WORK UNIT NUMBER
Pf, pERFORMING ORGANIZATION NAME(S) AND ADDRESS(ES) 8. PERFORMING ORGANIZATION
NaalI Research Laboratory REPORT NUMBER
Oceanography Division NRL/JA/7320-04-0010Stenni4 Space Center, MS 39529-5004
9, .SPONSORING/MONITORING AGENCY NAME(S) AND ADDRESS(ES) 10. SPONSOR/MONITOR'S ACRONYM(S)
Office of Naval Research ONR800 N, Quincy St.Arlington, VA 22217-5660 11. SPONSOR/MONITOR'S REPORT
NUMBER(S)
'12 DIPTRIBUTION/AVAILABILITY STATEMENT
Approved for public release, distribution is unlimited.
i3., SUPPLEMENTARY NOTES
14. ABSTRACTA ;-dimensional barotropic finite element model with the grid resolution varying between 0.2 & 2 km & forced by 8 principle constituents (Q,, 0,, P,, K,, N2, M2, S,,
wa K) wits used to compute tidal elevations & currents in the Bab el Mandab Strait. Good agreement is achieved with the available observations for both diurnal &semidiumal tidal currents & diurnal elevations; however, the model performs less satisfactorily for the semidiurnal elevations mainly due to the errors between theobservcd & computed phases in the region where there are amphidromie points for the M,, S, & N, constituents in the Strait. The results indicate that the largestamplitudes of the tidal elevations & the strongest currents are present in the southern part of the Strait. Residual circulation induced by the barotropic tides is rather,weak in the major part of the Strait, & its contribution to the Red Sea water transport is small. The model results also show that barotropic energy fluxes are not verylarge & their direction depends on the constituent. All diumnal & one semidiumal (N,) constituent have one major source of energy, which is the flux from the Gulf ofAden, while there are two sources of energy for the MA, S. & K, components: one from the Gulf& another from the Red Sea. Very small energy fluxes from the$trait to the adjacent basins indicate that almost all tidal energy is dissipated within the Strait. The distribution of the rate of energy dissipation due to the bottomfi.rition Implies that the major area of dissipation is located between Perim Narrows & the Assab-Mocha line.
15. "UBJECT TERMS
Barotrmpic tides; Bab el Mandab Strait; Numerical model; Residual circulation; Tidal energy flux
16. SEWURITY CLASSIFICATION OF: 17. LIMITATION OF 18. NUMBER 19a. NAME OF RESPONSIBLE PERSON"- .REPORT b. ABSTRACT c. THIS PAGE ABSTRACT OF Cheryl Ann BlainPAGES
Unclassified Unclassified Unclassified UL 23 19b. TELEPHONE NUMBER (Include area code)
(228) 688-5450
Standard Form 298 (Rev. 8/98)Prescribed by ANSI Std. Z39.18