banking sector - ey · to cover credit risk. ... 7data not available at time of preparation of the...
TRANSCRIPT

Issue 4, May 2016
Banking Sector Dynamics
Contents
At a glance 1
Capital adequacy 2
Total assets 6
Total liabilities and deposits 8
Abbreviations 14
References 14
Definitions 14
At a glanceComfortably beating expectations, Cyprus officially exited the troika-funded Economic Adjustment Programme at the end of March 2016. The economy recorded small positive growth in 2015, a full year ahead of forecasts. Strongly correlated with the upturn in the economy, the banking sector also recorded significant progress, with both capital positions and liquidity improving.
The very high levels of non-performing exposures (NPEs) remain the main challenge of the sector. Enhanced legislative tools facilitating the restructuring of NPEs are now in place (including the foreclosure and insolvency framework) and several major NPE restructuring deals have been achieved over the last few months. Additionally, two of the main sectors plagued with NPEs (real estate and construction) have shown positive signs of exiting a long period of recession.
Since the beginning of the year, total deposits increased marginally by 0.37%. The deposit outflows after March 2013 had resulted in a 27.8% decrease in total bank deposits in the period leading to December 2015. Meanwhile, the deleveraging in the sector continues, as total loans decreased by 10.8% during the same period. Encouragingly BOC, HB and the Coops reported profits for the first quarter of 2016. In a trading update, BOC reported that they expect decreases in their NPEs and profits of €50m, while the Coops also expect a decrease in their NPEs and profits of €27.5m. Hellenic Bank reported a profit of €0.3m and a QoQ decrease of 0.9% in their NPEs.

2 | Banking Sector Dynamics May 2016
Capital adequacyBanks in Cyprus currently maintain healthy capital adequacy ratios. As of the end of 2015, BOC, Coops, HB, Eurobank Cyprus and Alpha Bank Cyprus (ABCY) were all well capitalised, as measured by their Common Equity Tier 1 (CET1) ratios. The BOC CET1 ratio stood at 14.0%. The CET1 ratio of the Cooperative Central Bank increased from 12.01% in 3Q2015 to 15.6% in 4Q2015.
The additional capital raised through the €20m investment in HB in October 2015, strengthened the CET1 ratio of the Bank to 14.8% as at the end of 2015, up by 1% compared to the 3Q2015 figures. At the same time, the CET1 ratio of Eurobank Cyprus and Alpha Bank Cyprus stood at 27.1% and 17.5% respectively, well above the minimum CET1 ratio of 8% as set by the Central Bank of Cyprus.
Source: BOC, CBC, Coops, HB
CET1 ratios
Coops
HB
BOC
30/09/2
015
30/06/2
015
31/03/2
015
31/12/2
014
30/09/2
014
30/06/2
014
31/03/2
014
31/12/2
015
CBC minimum requirement
Banking sector average
%
0
5
10
15
20
Source: BOC, HB
HB BOC
Shareholder % Shareholder %
Wargaming Public Company Ltd
24.8Cyprus Popular Bank Public Company Ltd
9.6
CPB FBO Third Point Hellenic Recovery Fund
26.2Lamesa Holding S.A. (Renova Group affiliate)
7.2
Demetra Investments Ltd 10.0 TD Asset Management 5.2
EBRD 5.4 EBRD 5.0
Major shareholders of HB and BOC
The overall contained level of financial system stress in the euro area during 2015 reflected an improving real economic outlook supported by ECB action allaying deflation fears that threatened to be harmful to both price and financial stability. (ECB, April 2015)

3Banking Sector Dynamics May 2016 |
Funding needs of the Cypriot banksThe funding needs (total loans minus total deposits) of Cypriot banks increased considerably between 2012 and 2015, from €2b in September 2012 to €16.3b in December 2015. The total loans of the banking system decreased from €70.4b in March 2013 to €62.8b in December 2015 (-€7.6b or -10.8%).
-10-505
101520
20152014201320122011201020092008
€b
Source: CBC
Selected Indicators
2010 2011 2012 2013 2014 2015
Liquidity
Cash and trading assets (% of total assets) 6.9 6.6 6.0 5.1 11.4 16.0
Profitability
Operating profits1 (% of total assets) 1.3 1.4 1.2 1.3 2.1 1.8
Impairment (% of total assets) (0.5) (4.9) (4.6) (3.9) (1.9) (2.3)
Efficiency
Cost to income ratio (%) 49.9 49.5 55.6 53.4 40.4 44.2
1 Profit before provisions and impairments. Year end results unless otherwise stated
Source: CBC, EC
Key banking sector indicatorsFor the full year 2015, BOC reported an after tax loss of €438m, mainly attributed to the provisions of impairment of customer loans (€959m), while HB posted a profit of €13m. HB reported €100.8m in impairment losses and provisions to cover credit risk. In the same period, the Coops registered losses of €166m, also as a result of increased provisions for impairment of loans and advances. Coops cumulative provisions increased to €3,486m compared to €2,968.5m at the end of 2014. Alpha Bank Cyprus also recorded losses of €44.7m for 2015, compared to losses of €83.1m in 2014. The bank had reported quarterly profits for the third (€8.3m)
quarter and losses (€37.9m) for the fourth quarter of the year. Eurobank Cyprus reported FY15 profits of €39.1m, after tax.
Piraeus Bank (Cyprus) Ltd registered losses of €9.3m, down by 70% compared to those of the previous year (€30.8m). Provisions decreased dramatically compared to the previous year (YE2015: €24.4m, YE2014: €43.7m).
Based on the year end results of 2014, the National Bank of Greece reported after tax profits of €6.5 m.

4 | Banking Sector Dynamics May 2016
Net interest incomeAs at December 2015, the net interest income to total assets ratio, a key profitability ratio, stood at 0.66%, 45.2% higher than in March 2013 (0.45%), following a 8.5% increase in net interest income and 25.3% fall in total banking assets in the period.
%
0.4
0.5
0.6
0.7
0.8
Dec
-15
Jun-
15
Dec
-14
Jun-
14
Dec
-13
Jun-
13
Dec
-12
Jun-
12
Dec
-11
Jun-
11
Local authorised institutions operating in CyprusYear ended 2015 results (or latest available)
(€m) BOC1 Coops HB1 RCB Bank Ltd2
Total assets 23,127 14,307 7,397 8,030
Net loans 17,192 9,312 3,093 7,026
Deposits 14,181 12,744 6,139 7,290
Accumulated provisions 5,445 3,486 1,303 19
Profit/loss after tax (438) (166) 13.0 34
NPEs 13,968 7,602 2,602 45
Key performance ratios (%) BOC Coops HB RCB Bank Ltd
NPEs (% of gross loans) 61.8 59.3 59.2 0.6
Net loans/deposits 121.0 73.1 50.4 96.4
CET13 14.0 15.6 14.8 20.9
Cost/Income4 40.0 49.0 59.0 n/a7
Coverage ratio of NPEs5 39.0 45.9 50.1 n/a
Cost of risk (annualised) 4.3 n/a 2.3 n/a
Net interest margin6 3.8 2.3 2.0 n/a1Ignoring classification as disposal group held for sale. 2For RCB Bank Ltd calculated as total qualifying tier 1 capital over risk-weighted assets. 3The minimum Common Equity Tier 1 capital ratio, under the relevant directives of the European Parliament and Council, is set at 8% (Pillar 1 Capital requirements) by the CBC (Capital Requirements Directive No.2013/36/EU (CRD IV) and the Capital Requirements Regulation No.575/2013 (CRR)). HB is subject to additional capital requirements (Pillar II add-ons) for risks which are not covered by the Pillar I capital requirements. HB and BOC must maintain on a consolidated basis and on an ongoing basis, an overall CET1 ratio of 11,25% and COOPs a CET1 ratio of 12.25% as per the European Central Bank’s notification dated 20 November 2015. 4The ratios for BOC and HB are reported in the financial statements for YE2015. For the COOPs, the ratio was calculated as Total Operating Expenses/Total Operating Income, as reported in the financial statements for YE2015. 5Different banks may follow different policies with respect to the presentation of interest income on impaired loans, which may result in this ratio not being directly comparable. 6The NIM for BOC and HB are reported in the financial statements for YE2015. For the COOPs, the NIM was calculated as Net Interest Income/Total Assets, as reported in the financial statements for YE2015. 7Data not available at time of preparation of the report.
Source: BOC, CCB, HB, RBC Bank Ltd
Nominal euro area interest rates are now at historical lows, with the interest rate on the main refinancing operations close to 0% and the deposit facility rate in negative territory. Over the past year and a half the euro area yield curve has moved downwards and become flatter. (ECB, April 2015)

5Banking Sector Dynamics May 2016 |
Foreign authorised institutions and branches of foreign credit institutions
Year ended 2015 results (or latest available)
ABCY Eurobank Cyprus Ltd National Bank of Greece (Cyprus) Ltd1
Piraeus Bank(Cyprus) Ltd
2,589 4,132 1,742 1,045
2,037 1,897 834 635
1,852 3,241 789 959
798.2 67 164 147.7
(44.7) 39.1 6.5 (9.3)
1,735 129 562 388
ABCY Eurobank Cyprus Ltd National Bank of Greece (Cyprus) Ltd
Piraeus Bank(Cyprus) Ltd
61.2 6.8 56.3 47.8
110.0 58.5 105.7 66.2
17.5 27.1 17.9 17.5
57.5 28.0 42.9 63.8
46.0 50.0 29.2 38.1
3.18 0.6 1.2 3.0
(€m)
Total assets
Net loans
Deposits Accumulated provisions
Profit/loss after tax
NPEs2
Key performance ratios (%)
NPEs2/Gross loans
Net loans/deposits
CET13
Cost/Income4 Coverage ratio of NPEs5
Cost of risk (annualised)
Net interest margin6 2.8 1.5 2.4 2.71Figures for National Bank of Greece are based on YE2014 results. 2NPLs for Alpha Bank Cyprus and Piraeus Bank (Cyprus Ltd). 3The CET1 ratio for Piraeus Bank Ltd is for
the group.
4The ratios for National Bank of Greece and Eurobank Cyprus are reported in the financial statements. For ABCY and Piraeus Bank the ratio was calculated as Total Operating
Expenses/Total Operating Income, as reported in the financial statements for YE2015. 5Different banks may follow different policies with respect to the presentation of
interest income on impaired loans, which may result in this ratio not being directly comparable. 6The Net Interest Margin (NIM) for National Bank of Greece is reported in
the financial statements. For ABCY, the NIM was calculated as Net Interest Income/Total Assets, as reported in the financial statements for YE2015.
Source: ABCY, Eurobank Cyprus Ltd, National Bank of Greece (Cyprus) Ltd, Piraeus Bank (Cyprus) Ltd
and other assets (-€0.5b), while the cash and cash equivalents and available for sale financial investments increased by €2.7b and €0.6b respectively. According to the Memorandum of Understanding on Specific Economic Conditionality (MoU) signed with the Troika in March 2013, the size of the Cypriot domestic banking sector (as a ratio to GDP), excluding branches and subsidiaries of foreign banks in Cyprus, will need to reach the EU average of around 3 times of the country’s GDP by 2018.
The deleveraging continuesThe Cypriot banking sector remains large, especially when seen in relation to the country’s GDP. The total assets to GDP ratio remains higher than the EU-28 and euro area average. At 31 December 2015, the bank assets to GDP ratio is about half of its peak of 808% in 2010 despite decreasing over the period December 2014 to December 2015 by 15.6%. The decrease in total assets during 2015 resulted from decreased loans and receivables (-€2.9b) as well as from a decrease in held-to-maturity investments (-€2.3b),
Emergency Liquidity Assistance (ELA)Following the upgrade by Moody’s of the BOC covered bonds credit rating to Baa3 from B1, the bank became eligible for Eurosystem credit operations (Moody’s Investors Service, 29 September 2015). Therefore, the bonds have been placed as collateral for accessing funding from the ECB and BOC has since raised a total of €550m for the repayment of ELA. BOC was able to repay a total of €1,6b of ELA funding post September 2015, reducing its exposure to €3.3b by December 2015, ELA decreased by €7.9b (-69.3%) from its peak levels of €11.4b in April 2013. The ELA held by the Cypriot banking system as a whole decreased to €3.8b by December 2015, down by 48.65% or €3.6b YoY. On May 26, 2016, BOC announced the intention to fully repay ELA within 2017.

6 | Banking Sector Dynamics May 2016
Total assets
Assets to GDP ratio
GDP€b % of GDP
0
50
100
150
200
0
200
400
600
800
1000
201520142013201220112010
Source: CBC, Eurostat
Other assets
Available for sale financial assets
Held-to-maturity investments
Loans and receivables
Cash and cash equivalents
0
20
40
60
80
100
120
140
160
201520142013201220112010
€m
Asset growth
Source: CBC
Total assetsBOC, Coops and HB continue to hold more than 50% of the total assets of the Cypriot banking system. The total assets of the banking sector on 31 December 2015 stood at €73.2b. Out of BOC’s total assets, which represent 32% (23.3b) of total banking system total assets, 73.9% (€17.2b) were net loans and advances granted to customers. For the same period, HB held 10.1%
Total assets2
(€7.4b) of the total assets of the banking system, with 41.8% (€3.1b) of those being net loans and advances. Coops held 19.6% (€14.3b) of the total assets of the banking system and 65.1% (€9.3b) of these were customer loans and advances. Importantly, total net loans decreased significantly compared to the 2014 results mainly as a result of high impairment charges during 2015.
2Aggregate data for all local and foreign banks operating in Cyprus, including the Coops.

7Banking Sector Dynamics May 2016 |
Loans to GDP ratioThe total loans as at December 2015 recorded a slight increase of 1.93% compared to December 2014, reaching €62.8b. This resulted in an increase in the total loans to GDP ratio from 349% to 360%, which is still lower than the 2013 high of 370%.
Assets in the banking system (as at 31/12/2015)
Source: CBC, BOC, HB
HB 10.1%
Coops 14.3%
All Others 43.8% BOC 31.8%
HB 6.0%
Coops 17.5%
All Others 45.6% BOC 30.9%
Total loans (% of total loans of the consolidated banking system)Total assets (% of total assets of the consolidated banking system)
Total loans and loans to GDP ratio
Source: Eurostat, CBC, CyStat
Total loans
0
100
200
300
400
Loans to GDP ratio
€b % of GDP
0
20
40
60
80
2015
2014
2013
2012
2011
2010
2009
2008
8 | Banking Sector Dynamics May 2016
Total liabilities and deposits At the end of 2015, BOC accounted for 30.4% (€20.2b) of the total liabilities of the sector, with its total deposits accounting for 21.4% (€14.2b) of the sector’s total liabilities. At the same time, the Coops and HB accounted for 19.6% (€13b) and 9.9% (€6.6b) of the total sector liabilities respectively. Customer deposits accounted for 98% (€12.7b) of the total liabilities of the Coops, 93.4% (€6.1b) of the total liabilities of HB and 70.0% (or €14.2b) of the total liabilities of BOC (16.3% (or €3.3b) of the total liabilities of BOC was the ELA funding).
Since March 2013, the total amount of deposits in the Cypriot banking system decreased by 27.9%. On a monthly basis, the first positive deposit inflow was recorded in April 2014 (0.4%). As of December 2015, the total amount of deposits in the Cypriot banking system was €46b, down by €1.5b compared to November 2015 (0.3% YoY). The monthly decrease is mainly attributed to the decrease in deposits by non-EU residents (€1.3b), while deposits by domestic residents fell by €0.02b and deposits by other euro area residents fell by €0.1b.
As at YE2015, HB recorded a Net Loan-to-Deposit ratio (LTD) of 50.4% down from 50.8% at YE2014. Both net lending to customers and deposits decreased by 4% and 3.3% respectively compared to YE2014. For the same period, the LTD ratio of BOC decreased to 121.2% (YE2014:141.5%). The decrease is a result of both a decrease in loans (-7.7%) and an increase in deposits (7.7%). A similar pattern was observed for the LTD ratio of the Coops: loans decreased by 8% and deposits increased by 2.8% resulting in a decrease in the LTD ratio from 81.7% (YE2014), to 73.1% (YE2015).
Loans to households and businesses
Source: CBC, Eurostat
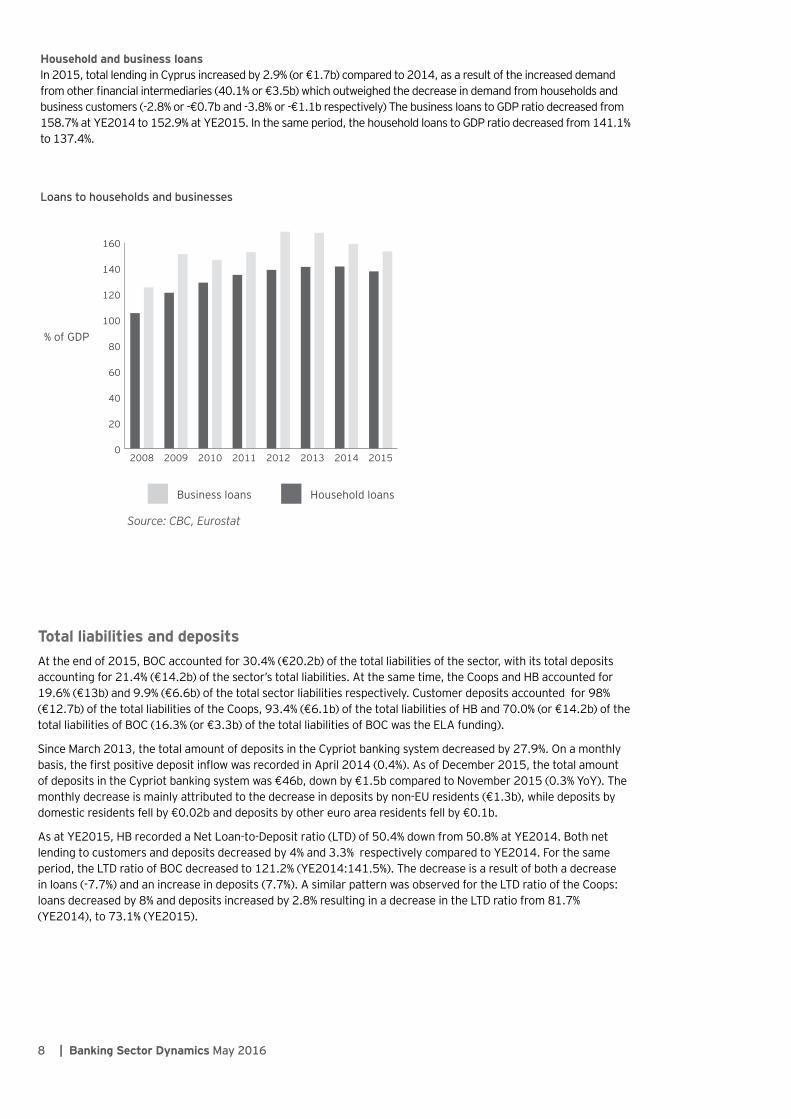
Household and business loansIn 2015, total lending in Cyprus increased by 2.9% (or €1.7b) compared to 2014, as a result of the increased demand from other financial intermediaries (40.1% or €3.5b) which outweighed the decrease in demand from households and business customers (-2.8% or -€0.7b and -3.8% or -€1.1b respectively) The business loans to GDP ratio decreased from 158.7% at YE2014 to 152.9% at YE2015. In the same period, the household loans to GDP ratio decreased from 141.1% to 137.4%.
0
20
40
60
80
100
120
140
160
20152014201320122011201020092008
% of GDP
Business loans Household loans

9Banking Sector Dynamics May 2016 |
Deposit and lending ratesDeposit interest rates in December 2015 were 1.54% and 1.49% for households and businesses respectively. This represents an annual drop of 109 basis points (bps) for household rates and 104 bps for business rates. The lending rates for consumer credit fell by 105 bps from December 2014 to reach 4.56% in December 2015, while the lending rates for businesses for amounts up to €1.0m fell by 98 bps over the same period, reaching 4.68%. The deposit-lending rate spreads remain at relatively high levels–the Cypriot business lending rates remain the highest in the euro area, without adjusting for country specific credit risk.
Net Loan-to-Deposit ratio (LTD)
Source: BOC, HB, CBC
020406080
100120140160
CoopsHBBOC
YE20151H2015YE2014
1H2014YE20131H2013
%
0
10
20
30
40
All othersHBCoopsBOC
Total liabilities (% of the total liabilities of the consolidated banking sector)
Total deposits (% of the total liabilities of the consolidated banking sector)
%
Total liabilities (as at 31/12/2015) Liabilities by bank (as at 31/12/2015)
Source: BOC, HB, CCB, CBC
0
5
10
15
20
25
HBCoops*BOC
Amounts due to banks
Repurchase agreements
Funding from Central Banks Other liabilities
Customer deposits
€b
Since June 2014 banks have been passing on the decline in their funding costs to their customers in the form of lower lending rates, which reached historical lows in the second half of 2015. (ECB, April 2015)

10 | Banking Sector Dynamics May 2016
**
NPEs in non-financial corporations (as at 31/12/2015)
Source: CBC
Non-performing loansFollowing the introduction of the new NPLs definition by the European Central Bank in December 2014, the so-called non-performing exposures (NPEs), fell from 47.5% (€28.4b) to 45.4% (€27.3b) of the total credit facilities granted by banks as at YE2015. NPEs related to credit facilities granted to corporations were €13.8b (or 50.7% of the total), while those granted to private individuals were €12.7b (or 46.6% of the total). The remaining 2.7% (or €0.76b) are NPEs related to credit facilities granted to other financial corporations (€0.71b) and the general government (€0.05b)
A large proportion of the NPEs can be attributed to the property development and construction sectors. As at December 2015, NPEs related to facilities provided to the construction sector represented 19.7% of the total loans given to corporations, or €4.9b (18% of the total NPEs). In 2015, NPE’s related to the construction sector appear to have peaked in Q115 and have been slightly decreasing since (2Q2015:-2.19% QoQ, 3Q2015: -0.16% QoQ, 4Q2015: -2.45% QoQ or -4.21% YoY). Encouragingly,investment in the construction sector in 3Q2015 grew for thefirst time in seven years (3Q2015: 1.6% YoY, 3Q2008: 7.7% YoY).Also, demand in the real estate sector, as measured in terms oftitle deeds and total transfers of sale registered at the Departmentof Lands and Surveys grew by 9.4% and 22% YoY respectively in2015. Taken together with the positive growth outlook for theCypriot economy, the data suggest that NPE restructuring could beset to accelerate.
Dec-
15
Nov
-15
Oct
-15
Sep-
15
Aug-
15
Jul-1
5
Jun-
15
May
-15
Apr-
15
Mar
-15
Feb-
15
Jan-
15
Dec-
14
€b
25
26
27
28
29
30
NPEs in the Cypriot banking system
Others
Professional, scientific andtechnical services
Real estate activities
Retail trade
Construction
4.6%
35.6%
16.5%17.2%
26.2%
A high level of non-performing loans in countries strongly affected by the euro area strains (such as Cyprus, Greece, Ireland, Italy, Portugal, Slovenia and Spain) has dampened profitability prospects. Such a constellation could hinder banks’ ability to provide new credit to the real economy. (ECB, November 2015)

11Banking Sector Dynamics May 2016 |
NPEs by bankA breakdown of the NPEs by bank as of the end of December 2015 shows that BOC accounts for 51.2% of the total NPEs of the Cypriot banking system (€14b), down by €1b compared to 2014 (€15b). In contrast, total NPEs increased for both the Coops and HB over the same period. The total NPEs of the Coops increased by €0.29b reaching €7.6b in December 2015 while at the same time the NPEs of HB increased by €0.05b, reaching €2.6b. The loan portfolio of Eurobank Cyprus, stayed relatively stable for the period, as the NPEs of the bank increased by €0.006b, while the NPEs of ABCY decreased by €0.24b for the period.
As at 31 December 2015, the accumulated provisions for BOC were €5.4b, those of HB €1.3b, and those of the Coops and ABCY €3.5b and €0.8b respectively.
NPEs in the Cypriot banking system (as at 31/12/2015)
Eurobank
51.2%
9.5%
6.4%4.6%0.5%
27.8%
Others
Eurobank
ABCY*
Coops
HB
BOC
0
5
10
15
20
25
30
Eurobank Cyprus**
ABCYHBCoopsBOC
€b
Gross loans Accumulated provisions
Accumulated provisions
Accumulated provisions as a fraction of total gross loans (as at 31/12/2015)
Source: BOC, HB, CCB, ABCY, Eurobank Cyprus
*Non-performing loans for ABCY**As at 30/06/2015 for Eurobank Cyprus

12 | Banking Sector Dynamics May 2016
1The percentage of balances of sustainable solutions proposed during the quarter in relation to the borrowers with loans exhibiting arrears of over 90 days at the beginning of the quarter. 2The percentage of the balances of sustainable solutions concluded during the quarter in relation to the borrowers with loans exhibiting arrears of over 90 days at the beginning of the quarter. 3The percentage of the balances of solutions concluded from 1/1/2014 up to the end of the previous quarter which exhibited arrears of less than 8 days at the end of the reporting quarter. 4The percentage of the amount of loans that presented early arrears (i.e. 31-90 days in arrears) at the beginning of the reporting quarter which were cured during the quarter (i.e. presenting no arrears at the end of the reporting quarter) by (i) being restructured with a sustainable repayment schedule and (ii) other effective means.
2015
June Sept Dec
Proposed sustainable solutions rate1
Target n/a 9.42 12.46
Actual 6.14 6.28 13.26
Concluded sustainable solutions rate2
Target n/a 7.45 11.64
Actual 4.69 6.53 13.01
Terms-being-met rate3
Target n/a 66.49 72.88
Actual 65.80 68.20 69.92
Aggregate early-arrears cure rate4
Target n/a 27.82 40.00
Actual 28.14 31.22 38.61
Banking system loan arrears resolution targetsThe latest data reported by the banks regarding the loan arrears resolution targets set by the CBC* indicate that overall targets have been met.
The CBC has established targets regarding the resolution of loan arrears, aimed at incentivising banks to increase the volume and improve the quality of restructurings for loans presenting arrears over 90 days but also to take proactive action for the loans presenting arrears over 30 days to prevent them from becoming non-performing. The targets comprise four indicators that need to be applied to the whole loan portfolio and to sub-portfolios (residential mortgage loans to households, other loans to households, loans to non-financial corporations with total balances of up to €1m and loans to non-financial corporations with total balances of over €1m).
Indicator 1 Indicator 2 Indicator 3 Indicator 4
Proposed sustainable solutions as a percentage of the loans presenting arrears over 90 days.
Concluded sustainable solutions as a percentage of the loans presenting arrears over 90 days.
Loans that have been restructured and present arrears of less than 8 days as a percentage of the total loans which have been restructured.
Loans that presented arrears of 31 to 90 days at the beginning of the quarter but by the end of the quarter do not present any arrears (due to restructuring or other measures taken by the bank) as a percentage of the loans that presented arrears of 31 to 90 days at the beginning of the quarter.

13 | Banking Sector Dynamics May 2016
DevelopmentsPSPP eligibility of regional and local government bonds, implications for CyprusOn 3 December 2015, the Governing Council of the ECB decided that euro-denominated marketable debt instruments issued by regional and local governments located in the euro area would become eligible for regular public sector purchase programme (PSPP) purchases by the respective national central banks. This decision referred only to those regional and local bonds that meet all other eligibility criteria, in particular the minimum rating requirement as stated in the European Central Bank (ECB) Decision on a secondary markets public sector asset purchase programme (Decision ECB/2015/10). Expanding the set of securities eligible for PSPP purchases by adding regional and local government bonds further enhanced the flexibility of the programme, thereby supporting the continued smooth implementation of purchases. Purchases of such securities under the PSPP started in early 2016, after the relevant legal acts had been amended.
In order to be eligible for purchases under the PSPP, securities need to have a rating of at least credit quality step 3 in the Eurosystem’s harmonised rating scale, as laid down in Decision ECB/2015/10. In line with these rules, purchases of securities issued by central governments of euro area countries under a financial assistance programme can only be conducted if the application of the Eurosystem’s credit quality threshold has been suspended by the Governing Council. In 2015 this only applied to Cypriot government bonds, purchases of which took place during two periods: the first was from 3 to 17 July and the
second was from 6 October to 4 November. These bond purchases followed the successful conclusion of the sixth and seventh reviews of Cyprus’ EU/IMF financial assistance programme. The suspension dates marked the start of new programme reviews.
Investment fund sectorThe investment fund sector has undergone a rapid expansion since the global financial crisis amid an intense search for yield among global investors. Growth in this sector has complemented the traditional banking system and acted as an important buffer for the economy as bank credit contracted in recent years. At the same time, the potential impact on the wider financial system and real economy from adverse developments in the shadow banking sector has increased owing to its growing footprint in capital markets and stronger links within the sector as well as with other parts of the financial sector, including banks.
The shadow banking sector has become an increasingly important provider of funding to the euro area economy. However, it also represents a key source of potential risk to the stability of the euro area financial system and thus requires close monitoring. While the investment fund sector in Cyprus is still at its infancy, the introduction of the Alternative Investment Funds framework has helped increase activity and investments in the sector.
Source: BOC, HB, Moody’s Investor Service Ltd, Fitch
MOODY’S
Long-term deposit ratings Short-term deposit ratings Standalone BFSR* Date
RCB Bank Ltd B3, stable outlook NP, stable outlook BCA of b3 (stable outlook) 20/11/2015
BOC Caa3, stable outlook NP** BCA*** of caa3 28/05/2015
HB Caa2, stable outlook NP BCA of caa3 12/06/2015
Eurobank Ergasias S.A. Caa3, stable outlook NP BCA of Caa3 19/02/2016
Alpha Bank A.E. Caa3, stable outlook NP BCA of Caa3 19/02/2016
FITCH
Long-term issuer default rating
Short-term issuer default rating Viability rating Date
BOC B- B b- 25/04/2016
HB B B b 25/04/2016
Eurobank Ergasias S.A. RD**** RD f 29/06/2015
Alpha Bank A.E. RD RD f 29/06/2015
*Bank financial strength, **Not Prime, ***Baseline credit assessment ****Restricted Default
Latest credit agency ratings

14 | Banking Sector Dynamics May 2016
Abbreviations ABCY–Alpha Bank CyprusBCA–Baseline Credit Assessment BFSR–Bank Financial Strength RatingBOC–Bank of CyprusCBC–Central Bank of CyprusCCB–Cooperative Central BankCET1–Common Equity Tier 1Coops–CCB and Cooperative Credit InstitutionsCPB–Cyprus Popular BankCySEC–Cyprus Securities and Exchange CommissionEBA–European Banking AuthorityEBRD-European Bank of Reconstruction and DevelopmentECB–European Central BankEIB-European Investment BankELA–Emergency Liquidity AssistanceESM–European Stability MechanismGDP–Growth Domestic ProductHB–Hellenic BankLTD-Loan-to-Deposit RatioMid-caps – Medium-capitalisation enterprisesMoF–Ministry of FinanceMoU–Memorandum of Understanding on Specific Economic Policy ConditionalityNPEs–Non-performing exposuresNP–Not PrimeNPL–Non-performing loanQoQ–Quarter on QuarterRCB-Russian Commercial BankRD–Restricted DefaultSMEs–Small and Medium Size EnterprisesSSM–Single Supervisory MechanismSREP-Supervisory Review and Evaluation Process TROIKA–EC, ECB, IMFYE-Year end YoY–Year on YearPSPP–Public sector purchase programme
References Cyprus Banking Institutions Annual Reports 2015Central Bank of Cyprus Aggregate Cyprus Banking Sector Data, Banking System Loan Arrears Resolution Targets, Financial Stability Indicators, Monetary and Financial Statistics Monthly Financial Statements 2015European Central Bank, Annual Report, Financial Stability Review 2015Eurostat, Gross Domestic Product at Current PricesFitch Ratings Bank, Credit RatingsMoody’s, Bank Credit Ratings
DefinitionsNPLA loan is considered as non-performing when it shows arrears of more than 90 days or if has been restructured and at the time of restructuring presented arrears for a period of more than 60 days, regardless of tangible or other collateral.
NPE According to the EBA standards, a loan is considered a non-performing exposure if: (i) the debtor is assessed as unlikely to pay its credit obligations in full without the realisation of the collateral, regardless of the existence of any past due amount or of the number of days past due, for example in case of a write off, a legal action against the borrower, or bankruptcy, or (ii) the exposures are impaired i.e. in cases where there is a specific provision, or (iii) there are material exposures which are more than 90 days past due, or (iv) there are performing forborne exposures re-restructured within a 2 year probation period, or (v) there are performing forborne exposures under probation (2 years) that present more than 30 days past due after the restructuring date.

EY | Assurance | Tax | Transactions | Advisory
About EYEY is a global leader in assurance, tax, transaction and advisory services. The insights and quality services we deliver help build trust and confidence in the capital markets and in economies the world over. We develop outstanding leaders who team to deliver on our promises to all of our stakeholders. In so doing, we play a critical role in building a better working world for our people, for our clients and for our communities.
EY refers to the global organization, and may refer to one or more, of the member firms of Ernst & Young Global Limited, each of which is a separate legal entity. Ernst & Young Global Limited, a UK company limited by guarantee, does not provide services to clients. For more information about our organization, please visit ey.com.
© 2016 Ernst & Young Cyprus Ltd.All rights reserved.
This material has been prepared for general informational purposes only and is not intended to be relied upon as accounting, tax, or other professional advice. Please refer to your advisors for specific advice.
This material has been produced by Emergo Wealth Ltd.
ey.com/cy