(lf) fund of funds - eurobank fmc
TRANSCRIPT
(LF) Fund of Funds A mutual investment fund organised under the laws
of the Grand Duchy of Luxembourg
Semi-Annual Report
June 30, 2020
No subscription can be received on the basis of financial reports.
Subscriptions are only valid if made on the basis of the current
prospectus accompanied by the latest annual report and the most recent
semi-annual report, if published thereafter. Past performance is not
necessarily an indication of future performance.
RCS Number: B115125
RCSK Number: K1662
2
Table of Contents
Organisation of the Fund 3
Board of Directors of the Management Company 4
Statement of Net Assets 5
Schedule of investments
• (LF) Fund of Funds - Balanced Blend Europe 8
• (LF) Fund of Funds - Equity Blend 9
• (LF) Fund of Funds - Global Emerging Markets 10
• (LF) Fund of Funds - Balanced Blend Global 11
• (LF) Fund of Funds - ESG Focus 12
• (LF) Fund of Funds - Global Low 13
• (LF) Fund of Funds - Global Medium 14
• (LF) Fund of Funds - Global High 15
• (LF) Fund of Funds - Balanced Blend US 16
• (LF) Fund of Funds - Life Cycle 2032 17
• (LF) Fund of Funds - Life Cycle 2047 18
• (LF) Fund of Funds - Life Cycle 2042 19
• (LF) Fund of Funds - Life Cycle 2052 20
Notes to the financial statements 21

3
(LF) Fund of Funds
Organisation of the Fund
Management Company Eurobank Fund Management Company (Luxembourg) S.A. 5, rue Jean Monnet
L-2180 Luxembourg
Grand Duchy of Luxembourg
Depositary, Administrative, Registrar, Transfer, Luxembourg Paying and
Domiciliation Agent Eurobank Private Bank Luxembourg S.A.
534 Rue De Neudorf
L-2220 Luxembourg
Grand Duchy of Luxembourg
Investment Manager Eurobank Asset Management Mutual Fund Management Company S.A. 10, Stadiou Str.,
10564 Athens
Greece
Auditor PricewaterhouseCoopers, Société coopérative 2, rue Gerhard Mercator
B.P. 1443
L-1014 Luxembourg
Grand Duchy of Luxembourg
Distributor Eurobank Ergasias S.A. 8, Othonos Street
10557 Athens
Greece

4
Board of Directors of the Management Company
Mr. Theofanis Mylonas Chief Executive Officer of Eurobank Asset Management Mutual Fund Management Company S.A.,
Greece
Chairman of the Board of Directors
Mr. Agamemnon Kotrozos Head of Investments and Corporate Strategy of Eurobank Asset Management Mutual Funds
Management Company S.A.,Greece and Chief Executive Officer of Eurobank Fund Management
Company (Luxembourg) S.A., Grand Duchy of Luxembourg
Vice-Chairman of the Board of Directors
Mr. Georgios Vlachakis Managing Director of Eurobank Fund Management Company (Luxembourg) S.A., Grand Duchy of
Luxembourg
Managing Director
Mrs. Eleni Koritsa Deputy Chief Executive Officer of Eurobank Asset Management Mutual Fund Management Company
S.A., Greece
Director
Dr. Dimitrios D. Thomakos Professor at University of Peloponnese, Greece
Independent Director
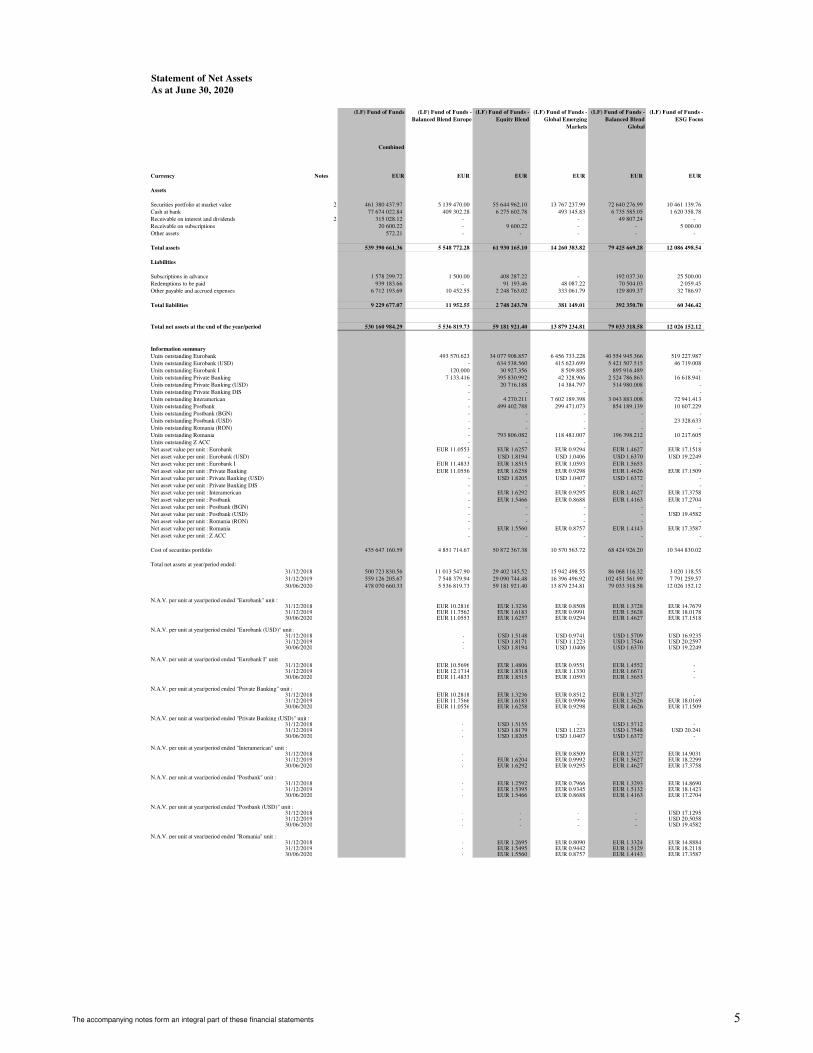
Statement of Net Assets
As at June 30, 2020
(LF) Fund of Funds (LF) Fund of Funds -
Balanced Blend Europe
(LF) Fund of Funds -
Equity Blend
(LF) Fund of Funds -
Global Emerging
Markets
(LF) Fund of Funds -
Balanced Blend
Global
(LF) Fund of Funds -
ESG Focus
Combined
Currency Notes EUR EUR EUR EUR EUR EUR
Assets
Securities portfolio at market value 2 461 380 437.97 5 139 470.00 55 644 962.10 13 767 237.99 72 640 276.99 10 461 139.76
Cash at bank 77 674 022.84 409 302.28 6 275 602.78 493 145.83 6 735 585.05 1 620 358.78
Receivable on interest and dividends 2 315 028.12 - - - 49 807.24 -
Receivable on subscriptions 20 600.22 - 9 600.22 - - 5 000.00
Other assets 572.21 - - - - -
Total assets 539 390 661.36 5 548 772.28 61 930 165.10 14 260 383.82 79 425 669.28 12 086 498.54
Liabilities
Subscriptions in advance 1 578 299.72 1 500.00 408 287.22 - 192 037.30 25 500.00
Redemptions to be paid 939 183.66 - 91 193.46 48 087.22 70 504.03 2 059.45
Other payable and accrued expenses 6 712 193.69 10 452.55 2 248 763.02 333 061.79 129 809.37 32 786.97
Total liabilities 9 229 677.07 11 952.55 2 748 243.70 381 149.01 392 350.70 60 346.42
Total net assets at the end of the year/period 530 160 984.29 5 536 819.73 59 181 921.40 13 879 234.81 79 033 318.58 12 026 152.12
0.01
Information summary
Units outstanding Eurobank 493 570.623 34 077 908.857 6 456 733.228 40 554 945.366 519 227.987
Units outstanding Eurobank (USD) - 634 538.560 415 623.699 5 421 507.515 46 719.008
Units outstanding Eurobank I 120.000 30 927.356 8 509.885 895 916.489 -
Units outstanding Private Banking 7 133.416 395 830.992 42 328.906 2 524 786.863 16 618.941
Units outstanding Private Banking (USD) - 20 716.188 14 384.797 514 980.008 -
Units outstanding Private Banking DIS - - - - -
Units outstanding Interamerican - 4 270.211 7 602 189.398 3 043 883.008 72 941.413
Units outstanding Postbank - 499 402.788 299 471.073 854 189.139 10 607.229
Units outstanding Postbank (BGN) - - - - -
Units outstanding Postbank (USD) - - - - 23 328.633
Units outstanding Romania (RON) - - - - -
Units outstanding Romania - 793 806.082 118 481.007 196 398.212 10 217.605
Units outstanding Z ACC - - - - -
Net asset value per unit : Eurobank EUR 11.0553 EUR 1.6257 EUR 0.9294 EUR 1.4627 EUR 17.1518
Net asset value per unit : Eurobank (USD) - USD 1.8194 USD 1.0406 USD 1.6370 USD 19.2249
Net asset value per unit : Eurobank I EUR 11.4833 EUR 1.8515 EUR 1.0593 EUR 1.5653 -
Net asset value per unit : Private Banking EUR 11.0556 EUR 1.6258 EUR 0.9298 EUR 1.4626 EUR 17.1509
Net asset value per unit : Private Banking (USD) - USD 1.8205 USD 1.0407 USD 1.6372 -
Net asset value per unit : Private Banking DIS - - - - -
Net asset value per unit : Interamerican - EUR 1.6292 EUR 0.9295 EUR 1.4627 EUR 17.3758
Net asset value per unit : Postbank - EUR 1.5466 EUR 0.8688 EUR 1.4163 EUR 17.2704
Net asset value per unit : Postbank (BGN) - - - - -
Net asset value per unit : Postbank (USD) - - - - USD 19.4582
Net asset value per unit : Romania (RON) - - - - -
Net asset value per unit : Romania - EUR 1.5560 EUR 0.8757 EUR 1.4143 EUR 17.3587
Net asset value per unit : Z ACC - - - - -
Cost of securities portfolio 435 647 160.59 4 851 714.67 50 872 367.38 10 570 563.72 68 424 926.20 10 344 830.02
Total net assets at year/period ended:
31/12/2018 500 723 830.56 11 013 547.90 29 402 145.52 15 942 498.55 86 068 116.32 3 020 118.55
31/12/2019 559 126 205.67 7 548 379.94 29 090 744.48 16 396 496.92 102 451 561.99 7 791 259.57
30/06/2020 478 070 660.33 5 536 819.73 59 181 921.40 13 879 234.81 79 033 318.58 12 026 152.12
N.A.V. per unit at year/period ended "Eurobank" unit :31/12/2018 EUR 10.2816 EUR 1.3236 EUR 0.8508 EUR 1.3728 EUR 14.767931/12/2019 EUR 11.7562 EUR 1.6183 EUR 0.9991 EUR 1.5628 EUR 18.017830/06/2020 EUR 11.0553 EUR 1.6257 EUR 0.9294 EUR 1.4627 EUR 17.1518
N.A.V. per unit at year/period ended "Eurobank (USD)" unit :31/12/2018 - USD 1.5148 USD 0.9741 USD 1.5709 USD 16.923531/12/2019 - USD 1.8171 USD 1.1223 USD 1.7546 USD 20.259730/06/2020 - USD 1.8194 USD 1.0406 USD 1.6370 USD 19.2249
N.A.V. per unit at year/period ended "Eurobank I" unit :31/12/2018 EUR 10.5696 EUR 1.4806 EUR 0.9551 EUR 1.4552 - 31/12/2019 EUR 12.1714 EUR 1.8318 EUR 1.1330 EUR 1.6671 - 30/06/2020 EUR 11.4833 EUR 1.8515 EUR 1.0593 EUR 1.5653 -
N.A.V. per unit at year/period ended "Private Banking" unit :31/12/2018 EUR 10.2818 EUR 1.3236 EUR 0.8512 EUR 1.3727 - 31/12/2019 EUR 11.7566 EUR 1.6183 EUR 0.9996 EUR 1.5626 EUR 18.016930/06/2020 EUR 11.0556 EUR 1.6258 EUR 0.9298 EUR 1.4626 EUR 17.1509
N.A.V. per unit at year/period ended "Private Banking (USD)" unit :31/12/2018 - USD 1.5155 - USD 1.5712 - 31/12/2019 - USD 1.8179 USD 1.1223 USD 1.7548 USD 20.24130/06/2020 - USD 1.8205 USD 1.0407 USD 1.6372 -
N.A.V. per unit at year/period ended "Interamerican" unit :31/12/2018 - - EUR 0.8509 EUR 1.3727 EUR 14.903131/12/2019 - EUR 1.6204 EUR 0.9992 EUR 1.5627 EUR 18.229930/06/2020 - EUR 1.6292 EUR 0.9295 EUR 1.4627 EUR 17.3758
N.A.V. per unit at year/period ended "Postbank" unit :31/12/2018 - EUR 1.2592 EUR 0.7966 EUR 1.3293 EUR 14.869031/12/2019 - EUR 1.5395 EUR 0.9345 EUR 1.5132 EUR 18.142330/06/2020 - EUR 1.5466 EUR 0.8688 EUR 1.4163 EUR 17.2704
N.A.V. per unit at year/period ended "Postbank (USD)" unit :31/12/2018 - - - - USD 17.129531/12/2019 - - - - USD 20.505830/06/2020 - - - - USD 19.4582
N.A.V. per unit at year/period ended "Romania" unit :31/12/2018 - EUR 1.2695 EUR 0.8090 EUR 1.3324 EUR 14.888431/12/2019 - EUR 1.5495 EUR 0.9442 EUR 1.5129 EUR 18.211830/06/2020 - EUR 1.5560 EUR 0.8757 EUR 1.4143 EUR 17.3587
The accompanying notes form an integral part of these financial statements 5
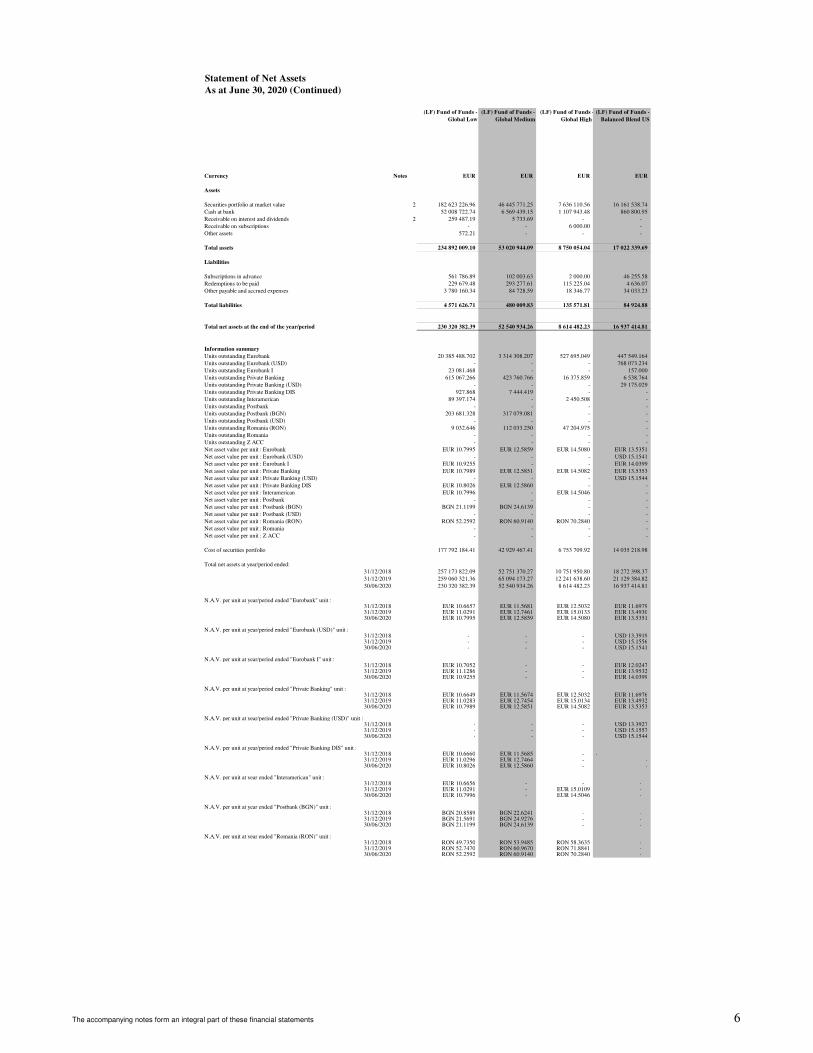
Statement of Net Assets
As at June 30, 2020 (Continued)
(LF) Fund of Funds -
Global Low
(LF) Fund of Funds -
Global Medium
(LF) Fund of Funds -
Global High
(LF) Fund of Funds -
Balanced Blend US
Currency Notes EUR EUR EUR EUR
Assets
Securities portfolio at market value 2 182 623 226.96 46 445 771.25 7 636 110.56 16 161 538.74
Cash at bank 52 008 722.74 6 569 439.15 1 107 943.48 860 800.95
Receivable on interest and dividends 2 259 487.19 5 733.69 - -
Receivable on subscriptions - - 6 000.00 -
Other assets 572.21 - - -
Total assets 234 892 009.10 53 020 944.09 8 750 054.04 17 022 339.69
Liabilities
Subscriptions in advance 561 786.89 102 003.63 2 000.00 46 255.58
Redemptions to be paid 229 679.48 293 277.61 115 225.04 4 636.07
Other payable and accrued expenses 3 780 160.34 84 728.59 18 346.77 34 033.23
Total liabilities 4 571 626.71 480 009.83 135 571.81 84 924.88
Total net assets at the end of the year/period 230 320 382.39 52 540 934.26 8 614 482.23 16 937 414.81
Information summary
Units outstanding Eurobank 20 385 488.702 3 314 308.207 527 695.049 447 549.164
Units outstanding Eurobank (USD) - - - 768 073.234
Units outstanding Eurobank I 23 081.468 - - 157.000
Units outstanding Private Banking 615 067.266 423 760.766 16 375.859 6 538.764
Units outstanding Private Banking (USD) - - - 29 175.029
Units outstanding Private Banking DIS 927.868 7 444.419 - -
Units outstanding Interamerican 89 397.174 - 2 450.508 -
Units outstanding Postbank - - - -
Units outstanding Postbank (BGN) 203 681.328 317 079.081 - -
Units outstanding Postbank (USD) - - - -
Units outstanding Romania (RON) 9 032.646 112 033.250 47 204.975 -
Units outstanding Romania - - - -
Units outstanding Z ACC - - - -
Net asset value per unit : Eurobank EUR 10.7995 EUR 12.5859 EUR 14.5080 EUR 13.5351
Net asset value per unit : Eurobank (USD) - - - USD 15.1541
Net asset value per unit : Eurobank I EUR 10.9255 - - EUR 14.0399
Net asset value per unit : Private Banking EUR 10.7989 EUR 12.5851 EUR 14.5082 EUR 13.5353
Net asset value per unit : Private Banking (USD) - - - USD 15.1544
Net asset value per unit : Private Banking DIS EUR 10.8026 EUR 12.5860 - -
Net asset value per unit : Interamerican EUR 10.7996 - EUR 14.5046 -
Net asset value per unit : Postbank - - - -
Net asset value per unit : Postbank (BGN) BGN 21.1199 BGN 24.6139 - -
Net asset value per unit : Postbank (USD) - - - -
Net asset value per unit : Romania (RON) RON 52.2592 RON 60.9140 RON 70.2840 -
Net asset value per unit : Romania - - - -
Net asset value per unit : Z ACC - - - -
Cost of securities portfolio 177 792 184.41 42 929 467.41 6 753 709.92 14 035 218.98
Total net assets at year/period ended:
31/12/2018 257 173 822.09 52 751 370.27 10 751 950.80 18 272 398.37
31/12/2019 259 060 321.36 65 094 173.27 12 241 638.60 21 129 384.82
30/06/2020 230 320 382.39 52 540 934.26 8 614 482.23 16 937 414.81
N.A.V. per unit at year/period ended "Eurobank" unit :31/12/2018 EUR 10.6657 EUR 11.5681 EUR 12.5032 EUR 11.697931/12/2019 EUR 11.0291 EUR 12.7461 EUR 15.0133 EUR 13.493030/06/2020 EUR 10.7995 EUR 12.5859 EUR 14.5080 EUR 13.5351
N.A.V. per unit at year/period ended "Eurobank (USD)" unit :31/12/2018 - - - USD 13.391931/12/2019 - - - USD 15.155630/06/2020 - - - USD 15.1541
N.A.V. per unit at year/period ended "Eurobank I" unit :31/12/2018 EUR 10.7052 - - EUR 12.024731/12/2019 EUR 11.1286 - - EUR 13.953230/06/2020 EUR 10.9255 - - EUR 14.0399
N.A.V. per unit at year/period ended "Private Banking" unit :31/12/2018 EUR 10.6649 EUR 11.5674 EUR 12.5032 EUR 11.697631/12/2019 EUR 11.0283 EUR 12.7454 EUR 15.0134 EUR 13.493230/06/2020 EUR 10.7989 EUR 12.5851 EUR 14.5082 EUR 13.5353
N.A.V. per unit at year/period ended "Private Banking (USD)" unit :31/12/2018 - - - USD 13.392731/12/2019 - - - USD 15.155730/06/2020 - - - USD 15.1544
N.A.V. per unit at year/period ended "Private Banking DIS" unit :31/12/2018 EUR 10.6660 EUR 11.5685 - -31/12/2019 EUR 11.0296 EUR 12.7464 - -30/06/2020 EUR 10.8026 EUR 12.5860 - -
N.A.V. per unit at year ended "Interamerican" unit :31/12/2018 EUR 10.6656 - - - 31/12/2019 EUR 11.0291 - EUR 15.0109 - 30/06/2020 EUR 10.7996 - EUR 14.5046 -
N.A.V. per unit at year ended "Postbank (BGN)" unit :31/12/2018 BGN 20.8589 BGN 22.6241 - - 31/12/2019 BGN 21.5691 BGN 24.9276 - - 30/06/2020 BGN 21.1199 BGN 24.6139 - -
N.A.V. per unit at year ended "Romania (RON)" unit :31/12/2018 RON 49.7350 RON 53.9485 RON 58.3635 - 31/12/2019 RON 52.7470 RON 60.9670 RON 71.8841 - 30/06/2020 RON 52.2592 RON 60.9140 RON 70.2840 -
The accompanying notes form an integral part of these financial statements 6

Statement of Net Assets
As at June 30, 2020 (Continued)
(LF) Fund of Funds - Life
Cycle 2032
(LF) Fund of Funds -
Life Cycle 2047
(LF) Fund of
Funds - Life
Cycle 2042
(LF) Fund of Funds -
Life Cycle 2052
Currency Notes EUR EUR EUR EUR
Assets
Securities portfolio at market value 2 34 272 131.12 16 259 771.14 207 487.82 121 313.54
Cash at bank 1 046 864.79 530 168.56 9 604.13 6 484.32
Receivable on interest and dividends 2 - - - -
Receivable on subscriptions - - - -
Other assets - - - -
Total assets 35 318 995.91 16 789 939.70 217 091.95 127 797.86
Liabilities
Subscriptions in advance 159 445.16 79 483.94 - -
Redemptions to be paid 51 070.37 33 450.93 - -
Other payable and accrued expenses 26 959.59 12 878.16 143.85 69.46
Total liabilities 237 475.12 125 813.03 143.85 69.46
Total net assets at the end of the year/period 35 081 520.79 16 664 126.67 216 948.10 127 728.40
Information summary
Units outstanding Eurobank - - - -
Units outstanding Eurobank (USD) - - - -
Units outstanding Eurobank I 32 154 208.824 15 118 342.847 100 010.001 100 010.001
Units outstanding Private Banking - - - -
Units outstanding Private Banking (USD) - - - -
Units outstanding Private Banking DIS - - - -
Units outstanding Interamerican - - - -
Units outstanding Postbank - - - -
Units outstanding Postbank (BGN)
Units outstanding Postbank (USD) - - - -
Units outstanding Group Pension 117 765.062 - 96 493.284 14 539.854
Units outstanding Z ACC 12 234.530 - 233.007 -
Net asset value per unit : Eurobank - - - -
Net asset value per unit : Eurobank (USD) - - - -
Net asset value per unit : Eurobank I EUR 1.0866 EUR 1.1022 EUR 1.1073 EUR 1.1163
Net asset value per unit : Private Banking - - - -
Net asset value per unit : Private Banking (USD) - - - -
Net asset value per unit : Private Banking DIS - - - -
Net asset value per unit : Interamerican - - - -
Net asset value per unit : Postbank - - - -
Net asset value per unit : Postbank (BGN) - - - -
Net asset value per unit : Postbank (USD) - - - -
Net asset value per unit : Group Pension EUR 1.0863 - EUR 1.0980 EUR 1.1063
Net asset value per unit : Z ACC EUR 1.0860 EUR 1.1028 EUR 1.1064 -
Cost of securities portfolio 33 019 440.47 15 746 097.64 195 514.60 111 125.17
Total net assets at year/period ended:
31/12/2018 9 717 596.09 4 423 490.21 99 522.68 96 725.76
31/12/2019 25 606 766.76 12 402 447.75 183 963.57 129 066.64
30/06/2020 35 081 520.79 16 664 126.67 216 948.10 127 728.40
N.A.V. per unit at year/period ended "Eurobank I" unit :31/12/2018 EUR 0.9614 EUR 0.9461 EUR 0.9607 EUR 0.955431/12/2019 EUR 1.1093 EUR 1.1612 EUR 1.1534 EUR 1.194830/06/2020 EUR 1.0866 EUR 1.1022 EUR 1.1073 EUR 1.1163
N.A.V. per unit at year ended "Group Pension" unit :31/12/2018 EUR 0.9614 - EUR 0.9602 EUR 0.954631/12/2019 EUR 1.1090 - EUR 1.1466 EUR 1.187230/06/2020 EUR 1.0863 - EUR 1.0980 EUR 1.1063
N.A.V. per unit at year ended "Z ACC" unit :31/12/2018 - - - - 31/12/2019 - - - - 30/06/2020 EUR 1.0860 EUR 1.1028 EUR 1.1064 -
The accompanying notes form an integral part of these financial statements 7
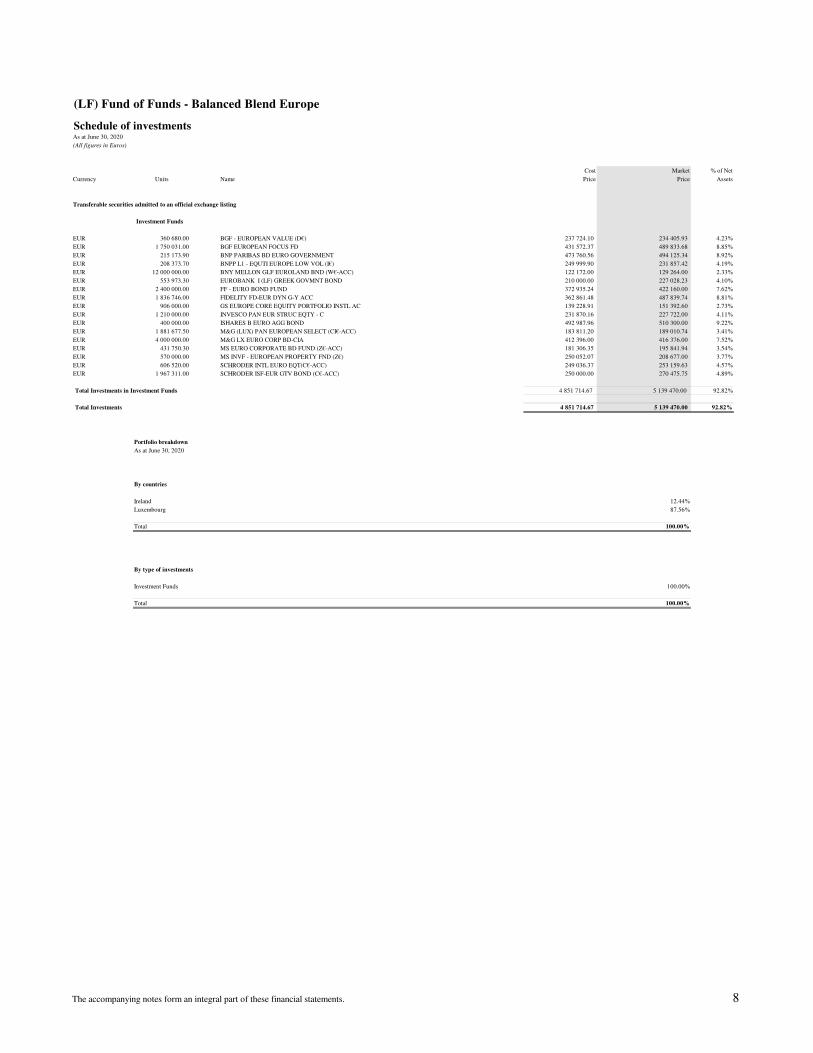
(LF) Fund of Funds - Balanced Blend Europe
Schedule of investmentsAs at June 30, 2020
(All figures in Euros)
Cost Market % of Net
Currency Units Name Price Price Assets
Transferable securities admitted to an official exchange listing
Investment Funds
EUR 360 680.00 BGF - EUROPEAN VALUE (D€) 237 724.10 234 405.93 4.23%
EUR 1 750 031.00 BGF EUROPEAN FOCUS FD 431 572.37 489 833.68 8.85%
EUR 215 173.90 BNP PARIBAS BD EURO GOVERNMENT 473 760.56 494 125.34 8.92%
EUR 208 373.70 BNPP L1 - EQUTI EUROPE LOW VOL (I€) 249 999.90 231 857.42 4.19%
EUR 12 000 000.00 BNY MELLON GLF EUROLAND BND (W€-ACC) 122 172.00 129 264.00 2.33%
EUR 553 973.30 EUROBANK I (LF) GREEK GOVMNT BOND 210 000.00 227 028.23 4.10%
EUR 2 400 000.00 FF - EURO BOND FUND 372 935.24 422 160.00 7.62%
EUR 1 836 746.00 FIDELITY FD-EUR DYN G-Y ACC 362 861.48 487 839.74 8.81%
EUR 906 000.00 GS EUROPE CORE EQUITY PORTFOLIO INSTL AC 139 228.91 151 392.60 2.73%
EUR 1 210 000.00 INVESCO PAN EUR STRUC EQTY - C 231 870.16 227 722.00 4.11%
EUR 400 000.00 ISHARES B EURO AGG BOND 492 987.96 510 300.00 9.22%
EUR 1 881 677.50 M&G (LUX) PAN EUROPEAN SELECT (CI€-ACC) 183 811.20 189 010.74 3.41%
EUR 4 000 000.00 M&G LX EURO CORP BD-CIA 412 396.00 416 376.00 7.52%
EUR 431 750.30 MS EURO CORPORATE BD FUND (Z€-ACC) 181 306.35 195 841.94 3.54%
EUR 570 000.00 MS INVF - EUROPEAN PROPERTY FND (Z€) 250 052.07 208 677.00 3.77%
EUR 606 520.00 SCHRODER INTL EURO EQT(C€-ACC) 249 036.37 253 159.63 4.57%
EUR 1 967 311.00 SCHRODER ISF-EUR GTV BOND (C€-ACC) 250 000.00 270 475.75 4.89%
Total Investments in Investment Funds 4 851 714.67 5 139 470.00 92.82%
Total Investments 4 851 714.67 5 139 470.00 92.82%
Portfolio breakdown
As at June 30, 2020
By countries
Ireland 12.44%
Luxembourg 87.56%
Total 100.00%
By type of investments
Investment Funds 100.00%
Total 100.00%
The accompanying notes form an integral part of these financial statements. 8

(LF) Fund of Funds - Equity Blend
Schedule of investmentsAs at June 30, 2020
(All figures in Euros)
Cost Market % of Net
Currency Units Name Price Price Assets
Transferable securities admitted to an official exchange listing
Investment Funds
EUR 12 000.00 ISHARES MSCI ACWI (ETF) 530 037.60 546 360.00 0.92%
EUR 12 987.31 BNP-INSTICASH EUR (I€Τ1) 1 299 390.63 1 297 388.26 2.19%
EUR 890 506.10 (LF)I EQUITY- EMERGING EUROPE FUND 820 429.73 753 635.31 1.27%
EUR 859 152.02 (LF) I EQUITY- GLOBAL EQUTIES FUND 1 056 938.95 1 255 650.68 2.12%
EUR 77 027.68 FIDELITY FD-EUR DYN G-Y ACC 1 747 709.55 2 045 855.18 3.46%
EUR 63 043.03 JPM-EUROPE STRATEGIC GROWTH(C€) 2 208 801.03 2 166 789.04 3.66%
EUR 190 189.25 M&G (LUX) PAN EUROPEAN SELECT (CI€-ACC) 1 949 519.78 1 910 412.98 3.23%
EUR 8 007.14 SCHRODER ISF EUROSPEC 1 650 000.00 1 722 661.70 2.91%
EUR 26 523.64 TEMPLETON ASIAN GROWTH FUND (I €) 799 772.92 902 599.47 1.53%
12 062 600.19 12 601 352.62 21.30%
USD 20 578.86 BNPP US MULTI FACTOR EQUITY 2 894 316.29 2 810 251.18 4.75%
USD 185 708.76 GOLDMAN SACHS US CORE 4 644 150.26 5 157 655.33 8.71%
USD 7 666.86 JPM EM OPP FUND (C$-ACC) 2 942 959.36 2 825 058.95 4.77%
USD 263 588.89 JPM JAPAN EQTY (C$) 4 793 374.81 5 230 349.29 8.84%
USD 98 288.38 JPM -US VALUE FUND (C$-ACC) 2 970 103.12 2 462 914.65 4.16%
USD 162 219.28 JPM AMERICA EQTY (C$-ACC) 4 709 568.06 5 270 170.96 8.91%
USD 28 500.54 MORGAN STANLEY US EQUITY GROWTH (Z$-ACC) 2 186 642.72 3 621 996.14 6.12%
USD 62 436.36 MS INVEST F-GLOBAL QAULITY (Z$) 2 581 420.35 2 632 273.91 4.45%
USD 153 936.23 FRANKLIN U.S. OPPORTUNITIES FUND (I$) 6 522 521.22 8 116 087.71 13.71%
USD 2 193 076.56 BNY MELLON GLB EQUITY FUND (W$-ACC) 2 314 370.64 2 596 126.35 4.39%
USD 2 397 590.06 BNY MELLON MOBILITY INNOVATION (W$-ACC) 2 250 340.36 2 320 725.01 3.92%
38 809 767.19 43 043 609.48 72.73%
Total Investments in Investment Funds 50 872 367.38 55 644 962.10 94.04%
Total Investments 50 872 367.38 55 644 962.10 94.04%
Portfolio breakdown
As at June 30, 2020
By countries
Ireland 9.82%
Luxembourg 90.18%
Total 100.00%
By type of investments
Investment Funds 100.00%
Total 100.00%
The accompanying notes form an integral part of these financial statements. 9
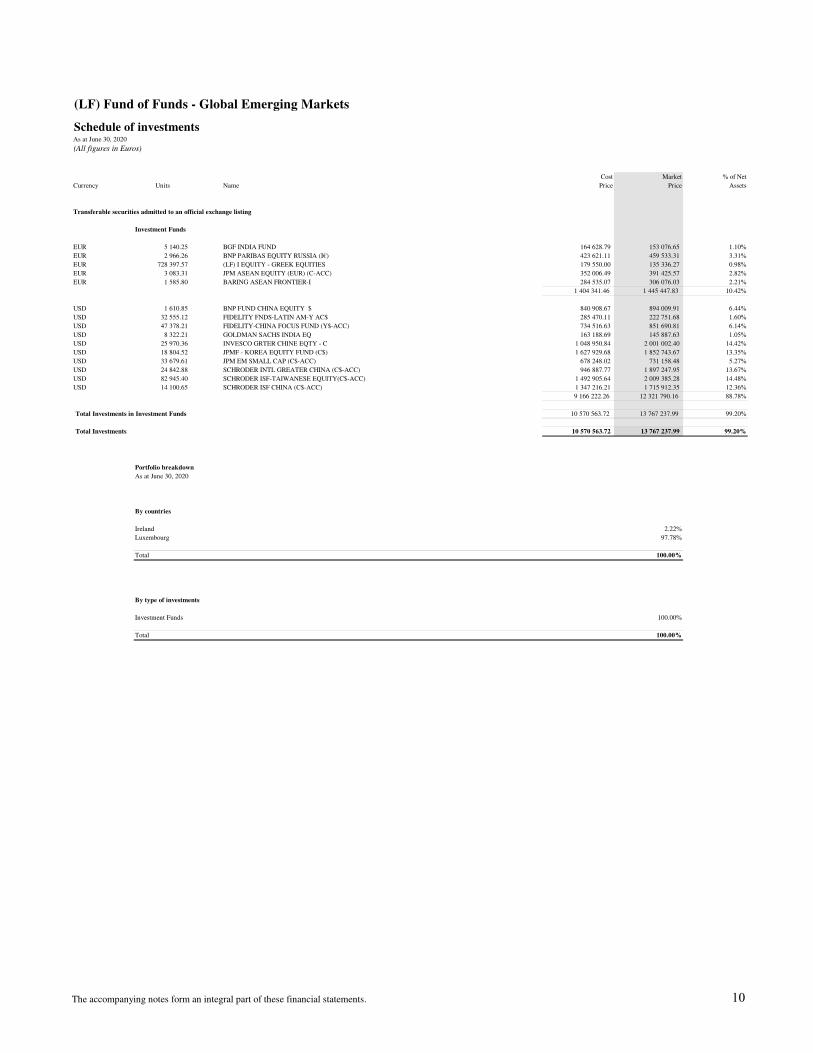
(LF) Fund of Funds - Global Emerging Markets
Schedule of investmentsAs at June 30, 2020
(All figures in Euros)
Cost Market % of Net
Currency Units Name Price Price Assets
Transferable securities admitted to an official exchange listing
Investment Funds
EUR 5 140.25 BGF INDIA FUND 164 628.79 153 076.65 1.10%
EUR 2 966.26 BNP PARIBAS EQUITY RUSSIA (I€) 423 621.11 459 533.31 3.31%
EUR 728 397.57 (LF) I EQUITY - GREEK EQUITIES 179 550.00 135 336.27 0.98%
EUR 3 083.31 JPM ASEAN EQUITY (EUR) (C-ACC) 352 006.49 391 425.57 2.82%
EUR 1 585.80 BARING ASEAN FRONTIER-I 284 535.07 306 076.03 2.21%
1 404 341.46 1 445 447.83 10.42%
USD 1 610.85 BNP FUND CHINA EQUITY $ 840 908.67 894 009.91 6.44%
USD 32 555.12 FIDELITY FNDS-LATIN AM-Y AC$ 285 470.11 222 751.68 1.60%
USD 47 378.21 FIDELITY-CHINA FOCUS FUND (Y$-ACC) 734 516.63 851 690.81 6.14%
USD 8 322.21 GOLDMAN SACHS INDIA EQ 163 188.69 145 887.63 1.05%
USD 25 970.36 INVESCO GRTER CHINE EQTY - C 1 048 950.84 2 001 002.40 14.42%
USD 18 804.52 JPMF - KOREA EQUITY FUND (C$) 1 627 929.68 1 852 743.67 13.35%
USD 33 679.61 JPM EM SMALL CAP (C$-ACC) 678 248.02 731 158.48 5.27%
USD 24 842.88 SCHRODER INTL GREATER CHINA (C$-ACC) 946 887.77 1 897 247.95 13.67%
USD 82 945.40 SCHRODER ISF-TAIWANESE EQUITY(C$-ACC) 1 492 905.64 2 009 385.28 14.48%
USD 14 100.65 SCHRODER ISF CHINA (C$-ACC) 1 347 216.21 1 715 912.35 12.36%
9 166 222.26 12 321 790.16 88.78%
Total Investments in Investment Funds 10 570 563.72 13 767 237.99 99.20%
Total Investments 10 570 563.72 13 767 237.99 99.20%
Portfolio breakdown
As at June 30, 2020
By countries
Ireland 2.22%
Luxembourg 97.78%
Total 100.00%
By type of investments
Investment Funds 100.00%
Total 100.00%
The accompanying notes form an integral part of these financial statements. 10

(LF) Fund of Funds - Balanced Blend Global
Schedule of investmentsAs at June 30, 2020
(All figures in Euros)
Cost Market % of Net
Currency Units Name Price Price Assets
Transferable securities admitted to an official exchange listing
Bonds
EUR 540 000.00 NATIONAL BANK GREECE SA 18/7/2029 8.25 VARIABLE 540 000.00 564 235.20 0.71%
EUR 1 970 000.00 GGB 2% 22/4/27 1 968 345.20 2 110 992.90 2.67%
2 508 345.20 2 675 228.10 3.38%
Total Investments in Bonds 2 508 345.20 2 675 228.10 3.38%
Investment Funds
EUR 122 880.32 (LF) BOND - GREEK CORP BND FND (ERB I €) 2 000 000.00 1 994 396.66 2.52%
EUR 28 670.59 BNP PARIBAS BD EURO GOVERNMENT 6 086 033.72 6 583 913.83 8.33%
EUR 163 263.24 BNP PARIBAS BOND EURO (I€) 3 625 158.65 3 808 931.44 4.82%
EUR 0.02 BNP PARIBAS EQUITY WORLD LOW VOL (I€) 10.65 11.73 0.00%
EUR 43 585.16 BNP-INSTICASH EUR (I€Τ1) 4 360 000.00 4 354 009.29 5.51%
EUR 3 594 401.80 BNY MELLON GLF EUROLAND BND (W€-ACC) 3 682 256.27 3 871 889.62 4.90%
EUR 28 000.00 DB X TRACKERS MSCI WORLD (ETF) 391 784.40 394 296.00 0.50%
EUR 77 023.35 EUROBANK I (LF) GREEK GOVMNT BOND 2 393 998.24 3 156 555.61 3.99%
EUR 57 996.99 FIDELITY FD-EUR DYN G-Y ACC 1 463 091.98 1 540 400.05 1.95%
EUR 115 081.00 INVESCO EURO CORPORATE BOND (C-ACC) 1 939 383.98 2 262 262.30 2.86%
EUR 296 562.96 M&G LX EURO CORP BD-CIA 3 056 686.74 3 087 042.48 3.91%
EUR 211 930.64 M&G LX GB CONVRTBL 2 272 622.76 2 354 952.02 2.98%
EUR 7 148.20 SCHRODER ISF EUROSPEC 1 515 000.00 1 537 868.75 1.95%
EUR 392 789.02 SCHRODER ISF-EUR GTV BOND (C€-ACC) 5 228 739.74 5 400 259.84 6.83%
EUR 22 011.99 TEMPLETON ASIAN GROWTH FUND (I €) 577 544.78 749 068.02 0.95%
EUR 11 700.00 XTRACKERS II GERMANY GVT BOND (ETF) 2 490 895.62 2 447 055.00 3.10%
41 083 207.53 43 542 912.64 55.10%
USD 69 255.51 BNP FLEXI I COMMOD-I USD 3 543 880.56 3 063 866.86 3.88%
USD 14 129.36 BNP PARIBAS CONVERTIBLE BOND WORLD 2 159 911.42 2 369 362.03 3.00%
USD 54 215.87 FRANKLIN U.S. OPPORTUNITIES FUND (I$) 2 118 343.02 2 858 461.51 3.62%
USD 82 628.19 GOLDMAN SACHS US CORE 2 034 766.73 2 294 817.48 2.90%
USD 70 296.79 JPM AMERICA EQTY (C$-ACC) 2 034 319.41 2 283 798.10 2.89%
USD 2 132.33 JPM EM OPP FUND (C$-ACC) 813 932.93 785 711.68 0.99%
USD 12 622.59 JPM INV-GLB CONV/BLE (USD) (C$-ACC) 2 275 685.62 2 338 414.08 2.96%
USD 80 442.43 JPM JAPAN EQTY (C$) 1 471 129.09 1 596 205.45 2.02%
USD 23 275.68 MORGAN STANLEY US EQUITY GROWTH (Z$-ACC) 2 271 623.32 2 957 994.68 3.74%
USD 659 422.31 PIMCO COMMODITY REAL RET STR (I$) 3 537 222.82 3 097 482.89 3.92%
USD 14 895.01 SCHRODER GLB CONVERT BOND (C$) 2 236 442.63 2 375 027.83 3.01%
USD 16 233.54 SCHRODER ISF US DOLLAR BOND (C$-ACC) 336 115.92 400 993.66 0.51%
24 833 373.47 26 422 136.25 33.43%
Total Investments in Investment Funds 65 916 581.00 69 965 048.89 88.54%
Total transferable securities admitted to an official exchange listing 68 424 926.20 72 640 276.99 91.92%
Total Investments 68 424 926.20 72 640 276.99 91.92%
%
Portfolio breakdown
As at June 30, 2020
By countries
Germany 3.37%
Greece 3.68%
Ireland 10.14%
Luxembourg 82.81%
Total 100.00%
By type of investments
Bonds 3.68%
Investment Funds 96.32%
Total 100.00%
The accompanying notes form an integral part of these financial statements. 11

(LF) Fund of Funds - ESG Focus
Schedule of investmentsAs at June 30, 2020
(All figures in Euros)
Cost Market % of Net
Currency Units Name Price Price Assets
Transferable securities admitted to an official exchange listing
Investment Funds
EUR 34 409.34 (LF) I - MM FUND RESERVE 341 107.20 338 980.20 2.82%
EUR 4 340.00 ARABESQUE SYSTEMATIC (I€) 646 531.92 624 960.00 5.20%
EUR 12 364.04 BNP GREEN BOND (I€) 1 299 999.90 1 293 896.47 10.76%
EUR 994.48 BNP PARIBAS EQUITY WORLD LOW VOL (I€) 635 419.91 583 333.31 4.85%
EUR 5 998.09 BNP-INSTICASH EUR (I€Τ1) 600 000.00 599 188.46 4.98%
EUR 8.53 BNPP SUSTAINABLE 12M (I€) 879 047.81 873 587.18 7.26%
EUR 52 558.17 SCHRODER ISF-GLB CLIM CHANGE (C€) 1 003 112.01 1 061 244.06 8.82%
5 405 218.75 5 375 189.68 44.69%
USD 6 894.37 BNP PARIBAS EQ BEST SEL WLD (I$) 861 361.43 890 641.31 7.41%
USD 575 811.79 BNY MELLON GLB EQUITY FUND (W$-ACC) 684 067.56 681 636.10 5.67%
USD 749 322.35 BNY MELLON GLB LEADERS FUND (W$-ACC) 961 598.53 1 017 654.43 8.46%
USD 740 797.95 BNY MELLON GLB OPP FD (W$-ACC) 741 431.89 761 835.08 6.33%
USD 57 449.34 NEUBERGER BERMAN GL EQ SYSTEMATIC (I$) 682 432.36 672 072.14 5.59%
USD 4 891.61 SCHRODER ISF-GLB SUST GROWTH (C$-ACC) 1 008 719.50 1 062 111.02 8.83%
4 939 611.27 5 085 950.08 42.28%
Total Investments in Investment Funds 10 344 830.02 10 461 139.76 86.98%
Total Investments 10 344 830.02 10 461 139.76 86.98%
Portfolio breakdown
As at June 30, 2020
By countries
Ireland 29.95%
Luxembourg 70.05%
Total 100.00%
By type of investments
Investment Funds 100.00%
Total 100.00%
The accompanying notes form an integral part of these financial statements. 12

(LF) Fund of Funds - Global Low
Schedule of investmentsAs at June 30, 2020
(All figures in Euros)
Cost Market % of Net
Currency Units Name Price Price Assets
Transferable securities admitted to an official exchange listing
Investment Funds
EUR 750 000.00 (LF) I - MM FUND RESERVE 7 533 188.14 7 388 550.00 3.21%
EUR 10 042 902.25 (LF) INCOME PLUS € FUND 15 250 039.51 16 253 433.00 7.06%
EUR 20 322.44 ARABESQUE SYSTEMATIC (I€) 3 013 148.07 2 926 430.93 1.27%
EUR 70 627.45 BNP PARIBAS BD EURO GOVERNMENT 14 988 758.67 16 218 888.31 7.04%
EUR 95 132.00 BNP PARIBAS ENHANCED CASH 6 MONTHS (I€) 10 799 999.87 10 696 642.08 4.64%
EUR 11 145.52 BNP PARIBAS EQUITY WORLD LOW VOL (I€) 5 933 399.69 6 537 627.08 2.84%
EUR 166 674.74 BNP-INSTICASH EUR (I€Τ1) 16 913 565.00 16 650 240.02 7.23%
EUR 110.34 BNPP SUSTAINABLE 12M (I€) 11 324 930.34 11 294 599.81 4.90%
EUR 0.00 BNY MELLON GLB SH DR HI YLD BD(C-ACC) - - 0.00%
EUR 6 551 919.79 EUROBANK I (LF) ABSOLUTE RETURN FUND 8 817 084.09 9 305 036.48 4.04%
EUR 102 852.44 EUROBANK I (LF) GREEK GOVMNT BOND 3 670 000.00 4 215 078.04 1.83%
EUR 74 500.00 ISHARES B EURO AGG BOND 9 042 732.20 9 504 337.50 4.13%
EUR 256 103.23 M&G LUX OPTIMAL INCOME (CI€-ACC) 2 626 036.64 2 600 830.71 1.13%
EUR 729 272.27 PIMCO EUR SHORT TERM-INS-ACC 8 928 078.69 8 722 096.40 3.79%
EUR 1 044 234.68 PIMCO GIS US SHORT TERM (I€-HDFD) 10 613 255.51 10 619 866.71 4.61%
EUR 941 806.72 SCHRODER ISF-EUR GTV BOND (C€-ACC) 12 000 000.00 12 948 429.69 5.62%
EUR 15 000.00 XTRACKERS II GERMANY GVT BOND (ETF) 3 168 200.00 3 137 250.00 1.36%
144 622 416.41 149 019 336.76 64.72%
Total Investments in Investment Funds 144 622 416.41 149 019 336.76 64.72%
Bonds
EUR 1 560 000.00 EUROBANK SA 2/11/2020 2.75 FIXED 1 549 844.40 1 573 915.20 0.68%
EUR 2 880 000.00 GTB 0 11/06/21 2 872 771.20 2 876 428.80 1.25%
EUR 1 510 000.00 HELLENIC PETROLEUM FINAN 4/10/2024 2 FIXED 1 501 091.00 1 503 899.60 0.65%
EUR 3 600 000.00 HELLENIC REPUBLIC 1/8/2022 4.375 FIXED 3 636 892.00 3 905 136.00 1.70%
EUR 5 000 000.00 HELLENIC T-BILL 11/12/2020 0 ZERO COUPON 4 996 500.00 4 997 850.00 2.17%
EUR 5 000 000.00 HELLENIC T-BILL 11/9/2020 0 ZERO COUPON 4 985 250.00 4 999 500.00 2.17%
EUR 1 500 000.00 HELLENIC T-BILL 12/3/2021 0 ZERO COUPON 1 496 370.00 1 498 320.00 0.65%
EUR 5 000 000.00 HELLENIC T-BILL 2/10/2020 0 ZERO COUPON 4 992 500.00 4 998 950.00 2.17%
EUR 1 940 000.00 MYTILINEOS FINANCIAL 1/12/2024 2.5 FIXED 1 940 000.00 1 945 742.40 0.84%
EUR 1 620 000.00 NATIONAL BANK GREECE SA 19/10/2020 2.75 FIXED 1 613 066.40 1 632 652.20 0.71%
EUR 2 700 000.00 OTE PLC 18/7/2022 2.375 FIXED 2 692 386.00 2 785 617.00 1.21%
EUR 900 000.00 OTE PLC 24/9/2026 0.875 FIXED 893 097.00 885 879.00 0.38%
33 169 768.00 33 603 890.20 14.58%
Total Investments in Bonds 33 169 768.00 33 603 890.20 14.58%
Total transferable securities admitted to an official exchange listing 177 792 184.41 182 623 226.96 79.30%
Total Investments 177 792 184.41 182 623 226.96 79.30%
Portfolio breakdown
As at June 30, 2020
By countries
Germany 1.72%
Greece 15.57%
Ireland 15.80%
Luxembourg 64.09%
United Kingdom 2.83%
Total 100.00%
By type of investments
Bonds 18.39%
Investment Funds 81.61%
Total 100.00%
The accompanying notes form an integral part of these financial statements. 13

(LF) Fund of Funds - Global Medium
Schedule of investmentsAs at June 30, 2020
(All figures in Euros)
Cost Market % of Net
Currency Units Name Price Price Assets
Transferable securities admitted to an official exchange listing
Investment Funds
EUR 71 183.50 (LF) BOND - GREEK CORP BND FND (ERB I €) 1 000 000.00 1 155 336.63 2.20%
EUR 183 596.55 (LF) I EQUITY- GLOBAL EQUTIES FUND 212 127.22 268 326.36 0.51%
EUR 344 903.33 (LF) I - MM FUND RESERVE 3 432 902.42 3 397 780.65 6.47%
EUR 16 022.41 BNP PARIBAS BD EURO GOVERNMENT 3 310 888.15 3 679 387.15 7.00%
EUR 30 301.86 BNP PARIBAS ENHANCED CASH 6 MONTHS (I€) 3 411 039.58 3 407 140.80 6.48%
EUR 1 227.35 BNP PARIBAS EQUITY WORLD LOW VOL (I€) 695 560.63 719 926.69 1.37%
EUR 22 895.06 BNP-INSTICASH EUR (I€Τ1) 2 327 207.94 2 287 138.68 4.35%
EUR 864 615.14 BNY MELLON LONG TERM (W€-ACC) 1 756 629.09 1 933 884.69 3.68%
EUR 2 032 000.03 EUROBANK I (LF) ABSOLUTE RETURN FUND 2 716 681.81 2 885 846.44 5.49%
EUR 53 174.26 EUROBANK I (LF) GREEK GOVMNT BOND 1 300 000.00 2 179 176.89 4.15%
EUR 4 500.00 HELLENIC PETROLEUM FINAN 4/10/2024 2 FIXED 447 345.00 448 182.00 0.85%
EUR 33 250.00 ISHARES B EURO AGG BOND 4 012 243.08 4 241 868.75 8.07%
EUR 10 500.00 ISHARES MSCI ACWI (ETF) 386 231.25 478 065.00 0.91%
EUR 53 881.67 M&G LX JAPAN EUR 483 377.86 483 830.47 0.92%
EUR 5 200.00 MYTILINEOS FINANCIAL 1/12/2024 2.5 FIXED 520 000.00 521 539.20 0.99%
EUR 2 700.00 OTE PLC 24/9/2026 0.875 FIXED 267 929.10 265 763.70 0.51%
EUR 87 110.90 PIMCO EUR SHORT TERM-INS-ACC 1 061 917.67 1 041 846.30 1.98%
EUR 124 240.94 PIMCO GIS US SHORT TERM (I€-HDFD) 1 268 500.00 1 263 530.36 2.40%
EUR 341 994.24 SCHRODER ISF-EUR GTV BOND (C€-ACC) 4 500 000.00 4 701 907.81 8.95%
EUR 7 000.00 XTRACKERS II GERMANY GVT BOND (ETF) 1 496 687.90 1 464 050.00 2.79%
34 607 268.70 36 824 528.57 70.07%
USD 239 100.00 BNP EASY S&P 500 UCITS (ETF) 2 189 756.90 2 459 198.37 4.68%
USD 6 599.42 BNP PARIBAS EQ BEST SEL WLD (I$) 733 927.12 852 537.52 1.62%
USD 16 520.35 MS INVEST F -GLOBAL OPPORT 1 257 242.21 1 601 432.39 3.05%
USD 57 830.57 MS INVEST F-GLOBAL QAULITY (Z$) 2 054 543.41 2 438 097.04 4.64%
USD 35 450.81 SCHRODER ISF EM (C$-ACC) 583 160.83 559 564.35 1.07%
USD 7 877.40 SCHRODER ISF-GLB SUST GROWTH (C$-ACC) 1 503 568.24 1 710 413.01 3.26%
8 322 198.71 9 621 242.68 18.31%
Total Investments in Investment Funds 42 929 467.41 46 445 771.25 88.38%
Total transferable securities admitted to an official exchange listing 42 929 467.41 46 445 771.25 88.38%
Total Investments 42 929 467.41 46 445 771.25 88.38%
Portfolio breakdown
As at June 30, 2020
By countries
France 5.29%
Germany 3.15%
Greece 1.12%
Ireland 19.29%
Luxembourg 69.60%
United Kingdom 1.54%
Total 100.00%
By type of investments
Investment Funds 100.00%
Total 100.00%
The accompanying notes form an integral part of these financial statements. 14
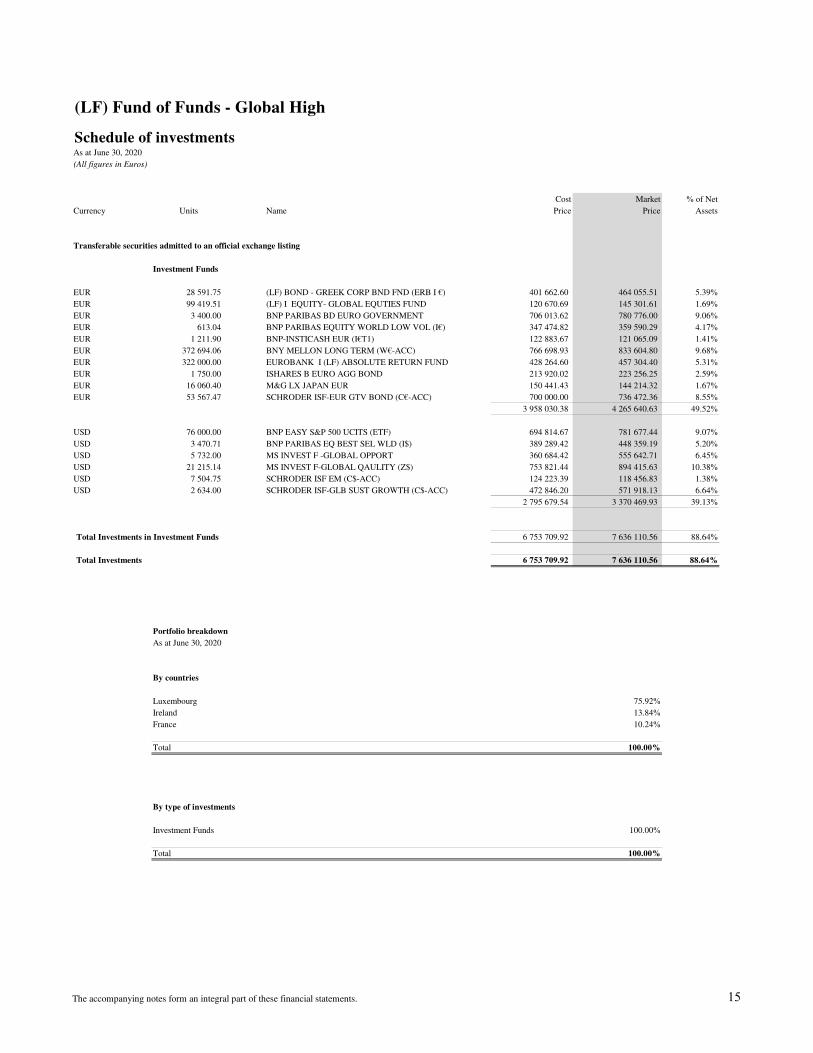
(LF) Fund of Funds - Global High
Schedule of investmentsAs at June 30, 2020
(All figures in Euros)
Cost Market % of Net
Currency Units Name Price Price Assets
Transferable securities admitted to an official exchange listing
Investment Funds
EUR 28 591.75 (LF) BOND - GREEK CORP BND FND (ERB I €) 401 662.60 464 055.51 5.39%
EUR 99 419.51 (LF) I EQUITY- GLOBAL EQUTIES FUND 120 670.69 145 301.61 1.69%
EUR 3 400.00 BNP PARIBAS BD EURO GOVERNMENT 706 013.62 780 776.00 9.06%
EUR 613.04 BNP PARIBAS EQUITY WORLD LOW VOL (I€) 347 474.82 359 590.29 4.17%
EUR 1 211.90 BNP-INSTICASH EUR (I€Τ1) 122 883.67 121 065.09 1.41%
EUR 372 694.06 BNY MELLON LONG TERM (W€-ACC) 766 698.93 833 604.80 9.68%
EUR 322 000.00 EUROBANK I (LF) ABSOLUTE RETURN FUND 428 264.60 457 304.40 5.31%
EUR 1 750.00 ISHARES B EURO AGG BOND 213 920.02 223 256.25 2.59%
EUR 16 060.40 M&G LX JAPAN EUR 150 441.43 144 214.32 1.67%
EUR 53 567.47 SCHRODER ISF-EUR GTV BOND (C€-ACC) 700 000.00 736 472.36 8.55%
3 958 030.38 4 265 640.63 49.52%
USD 76 000.00 BNP EASY S&P 500 UCITS (ETF) 694 814.67 781 677.44 9.07%
USD 3 470.71 BNP PARIBAS EQ BEST SEL WLD (I$) 389 289.42 448 359.19 5.20%
USD 5 732.00 MS INVEST F -GLOBAL OPPORT 360 684.42 555 642.71 6.45%
USD 21 215.14 MS INVEST F-GLOBAL QAULITY (Z$) 753 821.44 894 415.63 10.38%
USD 7 504.75 SCHRODER ISF EM (C$-ACC) 124 223.39 118 456.83 1.38%
USD 2 634.00 SCHRODER ISF-GLB SUST GROWTH (C$-ACC) 472 846.20 571 918.13 6.64%
2 795 679.54 3 370 469.93 39.13%
Total Investments in Investment Funds 6 753 709.92 7 636 110.56 88.64%
Total Investments 6 753 709.92 7 636 110.56 88.64%
Portfolio breakdown
As at June 30, 2020
By countries
Luxembourg 75.92%
Ireland 13.84%
France 10.24%
Total 100.00%
By type of investments
Investment Funds 100.00%
Total 100.00%
The accompanying notes form an integral part of these financial statements. 15

(LF) Fund of Funds - Balanced Blend US
Schedule of investmentsAs at June 30, 2020
(All figures in Euros)
Cost Market % of Net
Currency Units Name Price Price Assets
Transferable securities admitted to an official exchange listing
Investment Funds
EUR 18 000.00 ISHARES BAR CAP US AGG BOND ETF 1 667 494.94 1 799 856.00 10.63%
EUR 1 700.00 ISHARES MSCI USA UCITS ETF 259 480.32 455 005.00 2.69%
EUR 600.00 POWERSHARES GLOBAL EQQQ NASDAQ 71 103.76 131 616.00 0.78%
1 998 079.02 2 386 477.00 14.08%
USD 480.00 AMUNDI FDS PIONEER US BD $ I2 1 075 131.33 1 160 221.47 6.85%
USD 59 274.39 AMUNDI FDS -US PIONEER (I$-ACC) 873 122.83 842 693.57 4.98%
USD 5 410.00 AMUNDI PIONEER STRATEGIC INC I2(C) 657 150.40 692 990.18 4.09%
USD 10 824.68 BNP PARIBAS BOND USD GOV CLASSIC MD 1 591 414.86 1 798 378.30 10.62%
USD 5 000.00 BNPP FLEXI I—US MORTGAGE BACKED FUND 474 260.09 510 760.85 3.02%
USD 7 435.18 BNPP US MULTI FACTOR EQUITY 1 082 454.68 1 015 348.51 5.99%
USD 23 937.65 FRANKLIN U.S. OPPORTUNITIES FUND (I$) 992 670.23 1 262 081.55 7.45%
USD 24 409.20 FTIF-FRANK MUT BEACON FUND (I$-ACC) 481 968.12 431 160.85 2.55%
USD 131 337.17 FTIF-FRANK US GOVERNMENT FUND (I$-ACC) 1 568 499.84 1 790 961.38 10.57%
USD 37 273.09 GOLDMAN SACHS US CORE 858 138.71 1 035 178.80 6.11%
USD 46 932.63 GS US EQUITY PORTFOLIO (I$-ACC) 714 772.70 921 636.42 5.44%
USD 5 553.73 INVESCO US VALUE EQUITY (C-$ACC) 229 249.59 202 052.86 1.19%
USD 13 204.54 MORGAN STANLEY US EQUITY GROWTH (Z$-ACC) 1 113 105.91 1 678 101.02 9.91%
USD 18 506.63 PIMCO GIS DIVERSIFIED INCOME INST USD 325 200.67 433 495.98 2.56%
12 037 139.96 13 775 061.74 81.36%
Total Investments in Investment Funds 14 035 218.98 16 161 538.74 95.44%
Total Investments 14 035 218.98 16 161 538.74 95.44%
Portfolio breakdown
As at June 30, 2020
By countries
Germany 11.14%
Ireland 7.56%
Luxembourg 81.29%
Total 100.00%
By type of investments
Investment Funds 100.00%
Total 100.00%
The accompanying notes form an integral part of these financial statements. 16
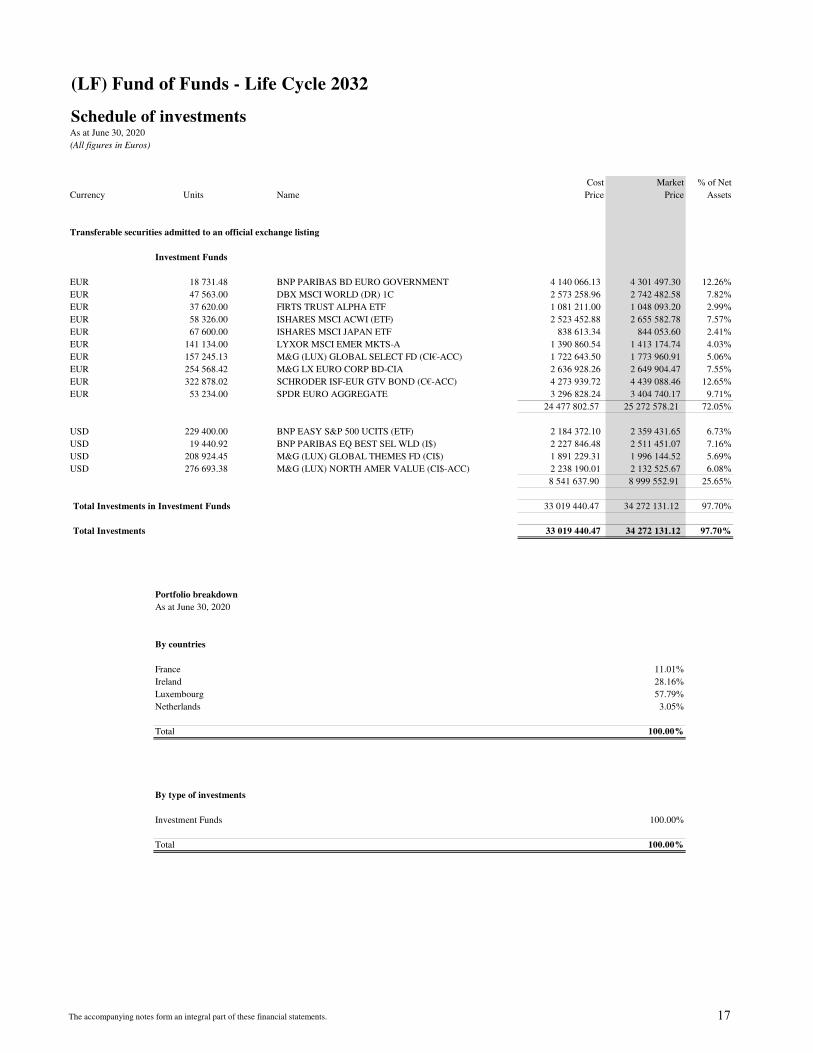
(LF) Fund of Funds - Life Cycle 2032
Schedule of investmentsAs at June 30, 2020
(All figures in Euros)
Cost Market % of Net
Currency Units Name Price Price Assets
Transferable securities admitted to an official exchange listing
Investment Funds
EUR 18 731.48 BNP PARIBAS BD EURO GOVERNMENT 4 140 066.13 4 301 497.30 12.26%
EUR 47 563.00 DBX MSCI WORLD (DR) 1C 2 573 258.96 2 742 482.58 7.82%
EUR 37 620.00 FIRTS TRUST ALPHA ETF 1 081 211.00 1 048 093.20 2.99%
EUR 58 326.00 ISHARES MSCI ACWI (ETF) 2 523 452.88 2 655 582.78 7.57%
EUR 67 600.00 ISHARES MSCI JAPAN ETF 838 613.34 844 053.60 2.41%
EUR 141 134.00 LYXOR MSCI EMER MKTS-A 1 390 860.54 1 413 174.74 4.03%
EUR 157 245.13 M&G (LUX) GLOBAL SELECT FD (CI€-ACC) 1 722 643.50 1 773 960.91 5.06%
EUR 254 568.42 M&G LX EURO CORP BD-CIA 2 636 928.26 2 649 904.47 7.55%
EUR 322 878.02 SCHRODER ISF-EUR GTV BOND (C€-ACC) 4 273 939.72 4 439 088.46 12.65%
EUR 53 234.00 SPDR EURO AGGREGATE 3 296 828.24 3 404 740.17 9.71%
24 477 802.57 25 272 578.21 72.05%
USD 229 400.00 BNP EASY S&P 500 UCITS (ETF) 2 184 372.10 2 359 431.65 6.73%
USD 19 440.92 BNP PARIBAS EQ BEST SEL WLD (I$) 2 227 846.48 2 511 451.07 7.16%
USD 208 924.45 M&G (LUX) GLOBAL THEMES FD (CI$) 1 891 229.31 1 996 144.52 5.69%
USD 276 693.38 M&G (LUX) NORTH AMER VALUE (CI$-ACC) 2 238 190.01 2 132 525.67 6.08%
8 541 637.90 8 999 552.91 25.65%
Total Investments in Investment Funds 33 019 440.47 34 272 131.12 97.70%
Total Investments 33 019 440.47 34 272 131.12 97.70%
%
Portfolio breakdown
As at June 30, 2020
By countries
France 11.01%
Ireland 28.16%
Luxembourg 57.79%
Netherlands 3.05%
Total 100.00%
By type of investments
Investment Funds 100.00%
Total 100.00%
The accompanying notes form an integral part of these financial statements. 17
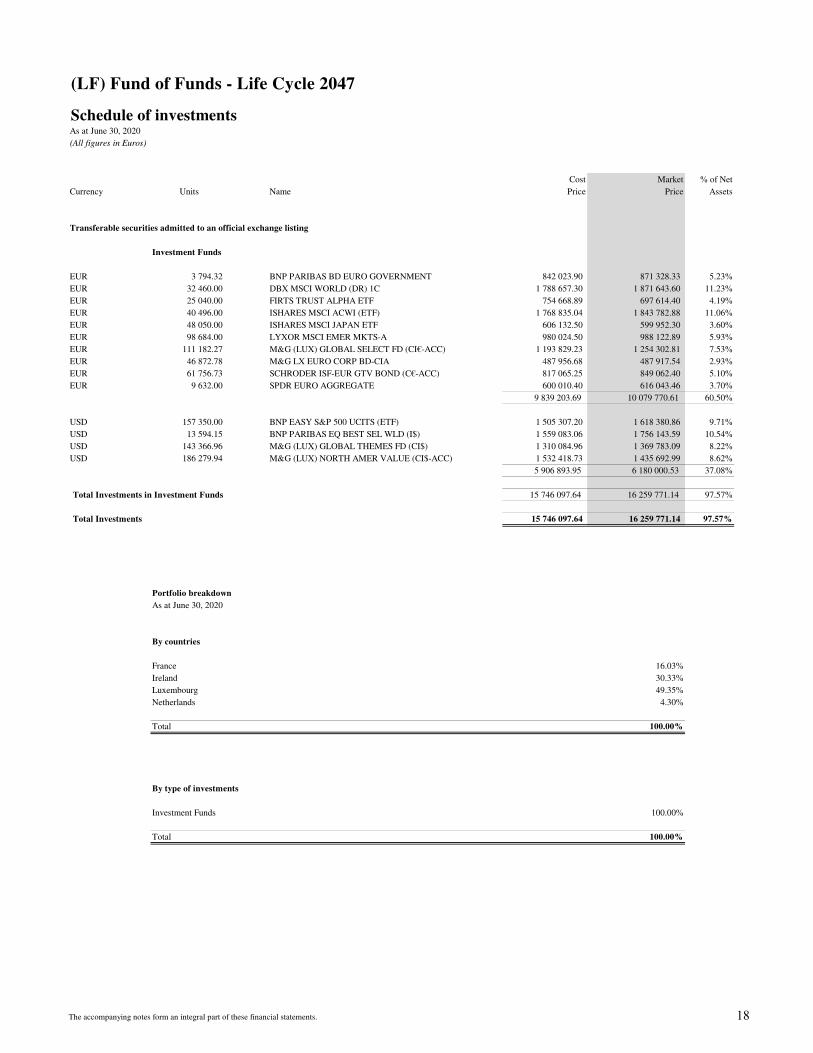
(LF) Fund of Funds - Life Cycle 2047
Schedule of investmentsAs at June 30, 2020
(All figures in Euros)
Cost Market % of Net
Currency Units Name Price Price Assets
Transferable securities admitted to an official exchange listing
Investment Funds
EUR 3 794.32 BNP PARIBAS BD EURO GOVERNMENT 842 023.90 871 328.33 5.23%
EUR 32 460.00 DBX MSCI WORLD (DR) 1C 1 788 657.30 1 871 643.60 11.23%
EUR 25 040.00 FIRTS TRUST ALPHA ETF 754 668.89 697 614.40 4.19%
EUR 40 496.00 ISHARES MSCI ACWI (ETF) 1 768 835.04 1 843 782.88 11.06%
EUR 48 050.00 ISHARES MSCI JAPAN ETF 606 132.50 599 952.30 3.60%
EUR 98 684.00 LYXOR MSCI EMER MKTS-A 980 024.50 988 122.89 5.93%
EUR 111 182.27 M&G (LUX) GLOBAL SELECT FD (CI€-ACC) 1 193 829.23 1 254 302.81 7.53%
EUR 46 872.78 M&G LX EURO CORP BD-CIA 487 956.68 487 917.54 2.93%
EUR 61 756.73 SCHRODER ISF-EUR GTV BOND (C€-ACC) 817 065.25 849 062.40 5.10%
EUR 9 632.00 SPDR EURO AGGREGATE 600 010.40 616 043.46 3.70%
9 839 203.69 10 079 770.61 60.50%
USD 157 350.00 BNP EASY S&P 500 UCITS (ETF) 1 505 307.20 1 618 380.86 9.71%
USD 13 594.15 BNP PARIBAS EQ BEST SEL WLD (I$) 1 559 083.06 1 756 143.59 10.54%
USD 143 366.96 M&G (LUX) GLOBAL THEMES FD (CI$) 1 310 084.96 1 369 783.09 8.22%
USD 186 279.94 M&G (LUX) NORTH AMER VALUE (CI$-ACC) 1 532 418.73 1 435 692.99 8.62%
5 906 893.95 6 180 000.53 37.08%
Total Investments in Investment Funds 15 746 097.64 16 259 771.14 97.57%
Total Investments 15 746 097.64 16 259 771.14 97.57%
%
Portfolio breakdown
As at June 30, 2020
By countries
France 16.03%
Ireland 30.33%
Luxembourg 49.35%
Netherlands 4.30%
Total 100.00%
By type of investments
Investment Funds 100.00%
Total 100.00%
The accompanying notes form an integral part of these financial statements. 18

(LF) Fund of Funds - Life Cycle 2042
Schedule of investmentsAs at June 30, 2020
(All figures in Euros)
Cost Market % of Net
Currency Units Name Price Price Assets
Transferable securities admitted to an official exchange listing
Investment Funds
EUR 56.75 BNP PARIBAS BD EURO GOVERNMENT 11 999.87 13 030.92 6.01%
EUR 360.00 DBX MSCI WORLD (DR) 1C 18 622.12 20 757.60 9.57%
EUR 50.00 ISHARES MCSI NORTH AMERICA 2 104.00 2 561.00 1.18%
EUR 455.00 ISHARES MSCI ACWI (ETF) 18 377.95 20 716.15 9.55%
EUR 135.00 LYX ETF MSCI WORLD 22 363.95 26 277.75 12.11%
EUR 540.00 LYXOR MSCI EMER MKTS-A 5 631.66 5 407.02 2.49%
EUR 587.98 M&G LX EURO CORP BD-CIA 6 061.96 6 120.47 2.82%
EUR 931.32 SCHRODER ISF-EUR GTV BOND (C€-ACC) 12 463.24 12 804.25 5.90%
EUR 205.00 SPDR EURO AGGREGATE 12 757.84 13 111.39 6.04%
110 382.59 120 786.55 55.68%
USD 1 000.00 HSBC MSCI WORLD UCITS (ETF) 18 817.59 19 636.32 9.05%
USD 170.00 SPDR ACWI (ETF) 19 358.19 20 716.38 9.55%
USD 120.00 SPDR GLOBAL REAL ESTATE (ETF) 4 325.67 3 196.64 1.47%
USD 545.00 VANGUARD FTSE ALL W HDY UCITS (ETF) 24 895.79 23 116.75 10.66%
USD 260.00 VANGUARD FTSE ALL WORLD UCITS (ETF) 17 734.77 20 035.18 9.24%
85 132.01 86 701.27 39.96%
Total Investments in Investment Funds 195 514.60 207 487.82 95.65%
Total Investments 195 514.60 207 487.82 95.65%
%
Portfolio breakdown
As at June 30, 2020
By countries
France 15.27%
Ireland 69.33%
Luxembourg 15.40%
Total 100.00%
By type of investments
Investment Funds 100.00%
Total 100.00%
The accompanying notes form an integral part of these financial statements. 19

(LF) Fund of Funds - Life Cycle 2052
Schedule of investmentsAs at June 30, 2020
(All figures in Euros)
Cost Market % of Net
Currency Units Name Price Price Assets
Transferable securities admitted to an official exchange listing
Investment Funds
EUR 270.00 DBX MSCI WORLD (DR) 1C 13 194.00 15 568.20 12.19%
EUR 80.00 ISHARES B EURO AGG BOND 9 754.40 10 206.00 7.99%
EUR 70.00 ISHARES MCSI NORTH AMERICA 2 945.60 3 585.40 2.81%
EUR 330.00 ISHARES MSCI ACWI (ETF) 13 101.90 15 024.90 11.76%
EUR 65.00 LYX ETF MSCI WORLD 11 188.45 12 652.25 9.91%
EUR 590.00 LYXOR MSCI EMER MKTS-A 6 144.85 5 907.67 4.63%
56 329.20 62 944.42 49.29%
USD 750.00 HSBC MSCI WORLD UCITS (ETF) 12 909.20 14 727.24 11.53%
USD 120.00 SPDR ACWI (ETF) 13 036.58 14 623.33 11.45%
USD 70.00 SPDR GLOBAL REAL ESTATE (ETF) 2 526.49 1 864.71 1.46%
USD 295.00 VANGUARD FTSE ALL W HDY UCITS (ETF) 13 013.29 12 512.74 9.80%
USD 190.00 VANGUARD FTSE ALL WORLD UCITS (ETF) 13 310.41 14 641.10 11.46%
54 795.97 58 369.12 45.71%
Total Investments in Investment Funds 111 125.17 121 313.54 94.99%
Total Investments 111 125.17 121 313.54 94.99%
Portfolio breakdown
As at June 30, 2020
By countries
France 15.30%
Ireland 84.70%
Total 100.00%
By type of investments
Investment Funds 100.00%
Total 100.00%
The accompanying notes form an integral part of these financial statements. 20

21
Notes to the financial statements
As at June 30, 2020
1. General
(LF) Fund of Funds (“the Fund”) is an open-ended investment fund and has been created on
September 18, 2006 as a mutual investment fund (“Fonds Commun de Placement”) organised under
Part I of the Luxembourg Law of December 17, 2010 relating to Undertakings for Collective
Investment (the “2010 Law”) as amended by the Directive 2014/91 (UCITS V).
The Fund is managed by Eurobank Fund Management Company (Luxembourg) S.A. (the
“Management Company”), a company incorporated under the laws of Luxembourg and having its
registered office in Luxembourg.
The Management Company may issue units in several classes (collectively “Classes” and each a
“Class”) in each Sub-Fund having: (i) a specific sales and redemption charge structure and/or (ii) a
specific management or advisory fee structure and/or (iii) different distribution, unitholder servicing
or other fees and/or (iv) different types of targeted investors or distribution channels and/or (v) a
different hedging structure and/or (vi) such other features as may be determined by the Board of
Directors of the Management Company from time to time.
As at June 30, 2020, 13 sub-funds are active.
The active classes of units are as follows:
Sub-Funds - Classes of Units Launched Date
(LF) Fund of Funds - Balanced Blend Europe - Eurobank 01/10/2014
(LF) Fund of Funds - Balanced Blend Europe - Eurobank I 14/10/2014
(LF) Fund of Funds - Balanced Blend Europe - Private Banking 04/12/2014
(LF) Fund of Funds - Equity Blend - Eurobank 18/09/2006
(LF) Fund of Funds - Equity Blend - Eurobank (USD) 20/09/2011
(LF) Fund of Funds - Equity Blend - Eurobank I 18/09/2006
(LF) Fund of Funds - Equity Blend - Interamerican 24/01/2019
(LF) Fund of Funds - Equity Blend - Private Banking 15/10/2014
(LF) Fund of Funds - Equity Blend - Postbank 18/12/2007
(LF) Fund of Funds - Equity Blend - Romania 14/12/2009
(LF) Fund of Funds - Equity Blend - Private Banking (USD) 21/05/2015
(LF) Fund of Funds - Global Emerging Markets - Eurobank 28/09/2007
(LF) Fund of Funds - Global Emerging Markets - Eurobank (USD) 20/09/2011
(LF) Fund of Funds - Global Emerging Markets - Eurobank I 21/09/2007
(LF) Fund of Funds - Global Emerging Markets - Private Banking 15/10/2014
(LF) Fund of Funds - Global Emerging Markets - Private Banking (USD) 04/02/2019
(LF) Fund of Funds - Global Emerging Markets - Interamerican 26/11/2007
(LF) Fund of Funds - Global Emerging Markets - Postbank 18/12/2007
(LF) Fund of Funds - Global Emerging Markets - Romania 12/10/2009
(LF) Fund of Funds - Balanced Blend Global - Eurobank 28/01/2008
(LF) Fund of Funds - Balanced Blend Global - Eurobank (USD) 20/09/2011
(LF) Fund of Funds - Balanced Blend Global - Eurobank I 03/03/2008
(LF) Fund of Funds - Balanced Blend Global - Interamerican 02/12/2015
(LF) Fund of Funds - Balanced Blend Global - Private Banking 14/10/2014
(LF) Fund of Funds - Balanced Blend Global - Private Banking (USD) 14/10/2014
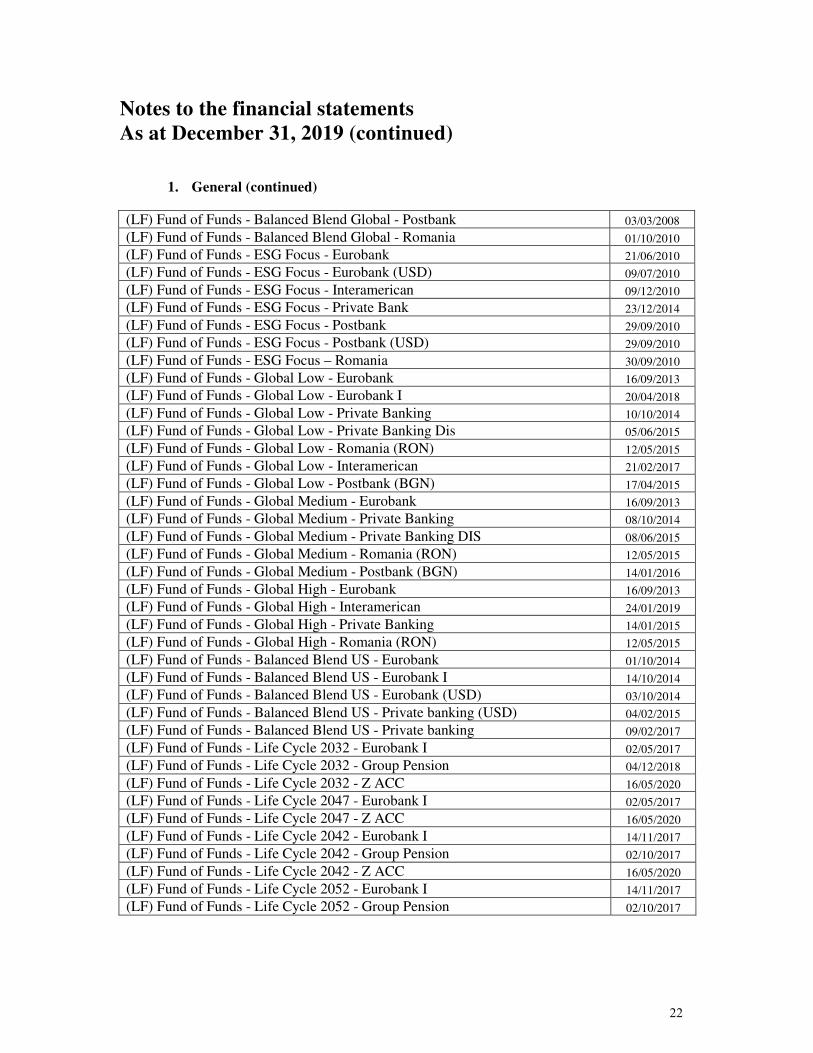
22
Notes to the financial statements
As at December 31, 2019 (continued)
1. General (continued)
(LF) Fund of Funds - Balanced Blend Global - Postbank 03/03/2008
(LF) Fund of Funds - Balanced Blend Global - Romania 01/10/2010
(LF) Fund of Funds - ESG Focus - Eurobank 21/06/2010
(LF) Fund of Funds - ESG Focus - Eurobank (USD) 09/07/2010
(LF) Fund of Funds - ESG Focus - Interamerican 09/12/2010
(LF) Fund of Funds - ESG Focus - Private Bank 23/12/2014
(LF) Fund of Funds - ESG Focus - Postbank 29/09/2010
(LF) Fund of Funds - ESG Focus - Postbank (USD) 29/09/2010
(LF) Fund of Funds - ESG Focus – Romania 30/09/2010
(LF) Fund of Funds - Global Low - Eurobank 16/09/2013
(LF) Fund of Funds - Global Low - Eurobank I 20/04/2018
(LF) Fund of Funds - Global Low - Private Banking 10/10/2014
(LF) Fund of Funds - Global Low - Private Banking Dis 05/06/2015
(LF) Fund of Funds - Global Low - Romania (RON) 12/05/2015
(LF) Fund of Funds - Global Low - Interamerican 21/02/2017
(LF) Fund of Funds - Global Low - Postbank (BGN) 17/04/2015
(LF) Fund of Funds - Global Medium - Eurobank 16/09/2013
(LF) Fund of Funds - Global Medium - Private Banking 08/10/2014
(LF) Fund of Funds - Global Medium - Private Banking DIS 08/06/2015
(LF) Fund of Funds - Global Medium - Romania (RON) 12/05/2015
(LF) Fund of Funds - Global Medium - Postbank (BGN) 14/01/2016
(LF) Fund of Funds - Global High - Eurobank 16/09/2013
(LF) Fund of Funds - Global High - Interamerican 24/01/2019
(LF) Fund of Funds - Global High - Private Banking 14/01/2015
(LF) Fund of Funds - Global High - Romania (RON) 12/05/2015
(LF) Fund of Funds - Balanced Blend US - Eurobank 01/10/2014
(LF) Fund of Funds - Balanced Blend US - Eurobank I 14/10/2014
(LF) Fund of Funds - Balanced Blend US - Eurobank (USD) 03/10/2014
(LF) Fund of Funds - Balanced Blend US - Private banking (USD) 04/02/2015
(LF) Fund of Funds - Balanced Blend US - Private banking 09/02/2017
(LF) Fund of Funds - Life Cycle 2032 - Eurobank I 02/05/2017
(LF) Fund of Funds - Life Cycle 2032 - Group Pension 04/12/2018
(LF) Fund of Funds - Life Cycle 2032 - Z ACC 16/05/2020
(LF) Fund of Funds - Life Cycle 2047 - Eurobank I 02/05/2017
(LF) Fund of Funds - Life Cycle 2047 - Z ACC 16/05/2020
(LF) Fund of Funds - Life Cycle 2042 - Eurobank I 14/11/2017
(LF) Fund of Funds - Life Cycle 2042 - Group Pension 02/10/2017
(LF) Fund of Funds - Life Cycle 2042 - Z ACC 16/05/2020
(LF) Fund of Funds - Life Cycle 2052 - Eurobank I 14/11/2017
(LF) Fund of Funds - Life Cycle 2052 - Group Pension 02/10/2017
23
Notes to the financial statements
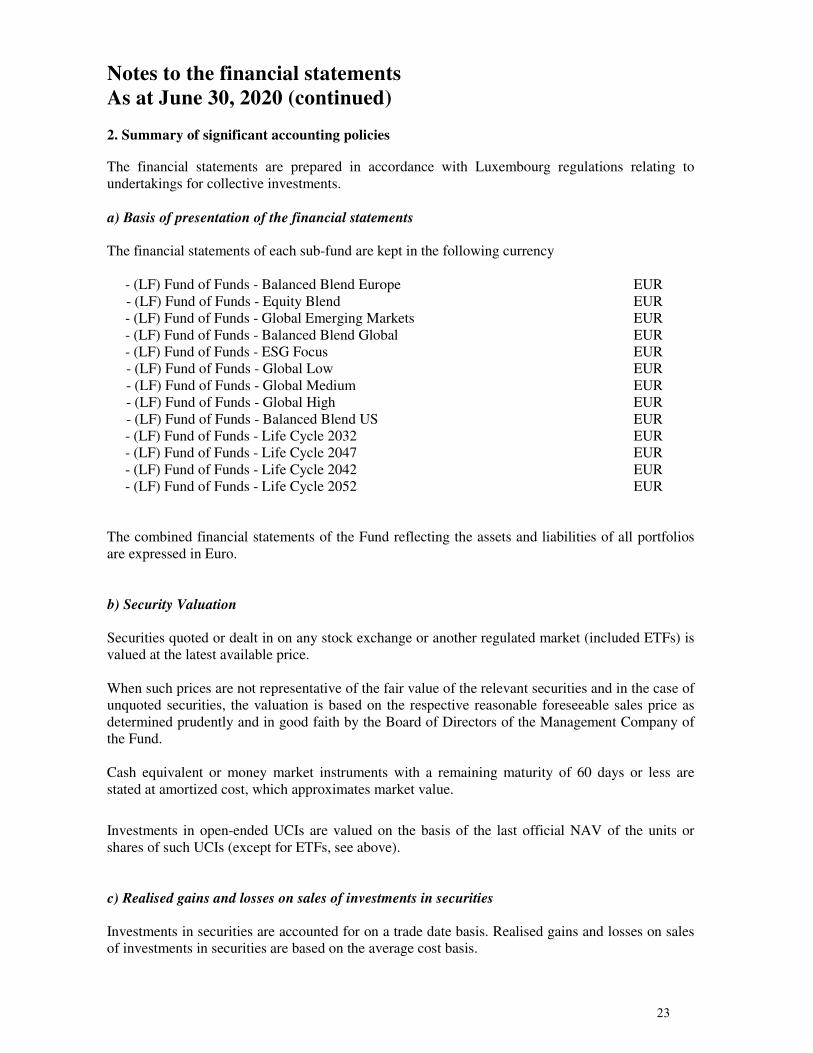
As at June 30, 2020 (continued)
2. Summary of significant accounting policies
The financial statements are prepared in accordance with Luxembourg regulations relating to
undertakings for collective investments.
a) Basis of presentation of the financial statements
The financial statements of each sub-fund are kept in the following currency
- (LF) Fund of Funds - Balanced Blend Europe EUR
- (LF) Fund of Funds - Equity Blend EUR
- (LF) Fund of Funds - Global Emerging Markets EUR
- (LF) Fund of Funds - Balanced Blend Global EUR
- (LF) Fund of Funds - ESG Focus EUR
- (LF) Fund of Funds - Global Low EUR
- (LF) Fund of Funds - Global Medium EUR
- (LF) Fund of Funds - Global High EUR
- (LF) Fund of Funds - Balanced Blend US EUR
- (LF) Fund of Funds - Life Cycle 2032 EUR
- (LF) Fund of Funds - Life Cycle 2047 EUR
- (LF) Fund of Funds - Life Cycle 2042 EUR
- (LF) Fund of Funds - Life Cycle 2052 EUR
The combined financial statements of the Fund reflecting the assets and liabilities of all portfolios
are expressed in Euro.
b) Security Valuation
Securities quoted or dealt in on any stock exchange or another regulated market (included ETFs) is
valued at the latest available price.
When such prices are not representative of the fair value of the relevant securities and in the case of
unquoted securities, the valuation is based on the respective reasonable foreseeable sales price as
determined prudently and in good faith by the Board of Directors of the Management Company of
the Fund.
Cash equivalent or money market instruments with a remaining maturity of 60 days or less are
stated at amortized cost, which approximates market value.
Investments in open-ended UCIs are valued on the basis of the last official NAV of the units or
shares of such UCIs (except for ETFs, see above).
c) Realised gains and losses on sales of investments in securities
Investments in securities are accounted for on a trade date basis. Realised gains and losses on sales
of investments in securities are based on the average cost basis.
24
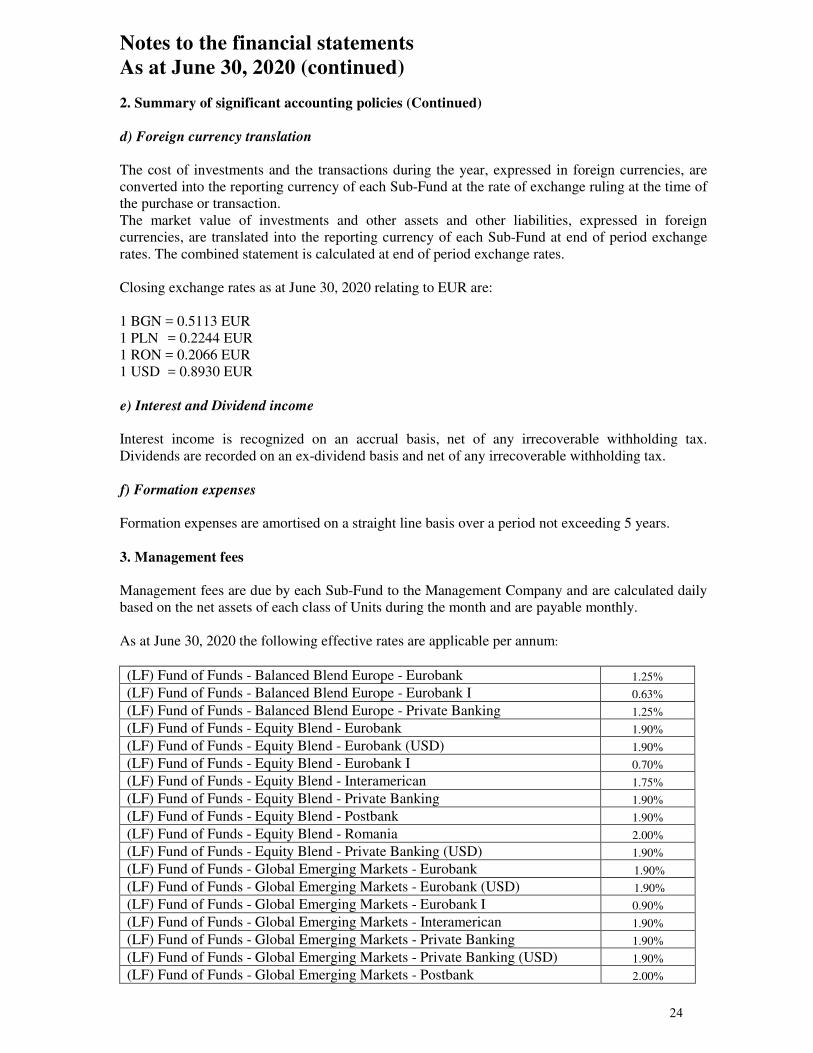
Notes to the financial statements
As at June 30, 2020 (continued)
2. Summary of significant accounting policies (Continued)
d) Foreign currency translation
The cost of investments and the transactions during the year, expressed in foreign currencies, are
converted into the reporting currency of each Sub-Fund at the rate of exchange ruling at the time of
the purchase or transaction.
The market value of investments and other assets and other liabilities, expressed in foreign
currencies, are translated into the reporting currency of each Sub-Fund at end of period exchange
rates. The combined statement is calculated at end of period exchange rates.
Closing exchange rates as at June 30, 2020 relating to EUR are:
1 BGN = 0.5113 EUR
1 PLN = 0.2244 EUR
1 RON = 0.2066 EUR
1 USD = 0.8930 EUR
e) Interest and Dividend income
Interest income is recognized on an accrual basis, net of any irrecoverable withholding tax.
Dividends are recorded on an ex-dividend basis and net of any irrecoverable withholding tax.
f) Formation expenses
Formation expenses are amortised on a straight line basis over a period not exceeding 5 years.
3. Management fees
Management fees are due by each Sub-Fund to the Management Company and are calculated daily
based on the net assets of each class of Units during the month and are payable monthly.
As at June 30, 2020 the following effective rates are applicable per annum:
(LF) Fund of Funds - Balanced Blend Europe - Eurobank 1.25%
(LF) Fund of Funds - Balanced Blend Europe - Eurobank I 0.63%
(LF) Fund of Funds - Balanced Blend Europe - Private Banking 1.25%
(LF) Fund of Funds - Equity Blend - Eurobank 1.90%
(LF) Fund of Funds - Equity Blend - Eurobank (USD) 1.90%
(LF) Fund of Funds - Equity Blend - Eurobank I 0.70%
(LF) Fund of Funds - Equity Blend - Interamerican 1.75%
(LF) Fund of Funds - Equity Blend - Private Banking 1.90%
(LF) Fund of Funds - Equity Blend - Postbank 1.90%
(LF) Fund of Funds - Equity Blend - Romania 2.00%
(LF) Fund of Funds - Equity Blend - Private Banking (USD) 1.90%
(LF) Fund of Funds - Global Emerging Markets - Eurobank 1.90%
(LF) Fund of Funds - Global Emerging Markets - Eurobank (USD) 1.90%
(LF) Fund of Funds - Global Emerging Markets - Eurobank I 0.90%
(LF) Fund of Funds - Global Emerging Markets - Interamerican 1.90%
(LF) Fund of Funds - Global Emerging Markets - Private Banking 1.90%
(LF) Fund of Funds - Global Emerging Markets - Private Banking (USD) 1.90%
(LF) Fund of Funds - Global Emerging Markets - Postbank 2.00%

25
Notes to the financial statements
As at June 30, 2020 (continued)
3. Management fees (continued)
(LF) Fund of Funds - Global Emerging Markets - Romania 2.50%
(LF) Fund of Funds - Balanced Blend Global - Eurobank 1.25%
(LF) Fund of Funds - Balanced Blend Global - Eurobank I 0.63%
(LF) Fund of Funds - Balanced Blend Global - Eurobank USD 1.25%
(LF) Fund of Funds - Balanced Blend Global - Interamerican 1.25%
(LF) Fund of Funds - Balanced Blend Global - Private Banking 1.25%
(LF) Fund of Funds - Balanced Blend Global - Private Banking (USD) 1.25%
(LF) Fund of Funds - Balanced Blend Global - Postbank 1.25%
(LF) Fund of Funds - Balanced Blend Global - Romania 1.50%
(LF) Fund of Funds - ESG Focus - Eurobank 1.75%
(LF) Fund of Funds - ESG Focus - Eurobank (USD) 1.75%
(LF) Fund of Funds - ESG Focus - Private Bank 1.75%
(LF) Fund of Funds - ESG Focus - Postbank 1.75%
(LF) Fund of Funds - ESG Focus - Postbank (USD) 1.75%
(LF) Fund of Funds - ESG Focus - Romania 1.50%
(LF) Fund of Funds - ESG Focus - Interamerican 1.50%
(LF) Fund of Funds - Global Low - Eurobank 0.75%
(LF) Fund of Funds - Global Low - Eurobank I 0.25%
(LF) Fund of Funds - Global Low - Private Banking 0.75%
(LF) Fund of Funds - Global Low - Interamerican 0.75%
(LF) Fund of Funds - Global Low - Private banking DIS 0.75%
(LF) Fund of Funds - Global Low - Romania (RON) 0.75%
(LF) Fund of Funds - Global Low - Postbank (BGN) 0.75%
(LF) Fund of Funds - Global Medium - Eurobank 1.00%
(LF) Fund of Funds - Global Medium - Private Banking 1.00%
(LF) Fund of Funds - Global Medium - Private Banking DIS 1.00%
(LF) Fund of Funds - Global Medium - Romania (RON) 1.00%
(LF) Fund of Funds - Global Medium - Postbank (BGN) 1.00%
(LF) Fund of Funds - Global High - Eurobank 1.25%
(LF) Fund of Funds - Global High - Interamerican 1.25%
(LF) Fund of Funds - Global High - Private Banking 1.25%
(LF) Fund of Funds - Global High - Romania (RON) 1.25%
(LF) Fund of Funds - Balanced Blend US - Eurobank 1.25%
(LF) Fund of Funds - Balanced Blend US - Eurobank I 0.63%
(LF) Fund of Funds - Balanced Blend US - Eurobank (USD) 1.25%
(LF) Fund of Funds - Balanced Blend US - Private Banking 1.25%
(LF) Fund of Funds - Balanced Blend US - Private Banking (USD) 1.25%
(LF) Fund of Funds - Life Cycle 2032 - Eurobank I 0.50%
(LF) Fund of Funds - Life Cycle 2032 - Group Pension 0.50%
(LF) Fund of Funds - Life Cycle 2032 - Z ACC 0.90%
(LF) Fund of Funds - Life Cycle 2047 - Z ACC 0.90%
(LF) Fund of Funds - Life Cycle 2047 - Eurobank I 0.50%
(LF) Fund of Funds - Life Cycle 2042 - Eurobank I 0.01%
(LF) Fund of Funds - Life Cycle 2042 - Group Pension 0.50%
(LF) Fund of Funds - Life Cycle 2042 - Z ACC 0.90%
(LF) Fund of Funds - Life Cycle 2052 - Eurobank I 0.01%
(LF) Fund of Funds - Life Cycle 2052 - Group Pension 0.50%
26
Notes to the financial statements
As at June 30, 2020 (continued)
3. Management fees (continued)
Subscription, redemption and conversion fees payable to distributors are not included in the
management fee. The Management Company shall pay, out of the management fees and expenses:
- the fees and expenses due to the investment manager and any granted sub-investment manager;
- the fees and expenses due to the distributors.
Management fees may be charged at both levels (the Sub-Fund and target UCITS/UCIs) but the
aggregate amount of management fees on the portion of assets invested in target UCITS/UCIs will
not exceed 4% p.a. of the net assets.
4. Depositary fees
In consideration for its services, the Depositary is entitled to receive out of the assets of the relevant
Sub-Fund a fee (the “Depositary Fee”) payable at the end of each month in arrears at an annual rate
not exceeding the percentage amount indicated in the Appendix of the Prospectus relevant to each
Sub-Fund (up to 0.50% p.a). This percentage amount will be calculated on a daily basis on the Net
Asset Value of that day of the relevant Class over the period by reference to which the fee is
calculated. The Depositary may also receive transaction-based fees.
5. Administrative fees and Registrar Agent
The Administrative Agent fee is payable at the end of each month in arrears at an annual rate not
exceeding the percentage amount indicated in the Appendix relevant to each Sub-Fund (up to
0.10% p.a). This percentage amount will be calculated on a daily basis on the Net Asset Value of
that day of the relevant Class over the period by reference to which the fee is calculated.
The Registrar Agent fee is a flat amount payable yearly and calculated on a prorata basis of the Net
Asset Value of each sub-fund.
6. Taxation
The Fund is liable in Luxembourg to an annual tax (the "taxe d'abonnement") of 0.05%, calculated
and payable quarterly, on the aggregate Net Asset Value of the outstanding units of the Fund at the
end of each quarter. This annual tax is however reduced to 0.01% on the aggregate Net Asset Value
of the units in the Classes reserved to institutional investors as well as in Sub-Funds that invest
exclusively in certain short-term transferable debt securities and other instruments pursuant to the
Grand-Ducal Regulation of April 14, 2004.
This rate is reduced to 0% for the portion of the assets of the Fund invested in other Luxembourg
undertakings for collective investment already submitted to an annual tax.
No tax is payable in Luxembourg on realised or unrealised capital appreciation of the assets of the
Fund.
27
Notes to the financial statements
As at June 30, 2020 (continued)
7. Brokerage and transaction fees
Transaction fees incurred by the Fund relating to purchase or sale of transferable securities, money
market instruments, derivatives or other eligible assets are mainly composed of Broker Fees,
Transfer Fee, Stock Exchange Fee.
For purchase or sale of bonds, the remuneration of the broker is represented by a bid-offer spread
which cannot be easily retrieved from the accounting system. Therefore, this bid-offer spread is not
included in the transaction fees but is included in the acquisition cost of purchased securities and
implicitly deducted from the net proceeds of the securities sold.
8. Statement of changes in investments
A list, for each Sub-Fund, specifying for each investment the total purchases and sales which
occurred during the year under review, may be obtained free of charge, upon request, at the
Registered Office of the Management Company.
9. Transparency of securities financing transactions and their reuse
No securities financing transactions or total return swaps within the meaning of Regulation (EU)
2015/2365 of the European Parliament and of the Council of 25 November 2015 on transparency
of securities financing transactions and of reuse and amending Regulation (EU) No 648/2012
("SFTR") were used in the investment fund's financial year. As a result, no disclosures within the
meaning of Article 13 of said Regulation need to be made to investors in the annual report.
10. Subsequent event
Beginning in January 2020, global financial markets have experienced and may continue to
experience significant volatility resulting from the spread of a novel coronavirus knows as COVID-
19. The outbreak of COVID-19 has resulted in travel and border restrictions, quarantines, supply
chain disruptions, lower consumer demand and general market uncertainty. The effects of COVID-
19 have and may continue to adversily affect the global economy, the economies of certain nations
and individual issuers, all of which may negatively impact the Fund's performance.