bank supervision annual report 2016 - … · a bank supervision 2016 1 bank supervision annual...
TRANSCRIPT
C E N T R A L B A N K O F K E N Y ABANK SUPERVISION ANNUAL REPORT 2016
1
BANK SUPERVISIONANNUAL REPORT 2016
SUPERVISORY FRAMEWORKREGIONAL AND INTERNATIONAL DEVELOPMENTS AND INITIATIVES
MACROECONOMIC CONDITIONS AND BANKING SECTOR PERFORMANCE
BANKING SECTOR PERFORMANCE
Risks Loans and AdvancesMarket Share
Distribution of Foreign Exchange Bureaus
Regional Economy
Domestic EconomyInterest RatesProfit and Loss
Liquidity Credit Report
LiquidityAsset Quality
Performance Rating COMESA
MACROECONOMIC CONDITIONS
DEVELOPMENTS
Bureaus


C E N T R A L B A N K O F K E N Y ABANK SUPERVISION ANNUAL REPORT 2016
III
VISION STATEMENT VII
THE BANK’S MISSION VII
MISSION OF BANK SUPERVISION DEPARTMENT VII
THE BANK’S CORE VALUES VII
GOVERNOR’S MESSAGE VIII
FOREWORD BY DIRECTOR, BANK SUPERVISION IX
CHAPTER ONESTRUCTURE OF THE BANKING SECTOR
1.1 The Banking Sector 2
1.2 Ownership and Asset Base of Commercial Banks 4
1.3 Distribution of Commercial Banks Branches 5
1.4 Commercial Banks Market Share Analysis 5
1.5 Automated Teller Machines (ATMs) 7
1.6 Asset Base of Microfinance Banks 8
1.7 Microfinance Banks Market Share Analysis 8
1.8 Distribution of Foreign Exchange Bureaus 9
CHAPTER TWODEVELOPMENTS IN THE BANKING SECTOR
2.1 Introduction 12
2.2 Developments in Information and Communication Technology 12
2.3 Financial Inclusion and Policy Development Initiatives 13
2.4 Money Remittance Providers 14
2.5 Agency Banking 15
2.6 New Products 17
2.7 Operations of Representative Offices of Authorized Foreign Financial Institutions 17
2.8 Residential Mortgages Market Survey 2016 18
2.9 Employment Trend in the Banking Sector 20
2.10 Future Outlook 20
CHAPTER THREEMACROECONOMIC CONDITIONS AND BANKING SECTOR PERFORMANCE
3.1 Global Economic Conditions 22
3.2 The Regional Economy 24
3.3 The Domestic Economy 24
3.4 Inflation 24
3.5 Exchange Rates 24
3.6 Interest Rates 26
3.7 Balance of Payments 26
TABLE OF CONTENTS

C E N T R A L B A N K O F K E N Y ABANK SUPERVISION ANNUAL REPORT 2016
IV
3.8 Domestic Economic Outlook for 2016 26
3.9 Performance of the Banking Sector 26
3.10 Commercial Banks Balance Sheet Analysis 27
3.11 Sectoral Distribution of Gross Loans, Loan Accounts and Gross Non-Performing Loans 27
3.12 Asset Quality 28
3.13 Risk Classification of Loans and Advances 29
3.14 Capital Adequacy 30
3.15 Liquidity 30
3.16 Profit and Loss 30
3.17 Performance Rating 31
3.18 Compliance with Supervisory and Regulatory Requirements 32
3.19 Performance of Microfinance Banks 33
3.20 Credit Reference Bureaus Reports 33
CHAPTER FOURDEVELOPMENTS IN SUPERVISORY FRAMEWORK
4.1 Introduction 37
4.2 Banking Act Amendments 37
4.3 Host County Assessments 38
4.4 Banking (Amendment) Act, 2016 38
4.5 Developments in Anti-Money Laundering and Combating Financing of Terrorism 38
CHAPTER FIVEREGIONAL AND INTERNATIONAL DEVELOPMENTS AND INITIATIVES
5.1 Introduction 415.2 Regional and International Initiatives
• Monetary Affairs Committee • East African Monetary Union• COMESA • ESAAMLG• Alliance for Financial Inclusion • Financial Stability Board Regional Consultative Group • IMF’s East Africa Technical Assistance Centre (East-AFRITAC)• African Rural and Agricultural Credit Association (AFRACA)• Bank Supervision Application (BSA) • Knowledge Exchanges• Memorandum of Understanding
41
5.3 Kenyan Banks Regional Footprint 48
TABLES 1 Ownership and Asset Base of Commercial Banks 4
2 Commercial Banks Market Share Analysis 5
3 ATM Networks 7
TABLE OF CONTENTS

C E N T R A L B A N K O F K E N Y ABANK SUPERVISION ANNUAL REPORT 2016
V
4 Microfinance Banks Balance Sheet Analysis 8
5 Microfinance Banks Market Share Analysis 9
6 Distribution of Foreign Exchange Bureaus 10
7 Growth of Deposits Account Holders compared to Number of Staff 13
8 Distribution of MRP Agents 14
9a Type, Number of Transactions undertaken through Agent Banking 15
9b Type, Values of Transactions undertaken through Agent Banking 17
10 Residential Mortgage Market Survey, 2016 19
11 Employment in the Banking Sector 20
12 Global Economic Outlook 23
13 Exchange Rate Developments 24
14 Developments in the Balance of Payment 25
15 Global Balance Sheet Analysis 27
16 Sectoral Distribution of Loans, Loan Accounts and NPLs 28
17 Asset Quality and Provisions 28
18 Risk Classification of Loans and Advances 29
19 Capital Adequacy Ratios 30
20 Income and Expenditure Items as a Percentage of Total Income/ Total Expenses 31
21 Banking Sector Performance Rating 32
22 Performance of Microfinance Banks 33
23 Number of Credit Reports Requested Since August 2010 34
24 Knowledge Exchanges undertaken in 2016 47
25 Branches of Kenyan Banks Subsidiaries in the Region 48
CHARTS 1 Structure of the Banking Sector 2
2 Bank Supervision Organogram 4
3 Ownership and Asset Base of Commercial Banks 5
4 Commercial Banks Market Share 6
5 Financial Access Strand Over The Year 13
6 Risk Classification of Loans and Advances 29
7 Total Monthly Credit Report Requests 35
APPENDICES i Banking Sector Balance Sheet 50
ii Banking Sector Profit & Loss Account 51
iii Banking Sector Other Disclosures 52
iv Banking Sector Market Share 53
v Banking Sector Profitability 54
TABLE OF CONTENTS

OUR VALUES
OUR MISSIONOUR VISION
CommitmentProfessionalism and Relevance
Innovativeness
Mutual Respect and Teamwork: Diversity and Inclusiveness:
The Vision of the Bank is “To be a World Class
Modern Central Bank.”
The Board and staff are committed to implementing the Bank’s mandate as
stipulated in the Constitution of Kenya and the CBK Act.
Efficiency & Effectiveness
Transparency,Accountability and Integrity:
The Bank will at all times undertake its operations in the most cost efficient
and effective manner while maintaining high standards of performance in
execution of its mandate.
The Board and staff will always act in a transparent and accountable manner
when handling all the affairs of the Bank both internally and with external
parties so as to uphold the Bank’s image at all times. In addition, the Bank
will uphold high standards of ethics, integrity and honesty as guided by the
Constitution, act in an ethical manner as guided by the Leadership and Integrity Act and the Public Officers’ Ethics Act,
and observe high moral standards.
The Board and staff will always endeavour to offer quality services to its internal and external customers, diligently observing high professional standards at all times and respecting the rules and regulations set by the Bank. All initiatives and activities undertaken remain relevant to the Bank’s strategic objectives in pursuit of its core mandate.
The Bank will encourage, nurture and support creativity and the development of new ideas and processes for the continued improvement of organisational performance.
Mutual respect shall at all times be observed internally amongst colleagues and when dealing with the Bank’s external clients. In addition, the Board and staff will cooperate and collaborate to enhance performance and create a healthy work environment.
The Bank appreciates and embraces the differences in its employees’ skills sets and abilities and encourages consultations and inclusiveness in pursuit of its mandate across departments. This is aimed at maximising productivity and enhancing the Bank’s overall performance.
To formulate and implement monetary policy for price stability, foster a stable market-based financial system and ensure a sound national payment system.
C E N T R A L B A N K O F K E N Y ABANK SUPERVISION ANNUAL REPORT 2016
VI
vi Banking Sector Gross Loans and Non-Performing Loans (NPLs) 55
vii Banking Sector Capital and Risk Weighted Assets 56
viii Banking Sector Access to Financial Services 57
ix Banking Sector Protected Deposits 58
x Microfinance Banks Balance Sheet 59
xi Microfinance Banks Profit & Loss Account 60
xii Microfinance Banks Other Disclosures 61
xiii Residential Mortgages Market Development Survey, December 2016 62
xiv Banking Circulars Issued in 2016 63
xv A Summary of Signed MOUs 64
xvi Banks Branch Network by County 65
xvii Directory of Commercial Banks and Non-Banks 66
xviii Directory of the Microfinance Banks 78
xix Directory of Credit Reference Bureaus 81
xx Directory of Foreign Exchange Bureaus 82
xxi Directory of Money Remittance Providers 91
TABLE OF CONTENTS

OUR VALUES
OUR MISSIONOUR VISION
CommitmentProfessionalism and Relevance
Innovativeness
Mutual Respect and Teamwork: Diversity and Inclusiveness:
The Vision of the Bank is “To be a World Class
Modern Central Bank.”
The Board and staff are committed to implementing the Bank’s mandate as
stipulated in the Constitution of Kenya and the CBK Act.
Efficiency & Effectiveness
Transparency,Accountability and Integrity:
The Bank will at all times undertake its operations in the most cost efficient
and effective manner while maintaining high standards of performance in
execution of its mandate.
The Board and staff will always act in a transparent and accountable manner
when handling all the affairs of the Bank both internally and with external
parties so as to uphold the Bank’s image at all times. In addition, the Bank
will uphold high standards of ethics, integrity and honesty as guided by the
Constitution, act in an ethical manner as guided by the Leadership and Integrity Act and the Public Officers’ Ethics Act,
and observe high moral standards.
The Board and staff will always endeavour to offer quality services to its internal and external customers, diligently observing high professional standards at all times and respecting the rules and regulations set by the Bank. All initiatives and activities undertaken remain relevant to the Bank’s strategic objectives in pursuit of its core mandate.
The Bank will encourage, nurture and support creativity and the development of new ideas and processes for the continued improvement of organisational performance.
Mutual respect shall at all times be observed internally amongst colleagues and when dealing with the Bank’s external clients. In addition, the Board and staff will cooperate and collaborate to enhance performance and create a healthy work environment.
The Bank appreciates and embraces the differences in its employees’ skills sets and abilities and encourages consultations and inclusiveness in pursuit of its mandate across departments. This is aimed at maximising productivity and enhancing the Bank’s overall performance.
To formulate and implement monetary policy for price stability, foster a stable market-based financial system and ensure a sound national payment system.
C E N T R A L B A N K O F K E N Y ABANK SUPERVISION ANNUAL REPORT 2016
VII
MISSION OF BANK SUPERVISION DEPARTMENTTo promote and maintain the safety, soundness and integrity of the banking system through the implementation of policies and standards that are in line with international best practice for bank supervision and regulation.
C E N T R A L B A N K O F K E N Y ABANK SUPERVISION ANNUAL REPORT 2016
VIII
The year 2016 was a historic milestone for the banking sector in general and the Central Bank of Kenya (CBK) in particular. CBK marked 50 years of its existence and also as Kenya’s banking sector regulator. The past 50 years have been a period of profound change and transformation in financial markets. It has also been a period of considerable learning for CBK in its efforts to adjust to the rapid market changes and to shape regulatory policy.
In 2016, the banking sector demonstrated continued resilience both in its domestic and regional operations, with the industry’s total asset base growing by approximately 5.8 percent to KShs 3.7 trillion from KShs 3.5 trillion in 2015. The sector’s equity base also grew by 10.5 percent to KShs 598 billion in 2016 from KShs 541 billion in 2015. This performance was registered against significant macro-economic challenges in the domestic and international environment, with Kenya’s GDP growing at 5.8 percent in 2016. Domestically, enhanced activity was recorded in the housing, Information Communication and Technology (ICT) and tourism sectors. The construction sector also recorded growth, driven largely by continued public sector investments. In 2016, CBK moved towards a ‘new normal’ in its supervisory approach, one based on three pillars: transparency, governance and effective business models. Towards this objective, CBK worked with the banking industry to enhance and clarify regulatory guidance on key areas including enhanced disclosure, improvement of asset quality, governance and integrity of ICT systems. To strengthen the capital adequacy assessment framework for banks, CBK issued guidance on implementation of the Internal Capital Adequacy Assessment Process (ICAAP).
CBK’s supervisory vision for the banking sector is underpinned by three main elements:- • Market-driven consolidation: facilitating business combinations driven by the strategic and commercial imperatives of market
participants. Stronger business models for banks: Enhancement of banks’ value propositions through
streamlining business lines and diversifying funding sources to strengthen risk management and long-term sustainability. Ultimately, the objective of stronger business models is to boost the resilience and stability of individual institutions and the banking sector as a whole.Fostering transparency in lending practices: Working with the banking sector, CBK was in 2016 engaged in the implementation of several policy initiatives aimed at improving lending
practices and enhancing affordability of credit. These focused largely on enhancing public disclosures on pricing of credit by institutions to empower consumers in decision-
making, and strengthening mechanisms for handling customer grievances.
In a bid to enhance the cost and availability of credit, the Government implemented legislative reforms aimed at achieving credit pricing transparency which
culminated in the passing of the Banking (Amendment) Act, 2016. The Act, which came into force with effect from September 2016, imposed limits on the interest rates chargeable by commercial banks on credit facilities and the rates payable
on customer deposits respectively, with a view to influencing the overall cost of credit and enhancing access. As the banking sector regulator, CBK continues
to closely monitor the impact of the Banking (Amendment) Act, 2016 as banks adjust their business models.
As a supervisory authority, CBK’s overriding objective remains the maintenance of the stability of the Kenyan financial system and the
protection of depositors. Looking forward, CBK will continue to diligently execute its financial stability mandate. In support of this, CBK will promote an inclusive, sound and efficient banking sector that will in turn contribute towards Kenya’s aspiration of being a premier regional financial services hub.
DR. PATRICK NJOROGEGOVERNOR
GOVERNOR’S MESSAGE

C E N T R A L B A N K O F K E N Y ABANK SUPERVISION ANNUAL REPORT 2016
IX
The Kenyan banking sector registered a robust performance in 2016. The gross loans increased from KShs 2.17 trillion in December 2015 to KShs 2.29 trillion in December 2016. Some of the economic sectors that received the highest growth in demand for credit in 2016 were Personal/Household, Trade, Real Estate and Manufacturing.
The key highlights of the sector’s financial performance were:-
• Total net assets grew by 5.8 percent from KShs 3.5 trillion in December 2015 to KShs 3.7 trillion in December 2016, with the growth being supported by the increase in loans and advances.
• Gross loans increased by 5.6 percent from KShs 2.17 trillion in December 2015 to KShs. 2.229 trillion in December 2016. The growth in loans is attributed to increased demand for credit by the various economic sectors.
• Customer deposits increased by 5.3 percent from Kshs 2.49 trillion in December 2015 to KShs 2.62 trillion in December 2016. The growth was supported by mobilization of deposits through agency banking and mobile phone platforms.
• The pre-tax profit for the sector increased by 10.91 percent from KShs 134.0 billion in December 2015 to KShs 147.4 billion in December 2016. The increase in profitability was attributed to a higher increase in income compared to the rise in expenses. The banks income increased by 5.7 percent in 2016 whereas expenses increased by 3.8 percent over the same period.
• The average liquidity ratio as at December 2016 stood at 40.3 percent as compared to 38.1 percent registered in December 2015. The increase in the ratio is mainly attributed to a higher growth in total liquid assets compared to the growth in total short-term liabilities. Total liquid assets grew by 12.1 percent while total short-term liabilities grew by 5.7 percent. The banking sector’s average liquidity in the twelve months to December 2016 was above the statutory minimum requirement of 20 percent.
The ratio of gross non-performing loans to gross loans increased from 6.8 percent in December 2015 to 9.2 percent in December 2016. The increase in non-performing loans in 2016 was mainly attributable to a challenging business environment.
The Central Bank Prudential Guideline on Capital Adequacy requires banks to adhere to the prescribed capital adequacy prudential ratios. The minimum regulatory capital adequacy ratios, that are measured by the ratio of Core Capital and Total Capital to Total Risk Weighted Assets, are 10.5 percent and 14.5 percent respectively. The Core Capital to Total Risk Weighted Assets ratios remained at an average of 16 percent in 2015 and 2016. Also, the Total Capital to Total Risk Weighted Assets ratio remained at an average of 19 percent in 2015 and 2016. CBK issued a Guidance Note on Internal Capital Adequacy Assessment Process (ICAAP) in November 2016 to all commercial banks and mortgage finance companies for reference in preparing or revising their ICAAP documents. The revised ICAAP’s are expected to be submitted to CBK by end of April 2017.
Further, CBK adopted a Risk Based Supervisory Framework for Anti-Money Laundering and Countering Financing of Terrorism (AML/CFT). The framework will complement prudential supervision and legal compliance with special attention directed to anti-money laundering and combating financing of terrorism.
The banking sector is projected to remain stable and sustain its growth momentum in 2017 as the outcomes of various reforms and initiatives in the banking sector start to manifest. Some of the reforms and initiatives planned include:-
• Enhancement of transparency in cost of credit through introduction of disclosure models.
• Strengthening of the credit information sharing mechanisms. • Review of the legal and supervisory framework for Islamic
Banking.• Enhancement of AML/CFT risk assessment by banks.
GERALD NYAOMADIRECTOR, BANK SUPERVISION DEPARTMENT
FOREWORD BY DIRECTOR, BANK SUPERVISION

C E N T R A L B A N K O F K E N Y ABANK SUPERVISION ANNUAL REPORT 2016
1
STRUCTURE OF THE BANKING SECTOR
C E N T R A L B A N K O F K E N Y ABANK SUPERVISION ANNUAL 2016
1
CHAPTER 1

C E N T R A L B A N K O F K E N Y ABANK SUPERVISION ANNUAL REPORT 2016
2
1.1 The Banking Sector
As at 31st December 2016, the Kenyan banking sector comprised of the Central Bank of Kenya, as the regulatory authority, 43 banking institutions (42)1 commercial banks and 1 mortgage finance company), 8 representa tive offices of foreign banks, 13 Microfinance Banks (MFBs), 3 credit reference bureaus (CRBs), 17 Money Remittance Providers (MRPs) and 77 foreign exchange (forex) bu reaus. Out of the 43 banking institutions, 40 were privately owned while the Kenya Government had majority ownership in 3 institutions. Of the 40 privately owned banks, 25 were
locally owned (the controlling shareholders are domiciled in Kenya) while 15 were foreign-owned (many having minority shareholding).
The 25 locally owned institutions comprised 24 commercial banks and 1 mortgage financial institution. Of the 15 foreign-owned institutions, all commercial banks, 11 were local subsidiaries of foreign banks while 4 were branches of foreign banks. All licensed microfinance banks, credit reference bureaus, forex bureaus and money remittance providers were privately owned. Chart I below depicts the structure of the banking sector as at 31st December 2016.
STRUCTURE OF THE BANKING SECTOR
1. Charterhouse Bank Limited is under Statutory Management while Imperial Bank Ltd and Chase Bank of Kenya Ltd are In Receivership.
Chart 1: Structure of the Banking Sector - December 2016

C E N T R A L B A N K O F K E N Y ABANK SUPERVISION ANNUAL REPORT 2016
3
STRUCTURE OF THE BANKING SECTOR
Bank Supervision Department
The Bank Supervision Department (BSD)’s mandate as stipulated under section 4(2) of the Central Bank of Kenya Act is to foster liquidity, solvency and proper functioning of a stable market-based financial system. The following are the main functions of BSD: -
i. Development of legal and regulatory frameworks to foster stability, efficiency and access to financial services. The Department achieves this objective through:-
ii. • Continuous review of the Banking Act, Microfinance
Act, Building Societies Act, Regulations and Guidelines issued thereunder which lay the legal foundation for banking institutions, non-bank financial institutions, deposit taking microfinance institutions and building societies.
• Continuous review of Regulations and Guidelines for Foreign Exchange Bureaus licensed under the Central Bank of Kenya Act.
• Continuous review of Regulations for Credit Reference Bureaus licensed under the Banking Act.
iii. Processing licenses of Commercial Banks, Non-Bank Financial Institutions, Mortgage Finance Institutions, Building Societies, Foreign Exchange Bureaus, Microfinance Banks, Credit Reference Bureaus and Money Remittance Providers.
iv. Conducting onsite evaluation of the financial condition and compliance with statutory and prudential requirements of institutions licensed under the Banking Act, Microfinance Act; and Foreign Exchange Bureaus and Money Remittance Providers licensed under the Central Bank of Kenya Act.
v. Conducting offsite surveillance of institutions licensed under the Banking Act, Microfinance Act, and Foreign Exchange Bureaus and Money Remittance Providers
licensed under the Central Bank of Kenya Act through the receipt and analysis of returns received periodically. The Department also processes corporate approvals for banking institutions in regard to opening and closing of places of business, appointment of directors and senior managers, appointment of external auditors, introduction of new products/services, increase of bank charges and review of annual license renewal applications in accordance with statutory and prudential requirements.
vi. Hosting of the Secretariat for the National Task Force on Money Laundering (NTF), whose mandate is to develop a legal and regulatory framework to counter and prevent the use of the Kenyan financial system for money laundering. NTF is chaired by the National Treasury. Through the NTF, BSD participates in initiatives by the Eastern and Southern Africa Anti-Money Laundering Group (ESAAMLG). ESAAMLG brings together 14 Eastern and Southern Africa countries with a principal mandate of developing a legal and regulatory Anti- Money Laundering (AML) framework.
vii. Participation in regional activities organized by regional and international bodies or associations such as the East African Community (EAC), and Common Market for Eastern and Southern Africa (COMESA), the Alliance for Financial Inclusion (AFI) and African Rural and Agricultural Credit Association (AFRACA).
viii. Facilitation of the signing of Memoranda of Understanding (MOUs) between the Central Bank of Kenya and other local or foreign supervisory authorities.
ix. As at 31st December 2016, the Bank Supervision Department had a staff compliment of seventy-nine (79) comprising sixty nine (69) technical staff and ten (10) support staff. The department is divided into three divisions as shown in Chart 2.

C E N T R A L B A N K O F K E N Y ABANK SUPERVISION ANNUAL REPORT 2016
4
1.2 Ownership and Asset Base of Commercial Banks
The total net assets in the banking sector stood at Kshs. 3.7 trillion as at 31st December 2016. There were 23 local private commercial banks and 3 local public commercial banks which accounted for 65.1 percent and 3.9 percent of total net assets respectively. A total of 13 commercial banks were foreign owned and accounted for 31.0 percent of the sector’s assets as indicated in Table 1 and Chart 3.
Table 1: Ownership and Asset Base of Commercial Banks ( Kshs. M)
Ownership Number % of Total Total Net Assets % of Total
Local Public Commercial Banks 3 7.7% 145,451 3.9%
Local Private Commercial Banks* 23 59.0% 2,406,742 65.1%
Foreign Commercial Banks 13 33.3% 1,143,751 30.9%
Total 39 100.0% 3,695,943 100.0%*Charterhouse Bank, under statutory management, Fidelity Commercial Bank, undergoing acquisition, Imperial Commercial Bank & Chase Bank that are in receivership have been excluded
Source: CBK
Chart 2: Bank Supervision Organogram
STRUCTURE OF THE BANKING SECTOR

C E N T R A L B A N K O F K E N Y ABANK SUPERVISION ANNUAL REPORT 2016
5
Chart 3: Ownership and Asset Base of Commercial Banks December 2016
OwnershipAsset Size
The local public commercial banks remained 3 in 2016 as in 2015. The 3 banks accounted for 3.9 percent of total net assets in December 2016 as compared to 4.5 percent in December 2015. The decrease is attributable to slower growth in assets given capital constraints experienced by the public banks.
There were 24 local private commercial banks in December 2016, the same as it was in December 2014. The local private commercial banks accounted for 65.1 percent of total net assets an increase from 64.6 percent in December 2014. The increase is attributable to increased demand for credit thus increasing loans and advances which form the largest proportion of the bank’s assets.
In 2016, a total of 13 commercial banks were foreign owned and accounted for 30.9 percent of the sector’s assets as was in December 2015 as indicated in Table 1 and Chart 3.
1.3 Distribution of Commercial Banks Branches
The number of bank branches increased from 1,523 in 2015 to 1,541 in 2016, which translated to an increase of 18 branches. Nairobi County registered the highest increase in number of branches by 17 branches as indicated in Appendix XVI. A total of 15 out of 47 counties registered a decrease in the number of bank branches. The decrease in physical bank branches expansion is partly attributed to the adoption of alternative delivery channels such as mobile banking, internet banking and agency banking.
1.4 Commercial Banks Market Share Analysis
Kenyan commercial banks are classified into three peer groups using a weighted composite index that comprises net assets, customer deposits, capital and reserves, number of deposit accounts and number of loan accounts. A bank with a weight ed composite index of 5 percent and
above is classified as a large bank. A medium bank has a weighted composite index of between 1 percent and 5 percent while a small bank has a weighted composite index of less than 1 percent.
For the period ended 31st December 2016, there were 8 large banks with a market share of 65.32 percent, 11 medium banks with a market share of 25.90 percent and 20 small banks with a market share of 8.77 percent as shown in Table 2, Chart 4 and Appendix IV.
Table 2: Commercial Banks Market Share Analysis
Peer Group
Weighted Market Share
No. of Institutions
Total Net Assets, (KShs. M)
Customer Deposits, (KShs. M)
Capital & Reserves (KShs. M)
Large 65.32% 8 2,404,194 1,739,278 373,516
Medium 25.90% 11 981,099 654,602 159,814
Small 8.77% 20 310,651 211,273 59,094
Total* 100.00% 39 3,695,944 2,485,919 540,578* Charterhouse Bank under Statutory Management, Fidelity Commercial Bank, undergoing acquisition and Imperial Bank & Chase Bank under Receivership have been excludedSource: CBK
STRUCTURE OF THE BANKING SECTOR

C E N T R A L B A N K O F K E N Y ABANK SUPERVISION ANNUAL REPORT 2016
6
There were shifts in market share positions for the banks in the three peer groups:-• Banks in large peer group increased their combined
market share from 58.21 percent in December 2015 to 65.32 percent in December 2016. This is mainly attributable to Stanbic Bank (K) Limited moving from the medium peer group to the large peer group during the period. The bank moved to the large peer group due to its deposit base which increased by 11.36 percent between December 2015 and December 2016.
• The combined market share of medium peer group banks fell from 34.42 percent in December 2015 to 24.64 percent in December 2016. This is mainly attributed to the exit of Stanbic Bank (K) Ltd. which moved to large peer group.
• Banks in small peer group decreased their combined market share from 9.24 percent in December 2015 to 8.35 percent in December 2016.
STRUCTURE OF THE BANKING SECTOR
Chart 4: Commercial Banks Market Share (%) December 2016

C E N T R A L B A N K O F K E N Y ABANK SUPERVISION ANNUAL REPORT 2016
7
In 2016, the banking sector capital and reserves increased by 9.58 percent from KShs 540.60 billion in December 2015 to KShs 592.42 billion in December 2016. The large and small peer groups registered increases in capital and reserves while the medium peer group registered a decrease. The movements in peer groups’ capital and reserves are mainly attributed to the movements of some banks across the peer groups in 2016.
The increase in capital and reserves is attributable to additional capital injections by commercial banks to meet the core capital and total capital regulatory requirements as well as retained earnings from the profits realized in the year.
The banking sector registered improved performance in 2016 with profit before tax increasing by 10.0 percent to KShs 147.4 billion in December 2016 from KShs 134.0 billion in December 2015. The increase in profitability was attributed to a higher increase in income compared to the rise in expenses. The banks income increased by 5.7 percent in 2016 whereas expenses increased by 3.8 percent over the same period.
The large peer group accounted for 78.6 percent of the total pre-tax profit, an increase from 70.3 percent recorded in 2015. The increase is attributable to the movement of one bank to the large peer group and also increase in the amount of profits made by banks in the large peer group. The small peer group proportion of total pre-tax profit decreased from 3.3 percent in 2015 to 2.2 percent in 2015, attributable to 5 banks making loses in 2016 as compared to 3 banks in 2015. The medium peer group proportion of total pre-tax profit declined to 21.2 percent from 26.4 percent due to a shift of one bank to large peer group.
Customer deposits increased by 4.80 percent from Kshs.2.49 trillion in December 2015 to KShs. 2.61 trillion in December 2016. The growth was supported by mobilization of deposits through agency banking and mobile phones platforms
1.5 Automated Teller Machines (ATMs)
The number of ATMs decreased from 2,718 in December 2015 to 2,656 in December 2016. The increase in 2015 was 105 ATMs or 4.0 percent as compared to a decrease of 62 ATMs or 2.3 percent in 2016 as indicated in Table 3. The decrease in the number of ATMs by banks has been driven mainly by adoption of cost effective channels of offering financial services such as the use of mobile banking platforms.
Table 3: ATM NetworkMonth 2015 2016 Increase % GrowthJanuary 2,632 2,733 101 3.84%February 2,643 2,744 101 3.82%March 2,656 2,759 103 3.88%April 2,671 2,660 -11 -0.41%May 2,697 2,660 -37 -1.37%June 2,698 2,682 -16 -0.59%July 2,700 2,688 -12 -0.44%August 2,710 2,695 -15 -0.55%September 2,708 2,658 -50 -1.85%October 2,710 2,713 3 0.11%November 2,713 2,694 -19 -0.70%December 2,718 2,656 -62 -2.28%Source: CBK
STRUCTURE OF THE BANKING SECTOR

C E N T R A L B A N K O F K E N Y ABANK SUPERVISION ANNUAL REPORT 2016
8
1.6 AssetBaseofMicrofinanceBanks
During the year 2016, the Central Bank of Kenya granted a nationwide licence to Maisha Microfinance Bank Limited. This increased the number of regulated microfinance banks (MFBs) from twelve (12) to thirteen (13) as at 31st December 2016.
The microfinance banks registered enhanced growth in the year 2016 with total assets increasing by 5 percent from KShs 69.3 billion in December 2015 to KShs 72.5 billion in December 2016. This was a lower growth in comparison to 2015 and 2014 with 22 percent and 38 percent growth respectively. There was no significant growth in the loan book compared to the previous year. Most institutions put on hold loans disbursement so as to recover and reduce
the outstanding non-performing loans. Net advances accounted for 65 percent of the microfinance bank’s total assets while net fixed assets remained at 8 percent of the total assets base as indicated in Table 4 below. Lending therefore remained the most significant activity undertaken by the MFBs.
During the year, customer deposits accounted for 55 percent of the microfinance banks total funding sources. Borrowings as a source of funding increased, accounting for 22 percent compared to 19 percent in 2015.
As at December 2016, the gross loan portfolio amounted to KShs 48.7 billion while Deposits amounted to KShs 40.2 billion, which is an indicator that the MFBs are able to fund a large proportion of their loan portfolio using customer deposits.
Table4:AssetbaseofMicrofinanceBanks(KShs‘M’)
ASSETS 2015 % of Total 2016 % of
TotalCash Balance (Local & Foreign notes & coins 1,143 2% 2,268 3%
Deposit balances at banks and financial institutions 13,500 19% 12,102 17%
Government securities 700 1% 1,769 2%Net Advances 45,564 66% 47,047 65%Accounts Receivables 606 1% 846 1%Net Fixed Assets 5,277 8% 6,077 9%Other Assets 2,552 4% 2,401 3%TOTAL NET ASSETS 69,342 100% 72,510 100%LIABILITIES & EQUITY FUNDS Deposits 40,539 58% 40,198 55%Borrowings 13,126 19% 16,435 23%Other Liabilities 4,140 6% 4,256 6%Capital and Shareholders Funds 11,537 17% 11,621 16%TOTAL LIABILITIES AND EQUITY FUNDS 69,342 100% 72,510 100%
Source: CBK
1.7 Microfinance Banks Market Share Analysis
The microfinance banks market share is based on a weighted composite index comprising assets, deposits, capital, number of deposit accounts and loan accounts. The microfinance banks are classified into three peer groups namely large, medium and small. Based on the weighted composite index, a microfinance bank is classified large if it has a market share of 5 percent and above; medium if it has a market share between 1 percent and 5 percent and small if its market share is less than 1 percent.
As at 31st December 2016, there were 3 large microfinance banks with an aggregate market share of 90.0 percent, 3 medium microfinance banks with a market share of 6.6 percent and 7 small microfinance banks with a market share of 3.4 percent as shown in table 5.
STRUCTURE OF THE BANKING SECTORSTRUCTURE OF THE BANKING SECTOR

C E N T R A L B A N K O F K E N Y ABANK SUPERVISION ANNUAL REPORT 2016
9
Table 5: MFBs Market Share Analysis (Kshs.’000’) - December 2015 and 20162015 2016
Market Size Index
Market Size Index
Total Assets
Total Deposits
Share Capital & Reserves
Number of Active Deposit Accounts
Number of active Loan Accounts
Weighting 2015 Weighting 2016 0.33 0.33 0.33 0.005 0.005Large Large Kenya Women MFB
45.30% Kenya Women MFB 42.90% 32,153,422 17,156,136 4,755,738 580,648 228,182
Faulu MFB 36.20% Faulu MFB 39.20% 27,368,909 17,371,226 4,342,074 81,584 40,719Rafiki MFB 10.50% Rafiki MFB 7.90% 7,326,817 2,985,058 745,368 39,627 8,879 92.00% 90.00% 66,849,148 37,512,420 9,843,180 701,859 277,780Medium Medium SMEP MFB 3.98% SMEP MFB 4.00% 2,658,605 1,451,271 532,601 129,654 11,520 Caritas MFB 1.30% 574,319 286,719 271,264 7,322 126 Sumac MFB 1.30% 803,468 233,454 246,349 3,242 758 3.98% 6.60% 4,036,392 1,971,444 1,050,214 140,218 12,404Small Small Sumac MFB 1.00% Remu MFB 0.80% 362,149 105,653 183,542 2,994 745
Remu MFB 0.90% U & I MFB 0.70% 351,356 209,409 118,196 4,328 240Uwezo MFB 0.50% Uwezo MFB 0.60% 214,094 28,735 178,502 3,840 164
Caritas MFB 0.50% Daraja MFB 0.40% 179,761 84,741 81,995 2,317 248
U & I MFB 0.40% Maisha MFB 0.40% 170,590 77,899 88,945 808 93Century MFB 0.30% Century MFB 0.30% 224,511 141,311 31,167 15,000 534
Daraja MFB 0.20% Choice MFB 0.20% 122,417 65,918 46,042 2,995 346
Choice MFB 0.20%
3.98% 3.40% 1,624,878 713,666 728,389 32,282 2,370Grand Total 100.00% 100.00% 72,510,418 40,197,530 11,621,783 874,359 292,554
Source: CBK
The market share analysis indicates significant growth from small to medium peer group where the combined market share has grown from 3.98 percent in 2015 to stand at 6.6 percent in 2016. The medium peer group microfinance banks registered an increase of 55 percent and 46 percent in total net assets and total deposits respectively. Sumac MFB and Caritas MFB were ranked as medium in 2016 each with a market share of 1.3 percent compared to the previous ranking of small with a share of 1.0 percent and 0.5 percent in 2015 respectively.
1.8 Distribution of Foreign Exchange Bureaus
There were seventy seven (77) licensed forex bureaus as at 31st December 2016 having declined from eighty (80) in December 2015. The number of forex bureaus declined due to voluntary closure of three (3) forex bureaus, conversion of one (1) forex bureau to a money remittance provider and the licensing of one (1) new forex bureau during the year.
STRUCTURE OF THE BANKING SECTORSTRUCTURE OF THE BANKING SECTOR

C E N T R A L B A N K O F K E N Y ABANK SUPERVISION ANNUAL REPORT 2016
10
Most of the forex bureaus are located in Nairobi as shown in Table 6.
Table 6: Distribution of Forex BureausCity/Town Number of bureaus % of TotalNairobi 61 79.2%Mombasa 8 10.4%Nakuru 2 2.6%Kisumu 2 2.6%Eldoret 2 2.6%Namanga 1 1.3%Busia 1 1.3%Total 77 100%
Source: CBK
STRUCTURE OF THE BANKING SECTOR

C E N T R A L B A N K O F K E N Y ABANK SUPERVISION ANNUAL REPORT 2016
11
STRUCTURE OF THE BANKING SECTOR
DEVELOPMENTS IN THE BANKING SECTOR
C E N T R A L B A N K O F K E N Y ABANK SUPERVISION ANNUAL 2016
11
CHAPTER 2
C E N T R A L B A N K O F K E N Y ABANK SUPERVISION ANNUAL REPORT 2016
12
2.1 Introduction
Kenya’s banking sector continued to grow in terms of inclusiveness, efficiency and stability on the backdrop of legal, regulatory and supervisory reforms and initiatives. This growth supports the continuous efforts by the Government of Kenya for a vibrant and globally competitive financial sector in Vision 2030. Some of the developments in the banking sector in 2016 were:-
• The Banking (Amendment) Act, 2016 was enacted in August 2016 and became effective on 14th September 2016. The Act, which applies to institutions licensed under the Banking Act, limits interest rates chargeable on loans made by institutions at not more than 4 percent above the prevailing Central Bank Rate (CBR). It also set a floor on the interest rate payable by institutions on interest earning deposits held at not less than 70 percent of the CBR.
• A Guidance Note on Internal Capital Adequacy Assessment Process (ICAAP) was issued in November 2016 by CBK to all commercial banks and mortgage finance companies for reference in preparing or revising their ICAAP documents.
• Chase Bank Limited was put under receivership on 7th April 2016 due to liquidity and governance deficiencies.
• Impressive increase in the volumes of banking business transacted through agents by both commercial banks and microfinance banks which increased by 47.73 percent between December 2015 and December 2016.
• CBK issued a licence to Maisha Microfinance Bank Ltd to carry out nationwide microfinance banking business. Maisha Microfinance Bank Ltd became the thirteenth Microfinance Bank (MFB) to be licensed joining the existing nine nationwide MFBs and three community-based MFBs.
2.2 Developments in Information and Communication Technology
During the year 2016, there was no major acquisition or upgrade of existing core banking systems in Kenya’s banking sector. Commercial banks and microfinance banks continued to leverage on robust Information and Communication Technology (ICT) platforms to provide robust banking services. As institutions continued to devise ways of minimizing operating costs especially on the backdrop of the recent Banking (Amendment) Act, 2016 that capped interest rate chargeable to borrowers and introduced minimum interest rates payable to
depositors, robust ICT platforms will continue being a perfect enabler for institutions to offer banking services efficiently. The commercial banks business strategies are mainly driven by the capabilities of these core banking systems and other integrated systems. The capability of these systems enables banks to roll out different products and services to their customers. The most common Core Banking Systems currently used by most of conventional commercial banks includes Flexcube, T24 and Financle while iMAL is widely used by shariah compliant banks.
Innovative Payment Systems Platform
Towards the end of 2016, several commercial banks submitted applications to CBK to introduce a payment system product, PESALINK. This is a secure and efficient platform for bank account to bank account money transfer. The platform is managed by Kenya Bankers Association (KBA) through its subsidiary Integrated Payment Services Limited (IPSL). This Platform will complement the existing payment system infrastructure and provide customers with more choices.
ICT Risks Management and Controls With increased use of ICT there have been increased cases of ICT related frauds in the recent years. Data on fraud reported to Banking Fraud and Investigation Department (BFID) indicates that cases relating to computer, mobile and internet banking are on the rise. Another emerging threat has been cyber-crime where criminals gain unauthorized access to institutions’ computer programs and data. As a result, there is an urgent need for the banking sector management to ensure increased use of computer-based transaction process is matched with effective controls.
Technologyandemployeesefficiency
On average, in 2015, one employee was serving 972 customers whereas in 2016 an employee was serving 1,209 customers as indicated in Table 7. This shows increased efficiency in customer service as a result of banks embracing technology.
DEVELOPMENTS IN THE BANKING SECTOR

C E N T R A L B A N K O F K E N Y ABANK SUPERVISION ANNUAL REPORT 2016
13
Table 7: Growth of Deposit Account Holders ComparedtoNumberofStaff
Year No. of Deposit Account Holders
Number of Staff
Efficiency Score
1996 1,000,000 16,673 602002 1,682,916 10,884 1552006 3,329,616 15,507 2152007 4,123,432 21,657 1902008 6,428,509 25,491 2522009 8,481,137 26,132 3252010 11,881,114 28,846 4122011 14,250,503 30,056 4742012 15,861,417 31,636 5012013 21,880,556 34,059 6422014 28,438,292 36,923 7702015 35,194,496 36,212 9722016 41,203,518 34,083 1,209 Source: CBK
2.3 Financial Inclusion and Policy Development Initiatives
The financial inclusion landscape in Kenya continued to thrive with more people being financially included in the formal financial sector during the year. CBK has continued to support the financial inclusion initiatives through the various partnerships between the Government and the private sector. The key policy development initiatives undertaken by CBK as at the end of 2016 include:-
i. LicensingofMicrofinanceBanksThe CBK issued a licence to Maisha Microfinance Bank (MFB) Limited which began operations in June 2016 as a nationwide microfinance bank. Maisha MFB is a Kenyan owned company limited by shares whose initial operations are domiciled in Nairobi County with an objective of
expanding across the country. Maisha MFB’s target market is the Micro Small and Medium Enterprises (MSMEs). The MFB value proposition is in offering comprehensive Insurance Premium Financing (IPF) products as value-add alongside the other products that they will be offering. The MFB is looking to provide a one-stop financial services shop for MSMEs.
ii. Financial Inclusion SurveysThe 2016 FinAccess Household Survey: The 2016 FinAccess Household Survey is the fourth in a series of surveys that measure the financial inclusion landscape (access, usage, quality and impact) in Kenya. This follows subsequent surveys conducted in 2006, 2009 and 2013 which have shown that Kenya has made significant progress in fostering financial inclusion. The 2016 survey was conducted through the collaborative effort of the Kenya National Bureau of Statistics (KNBS), Financial Sector Deepening Trust (FSD) Kenya and Central Bank of Kenya (CBK). The results of the survey were released in February 2016. Below are some of the key findings from the survey;
a) The formally included population increased to 75.3% of Kenyans; a 50% increase in the last 10 years. Financial exclusion, which is now down to 17.4%, has been reduced by more than half since 2006.
b) The rural-urban gap in financial access is rising. Over the past 10 years, the use of formal prudential services in urban areas has remained roughly double that of rural areas.
c) Banks and informal mechanisms are equally popular among users of financial services. However, compared to these, nearly twice as many Kenyans use mobile financial services.
These findings are illustrated in the chart below;
DEVELOPMENTS IN THE BANKING SECTOR
Chart 5: Financial Access Strand over the Years
C E N T R A L B A N K O F K E N Y ABANK SUPERVISION ANNUAL REPORT 2016
14
This information provides a better understanding of the financial inclusion landscape in line with the financial sector development agenda, as laid out in Kenya’s Vision 2030.
iii. Knowledge exchange visits
BSD hosted three officers from Bank of Gambia on 21st September 2016 for a knowledge exchange visit on agency banking following a request from African Rural and Agricultural Credit Association (AFRACA). The Bank of Gambia team was in Kenya to learn more on initiatives to promote financial inclusion including agency banking and mobile banking. The Bank of Gambia is currently exploring initiatives to increase access formal financial services. Over 80% of the Gambian population currently does not have access to formal financial services.
BSD hosted two officers from the Bank of Tanzania between 16th and 20th May 2016 for a knowledge exchange visit on Agent Banking in Kenya.
iv. Transparency in Credit Pricing
The Government of Kenya’s Blueprint, Vision 2030, has broad objectives that include enhancing consumer protection by increasing the transparency, fairness and affordability of banking and other financial products and services, and increasing competition in the sector to the benefit of customers and the broader economy.
One of the main functions of the Central Bank of Kenya (CBK) is to maintain a stable and efficient banking and financial system which includes consumer protection. This is achieved through improving market conduct and business practices in the banking sector.
It is against this backdrop that in 2016, CBK and Kenya Bankers Association explored ways to promote Consumer Protection in the banking sector. The focus of the partnership is to enhance transparency in cost of credit. Three disclosure models are being considered namely Annual Percentage Rate (APR), the Repayment Schedule (RS) and the Total Cost of Credit (TCC) to boost transparency in the cost of credit.
• APR is computed as a ratio of all costs incurred in borrowing and servicing a loan against the principal amount borrowed. The aim of APR is to disclose the actual overall cost that a borrower incurs by borrowing a loan.
• TCC is a list of all costs incurred in borrowing and servicing a loan. It includes interest expenses, bank fees and charges and third party fees and charges.
• RS details the periodic amount to be paid by the borrower and a split of the periodic payments into principal and interest components. The RS also shows a borrower the total amount to be repaid for the specific principal amount borrowed.
The three models expected to be rolled out in 2017 will be supported by an updated database which the borrowing public can access to obtain pricing information for relevant credit facilities. Therefore the models will ultimately empower the borrowing public to shop around for cheaper credit facilities.
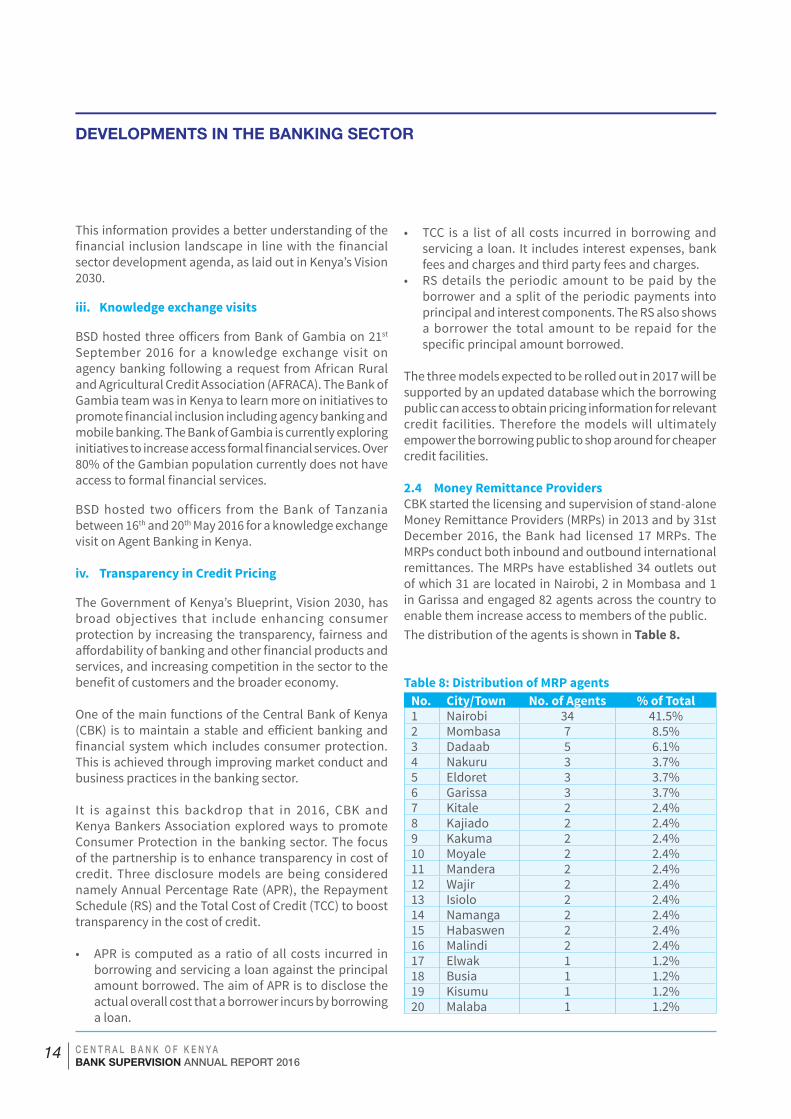
2.4 Money Remittance ProvidersCBK started the licensing and supervision of stand-alone Money Remittance Providers (MRPs) in 2013 and by 31st December 2016, the Bank had licensed 17 MRPs. The MRPs conduct both inbound and outbound international remittances. The MRPs have established 34 outlets out of which 31 are located in Nairobi, 2 in Mombasa and 1 in Garissa and engaged 82 agents across the country to enable them increase access to members of the public.The distribution of the agents is shown in Table 8.
Table 8: Distribution of MRP agents
No. City/Town No. of Agents % of Total1 Nairobi 34 41.5%2 Mombasa 7 8.5%3 Dadaab 5 6.1%4 Nakuru 3 3.7%5 Eldoret 3 3.7%6 Garissa 3 3.7%7 Kitale 2 2.4%8 Kajiado 2 2.4%9 Kakuma 2 2.4%10 Moyale 2 2.4%11 Mandera 2 2.4%12 Wajir 2 2.4%13 Isiolo 2 2.4%14 Namanga 2 2.4%15 Habaswen 2 2.4%16 Malindi 2 2.4%17 Elwak 1 1.2%18 Busia 1 1.2%19 Kisumu 1 1.2%20 Malaba 1 1.2%
DEVELOPMENTS IN THE BANKING SECTOR

C E N T R A L B A N K O F K E N Y ABANK SUPERVISION ANNUAL REPORT 2016
15
No. City/Town No. of Agents % of Total21 Kisii 1 1.2%22 Meru 1 1.2%23 Lamu 1 1.2%
Total 82 100%Source: CBK
2.5 Agency Banking By December 2016, 18 commercial banks and 5 microfinance banks (MFBs) had contracted 53,833 and 2,068 agents, respectively, spread across the country. This was in comparison with the previous year, December 2015, where the number of agents contracted by commercial banks and MFBs were 40,592 and 1,154 respectively. The change implies a 33 percent (increase by 13,241 agents) and 79 percent (increase by 914 agents) growth of number of agents contracted by commercial banks and microfinance banks, respectively.
Over 87 percent of the approved commercial bank agents were concentrated in 3 banks with the largest physical branch presence namely; Equity Bank Ltd. with 25,428 agents, Kenya Commercial Bank Ltd. with 12,883 and Cooperative Bank Ltd. with 8,856. The overall increase in the number of agents is attributed to the growing confidence and acceptability of the agency banking model by the public and banks as an alternative channel of doing banking business.
Two more MFBs rolled out the agency banking model during the year, increasing the number of MFBs that have contracted agents to five, which represent 38% of the MFBs. The main challenges cited by the MFBs for the low uptake of agent banking are infrastructural challenges as most of the MFBs still have lower branch networks compared to commercial banks. Notably, over 95 percent of the agents are contracted by the largest microfinance bank – KWFT.
During the same period, 8 out of the 12 licensed MFBs had established 105 deposit-taking marketing offices marking an improvement; up from 88 deposit-taking marketing offices in 2015. The improvement was supported by the fact that the microfinance banks have steadily come to appreciate the role of deposit-taking marketing offices in supporting their business expansion by boosting their revenues, growing the customer base and boosting efforts to mobilize deposits.
Number of Transactions
The number of banking transactions undertaken through bank agents increased by 30.9% from 79,620,211 transactions recorded in 2015 to 104,193,459 in December 2016. A brief summary is provided in Table 9(a).
Table 9(a): Type of Transactions Number of Transactions
2015 2016 % Change Cumulative (2010-2016)
Cash Deposits 36,395,378 56,056,750 54.0% 153,081,202Cash Withdrawals 26,821,097 33,280,161 24.1% 116,806,548Payment of Bills 341,754 1,283,300 275.5% 2,192,042Payment of Retirement and Social Benefits 206,647 2,029,458 882.1% 3,206,093Transfer of Funds 15,220 15,490 1.8% 36,704Account balance enquiries 15,666,352 11,338,113 -27.6% 45,132,437Mini statement requests 81,820 117,889 44.1% 337,601Collection of loan applications forms 396 75 -81.1% 77Collection of account opening application forms 87,183 71,217 -18.3% 1,591,671Collection of debit and credit card application forms 1,508 1,006 -33.3% 118,064
Collection of debit and credit cards 2,856 - -100% 60,580 Total 79,620,211 104,193,459 30.9% 322,563,019 Number of Agents 40,592 53,833 32.6%
Source: CBK
DEVELOPMENTS IN THE BANKING SECTOR

C E N T R A L B A N K O F K E N Y ABANK SUPERVISION ANNUAL REPORT 2016
16
The increase in total transactions was largely attributable to increases in transactions relating to payment of retirement and social benefits, payment of bills, cash deposits and mini statements requests which increased by 882.1%, 275.5%, 54.0% and 44.1%, respectively.
The continued expansion of the banks’ agent networks indicates existence of a market demand/need for more structured financial products rather than simply the money transfer, airtime and bill payments ‘use-cases’ that have been the mainstay of their services. In response to this need, in 2016, telecommunication companies continued to partner with banks to offer micro-loan and micro-savings products such as the KCB M-Pesa (in partnership with KCB), and the Equitel (Equity Bank mobile banking product). These in turn have led to an increase in transactions conducted by bank agents.
Cash deposits, cash withdrawals and payment of retirement and social benefits continued to remain the major transactions carried out by bank agents in 2016 representing 53.8%, 31.9% and 10.9% of the total transactions in the year, respectively. Notably, account balances enquiries transactions reduced by 27.6% while payment of retirement and social benefits increased significantly by 882.1% signaling that the agency banking models are increasingly offering a variety of financial services offerings to customers. These services go beyond cash deposits and cash withdrawals which have consistently remained the top transactions conducted through agents.
The increased transactions were attributed to the significant increase in the market presence of bank agents, their products and services which are in many ways additive as opposed to competing with those of agents of Mobile Network Operators (MNO).
Also during the year 2016, some of the agent transactions recorded a decline. These include: collection of debit and credit cards, collection of loan application forms, collection of debit and credit card application forms, account balance enquiries and collection of account opening application forms. These transactions experienced a decline of 100%, 81.1%, 33.3%, 27.6% and 18.3%, respectively. The decline particularly, on collection of debit and credit cards, and collection of debit and credit card application forms, was as a result of one of the banks temporarily stopping the use of agents to offer the said activities.
Value of Transactions
In 2016, the value of banking transactions undertaken through agents increased from KShs 442.2 billion (USD 4.3 billion) to KShs. 734.2 billion (USD 7.1 billion). The increase was attributed to the growth of transactions relating to payment of retirement and social benefits, transfer of funds, cash deposits and cash withdrawals. These transactions experienced a growth of 1,240%, 110%, 80% and 32% respectively, from the previous year. The increase on transactions relating to payment of retirement and social benefits was as a result of the Government of Kenya’s move to appoint some banks as their payment agents for the National Safety Net Programme (Inua Jamii). This program runs three cash transfer programmes: cash transfer to orphans and vulnerable children; older persons cash transfer; and persons with severe disability cash transfer solution alternatives. During the year the Government, through the Inua Jamii programme, disbursed over KShs 14 billion to over 500,000 beneficiaries.
In addition, the increase (payments of bills) was mainly due to continued increase in the market presence of bank agents as a result of banks’ push to grow their respective numbers of active agents translating to more touch points to customers. Several banks rolled out diversified products offered through agents for example; Business 2 Business (B2B) solutions to schools and other collection accounts which led to growth in the number of billers in banks’ systems thus growing payment of bills transactions. By and large, the increase in number and value of transactions underlines Kenyans’ growing confidence and acceptability of the agency banking model by banks and the public as an economical, convenient and safe delivery channel. Despite the overall increase in the value of transactions, there was a decline in transactions relating to payment of bills in the year 2016 as highlighted in Table 9(b) below.
DEVELOPMENTS IN THE BANKING SECTOR

C E N T R A L B A N K O F K E N Y ABANK SUPERVISION ANNUAL REPORT 2016
17
Table 9(b) Agency Banking data for banks – Value of TransactionsinKShs‘M’Type of Transactions
2016 2015 % Change Cumulative (2010 to 2016)
Cash Deposits 538,273.37 298,383.53 80% 1,340,339.20Cash Withdrawals 175,242.59 133,204.42 32% 549,620.20Payment of Bills 5,996.91 9,478.40 -37% 19,539.71Payment of Retirement and Social Benefits 14,492.88 1,081.25 1,240% 19,056.83Transfer of Funds 176.21 83.77 110% 329.78 Total 734,181.99 442,231.36 66% 1,928,885.75
Source: CBK
2.6 New ProductsCBK continued to approve new banking products and related charges as provided for under Section 44 of the Banking Act which provides that no banking institution can increase its rate of banking or other charges except with the prior approval of the Minister. The Cabinet Secretary, the National Treasury delegated this role to the Governor of the Central Bank of Kenya via Legal Notice 34 of May 2006 on the Banking (increase of Rate of Banking and other Charges) Regulations 2006.
While processing such applications, the Central Bank of Kenya considers:
• Whether the proposed increase is in conformity with the Government’s policy of establishing a market oriented economy in Kenya; and
• The average underlying inflation rate prevailing over twelve months preceding the application.
• For new charges whether the proposed charges are justifiable and are comparable to the industrial average.
The financial services industry is being impacted by the ever changing consumer needs, innovative financial products, technological advancement and the use of multiple delivery channels. To remain competitive in the new landscape, banks have continued to introduce new products, expand the existing ones, and add new delivery channels. Banks strive to enhance access to customers as well as differentiating their products and services by use of alternative delivery channels such as e-banking and m-banking.
During the year 2016, banks submitted over 70 applications seeking CBK’s approval to introduce new products related charges. Most of the applications sought to introduce
mobile phone banking services in partnerships with IT service providers. This will facilitate enquiries on accounts as well as enable customers conduct banking transactions such as cash withdrawals/deposits, account opening, loan applications and payment of goods and services online.
Towards the end of 2016, 15 banks applied to introduce PESALINK, a new product spearheaded by Kenya Bankers Association that will enable bank customers to move funds from one bank to another using either mobile phones, internet, ATM, bank agents and branches. The product is expected to reduce cost of transferring funds from one bank to another since the charges levied would be lower than those currently being charged by existing money transfer platforms.
2.7 Operations of Representative Offices of Authorized Foreign Financial Institutions
CBK authorizes Representative Offices of foreign banks that wish to establish a presence in Kenya as mandated under section 43 of the Banking Act (Cap 488). The Act mandates the CBK to authorize and supervise representative offices of foreign banks in Kenya. Representative Offices operating in Kenya are only permitted to undertake information gathering, marketing or liaison roles on behalf of their parent and affiliated institutions but not to conduct banking business. During 2016, there was no change in the number of Representative Offices operating in Kenya, which remained at 8 as at the end of 2015.
Business activities facilitated by the Representative OfficesinKenya
In 2016, Representative Offices had a total of 36 employees compared to 34 in 2015 and facilitated business worth an
DEVELOPMENTS IN THE BANKING SECTOR

C E N T R A L B A N K O F K E N Y ABANK SUPERVISION ANNUAL REPORT 2016
18
estimated KShs 239.65 billion (USD 2.39 billion). There was a notable increase in the business activities facilitated by the Representative Offices in 2016 when compared to KShs 109.31 billion (USD 1.07 billion) reported in 2015. An analysis of the 2016 returns indicated that four of the eight
Representative Offices facilitated financial transactions in the year. However, the other four Representative Offices continued marketing and liaison roles. The activities of the Representative Offices largely comprised the following activities:
Main area of business being facilitated or promoted by the representative offices in Kenya
Value of business in KShs (Billion)
Value of business USD2(Million)
Correspondent banking. 11.92 116.42Project finance. 18.82 183.83Trade finance. 18.11 176.89Specialised finance. 21.31 208.13Syndicated lending. 61.49 600.50Others (term loans, borrowing base, working capital and bilateral receivable discounting) 107.99 1,054.60
Total 239.65 239,653.89Source: CBK
2.8 Residential Mortgages Market Survey 2016
CBK conducts an annual mortgage survey to monitor developments and challenges in the mortgage market for residential housing. A detailed questionnaire was distributed to the banks to collect data for the year ending 2016. The information collected comprised:-
i) Size of Mortgage Portfolio;ii) Mortgage Loan Characteristics;iii) Mortgage Risk Characteristics; iv) Obstacles to Mortgage Market Development;v) Impact of interest capping law on residential mortgage
loans and ;vi) Mortgage outlook for 2017.
The survey, which is conducted annually, provided an update on the size of mortgage portfolio, mortgage loan characteristics, mortgage risk characteristics and the obstacles to mortgage market development. Banks also suggested possible intervention measures to support the mortgage market and shared their views on the residential mortgage market outlook for 2017.
Below are the highlights of the Residential mortgage survey as at 31st December 2016.
1) Size of Mortgage Portfolio
i) The value of mortgage loan assets outstanding increased from KShs. 203.3 billion in December 2015 to KShs. 219.9 billion in December 2016, representing a growth of KShs. 16.6 billion or 8.1 percent due to increased appetite for home ownership as opposed to rentals.
ii) About 72.8 percent of lending to the mortgage market was by 5 institutions that is, one medium sized bank (23.5 percent) and four banks from the large banks peer group (49.3 percent) as compared to 71.6 percent lending by 5 institutions, the same 5 institutions in 2015.
iii) The outstanding value of non-performing mortgages increased from KShs. 11.7 billion in December 2015 to KShs. 22.0 billion in December 2016. The NPLs to gross mortgage loans was 10.0 percent which was above the industry NPLs to gross loans ratio of 7.0 percent.
iv) There were 24,085 mortgage loans in the market in December 2016 down from 24,458 in December 2015 a decrease of 373 loan accounts or 1.5 percent due to tighter credit standards by commercial banks.
v) The average mortgage loan size increased from KShs. 8.3 million in 2015 to KShs. 9.1 million in 2016 due to increased property prices.
DEVELOPMENTS IN THE BANKING SECTORDEVELOPMENTS IN THE BANKING SECTOR
2. USD = KShs 102.4

C E N T R A L B A N K O F K E N Y ABANK SUPERVISION ANNUAL REPORT 2016
19
vi) Almost all banks were offering mortgage loans for both their staff and customers. However, the number of institutions offering mortgages to customers were 35 in 2016 as compared to 34 in 2015 as indicated in Appendix XII. The increase in the number of commercial banks offering mortgage loans is attributable to Sidian Bank Ltd which started offering mortgage loans in 2016.
2) Mortgage Risk CharacteristicsInstitutions indicated the following as main risk factors examined more closely before a mortgage loan to a household is approved:-
i) Ability and willingness to repay – Debt Service Ratio.
ii) Sustainability of the borrower income –terms of employment.
iii) Legitimacy of the property- it should be free of encumbrances.
iv) Credit history.v) Caveats on the property.vi) Collateral/security value-Loan to Value and
Location of the property.vii) Property location and ease of sale in case of
default.viii) Owner occupier or rental.
The main risk factors examined more closely by institutions before a mortgage loan to a business is approved are:-
i) Ability to pay from the cash flows.ii) Length of business operation.
iii) Other existing debts.iv) Economic sustainability of the business based on
the sector outlook.v) Experience of the management in the running the
particular business.
Banks mostly financed mortgage loans with Loan to value (LTV) of below 100 percent.
3) Mortgage Loan Characteristics
i) The interest rate charged on mortgages on average was 13.46 percent and ranged between 10.5 percent – 18.0 percent as compared to 18.7 percent average with a range of 11.9 percent - 23.0 percent in 2015. This was mainly due to interest rate capping which became effective on 14th September 2016.
ii) About 62.1 percent of mortgage loans were on variable interest rates basis compared to 89.3 percent in 2015. There seems to have been more uptake of fixed rate mortgages by home owners after the introduction of interest capping Law in September 2016.
iii) Loan to value (maximum loan as a percentage of property value) was pegged below 90 percent by majority of the banks in 2015 and 2016.
iv) The average loan maturity was 12.0 years with minimum of 5 years and a maximum of 25 years in 2016 as compared to average loan maturity of 9.6 years with a minimum of 5 years and a maximum of 20 years in 2015.
4) Obstacles to Mortgage Market Development
The survey identified a number of the impediments to mortgage market development as indicated in Table 10.
Table 10: Residential Mortgages Market Survey – December 2016Mortgage Market Obstacles Frequency of response
Low level of income 30High incidental costs (legal fee, valuation fee, stamp duty) 29
Difficulties with property registration/titling 27Access to long term finance 21High cost of building/construction land 21Stringent land laws 18Lengthy charge process timelines 17High interest rate 14Start-up cost 12Credit risk 9
Source: CBK
DEVELOPMENTS IN THE BANKING SECTORDEVELOPMENTS IN THE BANKING SECTOR

C E N T R A L B A N K O F K E N Y ABANK SUPERVISION ANNUAL REPORT 2016
20
Based on the above ranking of mortgage market constraints, banks identified low level of income, high incidental cost and difficulties with property registration as the major impediments to the growth of their mortgage portfolios.
5) Suggested measures to support the mortgage market
Institutions suggested a number of measures to be put in place to support the residential mortgage market in Kenya. Some of the suggested measures include:-
i) Availability of cheap long term funds.ii) Provision of basic infrastructure services to
developers by national and county governments.iii) Reduction of stamp duty for first time home owners.iv) Encouragement of low cost housing developments.v) Banks and mortgage lenders to provide innovative
Mortgage products targeting the low income segment.
vi) Digitization of Lands registries to improve efficiency in searching of record, transfers and charge discharge and discharge of titles.
6) Impact of interest capping law on residential mortgage loans
Based on the responses to the Survey questionnaire it was noted that:• There is increased demand for mortgage loans due to
perceived affordability after the introduction of interest capping law in September 2016. There is also increased appetite for mortgages as more borrowers perceive that they can qualify for higher amounts.
• Commercial banks have on the other hand introduced tighter credit standards so the actual mortgage disbursements have been lower than the increased demand. Most commercial banks have also shown preference to offer short term loans as compared to long tenure mortgage loans.
2.9 Employment Trend in the Banking Sector
The banking sector staff levels decreased by 6.95 percent from 36,212 in December 2015 to 33,695 in December 2016 as indicated in Table 11. Management and Support staff increased while Supervisory and Clerical and Secretarial staff reduced by 9.01% and 12.05% respectively thus leading to the overall decrease in the staff levels. This is an indicator of the banks’ improved efficiency as a result of automated processes hence reducing the number of required supervisory and clerical and secretarial staff.
Table 11: Employment in the Banking Sector - December 2016
2015 2016 %ChangeManagement 10,310 10,327 0.16%Supervisory 6,973 6,345 -9.01%Clerical and Secretarial 16,503 14,515 -12.05%Support Staff 2,426 2,508 3.38%Total 36,212 33,695 -6.95%Source: CBK
2.10 Future Outlook
The elevated credit and liquidity risks in the Kenyan banking sector in 2016 are expected to ease off and stabilise in 2017. This is informed by on-going efforts by banks to reposition their business models to suit their desired market niches and risk profiles. The strengthened business models will enable the banks to effectively identify and manage all potential risks they are exposed to in their activities. Effective risk management is a prerequisite for the banks to profitably exploit business opportunities in their market niches.
DEVELOPMENTS IN THE BANKING SECTOR

C E N T R A L B A N K O F K E N Y ABANK SUPERVISION ANNUAL REPORT 2016
21
DEVELOPMENTS IN THE BANKING SECTOR
MACROECONOMIC CONDITIONS AND BANKING SECTOR PERFORMANCE
C E N T R A L B A N K O F K E N Y ABANK SUPERVISION ANNUAL 2016
21
CHAPTER 3

C E N T R A L B A N K O F K E N Y ABANK SUPERVISION ANNUAL REPORT 2016
22
3.1 Global Economic Conditions
Global growth is estimated to have expanded by 3.1 percent in 2016 from 3.5 percent in 2015 (IMF, WEO April 2017 update). Advanced economies registered weak economic performance in the first half of 2016, attributed to policy uncertainty regarding trade relations, weak investment and sluggish productivity growth. Activity decelerated in the United States and in other major economies exacerbated by political developments during the period. In the United States, growth slowed down by 1.0 percentage point to 1.6 percent in 2016, while the growth in the United Kingdom was down by 0.4 percentage point to 1.8 percent. However, confidence in the Euro Area has been resilient despite the United Kingdom’s vote to exit the European Union (EU) in June 2016. Countries such as Germany and Italy registered improved growth while performance in others such as Spain remained unchanged in 2016.
Growth in emerging market and developing economies remained unchanged in 2016 at 4.1 percent from registered performance in 2015. With mixed performance across economies, China’s growth decelerated to 6.7 percent in 2016 from 6.9 percent in 2015, reflecting internal policy rebalancing from investment growth to consumption growth, while growth in India slowed down by 0.8 percentage point to 6.8 percent in 2016 following currency adjustments during the period. Improved economic performance by the Middle East, North Africa, Afghanistan
and Pakistan; and the Commonwealth of Independent States (mainly Russia) balanced out the deterioration in major emerging economies (largely India, South Africa and Brazil) and Sub Saharan Africa.
In 2017, global growth is projected to improve to 3.5 percent on account of improved output in both advanced economies and the emerging market and developing economies (IMF, WEO April 2017 update). Performance amongst the advanced economies will largely be driven by projected accelerated economic growth in the United States to 2.3 percent in 2017 on the assumption of fiscal stimulus including tax cuts and higher infrastructure spending. In the Euro Area, the pace of expansion is expected to remain moderate, while the medium-term growth prospects of the United Kingdom are likely to be restrained by heightened uncertainty related to the country’s future relations with the EU. Growth in emerging market and developing economies is expected to improve to 4.5 percent in 2017 on account of the gradual easing of deep recessions in some of the larger commodity-exporting countries such as Russia, Nigeria, Brazil and Mexico. However, the gradual deceleration of Chinese growth is likely to weigh on other emerging market economies. Risks on global growth remain skewed on the downside, in the medium term, policy uncertainty of the US administration and the inward shift in policies, toward protectionism, may affect global trade and cross border investment and thus lower global growth.
MACROECONOMIC CONDITIONS AND BANKING SECTOR PERFORMANCE

C E N T R A L B A N K O F K E N Y ABANK SUPERVISION ANNUAL REPORT 2016
23
Table 12: Global Economic OutlookWorld Economic Growth (percent change)
YEAR OVER YEAR
ProjectionsDifferencefromJanuary 2017 WEO projections
Country/Region 2015 2016 2017 2018 2017 2018
World Output 3.2 3.1 3.5 3.6 0.1 0.0
Advanced economies 2.1 1.7 2.0 2.0 0.1 0.0
United States 2.6 1.6 2.3 2.5 0.0 0.0
Euro Area 2.0 1.7 1.7 1.6 0.1 0.0
Germany 1.5 1.8 1.6 1.5 0.1 0.0
France 1.3 1.2 1.4 1.6 0.1 0.0
Italy 0.7 0.9 0.8 0.8 0.1 0.0
Spain 3.2 3.2 2.6 2.1 0.3 0.0
Japan 1.2 1.0 1.2 0.6 0.4 0.1
United Kingdom 2.2 1.8 2.0 1.5 0.5 0.1
Emerging market and Developing economies 4.1 4.1 4.5 4.8 0.0 0.0
Russia -3.7 -0.2 1.7 2.1 0.3 0.2
China 6.9 6.7 6.6 6.2 0.1 0.2
India 7.6 6.8 7.2 7.7 0.0 0.0
Brazil -3.8 -3.6 0.2 1.7 0.0 0.2
Middle East, North Africa, Afghanistan and Pakistan 2.5 3.9 2.6 3.4 -0.5 -0.1
Sub-Saharan Africa 3.4 1.4 2.6 3.5 -0.2 -0.2
Nigeria 2.7 -1.5 0.8 1.9 0.0 -0.4
South Africa 1.3 0.3 0.8 1.6 0.0 0.0
Source: IMF, World Economic Outlook (WEO), April 2017 update
MACROECONOMIC CONDITIONS AND BANKING SECTOR PERFORMANCE

C E N T R A L B A N K O F K E N Y ABANK SUPERVISION ANNUAL REPORT 2016
24
3.2 The Regional Economy
Growth in Sub-Saharan Africa slowed down to 1.4 percent in 2016 (IMF WEO April 2017 update) from 3.4 percent in 2015, with oil exporting countries and other major resource countries accounting for most of the slowdown. Growth in Nigeria contracted to -1.5 percent in 2016 from 2.7 percent in 2015 following temporary disruptions to oil production, foreign currency shortages resulting from lower oil receipts, lower power generation and weak investor confidence. Growth in South Africa slowed down to 0.3 percent from 1.3 percent over the same period. Activity in non-resource intensive countries (agricultural exporters and commodity importers) generally remained robust.
Growth is expected to recover to 2.6 percent in 2017, following a gradual rise in commodity prices. However, risks remain on the downside as heightened policy uncertainty relating to trade, investment relations and inward protectionist policies in the United States and Europe and tighter global financing conditions may weigh down on the region’s growth. In addition, adverse weather conditions affecting countries in Eastern and Southern Africa may impact on the 2017 growth.
3.3 Domestic Economy
The Kenyan economy remained resilient in 2016 despite headwinds from the weak global economy. It recorded robust growth of 5.8 percent compared to 5.7 percent in 2015, largely supported by high government investment in infrastructure, low international oil prices, improved agricultural performance particularly in the first half of the year, recovery of the tourism sector and stable macroeconomic environment. However growth of the agriculture sector decelerated in the second half of 2016, largely on account of depressed rainfall that affected
production of key agricultural crops leading to overall sectoral growth of 4 percent compared to 5.5 percent recorded in 2015.
Growth is expected to remain stable in 2017, notwithstanding the emerging developments particularly the drought conditions in the first quarter of 2017 and the uncertainties in the global economy with respect to the policies of the new US administration and the outcome of the Brexit negotiations.
3.4Inflation
Overall inflation remained elevated in the first half of 2016 largely on account of food inflation arising from high food prices that have persisted since July 2016. Annual average inflation increased slightly to 6.6 percent from 6.5 percent in 2015. However, overall inflation remained within the Government target range of 5 ± 2.5 percent during the year. In January 2017, overall inflation accelerated to 7.0 percent from 6.4 percent in December 2016 owing to elevated food inflation which contributed 5.6 percentage points to the overall inflation in January 2017. Given the drought conditions in the first quarter of 2017, food inflation is expected to continue exerting pressure on overall inflation in the near term. The recovery in international oil prices could also translate to high energy prices and exert pressure on fuel inflation.
3.5 Exchange Rates
The foreign exchange market in 2016 remained relatively stable supported by a narrowing current account deficit and resilient foreign earnings from tea, tourism and remittance inflows. During the period, the Kenya Shilling appreciated against the Pound Sterling but depreciated against the US Dollar and the Euro. (Table 13)
Table 13: Exchange Rate Developments U.S POUND EURO USHS TSHS RWF BIF DOLLAR STERLING / KSH / KSH / KSH / KSH
2015 98.26 150.30 109.04 32.96 20.73 7.28 15.952016 101.50 137.68 112.38 33.66 21.54 7.58 15.96
Source: CBK
MACROECONOMIC CONDITIONS AND BANKING SECTOR PERFORMANCE

C E N T R A L B A N K O F K E N Y ABANK SUPERVISION ANNUAL REPORT 2016
25
Table 14: Balance of Payment (USD M)BPM6 Concept 2012 2013 2014 2015 2016*A. Current Account, n.i.e. -4216 -4842 -6378 -4289 -3653Goods: exports f.o.b. 6,212 5,846 6,219 5,982 5,747 Goods: imports f.o.b. 15,527 16,089 16,929 14,358 13,638 Services: credit 4,993 5,132 5,024 4,638 4,528 Services: debit 2,389 2,207 3,350 3,321 2,837 Balance on goods and services -6710 -7318 -9036 -7058 -6199Primary income: credit 347 333 496 492 433 Primary income: debit 662 933 1,365 1,176 1,117 Balance on goods, services, and primary income -7026 -7918 -9904 -7742 -6883Secondary income, n. i. e.: credit 2,849 3,123 3,729 3,516 3,281 Secondary income: debit 40 47 203 63 51 B. Capital Account, n.i.e. 235 158 275 262 206 Capital account, n.i.e.: credit 235 158 275 262 206 Capital account: debit 0 0 0 0 0C. Financial Account, n.i.e. -5583 -5203 -7397 -3908 -4138Direct investment: assets 238 199 75 242 158 Direct investment: liabilities, n.i.e. 1,380 1,119 821 620 393 Portfolio investment: assets 41 38 55 191 423 Equity and investment fund shares 22 12 4 10 407 Debt securities 19 26 52 181 16 Portfolio investment: liabilities, n.i.e. 259 309 3,772 36 40 Equity and investment fund shares 257 297 954 11 23 Debt securities 1 12 2,818 25 17 Financial derivatives: net - - - - - Financial derivatives: assets - - - - - Financial derivatives: liabilities - - - - - Other investment: assets -51 653 -6 501 -193Other equity 0 0 0 0 0Other debt instruments -51 653 -6 501 -193Central bank 0 0 0 0 0Deposit-taking corporations, except the central bank -339 465 -80 416 -244General government 0 0 0 0 0Other sectors 288 188 75 85 52Other financial corporations 0 0 0 0 0Nonfinancial corporations, households, and NPISHs 288 188 75 85 52Other investment: liabilities, n.i.e. 4,172 4,666 2,929 4,187 4,093 Other equity 23 22 -16 -3 -8Special Drawing Rights 0 0 0 0 0Other debt instruments 4,150 4,644 2,944 4,190 4,101 Central bank 32 -17 79 -2 -36Deposit-taking corporations, except the central bank 534 514 586 481 -283General government 1,101 829 (249) 2,058 1,972 Other sectors 2,482 3,318 2,529 1,653 2,448 Other financial corporations 0 0 0 0 0Nonfinancial corporations, households, and NPISHs 2,482 3,318 2,529 1,653 2,448 D. Net Errors and Omissions -379 -150 160 -135 -561E. Overall Balance -1223 -369 -1454 254 -129F. Reserves and Related Items 1223 369 1454 -254 129Reserve assets 1454 858 1335 -360 38Credit and loans from the IMF 193 177 -119 -107 -91Exceptional financing 38 312 0 0 0Source: Economic Survey 2017*Estimate
MACROECONOMIC CONDITIONS AND BANKING SECTOR PERFORMANCE
C E N T R A L B A N K O F K E N Y ABANK SUPERVISION ANNUAL REPORT 2016
26
3.6 Interest rates
The short term interest rates recorded a downward trend over the last one year. The weighted average interbank rate decreased to 4.8 percent in 2016 from an average of 11.24 percent in 2015, reflecting improved market liquidity conditions. The 91-day Treasury bill rate declined to 8.6 percent from 10.9 percent while the 182-day Treasury bill rate decreased to 10.9 percent from 12.2 percent over the same period under review.
Commercial banks’ average lending interest rates remained stable at 16.58 percent in 2016 compared to 16.16 percent in the previous year. The marginal increase was largely reflected in ‘Over 5 years’ and ‘Overdraft’ loan categories. However, there was a notable decrease in the average lending rate from 17.71 percent in August 2016 to 13.69 percent in December 2016, largely on account of the implementation of interest rate capping law effected in mid-September 2016. Average commercial banks’ deposit rate increased to 7.1 percent in 2016 from 6.93 percent in 2015. The increase was reflected in the savings category which increased by 16 basis points to 2.92 percent from 1.53 percent.
3.7 Balance of Payments
The overall balance of payments recorded a deficit of USD 129 million in 2016 from a surplus of USD 254 million in 2015. The current account balance improved to a deficit of 5.2 percent of GDP (USD 3,653 million) in 2016 from 6.7 percent (USD 4,289 million) in 2015, mainly due to lower merchandise and service imports. Merchandise imports declined to 19.3 percent of GDP (USD 13,638 million) in 2016 from 22.5 percent of GDP (USD 14,358 million) in 2015 following lower importation of oil, food and transport equipment. Service imports also declined to 4.0 percent of GDP ($ 2,837 million) in 2016 from 5.2 percent of GDP ($ 3,321 million) in 2015 following a 32 percent reduction in freight costs. (Table 14)
Merchandise exports declined to 8.1 percent of GDP (USD 5,747 million) in 2016 from 9.4 percent of GDP (USD 5,982 million) in 2015 following a reduction in re-exports of petroleum products and manufactured articles as well as exports of cement to the region. In addition, there was reduction of USD 110 million in receipts from transport services on account of lower air transport receipts from Kenya Airways and lower freight from sea transport. Despite the general decline in total exports, exports of tea;
horticulture; and coffee increased to 44.3 percent of total exports in 2016 from 42.1 percent in 2015, while exports of articles of apparel; and clothing accessories increased to 5.3 percent of total exports from 4.9 percent.
The decline in imports outweighed the decrease in exports, consequently leading to narrowing of the trade deficit and an improvement of export-import ratio from 36.8 percent in 2015 to 40.4 percent in 2016. Terms of trade for all items increased by 2.8 percentage points to 78.8 percent in 2016 following improved export unit prices of beverages and tobacco; animals and vegetable oils and fats; chemicals; and machinery and transport equipment, coupled with the declining import unit prices of mineral fuels. Africa continued to be the leading destination of the Kenya’s exports accounting for 40.6 percent, with exports to EAC accounting for 21.1 percent of the total exports, in 2016.
The 2016 current account balance was mainly financed by other investment inflows, which accounted for 90 percent (USD 4,093 million) of the total financial liabilities. However, inflows of foreign direct investment declined by 0.4 percentage points to 0.6 percent of GDP (USD 393 million) in 2016 from 1.0 percent of GDP (USD 620 million) in 2015. International reserves remained adequate at USD 7.6 billion at end-December 2016, equivalent to 5.3 months of imports. The resilience of the economy, and international confidence in the country’s macroeconomic policies was underscored by the successful completion of the first review of Kenya’s economic programme on January 25, 2017, by the IMF.
3.8 Domestic Economic Outlook
In 2017, the current account deficit is projected to moderate at 5.8 percent of GDP supported by relatively higher receipts and a lower import bill. However, down side risks to the current account outlook include the prevailing drought conditions that may necessitate higher food imports and the policy stance of the new U.S administration and its effect on the global economy.
3.9 Performance of the Banking Sector
The banking sector registered improved performance during the year ended December 2016. The sector recorded a 10.0 percent growth in pre-tax profits during the year. The sector also recorded strong capitalization levels as a result of retention of profits and additional capital injection. However, asset quality registered a decline with
MACROECONOMIC CONDITIONS AND BANKING SECTOR PERFORMANCE

C E N T R A L B A N K O F K E N Y ABANK SUPERVISION ANNUAL REPORT 2016
27
the non-performing loans (NPLs) ratio increasing to 9.2 percent in December 2016 from 6.8 percent in December 2015. The increase in NPLs was partly attributable to a challenging business environment witnessed in the period ended December 2016.
3.10. Commercial Banks Balance Sheet Analysis
The banking sector registered improved financial strength in 2016, with total net assets recording an increase of 5.8 percent from KShs 3,492.6 billion in December 2015 to KShs 3,695.9 billion in December 2016 as indicated in Table 15. This is attributable to increased gross loans by 5.6 percent from KShs 2,165.3 billion in December 2015 to KShs 2,2286.5 billion in December 2016.
The loans and advances, government securities and placements which accounted for 58.8 percent, 23.2 percent and 4.0 percent of the total net assets respectively remained the main components of the banks’ balance sheet. Net loans and advances registered an increase of 11.2 percent from KShs 2,091.4 billion in December 2015 to KShs 2,182.6 billion in December 2016.
Table 15: GLOBAL BALANCE SHEET ANALYSIS (KShs M) Dec-15 Dec-16 % ChangeAssets Cash 58,842 62,719 6.59%Balances at Central Bank 192,630 158,914 -17.50%Placements 142,690 160,944 12.79%Government securities 684,541 865,990 26.51%Investments 19,468 31,157 60.04%Loans and Advances (Net) 2,091,361 2,182,631 4.36%Other assets 303,113 233,588 -22.94%Total Assets 3,492,643 3,695,943 5.82%Liabilities and Shareholders’ Funds Customer Deposits 2,485,920 2,618,390 5.33%Other Liabilities 466,145 480,012 2.97%Capital and Reserves 540,578 597,542 10.54%Total Liabilities and Shareholders’ Funds 3,492,643 3,695,943 5.82%Source: CBK
Customer deposits, which are the main source of funding for the banks grew by 5.3 percent from KShs 2,485.9 billion in December 2015 to KShs 2,618.4 billion in December 2016. The growth was supported by mobilization of deposits through agency banking and mobile phone platforms. Net loan and advances increased by 4.4 percent from KShs 2,091.4 billion in December 2015 to KShs 2,182.6 billion in December 2016. The growth in loans is attributed to increased demand for credit by all eleven economic sectors.
In 2016, the banking sector capital & reserves increased by 10.5 percent from KShs 540.6 billion in December 2015 to KShs 597.5 billion in December 2016. The general increase in capital and reserves is attributable to additional capital injections by commercial banks to meet the statutory capital adequacy requirements and exploit business opportunities.
3.11. Sectoral Distribution of Gross Loans, Loan Accounts and Non-Performing Loans The largest proportion of the banking industry gross loans and advances were channeled through the Personal/Household, Trade, Real Estate and Manufacturing Sectors. In total, these four economic sectors accounted for 70.89 percent of gross loans in December 2016 as indicated in Table 16. Personal/households, Trade and Agriculture sectors accounted for the highest number of loan accounts with a total of 98.21 percent. Trade,
MACROECONOMIC CONDITIONS AND BANKING SECTOR PERFORMANCE
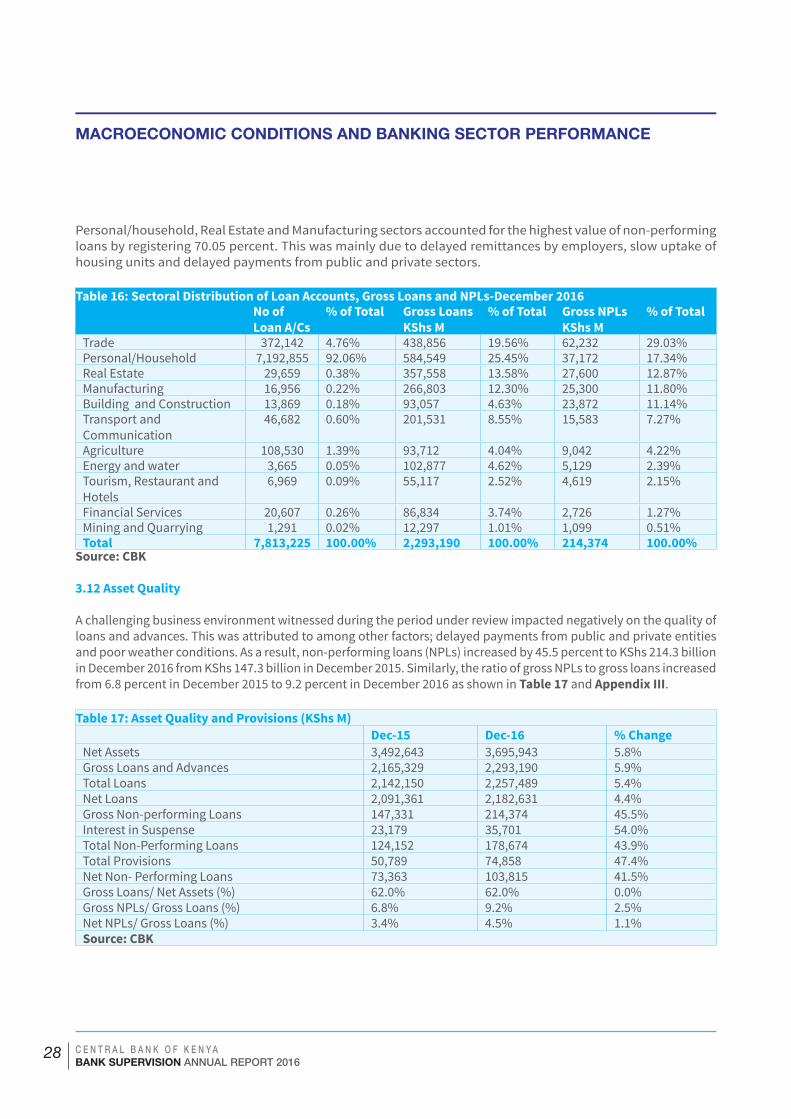
C E N T R A L B A N K O F K E N Y ABANK SUPERVISION ANNUAL REPORT 2016
28
Personal/household, Real Estate and Manufacturing sectors accounted for the highest value of non-performing loans by registering 70.05 percent. This was mainly due to delayed remittances by employers, slow uptake of housing units and delayed payments from public and private sectors.
Table 16: Sectoral Distribution of Loan Accounts, Gross Loans and NPLs-December 2016 No of
Loan A/Cs% of Total Gross Loans
KShs M% of Total Gross NPLs
KShs M% of Total
Trade 372,142 4.76% 438,856 19.56% 62,232 29.03%Personal/Household 7,192,855 92.06% 584,549 25.45% 37,172 17.34%Real Estate 29,659 0.38% 357,558 13.58% 27,600 12.87%Manufacturing 16,956 0.22% 266,803 12.30% 25,300 11.80%Building and Construction 13,869 0.18% 93,057 4.63% 23,872 11.14%Transport and Communication
46,682 0.60% 201,531 8.55% 15,583 7.27%
Agriculture 108,530 1.39% 93,712 4.04% 9,042 4.22%Energy and water 3,665 0.05% 102,877 4.62% 5,129 2.39%Tourism, Restaurant and Hotels
6,969 0.09% 55,117 2.52% 4,619 2.15%
Financial Services 20,607 0.26% 86,834 3.74% 2,726 1.27%Mining and Quarrying 1,291 0.02% 12,297 1.01% 1,099 0.51%Total 7,813,225 100.00% 2,293,190 100.00% 214,374 100.00%
Source: CBK
3.12 Asset Quality
A challenging business environment witnessed during the period under review impacted negatively on the quality of loans and advances. This was attributed to among other factors; delayed payments from public and private entities and poor weather conditions. As a result, non-performing loans (NPLs) increased by 45.5 percent to KShs 214.3 billion in December 2016 from KShs 147.3 billion in December 2015. Similarly, the ratio of gross NPLs to gross loans increased from 6.8 percent in December 2015 to 9.2 percent in December 2016 as shown in Table 17 and Appendix III.
Table 17: Asset Quality and Provisions (KShs M) Dec-15 Dec-16 % ChangeNet Assets 3,492,643 3,695,943 5.8%Gross Loans and Advances 2,165,329 2,293,190 5.9%Total Loans 2,142,150 2,257,489 5.4%Net Loans 2,091,361 2,182,631 4.4%Gross Non-performing Loans 147,331 214,374 45.5%Interest in Suspense 23,179 35,701 54.0%Total Non-Performing Loans 124,152 178,674 43.9%Total Provisions 50,789 74,858 47.4%Net Non- Performing Loans 73,363 103,815 41.5%Gross Loans/ Net Assets (%) 62.0% 62.0% 0.0%Gross NPLs/ Gross Loans (%) 6.8% 9.2% 2.5%Net NPLs/ Gross Loans (%) 3.4% 4.5% 1.1%Source: CBK
MACROECONOMIC CONDITIONS AND BANKING SECTOR PERFORMANCE

C E N T R A L B A N K O F K E N Y ABANK SUPERVISION ANNUAL REPORT 2016
29
3.13RiskClassificationofLoansandAdvances
The Central Bank’s Prudential Guideline on Risk Classification of Assets and Provisioning requires commercial banks to classify facilities extended to their customers based on performance. The performance criteria is based on repayment capability of the borrower and the loans are classified as either normal, watch, substandard, doubtful or loss.
The loans and advances in the normal category decreased by 0.9 percent from KShs 1,840.4 billion in December 2015 to KShs 1,824.7 billion in December 2016. The normal category also accounted for 79.6 percent of the total loans compared to 85.5 percent in 2015. This is explained by the deteriorating asset quality of the banking sector in the year as explained below.
The loans and advances in the watch, substandard and doubtful categories increased by 44.2 percent, 21.4 percent and 61.6 percent respectively as shown in Table 18. This is also reflected by the increased levels of these
categories in the entire loan book. The watch, substandard and doubtful categories accounted for 11.1 percent, 24 percent and 5.5 percent of the loan book in 2016 compared to 7.7 percent, 2.1 percent and 3.6 percent in 2015. These increases were occasioned by deteriorating asset quality as a result of delayed payments, enhanced reclassification and provisioning of loans and challenges in the business environment.
The proportions of loans in all categories increased in 2016 as was in 2015 as shown in Table 18 and Chart 5.
Table18:RiskClassificationofLoansandAdvances(KShsM)
2015 % of Total 2016 % of TotalNormal 1,840,414 85.00% 1,824,677 79.57%Watch 176,267 8.10% 254,246 11.09%Substandard 45,438 2.10% 55,180 2.41%Doubtful 77,278 3.60% 124,873 5.45%Loss 25,913 1.20% 34,214 1.49%Total 2,165,329 100.00% 2,293,190 100.00%Source: CBK
Chart6:RiskClassificationofLoansandAdvances
Source: CBK
RISK CLASSIFICATION OF LOANS AS AT DEC 2015, KSH.’M RISK CLASSIFICATION OF LOANS AS AT DEC 2016,KSH.’M
MACROECONOMIC CONDITIONS AND BANKING SECTOR PERFORMANCE

C E N T R A L B A N K O F K E N Y ABANK SUPERVISION ANNUAL REPORT 2016
30
3.14 Capital Adequacy
The Central Bank Prudential Guideline on Capital Adequacy requires banks to adhere to the prescribed capital adequacy prudential ratios. The minimum regulatory capital adequacy ratios, which are measured by the ratio of Core Capital and Total Capital to Total
Risk Weighted Assets, are 10.5 percent and 14.5 percent respectively. The Core Capital to Total Risk Weighted Assets ratios remained at an average of 16 percent in 2015 and 2016. Also, the Total Capital to Total Risk Weighted Assets ratio remained at an average of 19 percent in 2015 and 2016 as shown in Table 19. Over the same period, the ratio of core capital to total deposits increased marginally from 18 percent in 2015 to 19 percent in December 2016.
Table 19: Capital Adequacy Ratios
2013 2014 2015 2016 Minimum Capital Adequacy Ratios
Core Capital/ TRWA 18% 16% 16% 16% 10.5%Total Capital/ TRWA 21% 20% 19% 19% 14.5%Core Capital/ Total Deposits 19% 19% 18% 19% 8.0%*TRWA-Total Risk Weighted AssetsSource: CBK
3.15 Liquidity
Liquidity held by commercial banks depicts their ability to fund increases in assets and meet obligations as they fall due. Liquidity is one of the important financial stability indicators since liquidity shortfall in one bank can cause systemic crisis in the banking sector due to their interconnected operations.
Arising from the placement of Chase Bank Ltd in receivership in April 2016, CBK closely monitored the banking sector particularly on liquidity and credit risks. Banks that faced liquidity challenges that were not able to access liquidity in the market used the liquidity facilities available at the CBK such as intraday liquidity facility, rediscount of government securities, open market operations and lender of last resort window. The liquidity challenges were primarily caused by liquidity segmentation in the inter-bank market. Liquidity distribution in the banking sector improved towards end of the year.
The average liquidity ratio as at December 2016 stood at 40.3 percent as compared to 38.1 percent registered in December 2015. The increase in the ratio is mainly attributed to a higher growth in total liquid assets compared to the growth in total short-term liabilities. Total liquid assets grew by 12.1 percent while total short-term liabilities grew by 5.7 percent. The banking sector’s average liquidity in the twelve months to December 2016
was above the statutory minimum requirement of 20 percent.
3.16ProfitandLoss
The banking sector registered improved performance in 2016 with profit before tax increasing by 10.0 percent to KShs 147.4 billion in December 2016 from KShs 134.0 billion in December 2015 as shown in Table 20. The increase in profitability is attributed to a higher increase in income compared to the rise in expenses.
Income
Total income for the banking sector grew by 5.7 percent from KShs 474.9 billion in December 2015 to KShs 504.0 billion in December 2016 as shown in Table 20 below. The increase in income was largely attributed to increase in interest on government securities which rose by KShs 19.9 billion occasioned by increased investments in government securities. Interest income on advances increased by KShs 7.0 billion to KShs 298.2 billion in December 2016 from KShs 291.2 billion in December 2015 occasioned by increased loans and advances in 2016. Foreign exchange trading income decreased by 2.0 percent to KShs 20.0 billion in 2016 from KShs 24.5 billion in 2015.
MACROECONOMIC CONDITIONS AND BANKING SECTOR PERFORMANCE
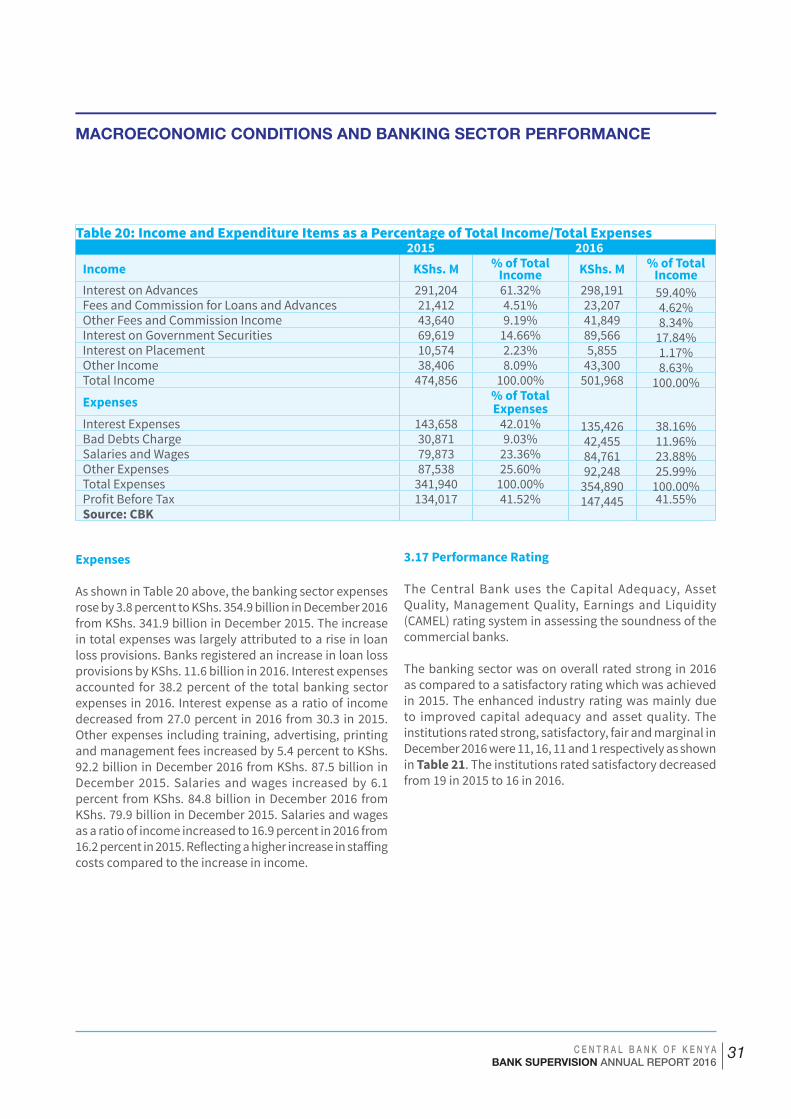
C E N T R A L B A N K O F K E N Y ABANK SUPERVISION ANNUAL REPORT 2016
31
Table 20: Income and Expenditure Items as a Percentage of Total Income/Total Expenses 2015 2016Income KShs. M % of Total
Income KShs. M % of Total Income
Interest on Advances 291,204 61.32% 298,191 59.40%Fees and Commission for Loans and Advances 21,412 4.51% 23,207 4.62%Other Fees and Commission Income 43,640 9.19% 41,849 8.34%Interest on Government Securities 69,619 14.66% 89,566 17.84%Interest on Placement 10,574 2.23% 5,855 1.17%Other Income 38,406 8.09% 43,300 8.63%Total Income 474,856 100.00% 501,968 100.00%Expenses % of Total
ExpensesInterest Expenses 143,658 42.01% 135,426 38.16%Bad Debts Charge 30,871 9.03% 42,455 11.96%Salaries and Wages 79,873 23.36% 84,761 23.88%Other Expenses 87,538 25.60% 92,248 25.99%Total Expenses 341,940 100.00% 354,890 100.00%Profit Before Tax 134,017 41.52% 147,445 41.55%Source: CBK
Expenses
As shown in Table 20 above, the banking sector expenses rose by 3.8 percent to KShs. 354.9 billion in December 2016 from KShs. 341.9 billion in December 2015. The increase in total expenses was largely attributed to a rise in loan loss provisions. Banks registered an increase in loan loss provisions by KShs. 11.6 billion in 2016. Interest ex penses accounted for 38.2 percent of the total banking sector expenses in 2016. Interest expense as a ratio of income decreased from 27.0 percent in 2016 from 30.3 in 2015. Other expenses including training, advertising, printing and manage ment fees increased by 5.4 percent to KShs. 92.2 billion in December 2016 from KShs. 87.5 billion in December 2015. Salaries and wages increased by 6.1 percent from KShs. 84.8 billion in December 2016 from KShs. 79.9 billion in December 2015. Salaries and wages as a ratio of income increased to 16.9 percent in 2016 from 16.2 percent in 2015. Reflecting a higher increase in staffing costs compared to the increase in income.
3.17 Performance Rating
The Central Bank uses the Capital Adequacy, Asset Quality, Manage ment Quality, Earnings and Liquidity (CAMEL) rating system in assessing the soundness of the commercial banks.
The banking sector was on overall rated strong in 2016 as compared to a satisfactory rating which was achieved in 2015. The enhanced industry rating was mainly due to improved capital adequacy and asset quality. The institutions rated strong, satisfactory, fair and marginal in December 2016 were 11, 16, 11 and 1 respectively as shown in Table 21. The institutions rated satisfactory decreased from 19 in 2015 to 16 in 2016.
MACROECONOMIC CONDITIONS AND BANKING SECTOR PERFORMANCE

C E N T R A L B A N K O F K E N Y ABANK SUPERVISION ANNUAL REPORT 2016
32
Table 21: Banking Sector Performance Rating (KShs. M)Performance 2015 2016
No. of Institutions
Total Net Assets
Market Share
No. of Institutions
Total Net Assets
Market Share
Strong 11 1,223,466 35.57% 11 1,845,960 49.95%Satisfactory 19 1,961,554 55.97% 16 1,438,960 38.93%Fair 8 277,985 7.67% 11 295,908 8.01%
Marginal 2 29,638 0.79% 1 115,114 3.11%
Unsatisfactory 0 0.00%Total* 40 3,635,092 100.00% 39 3,695,943 100.00%Overall Rating Satisfactory Strong* Charterhouse Bank in Statutory Management, Fidelity Commercial Bank in acquisition and Imperial Bank and Chase Bank in Receivership have been excluded in the 2016 statistics.Source: CBK
3.18 Compliance with Supervisory & Regulatory Requirements
For the year ended 31st December 2016, twelve banks were in violation of the Banking Act and CBK Prudential Guidelines as compared to four banks in the previous year, 2015. The increase in the number of banks in violation was mainly in respect to non-compliance with liquidity ratio after Chase Bank Ltd was placed into receivership due to deposit movement (mostly affecting small and medium banks). However, the situation normalized later in the year.
The specific incidences of non-compliance noted as at 31st
December 2016 were as follows:-
• Three institutions were in violation of Section 10(1) of the Banking Act which restricts lending to a single borrower to an amount of not more than 25 percent of its Core Capital.
• Two institutions were in violation of Section 18 of the Banking Act and CBK Prudential Guideline (CBK/PG/03) on Capital Adequacy, which requires an institution to have a minimum core capital to total risk weighted assets ratio of 10.5 percent and total capital to total risk weighted assets ratio of 14.5 percent.
• One institution was in violation of Section 7(1) of the Banking Act and CBK Prudential Guideline (CBK/PG/03) on Capital Adequacy, which requires an institution to maintain a minimum core capital of KShs 1 billion.
• Seven institutions were in violation of Section 19(1) of the Banking Act and CBK Prudential Guideline (CBK/PG/05) on Liquidity Management, which requires institutions to have a minimum liquidity ratio of 20 percent. This was observed after placement of Chase Bank Limited into receivership causing panic withdrawal of deposits in small and medium banks. However, the situation normalized later in the year.
• Two institutions were in violation of Section 12(c) of the Banking Act and CBK Prudential Guideline (CBK/PG/07) on Prohibited Business, which requires that institutions investment in land and buildings should not be more than 20 percent of Core Capital.
• Two institutions were in violation of Clause 3.3.3 of CBK Prudential Guideline (CBK/PG/02) on Corporate Governance, which requires every member of the Board to attend at least 75 percent of the Board meetings of an institution in any financial year.
• Two institutions were in violation of Section 11 (1) of the Banking Act which requires every bank to seek Board approval for any loan granted to the Executive Committee members and to ensure that these credit facilities are fully secured.
Appropriate remedial actions were taken on the concerned institutions by the CBK in respect of these violations.
MACROECONOMIC CONDITIONS AND BANKING SECTOR PERFORMANCE

C E N T R A L B A N K O F K E N Y ABANK SUPERVISION ANNUAL REPORT 2016
33
3.19PerformanceofMicrofinanceBanks
The microfinance banks’ profit before tax decreased by 169 percent from KShs. 549 million for the period ended December 2015 to a loss of KShs. 377 million for the period ended December 2016 as shown in Table 22 below. The decline in profitability in the sector was largely attributed to reduction of financial income by 27 percent or KShs. 3.9 billion in 2016. Generally, there was a huge decline of 77 percent, 62 percent and 60 percent on income from government securities, financial income on investments and deposits and balances with banks and financial institutions respectively while interest and fee expense on borrowing increased by 19 percent. This was occasioned by the tight liquidity in the market especially
after the placement of three (3) commercial banks under receivership in 2015 and 2016 which affected distribution of liquidity in the sector. Net non-performing loans increased by 94 percent as at 31st December 2016.
The branch network grew from 109 branches in 2015 to 112 branches in 2016 while the marketing offices grew from 88 to 105 and third party agents from 1,154 to 2,060 agents as at the end of December 2016. Out of the deposit base of KShs. 40.2 billion, 33 percent comprised of cash collateral held by the microfinance banks as security for loans granted. Similarly, the size of net loan portfolio increased by 3 percent from KShs. 45.6 billion in 2015 to KShs. 46.9 billion in 2016.
Table22:PerformanceofMFBs-KShs.‘M’Parameter 2015 2016 % ChangePre-Tax Profits 549 (377) -169%Customer Deposits 40,539 40,198 -1%Loan Portfolio (Net) 45,564 47,047 3%Core Capital/Total Risk Weighted Assets 21% 20% -5%Total Capital/Total Risk Weighted Assets 23% 22.6% -1%Return on Assets 1% (0.5)% -150%Return on Shareholder’s funds 5% (3.2)% -164%Number of Branches 109 112 3%Total number of staff 4,500 4,423 -2%
Source: CBK
As at December 2016, the MFBs’ ratio of core capital to risk weighted assets decreased to 20 percent and was above the minimum requirement of 10 percent as shown in Appendix X. The ratio of total capital to total risk weighted assets was 22.6 percent for the period ended December 2016 against the minimum statutory requirement of 12 percent.
The 13 microfinance banks had a total staff complement of 4,423 in 2016 compared to 4,500 staff from 12 microfinance banks in 2015. Most Microfinance banks had introduced innovative technology enabled delivery channels and products such as mobile, internet banking and agency network platforms for efficient customer services.
3.20 Credit Reference Bureaus Reports
It has been six and half years, since the launch of the Credit Information Sharing (CIS) mechanism in July 2010. Currently, CBK has licensed three (3) Credit Reference Bureaus namely; Transunion CRB, Metropol CRB and Creditinfo CRB. The licensing of three CRBs has enhanced diversity and competition through introduction of innovative products such as development of a Commercial Score Card for Micro and Small Medium Enterprises (MSMEs). The commercial score card is expected to facilitate MSMEs to access financing from suppliers and improve credit terms. The bureaus also ventured into credit scoring as a value - add to users. However, the bureaus have disparate credit scores and there is need to harmonize the scoring scale across the bureaus for ease of interpretation by lenders and consumers.
MACROECONOMIC CONDITIONS AND BANKING SECTOR PERFORMANCE

C E N T R A L B A N K O F K E N Y ABANK SUPERVISION ANNUAL REPORT 2016
34
The CIS mechanism witnessed growing interest by other entities to participate in the sharing. As at December 2016, CBK had approved a total of 797 other data sources for the three CRBs compared to 325 data sources as at December 2015 in accordance with Regulation 23(2) of the Credit Reference Bureau Regulations, 2013. Majority of the third party data sources approved comprised of Savings and Credit Cooperative Societies (SACCOs). Other data sources approved by CBK include credit-only microfinance institutions and trade institutions. In addition, Metropol CRB has been granted approval to roll-out 139 specific third party agents in 2017.
The use of credit reports for credit appraisal process by financial institutions declined by 17% from 5.97 million reports in 2015 to 4.94 million reports in 2016 indicating
partly that the demand for credit was lower during the year. As at 31st December 2016, a total of 16.2 million credit reports had been requested by the subscribing banks. Meanwhile, the requests made by customers increased by 12% to 84,412 in the year 2016.
The main challenge remains the negative public perception of credit reporting, with most consumers viewing CRBs and credit reports as tools to blacklist them from the financial sector. Similarly, credit providers’ use of credit information in pricing is minimal and they primarily use credit reports to deny or grant credit. This is partly attributed to lack of integration of the credit bureau scores in credit appraisal methodologies of credit providers.
Table 23 shows the credit reports accessed from the CRBs since inception of the credit sharing mechanism in July 2010:
Table 23: Number of credit reports requested since August 2010
PERIOD BANKS & MFBs % Change CUSTOMERS % ChangeAugust- December 2010 284,722 - 434 -January-December 2011 1,021,717 259% 5,607 1192%January-December 2012 1,015,327 -1% 22,692 305%January-December 2013 1,275,522 26% 26,361 16%January-December 2014 1,674,707 31% 33,442 27%January-December 2015 5,966,729 256% 75,078 125%January-December 2016 4,938,224 -17% 84,412 12% Total 16,176,948 163,614
Source: CBK
MACROECONOMIC CONDITIONS AND BANKING SECTOR PERFORMANCE

C E N T R A L B A N K O F K E N Y ABANK SUPERVISION ANNUAL REPORT 2016
35
Chart 7: Total monthly credit report requests by banks to three CRBs in 2016
Chart 7 indicates there are high and low seasons in the credit report requests made by banks to the CRBs. The high season was at the beginning of the year as the demand for credit was high. By end of year it was low season due to the lower number of loan applications.
The mechanism registered an improvement in the quality of data submitted to the CRBs by banks. The rejection rates for the year ended December 2016 stood at an average rate of 11% per CBR compared to average rate of 13% for 2015. Most of the data rejected by the CRBs was mainly as a result of invalid values, records missing mandatory fields, and files sent in the wrong file formats.
MACROECONOMIC CONDITIONS AND BANKING SECTOR PERFORMANCE
Source: CBK

C E N T R A L B A N K O F K E N Y ABANK SUPERVISION ANNUAL REPORT 2016
36
DEVELOPMENTS IN SUPERVISORY FRAMEWORK
DEVELOPMENTS IN SUPERVISORY FRAMEWORK
CHAPTER 4
C E N T R A L B A N K O F K E N Y ABANK SUPERVISION ANNUAL 2016
36

C E N T R A L B A N K O F K E N Y ABANK SUPERVISION ANNUAL REPORT 2016
37
4.1 Introduction
The Central Bank continued to enhance the quality of its supervisory framework. In this regard CBK undertook several key reforms, including:-
• Requiring banks to disclose details of their significant shareholders, who own 5% or more of the shareholding, on their websites. Shareholders of banks are at the core of instilling corporate governance in banks. The disclosure of the bank shareholders would signal adherence to corporate governance as well as instilling confidence and stability in specific banks and the sector as a whole.
• Requiring external auditors to ensure that banks insider lending practices conform with the requirements of the Banking Act and Prudential Guidelines. Insider loans have been shown to undermine the sustainability of a bank, hence the need to ensure that loan facilities are granted to insiders at arm’s length.
• Issuing a Guidance Note on Internal Capital Adequacy Assessment Process (ICAAP) to the banking industry in November 2016. CBK required all banks to submit their 2016 ICAAP documents by April 2017. Adoption of ICAAP by banks would ensure that they set aside enough capital to cater for all potential risks that a bank would be exposed to. This was premised on the argument that well-capitalised banks have the capacity to withstand shocks and thereby ensure their resilience.
• CBK increased its supervisory staff complement by recruiting additional officers who are experts in various fields including ICT and auditing. This was intended to enhance CBK’s scrutiny of banks’ processes including corporate governance practices, integrity of information and disclosure requirements.
• CBK adopted a Risk Based Supervisory Framework for Anti-Money Laundering and Countering Financing of Terrorism (AML/CFT). The framework will complement prudential supervision and legal compliance with special attention directed to anti-money laundering and combating financing of terrorism.
The outlined reforms were expected to lead to a more stable, sound and resilient banking sector. As a result, the Kenyan banking sector is expected to continue its upward growth trajectory in the medium to long term as the outlined reforms take root.
4.2 Banking Act Amendments
His Excellency the President assented to the Finance Act, 2016 on 13th September 2016. The specific amendments relating to the Banking Act came into force on 1st January 2017. The key amendments to the Banking Act were:-
(i) Sharing of Credit Information. The Credit Information Sharing (CIS) mechanism under the Banking Act was amended to bring on board new entities. With the expansion of the mechanism, Saccos licensed under the Sacco Societies Act 2008, institutions registered under the Cooperative Societies Act and public utility companies mandated to share credit information under any written law have now been accommodated in the CIS framework.
(ii) Cross-Border Sharing of Credit Information. To allow institutions across borders to share credit information, the law was amended to allow regulators or supervisory authorities, Credit Reference Bureaus (CRBs) and institutions within the East African Community region to share credit information amongst themselves as and when the need arose. The amendment acknowledged that the world is increasingly becoming a global village. Consumers are now able to utilize innovative information communication technology to obtain financial services wherever they are through the online systems and irrespective of geographical boundaries. The amendment will enable institutions to have a holistic view of a customer’s credit history and credit worthiness in relation to consumption of financial services irrespective of the jurisdiction in which the services were rendered.
(iii) Enhancement of Monetary Penalties. The Banking Act was amended to enhance the monetary penalties against institutions and credit reference bureaus that violate the Banking Act or the Prudential Guidelines. To this end, maximum monetary penalty for institutions and credit reference bureaus was increased from KShs 5 million to KShs 20 million. Similarly, the maximum penalty against a natural person was increased from KShs 200,000 to KShs 1 million. A penalty not exceeding KShs 100,000 was introduced for each additional day that a failure continues unabated. This is intended to
DEVELOPMENTS IN SUPERVISORY FRAMEWORK

C E N T R A L B A N K O F K E N Y ABANK SUPERVISION ANNUAL REPORT 2016
38
provide sufficient deterrence of the contravention or violations on Banking Act or the Prudential Guidelines.
4.3 Banking (Amendment) Act, 2016
In an effort to cap interest rates, the Banking Act was amended through the Banking (Amendment Act), 2016 that became effective on September 14, 2016. The law required that, the maximum interest chargeable for credit facilities by commercial banks should be no more than four percent above the Central Bank Rate (CBR). Interest granted on interest earning deposits by commercial banks should be at least 70 percent of the CBR.
4.4 Host Country Assessment
CBK is the home regulator for nine (9) banks with cross border operations in seven jurisdictions. CBK is required to have supervisory overview of cross border operations of these banks in order to assess group wide risks. This requires CBK to leverage on supervisory work carried out by the host regulators.
Accordingly, CBK has a responsibility to assess the effectiveness of the regulatory and supervisory frameworks for host supervisors where Kenyan banks have operations. A structured assessment of host country supervision framework was formulated by Bank Supervision Department (BSD) with technical assistance from East AFRITAC. CBK has so far carried out the host country assessments for the Democratic Republic of Congo and Uganda. Various aspects were considered in the assessments including:
• Context – This is a review of the country’s banking industry, size and performance as well as the major economic indicators so as to assess the risks facing the banks in the country.
• Legal framework for Bank Supervision in the respective countries - This is a review of the legislation surrounding banking in the country and the Central Bank Act of the respective country as well as any additional guidelines the Central Bank has put in place for the purpose of bank supervision.
• Practice of Bank Supervision - The assessments also reviewed the bank supervision practices in the country to assess the adequacy of surveillance of banks by the central bank.
• Legal framework for Bank Resolution - This is a review of the legislation in the country on bank resolution including the powers of the central bank to intervene in problem institutions.
4.5 Developments in Anti-money Laundering and Combating the Financing of Terrorism (AML/CFT)
Technical Assistance, AML Training and Awareness Initiatives:
In 2016, Bank Supervision Department received Technical Assistance (TA) from the International Monetary Fund (IMF). The TA was conducted through two missions one from 29th March to 1st April 2016 and the other from 28th November to 2nd December 2016. These were the IMF’s sixth and seventh missions to Kenya since February 2014. The purpose of the missions was to assist the Department in developing risk-based off-site and on-site tools for Anti-Money Laundering and Combating the Financing of Terrorism (AML/CFT) supervision of commercial banks and microfinance banks.
The focus of the two missions in 2016 was on the supervisory component through designing a Money Laundering and Terrorism Financing (ML/TF) risk profiling methodology, as a foundation for future work on the off-site analysis and on-site inspection components. This incorporated the most commonly used elements:
i. Identifying and quantifying perceived threats/vulnerabilities for each bank.
ii. Assessing the quality of controls/mitigants in place in each bank.
iii. Calculating residual risk from i and ii above and generating a risk matrix with scores and weights.
iv. Developing a risk profile for each bank and combining a risk matrix with all relevant supervisory information.
v. Designing management information formats to assist the CBK in risk-based decision-making.
The TA received provided a useful framework for implementing risk based AML/CFT supervision of institutions and enabled the Central Bank to understand the risk profile of each institution.
DEVELOPMENTS IN SUPERVISORY FRAMEWORK

C E N T R A L B A N K O F K E N Y ABANK SUPERVISION ANNUAL REPORT 2016
39
Workshops conducted in 2016 included:
• Training on risk based AML/CFT off-site and on-site tools for inspectors in Bank Supervision conducted on 2nd December 2016 by an International Monetary Fund Mission at the CBK.
• Regional workshop on a Risk Based approach to AML/CFT supervision held from 5th to 9th September 2016 in Zanzibar, Tanzania. The workshop was organized by the IMF’s East AFRITAC aiming at creating a platform for Bank Supervisors and Financial Intelligence Units to exchange views and review developments on AML/CFT regulations and supervision.
• Seminar on the Freezing of Assets requirement pertaining to the UN Security Council Resolution 1373 (2001) held from 19th to 21st July 2016 at the Kenya School of Monetary Studies (KSMS). This was a workshop aimed at addressing the challenges faced by countries in implementing terrorist financing freezing mechanisms in accordance with the Financial Action Task Force (FATF) Recommendations.
• Workshop on Suspicious Transaction Reporting for Money Laundering Reporting Officers (MLROs) of Financial Institutions held on 4th April 2016 at the Kenya School of Monetary Studies (KSMS). The workshop was organized by the Financial Reporting Centre in conjunction with the IMF whose purpose was to sensitize MLROs on their obligations in reporting suspicious transactions
DEVELOPMENTS IN SUPERVISORY FRAMEWORK

C E N T R A L B A N K O F K E N Y ABANK SUPERVISION ANNUAL REPORT 2016
40
REGIONAL AND INTERNATIONAL DEVELOPMENTS AND INITIATIVES
REGIONAL AND INTERNATIONAL DEVELOPMENTS AND INITIATIVES
C E N T R A L B A N K O F K E N Y ABANK SUPERVISION ANNUAL 2016
40
CHAPTER 5

C E N T R A L B A N K O F K E N Y ABANK SUPERVISION ANNUAL REPORT 2016
41
5.1 Introduction
The Central Bank of Kenya (CBK) participated in regional and international initiatives aimed at enhancing the banking sector surveillance framework. Towards this end, CBK participated in supervisory colleges’ for some banks which Kenya is a host regulator. Participation in supervisory colleges for banks enhances coordination and information sharing between supervisors of affiliates of banking groups.
On the regional front, CBK actively participated in meetings aimed at operationalizing the East African Monetary Union (EAMU), which was ratified in 2015. CBK also participated in various global and regional initiatives aimed at strengthening overall supervision both domestically and internationally through enhanced cross-border regulatory co-operation. The 2016 regional and international initiatives in which the Bank took part focused on a wide range of supervisory areas including:-
• Strengthening Financial Sector Supervision and Current Regulatory Priorities.
• Risk Based Supervision.• Inclusive financial systems and innovative funding.• Implementation of Basel Capital Accords (Basel II/III).• Macro-prudential Analysis and harmonization of
Financial Soundness Indicators.• Crisis management and resolution.• Anti-Money Laundering and Combatting the
Financing of Terrorism.• Capacity building and knowledge exchange on
supervisory matters.
5.2 Regional and International Initiatives
• MonetaryAffairsCommitteeof theEastAfricanCommunity
The Monetary Affairs Committee (MAC) of the East African Community (EAC) is composed of the Governors’ of the five EAC member states Central Banks. The main task of MAC is to progress implementation of EAC decisions towards the envisaged full integration of the member states financial systems. MAC meetings are attended by the Central Bank Governors as well as technical officials. The key activities undertaken by MAC in respect to banking supervision in 2016 include:-
• The 20th Ordinary Monetary Affairs Committee (MAC) meeting was convened in Kampala, Uganda from the 11th to 14th July, 2016. The meeting reviewed the progress on the implementation of the decisions of the 19th Monetary Affairs Committee (MAC) meeting held in Zanzibar, Tanzania in August 2015 and decisions of the special MAC meeting held in December 2015. The decisions include mainly relating to implementation of the convergence criteria, spearheading development of national crisis management frameworks, promoting financial inclusion in respective jurisdictions as well as offering support to other domestic financial sector regulators in developing and rolling out Business Continuity Management guidelines.
• The Banking Supervision and Financial Stability Sub-Committee of MAC convened a meeting in October 2016 in Kigali, Rwanda. The objective of the meeting was to assess for each jurisdiction the level of compliance with the 29 revised Basel Core Principles for Effective Banking Supervision.
• In October 2016, CBK undertook a self- assessment of its compliance with the revised 29 BCPs issued in September 2012. The compliance status was shared during the October 2016 Kigali meeting. CBK has developed an action plan detailing the relevant amendments to be effected to the legal and regulatory framework to ensure full compliance with the remaining relevant BCPs.
• The MAC Crisis Management Working Group convened its fifth meeting from 29th November – 2nd December 2016 in Kigali, Rwanda. The objective of the Working Group on Crisis Management is to strengthen the key pillars of the crisis management infrastructure which include strong legal frameworks; strong financial supervision with early intervention powers; independent central banks with sound emergency liquidity assistance powers; effective resolution framework and; a strong inter-agency cooperation framework. In the meeting it was resolved that the EAC partner States Central Banks should develop a Resolution Funding Framework and improve Prompt Corrective Actions (PCAs) for banks within the East African Community region.
REGIONAL AND INTERNATIONAL DEVELOPMENTS AND INITIATIVES

C E N T R A L B A N K O F K E N Y ABANK SUPERVISION ANNUAL REPORT 2016
42
• The Banking Supervision and Financial Stability Sub-Committee of the Monetary Affairs Committee (MAC) of the East African Community (EAC) held a meeting from 21st – 23rd March 2016 at the Kenya School of Monetary Studies (KSMS) in Nairobi, Kenya. The purpose of the meeting was to review the progress made in the implementation of the approved convergence criteria for the EAC Central Banks regulatory, prudential and supervisory rules and practices. The meeting also discussed the proposed convergence criteria of selected prudential requirements (definitions of insiders, related parties, and components of capital and liquid assets) for commercial banks and Microfinance Institutions.
• East African Monetary Union (EAMU)
With the ratification and coming into force of the East African Monetary Union (EAMU) Protocol in January 2015, CBK participated in forums organised by the Monetary Affairs Committee (MAC) of the EAC aimed at operationalizing the Protocol. The following activities were part of efforts by MAC to implement the agreed convergence criteria on macro-prudential indicators to make these comparable across the region, as a prerequisite for the establishment of the proposed East African Monetary Union (EAMU).
• Technical Working Group Workshop on Harmonization of Financial Soundness Indicators (FSI) from 25th – 29th January 2016 in Dar es Salaam, Tanzania. The objective of the meeting was to review progress made by Partner States in the implementation of key recommendations from the EAC – FSI action plan (2014-2017), to address the compilation issues of FSIs and to fast-track the full implementation of the action plan within the set timelines. The harmonization of the FSIs in the EAC region will meet the statistical requirements associated with the East African Monetary Union (EAMU) Protocol in line with international standards.
• Macro-Prudential Analysis and Stress Testing (MAST) Workshop held in Zanzibar, from 22nd – 26th August 2016. The meeting reviewed and updated the Working Group Action Plan which prioritized tasks on: Macro-prudential Policy Framework, Regional Risks Assessment Frameworks, Improvement on Regional Stress Testing Exercise, and publication
of country Financial Stability Reports. It was recommended that the EAC Partner States Central Banks should:-
i. Consider and approve the Procedures developed by MAST-WG for conducting regional stress tests based on Cihak2 framework including sharing data on subsidiaries of regional banks and financial institutions; and
ii. Prioritize compilation of comprehensive regional dashboard for systemic risks assessment indicators focusing on addressing; data gaps, accuracy and reliability.
• Common Market for Eastern and Southern Africa (COMESA)
CBK participated in initiatives by COMESA. COMESA draws its’ membership from 20 Eastern and Southern African Countries with a vision of creating a common market in the region with a single currency. In particular, the Bank participated in:
o Training held on 18th to 21st July 2016 on Application of Stress Testing in the Financial System. The participants were trained on amongst others the Overview of Stress Testing, Scenario Design in Stress Testing, Indicators for Surveillance and Stress Tests, Shocks Applied in Micro Stress Testing Framework and Integrated Macro Stress Testing Frameworks.
o The 11th Meeting of the Financial System Development and Stability Sub-Committee held on 22nd and 23rd July 2016. The main agenda was for members to report on the implementation of the COMESA Assessment Framework and review of the Sub-Committee Work Plan for 2017.
• The Eastern and Southern Africa Anti-Money Laundering Group (ESAAMLG)
The Eastern and Southern Africa Anti-Money Laundering Group (ESAAMLG) is among the eight regional Financial Action Taskforce Style Regional Bodies (FSRBs) that form part of the Financial Action Task Force’s (FATF) global network.
2 This is a stress testing framework/tool which links macroeconomic variables (e.g. GDP, interest rates, exchange rate) to banks’ asset quality (bank-by-bank) for both Macro and Micro-prudential Stress Testing.
REGIONAL AND INTERNATIONAL DEVELOPMENTS AND INITIATIVES

C E N T R A L B A N K O F K E N Y ABANK SUPERVISION ANNUAL REPORT 2016
43
In 2016, the Bank Supervision Department being the host of the Secretariat to the National Taskforce on Anti-Money Laundering and Combating the Financing of Terrorism (NTF), continued to coordinate Kenya’s participation in ESAAMLG activities. These activities included the 31st ESAAMLG Taskforce of Senior Officials Meeting held in Arusha, Tanzania from 10th to 15th April 2016, the 32nd ESAAMLG Taskforce of Senior Officials Meeting and the 16th Council of Ministers’ Meeting both held in Zimbabwe from 28th August to 1st September 2016. Some of the notable outcomes of the meetings included the following:
• The phenomenon of de-risking as a major concern to the Financial Action Task Force (FATF). The following was observed:
o De-risking was indicated to lead to loss of correspondent banking services by: undermining financial system resilience; hindering competition; creating obstacles to trade; causing financial exclusion; and promoting underground financial channels that could be misused by criminals or terrorists.
o The establishment of a Correspondent Banking Coordination Group by the Financial Stability Board (FSB) to implement a four-point action plan to address the decline in correspondence banking. The four-point action plan deals with:
o Examining the dimensions of the problem, and its causes and effects;
o Clarifying regulatory expectations, as a matter of priority, including through guidance by the FATF;
o Domestic capacity-building in jurisdictions that are home to affected respondent banks; and
o Strengthening tools for due diligence by making better use of technology that would eventually reduce compliance costs.
• All member countries were encouraged to participate actively in all developments relevant to the region in the FATF, most notably in relation to de-risking and key indicators on Terrorist Financing risks.
• All member countries were directed to adequately prepare for assessments and to provide all necessary support and assistance to the ESAAMLG Secretariat and the Assessors to enable the second round mutual evaluations. The outcome of these mutual evaluations would benefit all member countries through improvement of their AML/CFT regimes.
• A work programme of ESAAMLG Secretariat was developed for the financial year 2016/2017 to cover:-
o Sustaining effective Post Evaluation Implementation of AML/CFT measures in member countries under the first round of assessments.
o Sustaining the second round of assessments and monitoring of ESAAMLG members technical compliance with the FATF Recommendations and the effectiveness of the AML/CFT systems.
o Building capacity in the understanding of money laundering and terrorist financing trends and techniques in the region in order to effectively contribute to regional and international AML/CFT policy formulation.
o Expansion of ESAAMLG membership and increase the visibility of ESAAMLG in the region.
o Strengthening and enhancing regional and international cooperation among member countries.
o Enhancing ESAAMLG’s cooperation and participation in AML/CFT regional and international initiatives.
o Prioritizing and consolidating regional AML/CFT capacity building, particularly for assessing ML/TF risks and adopting risk based approach to implementation of AML/CFT Standards.
o Promoting the implementation of risk-based AML/CFFT measures which support implementation of financial inclusion initiatives.
REGIONAL AND INTERNATIONAL DEVELOPMENTS AND INITIATIVES
C E N T R A L B A N K O F K E N Y ABANK SUPERVISION ANNUAL REPORT 2016
44
• Kenya’s Post Implementation Evaluation report that is used to gauge the effectiveness of the AML/CFT system in place was considered. It was noted that Kenya having recorded positive progress in the previous years, needed to make sufficient progress in addressing the non-core and non-key Recommendations namely;
o Preventive Measures – Designated Non-Financial Businesses and Professionals (DNFBPs);
o Suspicious Transaction Reporting – DNFBPs;
o High risk countries;
o Regulation, supervision and monitoring – DNFBPs;
o Statistics;
o Legal persons and beneficial ownership; and
o Legal arrangements and benef ic ial ownership.
• Alliance for Financial Inclusion (AFI)
The Alliance for Financial Inclusion (AFI) is the world’s leading organization on financial inclusion policy and regulation. AFI is now a member owned network hosted by Bank Negara Malaysia (BNM) in Sasana Kijang, Kuala Lumpur, Malaysia. On 27th January 2016, AFI was registered as an International Organization under Malaysian Law. CBK is a principal member of AFI serving as a major contact on financial inclusion in Kenya and coordinating the country’s engagement with AFI in its diverse activities and initiatives.
AFI spearheaded a number of initiatives and activities for its members in the period under review. CBK participated in the following initiatives:
i) Digital Financial Services (DFS) Capacity Building Project
Following the success of the Joint Learning Programme (JLP) held in February 2015 in Kenya, AFI in conjunction with CBK initiated the idea of having a capacity building training programme for AFI members who had reached a certain maturity level in Digital Financial Services (DFS). The objective was for regulators and policy makers to
keep abreast with the latest innovations and appropriate policy and regulatory policies in line with the evolving DFS industry. The project sought to provide a “share and learn” platform that would deliver knowledge and information to guide policy and the development of regulatory frameworks based on best practice. To achieve its objectives, the project was divided into three main activities as detailed below;
a) A Joint Learning Program (JLP) on key emerging topics in Digital Financial Services (DFS).
CBK hosted a successful five-day Joint Learning Programme (JLP) knowledge exchange visit for AFI members at the Kenya School of Monetary School from 2nd to 6th May 2016. The JLP workshop provided a platform for the participants to share and learn about each country’s financial inclusion experience, particularly in DFS. It was attended by 28 participants from various AFI member countries in Africa, Middle East and Latin America. The JLP sessions were scheduled as follows:-
• Two days covering workshop sessions: This provided the JLP participants an opportunity to learn about DFS in Kenya and also accorded participants from other countries an opportunity to make country presentations on their country experiences on DFS.
• Two days constituting field visits: The JLP participants made visits to Safaricom Limited, Commercial Bank of Africa Ltd., KCB Bank Ltd. and Cooperative Bank of Kenya Ltd. They also visited the bank agents contracted by banks undertaking Agency Banking including KCB-Mtaani and Coop kwa Jirani.
b) Three-day training workshop covering topical issues in DFS.
The three day workshop was held from 18th to 20th July 2016 at KSMS with field visits to M-Pesa agents and KCB agents (KCB Mtaani) on the last day. The training workshop provided a forum to AFI members to discuss and share insights on the historical and current development of DFS across the globe. The participating AFI members, represented countries that were in the early stages of the journey to establish a conducive regulatory environment to support a robust financial services delivery channel using digital platforms. The objective of the workshop was to draw from the experience of industry leaders as Kenya and also learn from external technical partners of AFI.
REGIONAL AND INTERNATIONAL DEVELOPMENTS AND INITIATIVES

C E N T R A L B A N K O F K E N Y ABANK SUPERVISION ANNUAL REPORT 2016
45
The training workshop was attended by thirty one (31) delegates who discussed various topics such as the different models of mobile financial services, emerging policy and regulatory trends, interoperability and consumer protection. In addition, the training workshop focused on the case studies of DFS models from respective country perspectives. The participants were from various AFI member countries such as Bangladesh, Paraguay, Peru, Afghanistan, Costa Rica, Mongolia, Zambia, Senegal, Zimbabwe, Ghana, Swaziland and Burundi.
c) Three-day Training workshop on next level and new frontiers/emerging issues in DFS.
The three day workshop was held from 26th to 28th September 2016 and was attended by AFI members as well as local participants to discuss emergent topics in DFS. The workshop was attended by 28 delegates and was facilitated by Bankable Frontier Associates (BFA) along with speakers from Groupe Speciale Mobile Association (GSMA), Tigo Tanzania, CGAP and Commercial Bank of Africa.
The workshop was aimed at helping regulators to strike the right regulatory and supervisory balance in order to create an enabling environment for innovation while ensuring that services are safe and that customers are treated fairly. The topics covered during the training workshop include; interoperability, cross border mobile money, consumer protection, customer identification (KYC, AML/CFT) and payment of interest on E-money and other DFS accounts.
Financial Stability Board’s Regional Consultative Group for Sub-Saharan Africa
CBK continued its participation in activities of the Financial Stability Board’s Regional Consultative Group for Sub-Saharan Africa (FSB RCG for SSA) and took part in the following activities in 2016:-
o 10th Meeting of the FSB RCG for SSA: CBK was represented at the 10th Meeting of the FSB RCG for SSA that was held on 25th October 2016 in Cape Town, South Africa. The meeting reviewed the progress of implementation of global financial sector reforms recommended by the FSB and other global standard setting bodies. The meeting also discussed a proposed framework for monitoring implementation of the reforms within the region. CBK, working with other
domestic financial sub-sector regulators and Central Banks in the East African Community, has adopted some of the reforms whose implementation is ongoing.
o FSB SSA Working Group on Home-Host Co-operation and Information Sharing: CBK also took part in a regional survey conducted by FSB SSA Working Group on Home-Host Co-operation and Information Sharing, which sought to assess the extent of co-operation and information sharing among home and host supervisors in the Sub-Saharan Africa region. The working group was established in October 2013 and is tasked with identifying the current status of, and challenges associated with, home-host cooperation and information sharing within SSA with a view to strengthening the oversight of financial groups operating in multiple jurisdictions. The report of the working group was submitted to the RCG for SSA meeting in October 2016 and will be useful in facilitating the work of the FSB across the region.
• International Institute of Finance
CBK joined the International Institute of Finance (IIF) as an Associate Member. The IIF is a global association of financial institutions created in 1983 with a mission to promote international financial stability. The IIF supports the financial industry by addressing topical economic policy issues and promoting best practices in policy formulation and implementation. The IIF draws its membership from financial institutions, economic, monetary and regulatory agencies around the world.
Through topical research, policy dialogue and capacity building, IIF benefits its members by advocating regulatory, financial, and economic policies that are in the broad interest of its members and which foster global financial stability.
In its first year of membership, CBK gained access to IIF’s insightful research and publications focusing on a broad range of economic and financial topics that are relevant to CBK’s mandate as a monetary and regulatory agency. CBK also became eligible to participate in IIF’s capacity building programmes that focus on, among other areas, financial supervision and regulation. For CBK, IIF membership provides an additional opportunity to benchmark its monetary and supervisory policies against global best practices.
REGIONAL AND INTERNATIONAL DEVELOPMENTS AND INITIATIVES
C E N T R A L B A N K O F K E N Y ABANK SUPERVISION ANNUAL REPORT 2016
46
• Financial Stability Institute Connect e-Learning
For continued learning and knowledge acquisition on regulatory matters, CBK subscribes to the Financial Stability Institute’s (FSI) on-line learning tool, FSI Connect. This is an on-line platform offered to member institutions by FSI, and is run by the Bank of International Settlements (BIS). FSI Connect offers on-line courses covering various areas of banking supervision. It provides users with insights into both the theory and practice of bank supervision, with a view to enhancing the technical capacity of supervisory personnel.
CBK was also represented at a consultative meeting of representatives of FSI Connect user institutions which was held in January 2016 in Basel, Switzerland. During the meeting, participants discussed the role of FSI Connect in building supervisory capacity and how the programme could be further enhanced to optimize the learning experience.
• IMF’s Technical Assistance
CBK benefited from IMF’s technical assistance in developing a stronger and effective banking sector regulatory and supervisory framework. The main activities undertaken by CBK’s Bank Supervision Department in 2016 with the support of the IMF East AFRITAC and IMF’s Monetary and Capital Markets Department are outlined below:-
i) IMF East AFRITAC
CBK hosted an East AFRITAC mission between 18th July and 29th July 2016. The aim of the mission was to build capacity of BSD staff on Consolidated Supervision. An essential element of banking supervision is the supervision of banking group on a consolidated basis. This entails adequately monitoring and applying prudential standards on all aspects of the business conducted by banking groups worldwide.
Determination of an institution’s primary business risks informs the relevant onsite and offsite supervisory tools and activities. In this regard, CBK hosted an East AFRITAC mission between 5th December to 9th December 2016 to provide technical assistance on developing and integrating the Risk Based Banking Supervision Framework. This framework ensures that findings for institutions are comprehensive, consistent and adequate resulting in enhanced surveillance.
As part of building capacity, BSD officers attended a Regional Workshop on Information Technology (IT) Risk Supervision held on 15th and 16th September 2016 in Dar-es-Salam, Tanzania. During the workshop the participants, discussed international and regional developments in IT systems, supervisory approaches and the capacity challenges.
ii) IMF Monetary and Capital Markets (MCM) Department
In its endeavour to strengthen its supervisory and regulatory frameworks, CBK hosted an IMF MCM mission on 25th January 2016 to 5th February 2016. The purpose of the mission was to review the banking sector regulatory and supervisory frameworks. In particular, the mission amongst others, focused on the BSD staffing, integration of risk based supervision, adequacy of stress testing and developing of legal and operational frameworks for crisis management to include cross border aspects and communication strategy.
CBK also hosted an IMF MCM mission between 8th and 18th November 2016 for capacity building on enhancing off-site supervision and stress-testing. The mission amongst others focused on supervisory reporting, data gaps, off-site supervisory processes as well as coordination between on-site and off-site supervisory components.
Further, CBK hosted an IMF Monetary and Capital Markets Department mission between 29th November and 2nd December 2016 on development of Risk Based AML/CFT Surveillance tools. Risk Based AML/CFT Surveillance tools complement prudential supervision and legal compliance with special attention directed to anti-money laundering and combating financing of terrorism frameworks.
• African Rural and Agricultural Credit Association (AFRACA)
The African Rural and Agricultural Credit Association (AFRACA) is a continental membership organization comprised of Central Banks, Agricultural Banks, Commercial Banks, Microfinance Institutions and country-specific programmes that deal with agriculture and rural finance in Africa. In line with its mission to improve the rural and agricultural finance environment through the promotion of appropriate policy framework and to support member and partner institutions to provide sustainable quality services, AFRACA organized the
REGIONAL AND INTERNATIONAL DEVELOPMENTS AND INITIATIVES

C E N T R A L B A N K O F K E N Y ABANK SUPERVISION ANNUAL REPORT 2016
47
5th AFRACA International Exposure Visit Program on Mobile and Agency Banking at the Kenya School of Monetary Studies from 22nd to 26th February 2016.
T h e c o n f e r e n c e w a s a t t e n d e d b y o v e r 4 0 participants drawn from 8 countries who discussed various topics such as the impact of mobile and agency banking on environmental sustainability, transforming value chain lending using technology, Mobile and agency products and services, case studies on: M-Pesa, M-Shari and M-banking. In addition, the participants were able to witness real time practices of Mobile and Agency Banking through presentations and field visits. The participants were urged to use the acquired knowledge during the study visit to change not just statistics but make people’s life better in their respective countries.
• Bank Supervision Application (BSA) The Bank Supervision Application (BSA) is web based software developed through a joint venture initiative of the Stakeholders to support the automation of Banking Supervision functions, in line with Basel Principles. Currently, the BSA application is being used by 12 (twelve) central banks, namely: Bunco de Cabot Verde, Bunco de Moçambique, Bank of Namibia, Bank of Uganda, Bank of Zambia, Banque Centrale du Congo, Banque de la République du Burundi, Central Bank of Kenya, Central Bank of Lesotho, Central Bank of Swaziland, Reserve Bank of Malawi and Reserve Bank of Zimbabwe.
The Bank of Mozambique currently hosts the BSA Support Office (BSO), responsible for development, maintenance and provide a second level support for the users of the BSA software.
The BSA system has undergone three upgrades and currently is running on BSA Version 3.0. The System is currently being upgraded to BSA v 4.0. In May 2016 the Bank of Mozambique hosted BSA Expert Group meeting which validated the BSA Version 4.0 user requirements. The new version is expected to be launched in 2017.
BSA is complemented by 3 modules in the current version (BSA v3.0) - Risk Analysis Automated System (RAAS), Institutional Information Submission System (IISS) and Bank Supervision System (BSS). However, the new version (BSA v4.0) will have additional Customer Protection System (CPS) module.
The Reserve Bank of Malawi hosted the BSA User Group meeting in July 2016. The meeting further validated BSA v4.0 development requirements. The meeting was also appraised on BSA v4.0 Development status.
• Knowledge Exchanges
The Central Bank of Kenya continued to host delegations from Africa in 2016 for study tours and knowledge exchange visits aimed at enriching cross-border relationships and sustaining long-term partnerships. The knowledge exchange visits that took place in 2016 are as indicated in Table 24 below:
Table 24: Knowledge Exchanges Undertaken in 2016Period Institution(s) Area(s) of InterestMay 2016 Bank of Tanzania Agent Banking in Kenya.June 2016 Bank of Uganda A benchmarking visit to study CBK’s structures and processes.September 2016 Bank of Gambia Operations and Regulation of Agency Banking in Kenya.
Source: CBK• Memorandum of Understanding
In an effort to enhance its relationship with foreign banking regulators, the Central Bank of Kenya continued to explore the possibility of entering into formal arrangements for supervisory cooperation with other banking regulators. This was aimed at promoting cross border banking supervisory cooperation as recommended by the Basel Committee on Banking Supervision. The MOUs with these regulators govern areas of mutual cooperation and collaboration, help define and guide the working relationships between regulators and enable the smooth exchange of supervisory information.
CBK continues to establish contacts with more central banks from various countries with a view to negotiating MOUs.
REGIONAL AND INTERNATIONAL DEVELOPMENTS AND INITIATIVES

C E N T R A L B A N K O F K E N Y ABANK SUPERVISION ANNUAL REPORT 2016
48
5.3 Kenyan Banks Regional Footprint
Background
As at 31st December 2016, nine Kenyan banks/institutions had subsidiaries operating in the East African Community (EAC), Partner States and South Sudan as compared to eleven banks in 2015. The banks include: KCB Group Holdings Ltd; Diamond Trust Bank Kenya Ltd; Commercial Bank of Africa Ltd; Guaranty Trust Bank Ltd; Equity Group Holdings Ltd; I&M Bank Ltd, African Banking Corporation Ltd, NIC Bank Ltd and the Co-operative Bank of Kenya Ltd. The Kenyan bank’s regional presence is as illustrated in Table 25.
Table 25: Branches of the Subsidiaries of Kenyan Banks in the Region
Institution/Country Uganda Tanzania Rwanda Burundi South Sudan DRC TOTAL
1 KCB Group 16 14 11 5 17 - 632 Diamond Trust Bank 38 26 - 4 - - 683 Commercial Bank of Africa 2 11 - - - - 134 Guaranty Trust Bank 9 - 14 - - - 235 Equity Group 28 13 12 - 5 31 896 I&M Bank 0 8 18 - - - 267 ABC Bank 4 - - - - - 48 NIC Bank 2 5 - - - - 7
9 The Co-operative Bank of Kenya - - - - 4 - 4
TOTAL 99 77 55 9 26 31 297Source: CBK
Besides having presence within the EAC Partner States, some of the Kenyan banks such as I&M Bank Kenya Ltd, Prime Bank (Kenya) Ltd and Equity Group Holdings Limited have expanded beyond the EAC boundaries. I&M Bank (K) has 50 percent shareholding in Bank One Limited in Mauritius, Prime Bank (Kenya) Ltd has 11.24 percent shareholding of First Merchant Bank in Malawi and 11.46 percent shareholding of Capital Bank of Botswana and Equity Group Holdings Limited acquired 79 percent ownership of ProCredit Bank of Democratic Republic of Congo.
KCB Group and Equity Group scaled down operations in South Sudan following the deteriorating security conditions in 2016. Equity scaled down to 5 branches compared to 18 in 2015 while KCB Group had 17 branches down from 18 in 2015.
The decline of banks with regional subsidiaries from eleven in 2015 to nine in 2016 was occasioned by Imperial Bank Ltd and Bank of Africa Ltd. The Ugandan subsidiary of Imperial Bank Ltd, which is currently under Kenya Deposit Insurance Corporation receivership, was sold in March 2016. Bank of Africa (BOA) Uganda is currently 100% foreign owned following the exit of BOA Kenya from the former’s shareholding. Bank of Africa (Kenya) also exited the Tanzania market where they had 25 branches in 2015 by offloading its shareholding in Bank of Africa (Tanzania).
The performance analysis for the nine banks as at 31st December 2016 is illustrated below. The analysis is based on the number of branches, number of employees, assets, loans, deposits and profits.
REGIONAL AND INTERNATIONAL DEVELOPMENTS AND INITIATIVES
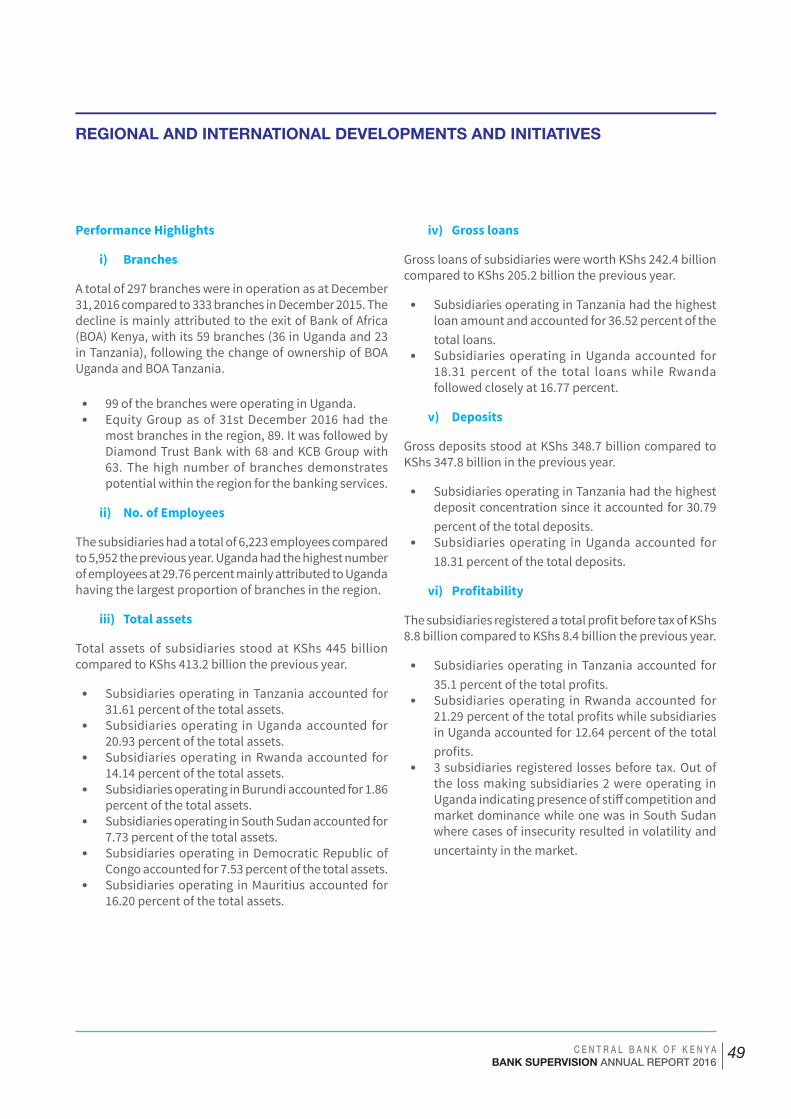
C E N T R A L B A N K O F K E N Y ABANK SUPERVISION ANNUAL REPORT 2016
49
Performance Highlights
i) Branches
A total of 297 branches were in operation as at December 31, 2016 compared to 333 branches in December 2015. The decline is mainly attributed to the exit of Bank of Africa (BOA) Kenya, with its 59 branches (36 in Uganda and 23 in Tanzania), following the change of ownership of BOA Uganda and BOA Tanzania.
• 99 of the branches were operating in Uganda.• Equity Group as of 31st December 2016 had the
most branches in the region, 89. It was followed by Diamond Trust Bank with 68 and KCB Group with 63. The high number of branches demonstrates potential within the region for the banking services.
ii) No. of Employees
The subsidiaries had a total of 6,223 employees compared to 5,952 the previous year. Uganda had the highest number of employees at 29.76 percent mainly attributed to Uganda having the largest proportion of branches in the region.
iii) Total assets
Total assets of subsidiaries stood at KShs 445 billion compared to KShs 413.2 billion the previous year.
• Subsidiaries operating in Tanzania accounted for 31.61 percent of the total assets.
• Subsidiaries operating in Uganda accounted for 20.93 percent of the total assets.
• Subsidiaries operating in Rwanda accounted for 14.14 percent of the total assets.
• Subsidiaries operating in Burundi accounted for 1.86 percent of the total assets.
• Subsidiaries operating in South Sudan accounted for 7.73 percent of the total assets.
• Subsidiaries operating in Democratic Republic of Congo accounted for 7.53 percent of the total assets.
• Subsidiaries operating in Mauritius accounted for 16.20 percent of the total assets.
iv) Gross loans
Gross loans of subsidiaries were worth KShs 242.4 billion compared to KShs 205.2 billion the previous year.
• Subsidiaries operating in Tanzania had the highest loan amount and accounted for 36.52 percent of the total loans.
• Subsidiaries operating in Uganda accounted for 18.31 percent of the total loans while Rwanda followed closely at 16.77 percent.
v) Deposits
Gross deposits stood at KShs 348.7 billion compared to KShs 347.8 billion in the previous year.
• Subsidiaries operating in Tanzania had the highest deposit concentration since it accounted for 30.79 percent of the total deposits.
• Subsidiaries operating in Uganda accounted for 18.31 percent of the total deposits.
vi) Profitability
The subsidiaries registered a total profit before tax of KShs 8.8 billion compared to KShs 8.4 billion the previous year.
• Subsidiaries operating in Tanzania accounted for 35.1 percent of the total profits.
• Subsidiaries operating in Rwanda accounted for 21.29 percent of the total profits while subsidiaries in Uganda accounted for 12.64 percent of the total profits.
• 3 subsidiaries registered losses before tax. Out of the loss making subsidiaries 2 were operating in Uganda indicating presence of stiff competition and market dominance while one was in South Sudan where cases of insecurity resulted in volatility and uncertainty in the market.
REGIONAL AND INTERNATIONAL DEVELOPMENTS AND INITIATIVES

C E N T R A L B A N K O F K E N Y ABANK SUPERVISION ANNUAL REPORT 2016
50
Appendix IBANKING SECTOR BALANCE SHEET - DECEMBER 2016-Ksh.M
Dec-15 Dec-16
A ASSETS BANKS NBFIS GRAND TOTAL
% OF TOTAL BANKS NBFIS GRAND
TOTAL % OF TOTAL
1 Cash ( both Local & Foreign) 58,519 323 58,842 1.70% 62,242 477 62,719 1.7%
2 Balances due from Central Bank of Kenya 188,503 4,127 192,630 5.50% 156,019 2,895 158,914 4.3%
3 Kenya Government and other securities held for dealing purposes 26,180 - 26,180 0.70% 28,759 - 28,759 0.8%
4 Financial Assets at fair value through profit and loss 2,842 - 2,842 0.10% 1,132 - 1,132 0.0%
5 Investment Securities:a) Held to Maturity: - - - - 15,688 - 15,688 0.4%a. Kenya Government securities 371,435 1,571 373,006 10.70% 411,587 3,557 415,144 11.2%b. Other securities 10,354 - 10,354 0.30% 6,476 - 6,476 0.2%b) Available for sale: - - - - 91 - 91 0.0%a. Kenya Government securities 284,776 580 285,355 8.20% 421,559 529 422,087 11.4%b. Other securities 9,113 - 9,113 0.30% 11,336 - 11,336 0.3%
6 Deposits and balances due from local banking institutions 67,749 4,910 72,658 2.10% 40,249 2 40,251 1.1%
7 Deposits and balances due from banking institutions abroad 69,424 608 70,032 2.00% 73,167 1,657 74,824 2.0%
8 Tax recoverable 1,881 - 1,881 0.10% 2,013 37 2,050 0.1%
9 Loans and advances to customers (net) 2,038,340 53,021 2,091,361 59.90% 2,128,162 54,470 2,182,631 59.1%
10 Balances due from banking institutions in the group 70,949 - 70,949 2.00% 63,475 - 63,475 1.7%
11 Investments in associates 5,809 - 5,809 0.20% 5,590 - 5,590 0.2%12 Investments in subsidiary companies 32,538 - 32,538 0.90% 23,876 - 23,876 0.6%13 Investments in joint ventures - 256 256 0.00% - 274 274 0.0%14 Investment properties 1,061 - 1,061 0.00% 1,417 - 1,417 0.0%15 Property and equipment 58,091 1,339 59,430 1.70% 58,127 1,455 59,582 1.6%16 Prepaid lease rentals 951 39 990 0.00% 1,152 39 1,191 0.0%17 Intangible assets 19,709 819 20,528 0.60% 24,193 1,212 25,406 0.7%18 Deferred tax asset 19,031 585 19,616 0.60% 23,979 751 24,730 0.7%19 Retirement benefit asset 1,236 - 1,236 0.00% 876 - 876 0.0%20 Other assets 85,347 632 85,978 2.50% 82,473 730 83,203 2.3%21 TOTAL ASSETS 3,423,835 68,809 3,492,643 100.00% 3,627,858 68,085 3,695,943 100.0%B LIABILITIES22 Balances due to Central Bank of Kenya 5,046 - 5,046 0.10% 21,747 - 21,747 0.70%23 Customer deposits 2,444,032 41,888 2,485,920 71.20% 2,580,234 38,156 2,618,390 84.51%
24 Deposits and balances due to local banking institutions 46,401 - 46,401 1.30% 36,486 625 37,111 1.20%
25 Deposits and balances due to foreign banking institutions 85,937 - 85,937 2.50% 77,986 - 77,986 2.52%
26 Other money market deposits 8,579 - 8,579 0.20% - - - 0.00%27 Borrowed funds 166,009 17,466 183,475 5.30% 185,222 18,790 204,011 6.58%
28 Balances due to banking institutions in the group 73,709 - 73,709 2.10% 46,955 - 46,955 1.52%
29 Tax payable 1,637 11 1,647 0.00% 6,870 - 6,870 0.22%30 Dividends payable 1,534 - 1,534 0.00% 47 - 47 0.00%31 Deferred tax liability 208 - 208 0.00% 141 - 141 0.00%32 Retirement benefit liability 165 - 165 0.00% 238 - 238 0.01%33 Other liabilities 59,087 354 59,442 1.70% 84,167 740 84,906 2.74%34 TOTAL LIABILITIES 2,892,347 59,719 2,952,065 84.50% 3,040,092 58,310 3,098,402 100.00%C SHAREHOLDERS’ FUNDS35 Paid up /Assigned capital 121,413 5,000 126,413 3.60% 173,558 5,000 178,558 29.9%36 Share premium/(discount) 82,334 3,514 85,847 2.50% 65,921 3,514 69,435 11.6%37 Revaluation reserves -2,078 - -2,078 -0.10% 4,608 - 4,608 0.8%
38 Retained earnings/Accumulated losses 288,543 166 288,709 8.30% 301,304 807 302,111 50.6%
39 Statutory loan loss reserves 19,113 393 19,506 0.60% 21,023 453 21,477 3.6%40 Other Reserves -3,781 -33 -3,814 -0.10% (1,822) (50) (1,872) -0.3%41 Proposed dividends 23,561 - 23,561 0.70% 20,805 - 20,805 3.5%42 Capital grants 2,384 51 2,435 0.10% 2,369 51 2,420 0.4%43 TOTAL SHAREHOLDERS’ FUNDS 531,488 9,090 540,578 15.50% 587,767 9,775 597,542 100.0%44 Minority Interest - - - 0.00% - - -
45 TOTAL LIABILITIES AND SHAREHOLDERS’ FUNDS 3,423,835 68,809 3,492,643 100.00% 3,627,858 68,085 3,695,943

C E N T R A L B A N K O F K E N Y ABANK SUPERVISION ANNUAL REPORT 2016
51
Appendix IIBANKING SECTOR PROFIT & LOSS ACCOUNT - DECEMBER 2016 KShs. Million
Dec-2015 Dec-16 BANKS NBFIS TOTAL % OF
TOTAL BANKS NBFIS TOTAL % OF TOTAL
1 INTEREST INCOME1.1 Loans and advances 272,106 7,218 279,324 61.10% 290,301 7,889 298,191 81.27%1.2 Government securities 67,712 123 67,835 14.80% 89,062 504 89,566 24.41%
1.3 Deposits and placements with banking institutions 9,163 759 9,922 2.20% 5,641 214 5,855 1.60%
1.4 Other Interest Income 2,411 - 2,411 0.50% 2,950 - 2,950 0.80%1.5 Total interest income 351,393 8,100 359,493 78.70% 387,955 8,607 396,562 108.08%2 INTEREST EXPENSE 0.00%2.1 Customer deposits 111,076 2,892 113,968 35.30% 110,228 2,940 113,169 30.84%
2.2 Deposits and placement from banking institutions 8,510 - 8,510 2.60% 9,389 2 9,391 2.56%
2.3 Other interest expenses 9,021 1,627 10,648 3.30% 11,165 1,702 12,867 3.51%2.4 Total interest expenses 128,607 4,519 133,126 41.20% 130,782 4,644 135,426 36.91%3 NET INTEREST INCOME/(LOSS) 222,786 3,582 226,367 257,172 3,963 261,136 71.17%4 NON-INTEREST INCOME4.1 Fees and commissions on loans and
advances 20,422 192 20,614 4.50% 23,058 149 23,207 6.32%
4.2 Other fees and commissions 42,138 107 42,245 9.20% 41,730 119 41,849 11.41%
4.3 Foreign exchange trading income/(Loss) 22,960 60 23,020 5.00% 24,033 4 24,037 6.55%
4.4 Dividend Income 808 200 1,008 0.20% - - - 0.00%4.5 Other income 10,308 122 10,430 2.30% 16,224 89 16,313 4.45%4.6 Total Non-interest income 96,636 681 97,317 21.30% 105,413 360 105,773 28.83%5 TOTAL OPERATING INCOME 448,029 8,781 456,810 100.00% 362,586 4,323 366,909 100.00%6 OTHER OPERATING EXPENSES6.1 Loan loss provision 28,275 504 28,778 8.90% 41,756 699 42,455 12.0%6.2 Staff costs 76,568 1,004 77,572 24.00% 83,973 787 84,761 23.9%6.3 Directors’ emoluments 2,234 19 2,252 0.70% 2,267 19 2,286 0.6%6.4 Rental charges 9,494 61 9,555 3.00% 10,356 99 10,455 2.9%
6.5 Depreciation charge on property and equipment 10,778 93 10,872 3.40% 11,458 152 11,609 3.3%
6.6 Amortisation charges 4,311 11 4,322 1.30% 4,976 172 5,149 1.5%6.7 Other operating expenses 55,482 833 56,315 17.40% 61,799 950 62,748 17.7%6.8 Total Other Operating Expenses 187,141 2,525 189,667 58.80% 216,585 2,878 219,464 61.8% TOTAL EXPENSES(2.4+6.8) 315,749 7,044 322,792 100.00% 347,368 7,522 354,890 100.0% 7 Profit/(loss)BeforeTaxand
Exceptional Items 132,280 1,737 134,017 146,000 1,445 147,4458.0 Exceptional Items -240 -83 -323 878 (19) 8599.0 Profit/(Loss) After Exceptional Items 132,521 1,820 134,341 145,122 1,464 146,58610.0 Current Tax 41,256 620 41,876 50,346 623 50,96911.0 Deferred Tax -2,726 -125 -2,851 (7,453) (160) (7,612)12.0 Profit/(Loss) After Tax and
Exceptional Items 93,991 1,325 95,316 102,229 1,001 103,230
13.0 Minority Interest - - - - -14.0 Profit/(loss) after tax, exceptional
items and Minority Interest 93,991 1,325 95,316 102,229 1,001 103,230
15.0 Other Comprehensive Income - - -
15.1Gains/(Losses) from translating thefinancialstatementsofforeign operations
-1,084 - -1,084 175 - 175
15.2 Fair value changes in available for sale financial assets -8,211 -19 -8,230 6,671 (23) 6,648
15.3 Revaluation surplus on Property, plant and equipment -1,036 - -1,036 2,388 - 2,388
15.4 Share of other comprehensive income of associates -25 - -25 - - -
15.5 Income tax relating to components of other comprehensive income 1,390 6 1,396 (1,131) 7 (1,124)
16 Other Comprehensive Income for the year net of tax -8,966 -13 -8,980 8,103 (16) 8,086

C E N T R A L B A N K O F K E N Y ABANK SUPERVISION ANNUAL REPORT 2016
52
Appendix IIIBANKING SECTOR OTHER DISCLOSURES -DECEMBER 2016 - KShs M
Dec-15 Dec-16BANKS NBFIS TOTAL BANKS NBFIS TOTAL ANNUAL %
GROWTHNON-PERFORMING LOANS AND ADVANCES(a) Gross Non-performing loans and advances 143,234 4,097 147,331 208,181 6,193 214,374 45.50%(b) Less: Interest in Suspense 22,569 610 23,179 34,683 1,018 35,701 54.00%(c)Total Non-Performing Loans and Advances (a-b) 120,665 3,487 124,152 173,498 5,176 178,674 43.90%(d) Less: Loan Loss Provision 49,796 993 50,789 73,560 1,298 74,858 47.40%(e) Net Non-Performing Loans and Advanc-es(c-d) 70,869 2,494 73,363 99,938 3,878 103,815 41.50%(f) Discounted Value of Securities 66,219 2,494 68,713 95,080 3,878 98,957 44.00%(g) Net NPLs Exposure (e-f) 4,650 - 4,650 4,858 - 4,858 4.50%
INSIDER LOANS AND ADVANCES(a) Directors, Shareholders and Associates 22,564 736 23,300 31,297 582 31,879 36.80%(b) Employees 66,346 1,002 67,348 68,325 1,140 69,465 3.10%(c)Total Insider Loans and Advances and other facilities 88,910 1,738 90,648 99,621 1,722 101,344 11.80%
OFF-BALANCE SHEET ITEMS - -(a)Letters of credit, guarantees, acceptances 385,956 256 386,212 386,407 1,053 387,460 0.30%(b) Forwards, swaps and options 336,233 - 336,233 227,435 400 227,834 -32.20%(c)Other contingent liabilities 39,119 - 39,119 33,880 - 33,880 -13.40%(d)Total Contingent Liabilities 761,308 256 761,564 647,721 1,453 649,174 -14.80%
CAPITAL STRENGTH(a)Core capital 457,198 8,095 465,293 512,247 8,519 520,766 11.90%(b) Minimum Statutory Capital 39,000 1,000 40,000 38,000 1,000 39,000 -2.50%(c)Excess/(Deficiency)(a-b) 418,198 7,095 425,293 474,247 7,519 481,766 13.30%(d) Supplementary Capital 83,067 1,453 84,520 84,974 1,060 86,034 1.80%(e) Total Capital (a+d) 540,265 9,548 549,813 597,220 9,580 606,800 10.40%(f)Total risk weighted assets 2,855,529 52,672 2,908,201 3,016,165 54,161 3,070,327 5.60%(g) Core Capital/Total deposits Liabilities 18.70% 19.30% 19.00% 20.00% 22.30% 20.00%(h) Minimum statutory Ratio 8.00% 8.00% 8.00% 8.00% 8.00% 8.00%(I) Excess/(Deficiency) (g-h) 10.70% 11.30% 11.00% 12.00% 14.30% 12.00%(j) Core Capital / total risk weighted assets 16.00% 15.40% 16.00% 17.00% 15.70% 17.00%(k) Minimum Statutory Ratio 10.50% 10.50% 10.50% 10.50% 10.50% 10.50%(l) Excess (Deficiency) (j-k) 5.50% 4.90% 5.90% 6.50% 5.20% 6.50%(m) Total Capital/total risk weighted assets 18.90% 18.10% 18.90% 19.80% 17.70% 19.80%(n) Minimum statutory Ratio 14.50% 14.50% 14.50% 14.50% 14.50% 14.50%(o) Excess/(Deficiency) (m-n) 4.40% 3.60% 5.20% 5.30% 3.20% 5.30%LIQUIDITY(a) Liquidity Ratio 38.30% 25.10% 38.30% 41.80% 18.90% 41.40%(b) Minimum Statutory Ratio 20% 20% 20% 20.00% 20.00% 20.00%(c) Excess (Deficiency) (a-b) 18.30% 5.10% 18.30% 21.80% -1.10% 21.40%Performance IndicatorsYield on Earning Assets 12.70% 13.30% 12.70% 11.80% 13.70% 11.80%Cost of Funding Earning Assets 4.50% 7.40% 4.60% 4.00% 7.40% 4.00%Interest Margin on Earning Assets 8.20% 5.90% 8.10% 7.80% 6.30% 7.80%Yield on Advances 13.10% 13.50% 13.10% 12.90% 13.80% 13.00%Cost of Deposits 5.40% 10.80% 5.50% 5.00% 12.00% 5.10%Return on Assets (ROA) 2.90% 2.50% 2.90% 3.30% 2.00% 3.20%Return on Equity (ROE) 23.90% 19.20% 23.80% 24.60% 14.90% 24.40%Overheads to Earnings 41.60% 28.80% 41.30% 43.50% 32.10% 43.30%Gross NPLs/Gross Loans 6.80% 6.10% 6.80% 9.20% 13.70% 9.20%RATINGS 3 3 3 2 2 1Capital Adequacy 1 1 1 1 2 1Asset Quality 1 2 2 1 2 1Earnings 1 3 1 1 3 2Liquidity 1 2.25 1 1.25 2 1.25Composite Score Strong Satisfac-
toryStrong Strong Satisfac-
toryStrong
Performance CategoryRating PERFOR-
MANCE CATEGORY
CAPITAL ADEQUACY
ASSET QUALITY (NPA-Provi-sions)/ Gross Advances (%)
MANAGE-MENT
EARNINGS Net Profits/Total Assets (%)
LIQUIDITY Net Liquid Assets/To-tal (%)
COMPO-SITE RATING Average Score
Total Cap-ital/TRWA (%)
Total Weighted Score
1 Strong 19.50% and above
0-5% 1.0 - 1.4 Over 3% Over 34% 1.0-1.4
2 Satisfac-tory
15.60%-19.49%
5.1%-10.0% 1.5 - 2.4 2.0%-2.9% 26%-34% 1.5-2.4
3 Fair 12.00%-15.59%
10.1%-15.0% 2.5 - 3.4 1.0%-1.9% 20%-25% 2.5-3.4
4 Marginal 8.31%-11.99%
15.1%-20.0% 3.5 - 4.4 0.0%-0.9% 15%-19% 3.5-4.4
5 Unsatis-factory
8.30 and below
Over 20% 4.5 - 5.0 Net Loss Under 15% 4.5-5.0

C E N T R A L B A N K O F K E N Y ABANK SUPERVISION ANNUAL REPORT 2016
53
Appendix IV
BANKING SECTOR MARKET SHARE -DECEMBER 2016
Market size index
TOTAL NET ASSETS
% of the Market
Total Deposits
% of the Market
Total Share-holders’ funds
% of the Market
Total number Deposit accounts(Million)
% of the Market
Number loan accounts
% of the Market
KShs M KShs M KShs M
Weighting 0.33 0.33 0.33 0.005 0.005
Large Peer Group >5%
1 KCB Bank Kenya Ltd 14.10% 504,777.67 13.70% 386,611 14.80% 80,989.89 13.70% 4.594 11.20% 1.293 16.50%
2 Equity Bank Ltd. 10.00% 379,749.00 10.30% 277,274.67 10.60% 52,341.04 8.80% 9.316 22.70% 0.836 10.70%
3 Co - operative Bank of Kenya Ltd 9.90% 349,997.76 9.50% 259,471.75 10.00% 60,045.83 10.10% 2.939 7.10% 1.651 21.10%
4 Barclays Bank of Kenya Ltd 7.00% 259,498.22 7.00% 178,447.78 6.80% 42,094.71 7.10% 1.633 4.00% 0.23 2.90%
5 Standard Chartered Bank (K) Ltd 7.00% 250,274.11 6.80% 186,598.23 7.20% 43,904.78 7.40% 0.22 0.50% 0.052 0.70%
6 Diamond Trust Bank (K) Ltd 6.40% 244,123.82 6.60% 169,599.90 6.50% 36,431.81 6.10% 0.794 1.90% 0.013 0.20%
7 Commercial Bank of Africa Ltd 5.90% 210,877.93 5.70% 159,284.81 6.10% 27,470.17 4.60% 17.502 42.60% 3.264 41.80%
8 Stanbic Bank (K) Ltd 5.10% 204,895.16 5.50% 121,989.23 4.70% 30,237.50 5.10% 0.139 0.30% 0.029 0.40%
Sub-Total 65.40% 2,404,193.67 65.10% 1,739,277.37 66.70% 373,515.73 62.90% 37.14 90.30% 7.37 94.30%
Medium Peer Group (1-5%)
9 NIC Bank Ltd 4.50% 161,847.35 4.40% 104,160.20 4.00% 30,288.26 5.10% 0.101 0.20% 0.034 0.40%
10 I&M Bank Ltd 4.20% 164,116.12 4.40% 103,740.63 4.00% 26,186.68 4.40% 0.113 0.30% 0.012 0.20%
11 National Bank of Kenya Ltd 2.90% 115,114.37 3.10% 96,966.52 3.70% 10,996.08 1.90% 0.52 1.30% 0.054 0.70%
12 Citibank N.A. Kenya 2.80% 103,323.54 2.80% 62,485.52 2.40% 19,628.61 3.30% 0.002 0.00% 0.001 0.00%
13 Bank of Baroda (K) Ltd 2.40% 82,907.48 2.20% 64,873.60 2.50% 14,224.91 2.40% 0.046 0.10% 0.003 0.00%
14 Family Bank Ltd. 1.90% 69,432.37 1.90% 41,473.32 1.60% 12,618.88 2.10% 2.007 4.90% 0.144 1.80%
15 HFC Ltd 1.60% 68,084.93 1.80% 38,155.86 1.50% 9,774.97 1.60% 0.108 0.30% 0.012 0.20%
16 Prime Bank Ltd 1.80% 65,338.22 1.80% 49,312.80 1.90% 10,833.99 1.80% 0.029 0.10% 0.004 0.10%
17 Bank of Africa (K) Ltd 1.40% 55,995.67 1.50% 34,463.71 1.30% 8,417.99 1.40% 0.108 0.30% 0.02 0.30%
18 Bank of India 1.30% 47,815.08 1.30% 26,726.39 1.00% 9,536.34 1.60% 0.015 0.00% 0.001 0.00%
19 Ecobank Kenya Ltd 1.20% 47,123.84 1.30% 32,242.99 1.20% 7,307.24 1.20% 0.059 0.10% 0.008 0.10%
Sub-Total 26.00% 981,098.97 26.5% 654,601.54 0.25 159,813.95 0.27 3.11 7.6% 0.29 3.80%
Small Peer Group <1%
20 Guaranty Trust Bank Ltd 0.90% 29,619.07 0.80% 16,561.68 0.60% 8,366.45 1.40% 0.018 0.00% 0.045 0.60%
21 Gulf African Bank Ltd 0.80% 27,156.26 0.70% 21,754.94 0.80% 4,375.71 0.70% 0.078 0.20% 0.007 0.10%
22 African Banking Corporation Ltd 0.60% 22,422.35 0.60% 16,078.45 0.60% 2,996.76 0.50% 0.036 0.10% 0.002 0.00%
23 Victoria Commercial Bank Ltd 0.70% 22,403.48 0.60% 15,695.95 0.60% 5,060.04 0.90% 0.004 0.00% 0.001 0.00%
24 Sidian Bank Ltd 0.60% 20,875.50 0.60% 13,685.09 0.50% 3,868.79 0.70% 0.257 0.60% 0.036 0.50%
25 Habib Bank A.G. Zurich 0.50% 17,032.99 0.50% 11,772.94 0.50% 2,964.98 0.50% 0.005 0.00% 0 0.00%
26 Development Bank of Kenya Ltd 0.40% 16,418.38 0.40% 5,788.51 0.20% 2,903.34 0.50% 0.002 0.00% 0.001 0.00%
27 Giro Commercial Bank Ltd 0.50% 16,254.02 0.40% 12,938.39 0.50% 3,077.44 0.50% 0.008 0.00% 0.002 0.00%
28 Jamii Bora Bank Ltd 0.40% 15,724.25 0.40% 8,095.10 0.30% 3,590.08 0.60% 0.137 0.30% 0.024 0.30%
29 First Community Bank Ltd 0.40% 14,962.09 0.40% 12,655.46 0.50% 1,557.41 0.30% 0.145 0.40% 0.002 0.00%
30 Guardian Bank Ltd 0.40% 14,705.35 0.40% 12,313.03 0.50% 2,214.59 0.40% 0.012 0.00% 0.001 0.00%
31 Consolidated Bank of Kenya Ltd 0.30% 13,917.90 0.40% 9,491.80 0.40% 1,403.07 0.20% 0.048 0.10% 0.004 0.10%
32 Spire Bank Ltd 0.30% 13,802.50 0.40% 8,542.84 0.30% 1,817.22 0.30% 0.023 0.10% 0.009 0.10%
33 Habib Bank Ltd 0.40% 12,508.03 0.30% 8,215.36 0.30% 2,453.62 0.40% 0.004 0.00% 0 0.00%
34 Credit Bank Ltd 0.40% 12,201.97 0.30% 9,135.30 0.40% 2,459.57 0.40% 0.024 0.10% 0.002 0.00%
35 Trans - national Bank Ltd 0.30% 10,464.50 0.30% 8,000.00 0.30% 2,073.41 0.30% 0.068 0.20% 0.011 0.10%
36 M Oriental Commercial Bank Ltd 0.30% 9,920.25 0.30% 6,936.72 0.30% 2,931.49 0.50% 0.004 0.00% 0.001 0.00%
37 Paramount Bank Ltd 0.30% 9,426.93 0.30% 7,667.90 0.30% 1,644.21 0.30% 0.01 0.00% 0.003 0.00%
38 UBA Kenya Ltd 0.20% 5,601.28 0.20% 1,947.36 0.10% 2,143.39 0.40% 0.002 0.00% 0.001 0.00%
39 Middle East Bank (K) Ltd 0.20% 5,233.52 0.10% 3,996.06 0.20% 1,192.11 0.20% 0.002 0.00% 0.001 0.00%
40 Charterhouse Bank Ltd **
41 Chase Bank Ltd*
42 Fidelity Commercial Bank Ltd***
Sub-Total 8.90% 310,650.62 8.40% 211,272.88 8.20% 59,093.68 10.00% 0.89 2.10% 0.15 1.80%
Grand Total 100.00% 3,695,943.24 100.00% 2,605,151.98 100.00% 592,423.35 100.00% 41.13 100.00% 7.812 100.00%
* Banks under statutory management * *Banks under receivership *** Bank in transition to be acquired
Source: Published Financial Statements

C E N T R A L B A N K O F K E N Y ABANK SUPERVISION ANNUAL REPORT 2016
54
Appendix V BANKING SECTOR PROFITABILITY - DECEMBER 2016
RETURN ON ASSETS RETURN ON EQUITY 1 2 3 4 5
Profit/(loss)Before Tax
TOTAL ASSETS % (1/2) SHAREHOLDERS’
FUNDS % (1/4)
1 KCB Bank Kenya Limited 28,482 504,778 5.64% 80,990 35.2%2 Equity Bank (Kenya) Limited 22,778 379,749 6.00% 52,341 43.5%3 Co-operative Bank of Kenya Limited 18,024 349,998 5.15% 60,046 30.0%4 Standard Chartered Bank Kenya Limited 12,764 250,274 5.10% 43,905 29.1%5 Barclays Bank of Kenya Limited 10,440 259,498 4.02% 42,095 24.8%6 Diamond Trust Bank Kenya Limited 8,876 244,124 3.64% 36,432 24.4%7 I & M Bank Limited 8,651 164,116 5.27% 31,305 27.6%8 Commercial Bank of Africa Limited 7,593 210,878 3.60% 27,470 27.6%9 Stanbic Bank Kenya Limited 6,910 204,895 3.37% 30,238 22.9%
10 Citibank N.A Kenya 6,033 103,324 5.84% 19,629 30.7%11 NIC Bank Limited 5,926 161,847 3.66% 30,288 19.6%12 Bank of Baroda (K) Limited 3,876 82,907 4.67% 14,225 27.2%13 Prime Bank Limited 2,336 65,338 3.57% 10,834 21.6%14 Bank of India Ltd 2,185 47,815 4.57% 9,536 22.9%15 HFC Limited 1,445 68,085 2.12% 9,775 14.8%16 Victoria Commercial Bank Limited 796 22,403 3.55% 5,060 15.7%17 Gulf African Bank Limited 754 27,156 2.78% 4,376 17.2%18 Guaranty Trust Bank ( K) Limited 659 29,619 2.23% 8,366 7.9%19 Family Bank Limited 633 69,432 0.91% 12,619 5.0%20 Habib Bank A.G Zurich 622 17,033 3.65% 2,965 21.0%21 Giro Commercial Bank Limited 601 16,254 3.70% 3,077 19.5%22 Habib Bank Limited 493 12,508 3.94% 2,454 20.1%23 Guardian Bank Limited 302 14,705 2.05% 2,215 13.6%24 African Banking Corporation Limited 222 22,422 0.99% 2,997 7.4%25 National Bank of Kenya Limited 162 115,114 0.14% 10,996 1.5%26 Transnational Bank Limited 160 10,465 1.53% 2,073 7.7%27 Credit Bank Limited 158 12,202 1.30% 2,460 6.4%28 Paramount Bank Limited 105 9,427 1.11% 1,644 6.4%29 Development Bank of Kenya Limited 95 16,418 0.58% 2,903 3.3%30 Sidian Bank Limited 62 20,875 0.30% 3,869 1.6%31 UBA Kenya Bank Limited 50 5,601 0.89% 2,143 2.3%32 M-Oriental Bank Limited 36 9,920 0.36% 2,931 1.2%33 Bank of Africa Kenya Limited (16) 55,996 -0.03% 8,418 -0.2%34 First Community Bank Limited (41) 14,962 -0.28% 1,557 -2.7%35 Middle East Bank (K) Limited (101) 5,234 -1.93% 1,192 -8.5%36 Consolidated Bank of Kenya Limited (277) 13,918 -1.99% 1,403 -19.7%37 Jamii Bora Bank Limited (490) 15,724 -3.12% 3,590 -13.7%38 Spire Bank Limited (968) 13,802 -7.01% 1,817 -53.3%39 Ecobank Kenya Limited (2,889) 47,124 -6.13% 7,307 -39.5%40 Chase Bank (K) Limited*41 Chase Bank (K) Limited*42 Charterhouse Bank Limited**43 Fidelity Commercial Bank Limited*** TOTAL 147,445 3,695,943 3.99% 597,542 24.7%
Source: Banks Published Financial Statements*- The banks are in receivership hence excluded**- The bank is under statutory management.*** Bank in transition to be acquired
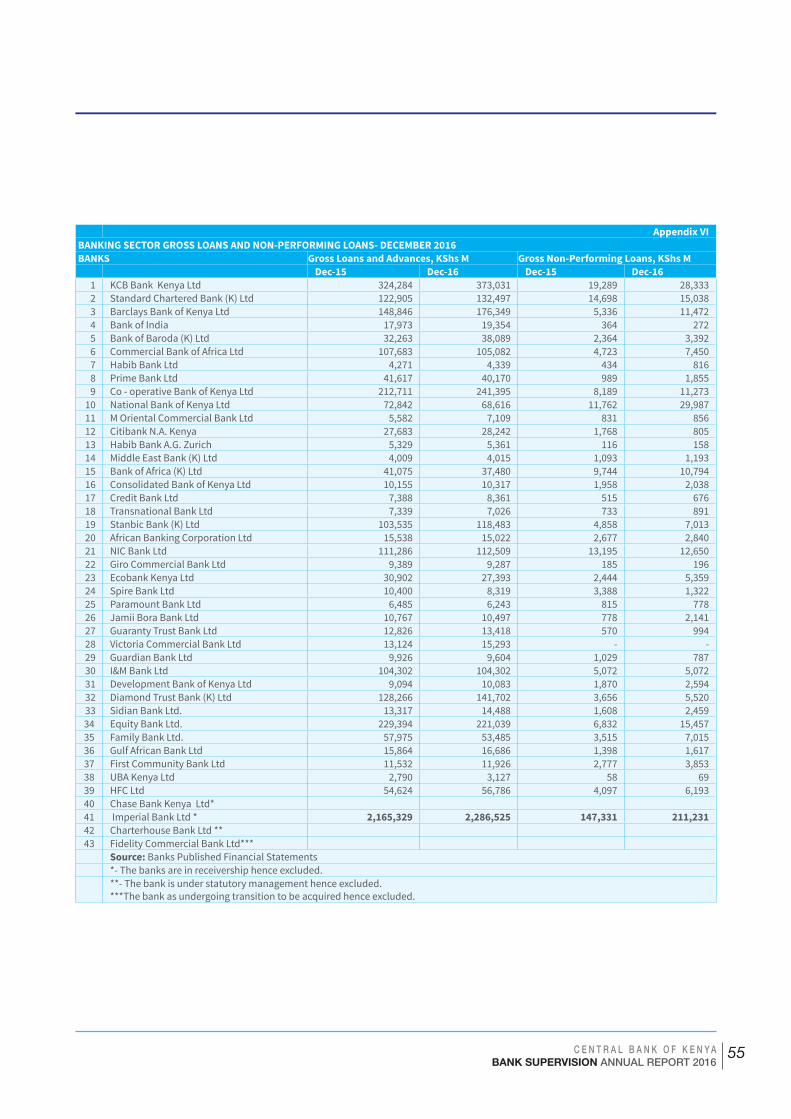
C E N T R A L B A N K O F K E N Y ABANK SUPERVISION ANNUAL REPORT 2016
55
Appendix VI BANKING SECTOR GROSS LOANS AND NON-PERFORMING LOANS- DECEMBER 2016 BANKS Gross Loans and Advances, KShs M Gross Non-Performing Loans, KShs M
Dec-15 Dec-16 Dec-15 Dec-161 KCB Bank Kenya Ltd 324,284 373,031 19,289 28,333 2 Standard Chartered Bank (K) Ltd 122,905 132,497 14,698 15,038 3 Barclays Bank of Kenya Ltd 148,846 176,349 5,336 11,472 4 Bank of India 17,973 19,354 364 272 5 Bank of Baroda (K) Ltd 32,263 38,089 2,364 3,392 6 Commercial Bank of Africa Ltd 107,683 105,082 4,723 7,450 7 Habib Bank Ltd 4,271 4,339 434 816 8 Prime Bank Ltd 41,617 40,170 989 1,855 9 Co - operative Bank of Kenya Ltd 212,711 241,395 8,189 11,273
10 National Bank of Kenya Ltd 72,842 68,616 11,762 29,987 11 M Oriental Commercial Bank Ltd 5,582 7,109 831 856 12 Citibank N.A. Kenya 27,683 28,242 1,768 805 13 Habib Bank A.G. Zurich 5,329 5,361 116 158 14 Middle East Bank (K) Ltd 4,009 4,015 1,093 1,193 15 Bank of Africa (K) Ltd 41,075 37,480 9,744 10,794 16 Consolidated Bank of Kenya Ltd 10,155 10,317 1,958 2,038 17 Credit Bank Ltd 7,388 8,361 515 676 18 Transnational Bank Ltd 7,339 7,026 733 891 19 Stanbic Bank (K) Ltd 103,535 118,483 4,858 7,013 20 African Banking Corporation Ltd 15,538 15,022 2,677 2,840 21 NIC Bank Ltd 111,286 112,509 13,195 12,650 22 Giro Commercial Bank Ltd 9,389 9,287 185 196 23 Ecobank Kenya Ltd 30,902 27,393 2,444 5,359 24 Spire Bank Ltd 10,400 8,319 3,388 1,322 25 Paramount Bank Ltd 6,485 6,243 815 778 26 Jamii Bora Bank Ltd 10,767 10,497 778 2,141 27 Guaranty Trust Bank Ltd 12,826 13,418 570 994 28 Victoria Commercial Bank Ltd 13,124 15,293 - - 29 Guardian Bank Ltd 9,926 9,604 1,029 787 30 I&M Bank Ltd 104,302 104,302 5,072 5,072 31 Development Bank of Kenya Ltd 9,094 10,083 1,870 2,594 32 Diamond Trust Bank (K) Ltd 128,266 141,702 3,656 5,520 33 Sidian Bank Ltd. 13,317 14,488 1,608 2,459 34 Equity Bank Ltd. 229,394 221,039 6,832 15,457 35 Family Bank Ltd. 57,975 53,485 3,515 7,015 36 Gulf African Bank Ltd 15,864 16,686 1,398 1,617 37 First Community Bank Ltd 11,532 11,926 2,777 3,853 38 UBA Kenya Ltd 2,790 3,127 58 69 39 HFC Ltd 54,624 56,786 4,097 6,193 40 Chase Bank Kenya Ltd*41 Imperial Bank Ltd * 2,165,329 2,286,525 147,331 211,231 42 Charterhouse Bank Ltd **43 Fidelity Commercial Bank Ltd***
Source: Banks Published Financial Statements*- The banks are in receivership hence excluded.**- The bank is under statutory management hence excluded. ***The bank as undergoing transition to be acquired hence excluded.

C E N T R A L B A N K O F K E N Y ABANK SUPERVISION ANNUAL REPORT 2016
56
Appendix VIIBANKING SECTOR CAPITAL AND RISK WEIGHTED ASSETS - DECEMBER 2016
SHS”000”
CORE CAPITAL
TOTAL CAPITAL
OVERRALL RISK WEIGHTED
ASSETS
CORE CAPITAL TO RISK WEIGHTED
ASSETS
TOTAL CAPITAL TO RISK WEIGHTED
ASSETS1 KCB Bank Kenya Limited 72,611 85,691 430,839 16.9% 19.9%2 Co-operative Bank of Kenya Limited 51,925 72,770 319,615 16.2% 22.8%3 Equity Bank (Kenya) Limited 51,248 55,095 356,088 14.4% 15.5%4 Barclays Bank of Kenya Limited 37,617 42,746 239,299 15.7% 17.9%5 Standard Chartered Bank Kenya Limited 35,258 42,104 201,321 17.5% 20.9%6 Diamond Trust Bank Kenya Limited 29,720 33,904 183,223 16.2% 18.5%7 Stanbic Bank (Kenya) Limited 28,891 32,876 179,751 16.1% 18.3%8 NIC Bank Limited 25,380 31,883 147,419 17.2% 21.6%9 I & M Bank Limited 24,685 26,934 148,414 16.6% 18.1%
10 Commercial Bank of Africa Limited 19,048 25,800 139,840 13.6% 18.4%11 Citibank N.A Kenya 18,480 19,196 72,808 25.4% 26.4%12 Bank of Baroda (K) Limited 13,506 13,992 45,823 29.5% 30.5%13 Family Bank Limited 11,980 14,450 69,534 17.2% 20.8%14 National Bank of Kenya Limited 10,033 10,501 88,325 11.4% 11.9%15 Prime Bank Limited 9,741 10,765 48,576 20.1% 22.2%16 Bank of India 8,574 8,971 19,615 43.7% 45.7%17 HFC Limited 8,519 9,580 54,161 15.7% 17.7%18 Ecobank Kenya Limited 6,961 7,606 39,119 17.8% 19.4%19 Bank of Africa Kenya Limited 5,585 7,637 47,248 11.8% 16.2%20 Guaranty Trust Bank ( K) Limited 5,462 5,580 20,599 26.5% 27.1%21 Victoria Commercial Bank Limited 4,849 4,988 19,599 24.7% 25.5%22 Gulf African Bank Limited 4,239 4,266 22,788 18.6% 18.7%23 Sidian Bank Limited 3,785 3,817 16,420 23.1% 23.2%24 Giro Commercial Bank Limited 2,954 3,077 11,924 24.8% 25.8%25 Habib Bank A.G Zurich 2,908 2,965 9,179 31.7% 32.3%26 M-Oriental Bank Limited 2,698 2,788 7,207 37.4% 38.7%27 Jamii Bora Bank Limited 2,686 2,789 13,888 19.3% 20.1%28 Credit Bank Limited 2,423 2,468 10,801 22.4% 22.8%29 African Banking Corporation Limited 2,368 2,969 18,530 12.8% 16.0%30 Guardian Bank Limited 2,149 2,215 11,288 19.0% 19.6%31 Habib Bank Limited 2,139 2,454 5,412 39.5% 45.3%32 UBA Kenya Bank Limited 2,131 2,143 5,541 38.5% 38.7%33 Transnational Bank Limited 1,969 2,073 9,974 19.7% 20.8%34 Development Bank of Kenya Limited 1,738 2,019 8,047 21.6% 25.1%35 Spire Bank Limited 1,569 1,895 11,646 13.5% 16.3%36 Paramount Bank Limited 1,555 1,638 5,979 26.0% 27.4%37 First Community Bank Limited 1,463 1,969 14,071 10.4% 14.0%38 Middle East Bank (K) Limited 1,173 1,186 3,749 31.3% 31.6%39 Consolidated Bank of Kenya Limited 746 1,001 12,669 5.9% 7.9%40 Chase Bank (K) Limited* - - - - -41 Imperial Bank Limited* - - - - -42 Fidelity Commercial Bank Limited*** - - - - -43 Charterhouse Bank Limited** - - - - -
TOTAL 520,766 606,800 3,070,327 17.0% 19.8%
Source: Banks Published Financial Statements*- The banks are in receivership hence excluded.**- The bank is under statutory management hence excluded. ***The bank as undergoing transition to be acquired hence excluded.
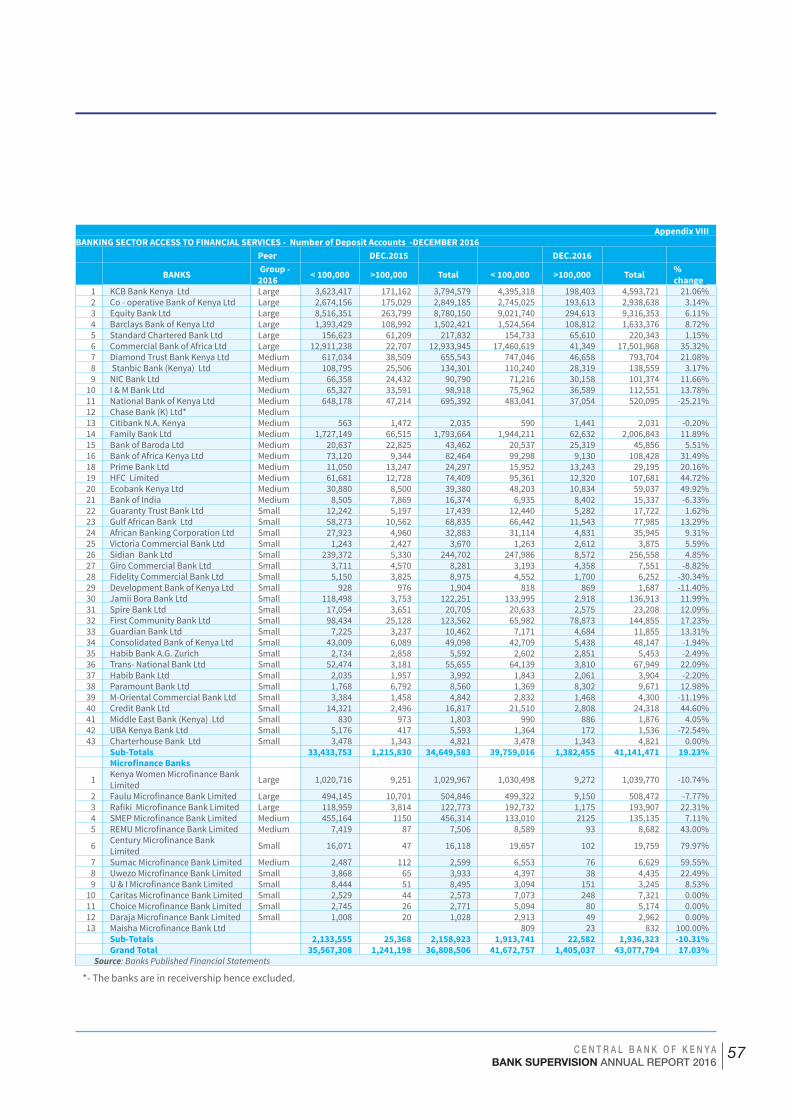
C E N T R A L B A N K O F K E N Y ABANK SUPERVISION ANNUAL REPORT 2016
57
Appendix VIIIBANKING SECTOR ACCESS TO FINANCIAL SERVICES - Number of Deposit Accounts -DECEMBER 2016
Peer DEC.2015 DEC.2016
BANKS Group - 2016 < 100,000 >100,000 Total < 100,000 >100,000 Total %
change 1 KCB Bank Kenya Ltd Large 3,623,417 171,162 3,794,579 4,395,318 198,403 4,593,721 21.06%2 Co - operative Bank of Kenya Ltd Large 2,674,156 175,029 2,849,185 2,745,025 193,613 2,938,638 3.14%3 Equity Bank Ltd Large 8,516,351 263,799 8,780,150 9,021,740 294,613 9,316,353 6.11%4 Barclays Bank of Kenya Ltd Large 1,393,429 108,992 1,502,421 1,524,564 108,812 1,633,376 8.72%5 Standard Chartered Bank Ltd Large 156,623 61,209 217,832 154,733 65,610 220,343 1.15%6 Commercial Bank of Africa Ltd Large 12,911,238 22,707 12,933,945 17,460,619 41,349 17,501,968 35.32%7 Diamond Trust Bank Kenya Ltd Medium 617,034 38,509 655,543 747,046 46,658 793,704 21.08%8 Stanbic Bank (Kenya) Ltd Medium 108,795 25,506 134,301 110,240 28,319 138,559 3.17%9 NIC Bank Ltd Medium 66,358 24,432 90,790 71,216 30,158 101,374 11.66%
10 I & M Bank Ltd Medium 65,327 33,591 98,918 75,962 36,589 112,551 13.78%11 National Bank of Kenya Ltd Medium 648,178 47,214 695,392 483,041 37,054 520,095 -25.21%12 Chase Bank (K) Ltd* Medium13 Citibank N.A. Kenya Medium 563 1,472 2,035 590 1,441 2,031 -0.20%14 Family Bank Ltd Medium 1,727,149 66,515 1,793,664 1,944,211 62,632 2,006,843 11.89%15 Bank of Baroda Ltd Medium 20,637 22,825 43,462 20,537 25,319 45,856 5.51%16 Bank of Africa Kenya Ltd Medium 73,120 9,344 82,464 99,298 9,130 108,428 31.49%18 Prime Bank Ltd Medium 11,050 13,247 24,297 15,952 13,243 29,195 20.16%19 HFC Limited Medium 61,681 12,728 74,409 95,361 12,320 107,681 44.72%20 Ecobank Kenya Ltd Medium 30,880 8,500 39,380 48,203 10,834 59,037 49.92%21 Bank of India Medium 8,505 7,869 16,374 6,935 8,402 15,337 -6.33%22 Guaranty Trust Bank Ltd Small 12,242 5,197 17,439 12,440 5,282 17,722 1.62%23 Gulf African Bank Ltd Small 58,273 10,562 68,835 66,442 11,543 77,985 13.29%24 African Banking Corporation Ltd Small 27,923 4,960 32,883 31,114 4,831 35,945 9.31%25 Victoria Commercial Bank Ltd Small 1,243 2,427 3,670 1,263 2,612 3,875 5.59%26 Sidian Bank Ltd Small 239,372 5,330 244,702 247,986 8,572 256,558 4.85%27 Giro Commercial Bank Ltd Small 3,711 4,570 8,281 3,193 4,358 7,551 -8.82%28 Fidelity Commercial Bank Ltd Small 5,150 3,825 8,975 4,552 1,700 6,252 -30.34%29 Development Bank of Kenya Ltd Small 928 976 1,904 818 869 1,687 -11.40%30 Jamii Bora Bank Ltd Small 118,498 3,753 122,251 133,995 2,918 136,913 11.99%31 Spire Bank Ltd Small 17,054 3,651 20,705 20,633 2,575 23,208 12.09%32 First Community Bank Ltd Small 98,434 25,128 123,562 65,982 78,873 144,855 17.23%33 Guardian Bank Ltd Small 7,225 3,237 10,462 7,171 4,684 11,855 13.31%34 Consolidated Bank of Kenya Ltd Small 43,009 6,089 49,098 42,709 5,438 48,147 -1.94%35 Habib Bank A.G. Zurich Small 2,734 2,858 5,592 2,602 2,851 5,453 -2.49%36 Trans- National Bank Ltd Small 52,474 3,181 55,655 64,139 3,810 67,949 22.09%37 Habib Bank Ltd Small 2,035 1,957 3,992 1,843 2,061 3,904 -2.20%38 Paramount Bank Ltd Small 1,768 6,792 8,560 1,369 8,302 9,671 12.98%39 M-Oriental Commercial Bank Ltd Small 3,384 1,458 4,842 2,832 1,468 4,300 -11.19%40 Credit Bank Ltd Small 14,321 2,496 16,817 21,510 2,808 24,318 44.60%41 Middle East Bank (Kenya) Ltd Small 830 973 1,803 990 886 1,876 4.05%42 UBA Kenya Bank Ltd Small 5,176 417 5,593 1,364 172 1,536 -72.54%43 Charterhouse Bank Ltd Small 3,478 1,343 4,821 3,478 1,343 4,821 0.00%
Sub-Totals 33,433,753 1,215,830 34,649,583 39,759,016 1,382,455 41,141,471 19.23% MicrofinanceBanks
1 Kenya Women Microfinance Bank Limited Large 1,020,716 9,251 1,029,967 1,030,498 9,272 1,039,770 -10.74%
2 Faulu Microfinance Bank Limited Large 494,145 10,701 504,846 499,322 9,150 508,472 -7.77%3 Rafiki Microfinance Bank Limited Large 118,959 3,814 122,773 192,732 1,175 193,907 22.31%4 SMEP Microfinance Bank Limited Medium 455,164 1150 456,314 133,010 2125 135,135 7.11%5 REMU Microfinance Bank Limited Medium 7,419 87 7,506 8,589 93 8,682 43.00%
6 Century Microfinance Bank Limited Small 16,071 47 16,118 19,657 102 19,759 79.97%
7 Sumac Microfinance Bank Limited Medium 2,487 112 2,599 6,553 76 6,629 59.55%8 Uwezo Microfinance Bank Limited Small 3,868 65 3,933 4,397 38 4,435 22.49%9 U & I Microfinance Bank Limited Small 8,444 51 8,495 3,094 151 3,245 8.53%
10 Caritas Microfinance Bank Limited Small 2,529 44 2,573 7,073 248 7,321 0.00%11 Choice Microfinance Bank Limited Small 2,745 26 2,771 5,094 80 5,174 0.00%12 Daraja Microfinance Bank Limited Small 1,008 20 1,028 2,913 49 2,962 0.00%13 Maisha Microfinance Bank Ltd 809 23 832 100.00%
Sub-Totals 2,133,555 25,368 2,158,923 1,913,741 22,582 1,936,323 -10.31% Grand Total 35,567,308 1,241,198 36,808,506 41,672,757 1,405,037 43,077,794 17.03% Source: Banks Published Financial Statements
*- The banks are in receivership hence excluded.
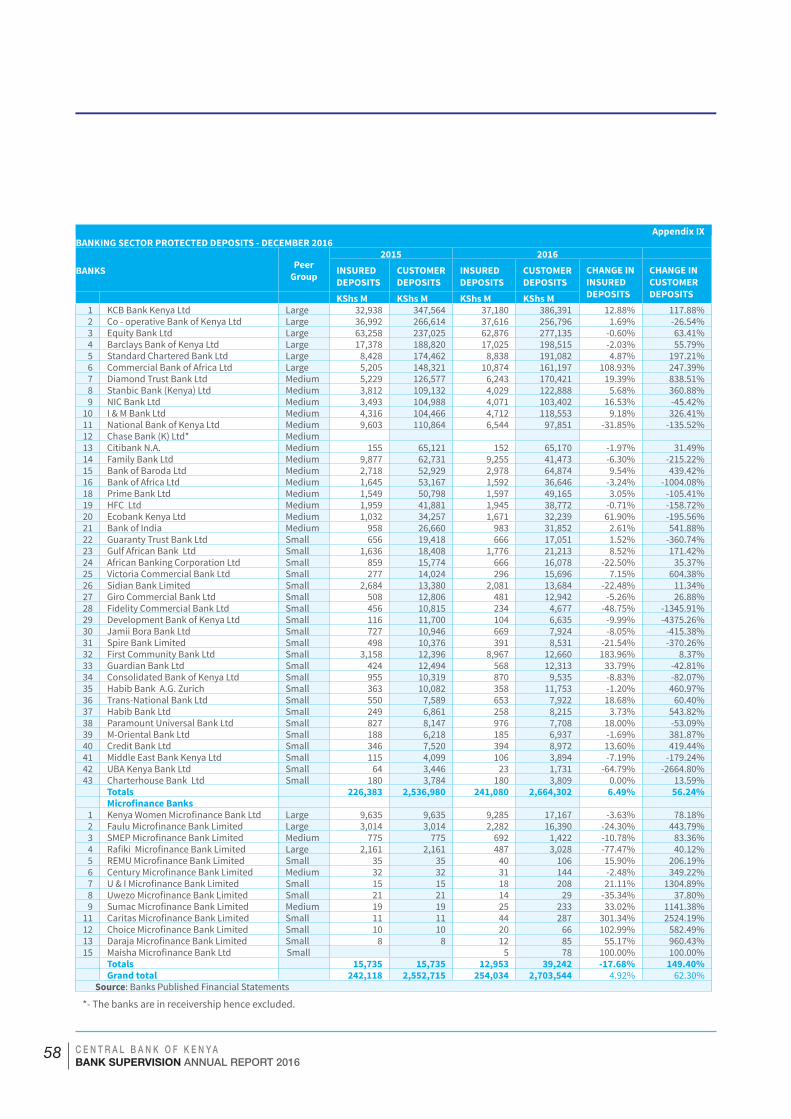
C E N T R A L B A N K O F K E N Y ABANK SUPERVISION ANNUAL REPORT 2016
58
Appendix IXBANKING SECTOR PROTECTED DEPOSITS - DECEMBER 2016
BANKS Peer Group
2015 2016 INSUREDDEPOSITS
CUSTOMERDEPOSITS
INSUREDDEPOSITS
CUSTOMERDEPOSITS
CHANGE ININSUREDDEPOSITS
CHANGE INCUSTOMERDEPOSITS KShs M KShs M KShs M KShs M
1 KCB Bank Kenya Ltd Large 32,938 347,564 37,180 386,391 12.88% 117.88%2 Co - operative Bank of Kenya Ltd Large 36,992 266,614 37,616 256,796 1.69% -26.54%3 Equity Bank Ltd Large 63,258 237,025 62,876 277,135 -0.60% 63.41%4 Barclays Bank of Kenya Ltd Large 17,378 188,820 17,025 198,515 -2.03% 55.79%5 Standard Chartered Bank Ltd Large 8,428 174,462 8,838 191,082 4.87% 197.21%6 Commercial Bank of Africa Ltd Large 5,205 148,321 10,874 161,197 108.93% 247.39%7 Diamond Trust Bank Ltd Medium 5,229 126,577 6,243 170,421 19.39% 838.51%8 Stanbic Bank (Kenya) Ltd Medium 3,812 109,132 4,029 122,888 5.68% 360.88%9 NIC Bank Ltd Medium 3,493 104,988 4,071 103,402 16.53% -45.42%
10 I & M Bank Ltd Medium 4,316 104,466 4,712 118,553 9.18% 326.41%11 National Bank of Kenya Ltd Medium 9,603 110,864 6,544 97,851 -31.85% -135.52%12 Chase Bank (K) Ltd* Medium 13 Citibank N.A. Medium 155 65,121 152 65,170 -1.97% 31.49%14 Family Bank Ltd Medium 9,877 62,731 9,255 41,473 -6.30% -215.22%15 Bank of Baroda Ltd Medium 2,718 52,929 2,978 64,874 9.54% 439.42%16 Bank of Africa Ltd Medium 1,645 53,167 1,592 36,646 -3.24% -1004.08%18 Prime Bank Ltd Medium 1,549 50,798 1,597 49,165 3.05% -105.41%19 HFC Ltd Medium 1,959 41,881 1,945 38,772 -0.71% -158.72%20 Ecobank Kenya Ltd Medium 1,032 34,257 1,671 32,239 61.90% -195.56%21 Bank of India Medium 958 26,660 983 31,852 2.61% 541.88%22 Guaranty Trust Bank Ltd Small 656 19,418 666 17,051 1.52% -360.74%23 Gulf African Bank Ltd Small 1,636 18,408 1,776 21,213 8.52% 171.42%24 African Banking Corporation Ltd Small 859 15,774 666 16,078 -22.50% 35.37%25 Victoria Commercial Bank Ltd Small 277 14,024 296 15,696 7.15% 604.38%26 Sidian Bank Limited Small 2,684 13,380 2,081 13,684 -22.48% 11.34%27 Giro Commercial Bank Ltd Small 508 12,806 481 12,942 -5.26% 26.88%28 Fidelity Commercial Bank Ltd Small 456 10,815 234 4,677 -48.75% -1345.91%29 Development Bank of Kenya Ltd Small 116 11,700 104 6,635 -9.99% -4375.26%30 Jamii Bora Bank Ltd Small 727 10,946 669 7,924 -8.05% -415.38%31 Spire Bank Limited Small 498 10,376 391 8,531 -21.54% -370.26%32 First Community Bank Ltd Small 3,158 12,396 8,967 12,660 183.96% 8.37%33 Guardian Bank Ltd Small 424 12,494 568 12,313 33.79% -42.81%34 Consolidated Bank of Kenya Ltd Small 955 10,319 870 9,535 -8.83% -82.07%35 Habib Bank A.G. Zurich Small 363 10,082 358 11,753 -1.20% 460.97%36 Trans-National Bank Ltd Small 550 7,589 653 7,922 18.68% 60.40%37 Habib Bank Ltd Small 249 6,861 258 8,215 3.73% 543.82%38 Paramount Universal Bank Ltd Small 827 8,147 976 7,708 18.00% -53.09%39 M-Oriental Bank Ltd Small 188 6,218 185 6,937 -1.69% 381.87%40 Credit Bank Ltd Small 346 7,520 394 8,972 13.60% 419.44%41 Middle East Bank Kenya Ltd Small 115 4,099 106 3,894 -7.19% -179.24%42 UBA Kenya Bank Ltd Small 64 3,446 23 1,731 -64.79% -2664.80%43 Charterhouse Bank Ltd Small 180 3,784 180 3,809 0.00% 13.59% Totals 226,383 2,536,980 241,080 2,664,302 6.49% 56.24% MicrofinanceBanks
1 Kenya Women Microfinance Bank Ltd Large 9,635 9,635 9,285 17,167 -3.63% 78.18%2 Faulu Microfinance Bank Limited Large 3,014 3,014 2,282 16,390 -24.30% 443.79%3 SMEP Microfinance Bank Limited Medium 775 775 692 1,422 -10.78% 83.36%4 Rafiki Microfinance Bank Limited Large 2,161 2,161 487 3,028 -77.47% 40.12%5 REMU Microfinance Bank Limited Small 35 35 40 106 15.90% 206.19%6 Century Microfinance Bank Limited Medium 32 32 31 144 -2.48% 349.22%7 U & I Microfinance Bank Limited Small 15 15 18 208 21.11% 1304.89%8 Uwezo Microfinance Bank Limited Small 21 21 14 29 -35.34% 37.80%9 Sumac Microfinance Bank Limited Medium 19 19 25 233 33.02% 1141.38%
11 Caritas Microfinance Bank Limited Small 11 11 44 287 301.34% 2524.19%12 Choice Microfinance Bank Limited Small 10 10 20 66 102.99% 582.49%13 Daraja Microfinance Bank Limited Small 8 8 12 85 55.17% 960.43%15 Maisha Microfinance Bank Ltd Small 5 78 100.00% 100.00% Totals 15,735 15,735 12,953 39,242 -17.68% 149.40% Grand total 242,118 2,552,715 254,034 2,703,544 4.92% 62.30% Source: Banks Published Financial Statements
*- The banks are in receivership hence excluded.

C E N T R A L B A N K O F K E N Y ABANK SUPERVISION ANNUAL REPORT 2016
59
Appendix X
MICROFINANCE BANKS BALANCE SHEET - DECEMBER 2016
KENYA WOMEN FAULU RAFIKI SMEP CARITAS SUMAC REMU U & I UWEZO DARAJA MAISHA CENTURY CHOICE TOTAL
KShs M KShs M KShs M KShs M KShs M KShs M KShs M KShs M KShs M KShs M KShs M KShs M KShs M KShs M
A) STATEMENT OF FINANCIAL POSITION
1 ASSETS
1.1 Cash and bank balances 957 298 875 50 7 5 5 8 7 33 3 3 18 2,268
1.2 Short term deposits with banks 5,331 3,622 2,092 418 343 61 58 47 7 27 75 12 10 12,102
1.3 Government securities 19 1,750 0 0 0 0 0 0 0 0 0 0 0 1,769
1.4 Advances to customers (net) 22,189 17,955 3,661 1,677 141 538 244 271 151 51 27 107 35 47,047
1.5 Due from related organizations
1.6 Other receivables 499 1,329 244 61 16 91 8 3 32 11 23 29 5 2,352
1.7 Tax recoverable 86 198 12 27 0 0 9 0 0 0 0 2 0 334
1.8 Deferred tax Asset 184 0 196 0 0 10 18 2 3 32 0 41 26 512
1.9 Other investment 0 0 0 0 0 0 0 0 0 0 0 0 0 0
1.1Investment in associate companies
1 46 0 0 0 0 2 0 0 0 0 0 0 50
1.11 Intangible assets 99 565 54 94 21 46 9 8 3 16 14 12 16 956
1.12 Property and equipment 2,790 1,606 193 331 47 52 8 12 12 10 29 19 12 5,121
TOTAL ASSETS 32,153 27,369 7,327 2,659 574 803 362 351 214 180 171 225 122 72,510
2 LIABILITIES
2.1 Cash collaterals held 0 0 0 0 0 0 0 0 0 0 0 0 0 0
2.2 Customer deposits 17,156 17,371 2,985 1,451 287 233 106 209 29 85 78 141 66 40,198
2.3 Borrowings 9,074 4,387 2,011 624 0 227 67 19 0 0 0 19 5 16,435
2.4Deposit & balances due to banking institutions
0 0 0 0 0 0 0 0 0 0 0 0 0 0
2.5 Deferred tax liability 0 73 0 20 0 0 0 0 0 0 0 0 0 93
2.6 Due to related organizations 0 0 0 0 0 0 0 0 0 0 0 0 0 0
2.7 Other liabilities 1,167 1,196 1,585 30 16 96 6 5 7 13 4 33 5 4,163
TOTAL LIABILITIES 27,398 23,027 6,581 2,126 303 557 179 233 36 98 82 193 76 60,889
3 SHARE CAPITAL & RESERVES
3.1 Share capital 186 480 1,000 541 427 163 223 105 197 120 120 234 105 3,900
3.2 Share premium 2,851 2,900 0 2 0 61 16 0 0 27 0 0 5 5,861
3.3 Retained earnings 1,435 248 -285 -184 -156 23 -61 13 -19 -65 -31 -203 -64 651
3.4 Revaluation reserve 0 212 0 133 0 0 0 0 0 1 0 0 0 346
3.5 Statutory reserve 284 503 31 40 0 0 6 0 0 0 0 0 0 864
3.6 Total Shareholders’ funds 4,756 4,342 745 533 271 246 184 118 179 82 89 31 46 11,622
TOTAL LIABILITIES AND EQUITY 32,153 27,369 7,327 2,659 574 803 362 351 214 180 171 225 122 72,510
Source: MFBs Published Financial Statements

C E N T R A L B A N K O F K E N Y ABANK SUPERVISION ANNUAL REPORT 2016
60
Appendix XI
MICROFINANCE BANKS PROFIT & LOSS ACCOUNT - DECEMBER 2016
KWFT FAULU RAFIKI SMEP CARITAS SUMAC REMU U & I UWEZO DARAJA MAISHA CENTURY CHOICE
1 Income KShs M
KShs M
KShs M
KShs M
KShs M
KShs M
KShs M
KShs M
KShs M
KShs M
KShs M
KShs M
KShs M
1.1 Interest on Loan Portfolio 6,228 3,753 922 420 7 187 61 53 40 10 2 36 7
1.2 Fees and Commission on Loan Portfolio 708 480 86 46 3 11 8 12 16 1 1 7 3
1.3 Government Securities 1 173 0 0 0 0 0 0 0 0 0 0 0
1.4 Deposit and Balances with Banks and Financial Inst. 227 295 115 22 26 1 6 0 0 3 7 0 0
1.5 Other Investments 0 0 0 0 0 0 0 0 0 0 0 0 1
1.6 Other Operating Income 358 114 96 81 2 2 5 0 0 3 0 2 0
1.7 Non- Operating Income 0 4 0 0 0 0 0 1 0 0 0 0 0
Total Income 7,523 4,818 1,218 569 38 201 80 66 56 17 10 46 11
2 Expenses
2.1 Interest and Fee Expense on Deposits 874 1,760 329 76 9 30 11 11 0 4 2 10 2
2.2 Other Fees and Commissions expense 130 172 8 0 0 6 1 0 0 0 0 2 0
2.3 Provision for Loan Impairment 145 188 238 46 2 13 7 2 8 5 1 -4 1
2.4 Staff Costs 2,776 1,038 432 246 37 27 34 13 17 22 26 34 19
2.5 Director’s Emoluments 93 18 0 11 4 4 2 2 1 3 1 2 3
2.6 Rental Charges 293 250 105 78 17 12 9 4 5 4 4 8 5
2.7 Depreciation Charges 382 170 31 27 10 9 3 2 4 3 3 9 2
2.8 Amortization Charges 38 37 9 12 6 6 1 2 2 3 2 0 4
2.9 Other Administrative Expense 1,392 704 396 168 26 37 21 14 17 18 17 26 23
2.1 Non-Operating Expense 2 0 0 0 0 0 0 0 0 0 0 0 0
Total Expenses 6,126 4,339 1,548 663 112 144 88 50 53 63 56 87 60
3 OperatingProfit 1,396 480 -330 -94 -74 57 -9 16 3 -45 -47 -41 -49
4 Interest and Fee Expense on Borrowings(Finance Costs) 1,072 382 131 52 0 39 8 4 0 0 0 0 1
5 Profit/(Loss)beforetax 324 98 -461 -146 -74 18 -17 12 3 -45 -47 -41 -50
6 Current Tax 73 55 0 0 0 4 0 5 0 0 0 0
6.1 Deferred Tax 28 0 -163 -12 0 0 -5 0 0 -17 -15 0 -15
7 NetProfit(AfterTaxesandBeforeDonations) 224 43 -298 -134 -74 14 -12 7 4 -28 -31 -41 -35
8 Donations for Operating Expense 0 0 0 0 0 0 0 0 0 0 0 0 0
9 NetProfitAfterTaxes 224 43 -298 -134 -74 14 -12 7 4 -28 -31 -41 -35
Other Comprehensive Income 0 0 0 0 0 0 0 0 0 0 0 0 0
Surplus on revaluation of building 0 0 0 0 0 0 0 0 0 0 0 0 0
Deferred tax on revaluation surplus 0 0 0 0 0 0 0 0 0 0 0 0 0
Total comprehensive income 224 43 -298 -134 -74 14 -12 7 4 -28 -31 -41 -35
Source: MFBs Published Financial Statements
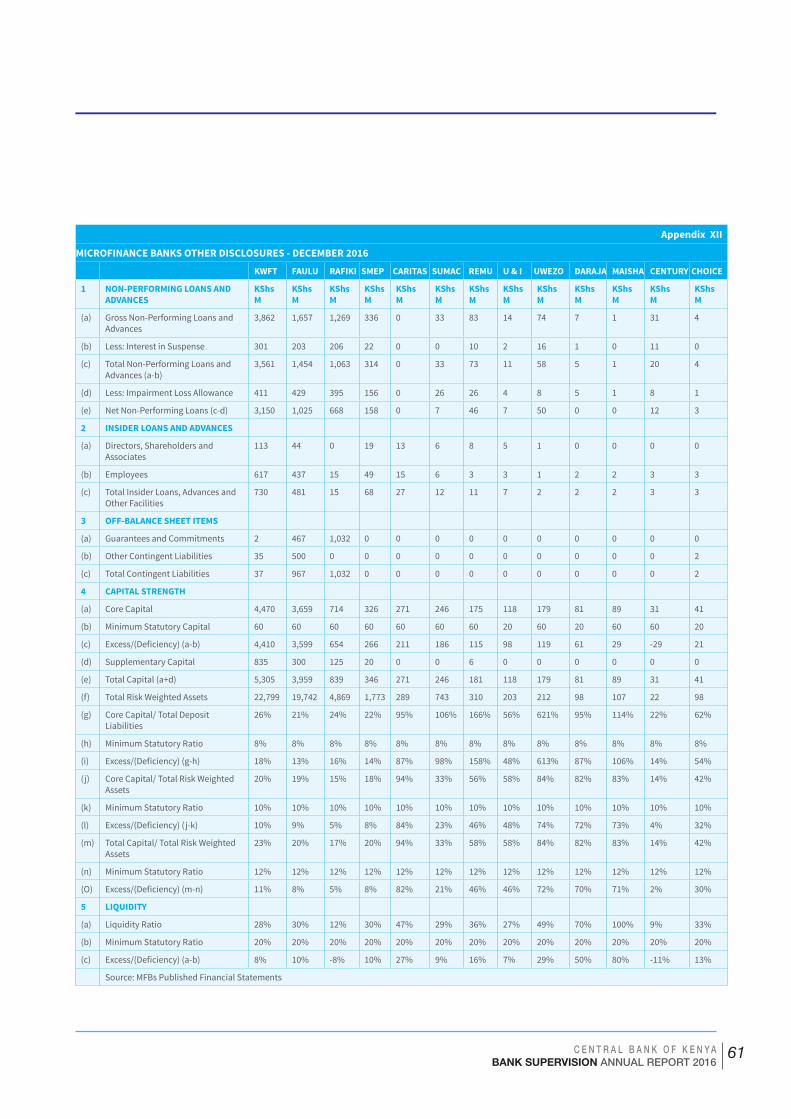
C E N T R A L B A N K O F K E N Y ABANK SUPERVISION ANNUAL REPORT 2016
61
Appendix XII
MICROFINANCE BANKS OTHER DISCLOSURES - DECEMBER 2016
KWFT FAULU RAFIKI SMEP CARITAS SUMAC REMU U & I UWEZO DARAJA MAISHA CENTURY CHOICE
1 NON-PERFORMING LOANS AND ADVANCES
KShs M
KShs M
KShs M
KShs M
KShs M
KShs M
KShs M
KShs M
KShs M
KShs M
KShs M
KShs M
KShs M
(a) Gross Non-Performing Loans and Advances
3,862 1,657 1,269 336 0 33 83 14 74 7 1 31 4
(b) Less: Interest in Suspense 301 203 206 22 0 0 10 2 16 1 0 11 0
(c) Total Non-Performing Loans and Advances (a-b)
3,561 1,454 1,063 314 0 33 73 11 58 5 1 20 4
(d) Less: Impairment Loss Allowance 411 429 395 156 0 26 26 4 8 5 1 8 1
(e) Net Non-Performing Loans (c-d) 3,150 1,025 668 158 0 7 46 7 50 0 0 12 3
2 INSIDER LOANS AND ADVANCES
(a) Directors, Shareholders and Associates
113 44 0 19 13 6 8 5 1 0 0 0 0
(b) Employees 617 437 15 49 15 6 3 3 1 2 2 3 3
(c) Total Insider Loans, Advances and Other Facilities
730 481 15 68 27 12 11 7 2 2 2 3 3
3 OFF-BALANCE SHEET ITEMS
(a) Guarantees and Commitments 2 467 1,032 0 0 0 0 0 0 0 0 0 0
(b) Other Contingent Liabilities 35 500 0 0 0 0 0 0 0 0 0 0 2
(c) Total Contingent Liabilities 37 967 1,032 0 0 0 0 0 0 0 0 0 2
4 CAPITAL STRENGTH
(a) Core Capital 4,470 3,659 714 326 271 246 175 118 179 81 89 31 41
(b) Minimum Statutory Capital 60 60 60 60 60 60 60 20 60 20 60 60 20
(c) Excess/(Deficiency) (a-b) 4,410 3,599 654 266 211 186 115 98 119 61 29 -29 21
(d) Supplementary Capital 835 300 125 20 0 0 6 0 0 0 0 0 0
(e) Total Capital (a+d) 5,305 3,959 839 346 271 246 181 118 179 81 89 31 41
(f) Total Risk Weighted Assets 22,799 19,742 4,869 1,773 289 743 310 203 212 98 107 22 98
(g) Core Capital/ Total Deposit Liabilities
26% 21% 24% 22% 95% 106% 166% 56% 621% 95% 114% 22% 62%
(h) Minimum Statutory Ratio 8% 8% 8% 8% 8% 8% 8% 8% 8% 8% 8% 8% 8%
(i) Excess/(Deficiency) (g-h) 18% 13% 16% 14% 87% 98% 158% 48% 613% 87% 106% 14% 54%
(j) Core Capital/ Total Risk Weighted Assets
20% 19% 15% 18% 94% 33% 56% 58% 84% 82% 83% 14% 42%
(k) Minimum Statutory Ratio 10% 10% 10% 10% 10% 10% 10% 10% 10% 10% 10% 10% 10%
(l) Excess/(Deficiency) (j-k) 10% 9% 5% 8% 84% 23% 46% 48% 74% 72% 73% 4% 32%
(m) Total Capital/ Total Risk Weighted Assets
23% 20% 17% 20% 94% 33% 58% 58% 84% 82% 83% 14% 42%
(n) Minimum Statutory Ratio 12% 12% 12% 12% 12% 12% 12% 12% 12% 12% 12% 12% 12%
(O) Excess/(Deficiency) (m-n) 11% 8% 5% 8% 82% 21% 46% 46% 72% 70% 71% 2% 30%
5 LIQUIDITY
(a) Liquidity Ratio 28% 30% 12% 30% 47% 29% 36% 27% 49% 70% 100% 9% 33%
(b) Minimum Statutory Ratio 20% 20% 20% 20% 20% 20% 20% 20% 20% 20% 20% 20% 20%
(c) Excess/(Deficiency) (a-b) 8% 10% -8% 10% 27% 9% 16% 7% 29% 50% 80% -11% 13%
Source: MFBs Published Financial Statements

C E N T R A L B A N K O F K E N Y ABANK SUPERVISION ANNUAL REPORT 2016
62
Appendix XIIIRESIDENTIAL MORTGAGES MARKET DEVELOPMENT – SURVEY DECEMBER 2016
Dec-15 Dec-16
Institution
Mortgage Outstand-ing (Ksh. M)
No. of Mort-gages Ac-counts
Value of NPLs Mortgage (Ksh. M)
No. of Mortgag-es NPLs Accounts
Mortgage Outstand-ing (Ksh. M)
No. of Mort-gages Accounts
Value of NPLs Mortgage (Ksh. M)
No. of Mortgag-es NPLs Accounts
1 Kenya Commercial Bank Ltd 47,749.00 7,007.00 2,776.00 341.00 54,333.00 6,496 3,584.00 483 2 HFC Ltd 47,581.16 5,993.00 3,031.96 525.00 51,754.00 5,711 5,862.00 509 3 Cooperative Bank of Kenya Ltd 18,183.00 643.00 1,074.00 50.00 16,161.23 928 1,167.07 73 4 Standard Chartered Bank Ltd 17,290.01 1,885.00 117.88 24.00 22,900.00 2,379 393.00 65 5 CFC Stanbic Ltd 14,716.00 1,684.00 788.00 97.00 14,972.00 1,660 671.00 117 6 Equity Bank Ltd 7,798.00 1,612.00 195.50 48.00 8,882.00 1,746 794.40 127 7 Barclays Bank Ltd 6,578.00 977.00 90.00 16.00 7,539.00 1,000 72.00 17 8 Chase Bank 5,200.89 348.00 455.68 15.00 7,238.29 259 4,586.27 131 9 Commercial Bank of Africa Ltd 4,552.71 465.00 120.09 15.00 5,035.00 529 384.00 36 10 Jamii Bora Bank Ltd 4,494.00 334.00 156.00 25.00 3,439.00 343 965.00 61 11 I&M Bank Ltd 3,446.27 366.00 46.34 9.00 3,491.69 348 117.47 13 12 Family Bank Ltd 3,390.57 586.00 112.00 19.00 3,344.07 353 249.39 28 13 Consolidated Bank Ltd 2,838.98 297.00 761.60 54.00 631.11 97 112.70 13 14 NIC Bank Ltd 2,829.00 285.00 21.00 21.00 2,300.00 182 46.00 13 15 Development Bank Ltd 2,757.76 513.00 719.12 80.00 3,043.43 559 1,142.52 98 16 Fidelity Bank Ltd 2,357.00 58.00 317.00 9.00 1,885.00 48 439.00 11 17 National Bank of Kenya Ltd 2,313.00 401.00 288.00 60.00 2,321.00 405 502.00 87 18 African Banking Corporation Ltd 2,026.00 143.00 72.40 8.00 920.59 40 65.60 3 19 Bank of Africa Ltd 1,622.00 127.00 155.90 17.00 3,110.95 191 293.95 21 20 Eco-bank Ltd 1,099.00 164.00 194.00 22.00 922.71 138 143.66 26 21 First Community Bank Ltd 833.66 171.00 78.35 6.00 990.18 224 136.74 37 22 Gulf African Bank Ltd 761.31 94.00 49.35 4.00 957.12 120 178.93 15 23 Bank of Baroda Ltd 667.75 80.00 30.89 2.00 854.40 102 29.03 2 24 Diamond Trust Bank of Kenya Ltd 554.00 58.00 37.37 5.00 678.20 65 28.20 3 25 Prime Bank Ltd 413.00 35.00 - - 319.00 30 21.00 2 26 Guardian Bank Ltd 365.07 25.00 - - 541.68 22 - - 27 Paramount Universal Bank Ltd 312.77 30.00 27.90 1.00 357.76 27 23.28 1 28 Giro Comercial Bank Ltd 239.61 34.00 - - 247.03 26 - - 2 Bank of India 191.29 20.00 - - 375.96 28 - - 3 Spire Bank Ltd 111.63 15.00 20.85 2.00 63.87 10 - - 4 Middle East Bank Ltd 28.00 3.00 - - 69.00 6 20.00 1 5 M-Oriental Commercial Bank Ltd 5.94 2.00 - - 28.18 2 - - 1 Victoria Commercial Bank Ltd 4.90 2.00 - - 126.00 6 - - 2 UBA Bank of Kenya Ltd 4.01 1.00 - - 3.88 1 - - 3 Habib Bank Ltd - - - - - - - - 4 Transnational Bank Ltd - - - - - - - - 5 Imperial Bank Ltd - - - - - - - - 6 Dubai Bank Ltd - - - - - - - - 7 Charterhouse Bank Ltd - - - - - - - - 8 Citibank N.A. - - - - - - - - 9 Credit Bank Ltd - - - - - - - - 10 GTBank Ltd - - - - - - - - 11 Habib A.G. Zurich - - - - - - - - 12 Sidian Bank Ltd - - - - 49.00 4 - - Total 203,315 24,458 11,737 1,475 219,885 24,085 22,028 1,993
Source: Commercial Banks

C E N T R A L B A N K O F K E N Y ABANK SUPERVISION ANNUAL REPORT 2016
63
Appendix XIV
Banking Circulars issued in 2016Circular No.
Date Title Purpose
1. 5th January 2016 Additional guidelines on large cash transactions
To apprise institutions on the information to obtain from customers engaging in large cash transactions.
2. 27th July 2016 Implementation of commu-nication on specified entities by the Counter Financing of Terrorism Inter-Ministerial Committee on 14th March 2016
To forward to institutions a list of specified entities that the institutions would be required to cease provision of financial services to and to freeze their accounts.
3. 13th September 2016 The Banking (Amendment) Act, 2016 on interest capping
To notify commercial banks and mortgage finance companies on the applicable interest rate chargeable for a credit facility.
4. 21st September 2016 Review of Central Bank Rate (CBR)
To notify institutions on the Monetary Policy Committee decisions to review the CBR down-wards to 10.00 percent from 10.50 percent.
5. 3rd October 2016 Increase of charges and con-version of savings products to transactional products
To direct institutions to ensure that they do not impose arbitrary charges to products and/or accounts that were not attracting charges before the amendment of the Banking Act on interest rate capping.
6. 16th November 2016 Issuance of guidance note on Internal Capital Adequacy Assessment Process (ICAAP)
To guide commercial banks and mortgage finance companies on how to develop and/or revise their ICAAP documents.

C E N T R A L B A N K O F K E N Y ABANK SUPERVISION ANNUAL REPORT 2016
64
Appendix XVA Summary of Signed MOUsNo. Memorandum of Understanding (MOU) Date of Signing
1 Multilateral MOU by the Central Banks of the East African community member states (Bank of the Republic of Burundi (BRB), Central Bank of Kenya (CBK), Nation-al Bank of Rwanda (NBR), Bank of Uganda (BOU) and Bank of Tanzania (BOT)
28.01.2009Amended in March 2016
2 Multilateral MOU by the Domestic Financial Sector Regulators (Capital Markets Authority, Central Bank of Kenya (CBK ), Insurance Regulatory Authority (IRA) and Retirement Benefit Authority (RBA)
31.08.2009Amended on 28.08.2013
3 Bilateral MOU between South Africa Reserve Bank (SARB) and Central Bank of Kenya (CBK)
01.07.2010
4 Bilateral MOU between Central Bank of Nigeria (CBN) and Central Bank of Kenya (CBK)
23.06.2011
5 Bilateral MOU between Bank of Mauritius (BoM) and Central Bank of Kenya (CBK) 08.08.2011
6 Bilateral MOU on Technical Cooperation between the Bank of Southern Sudan and the Central Bank of Kenya
19.12.2012
7 Bilateral MOU between Reserve Bank of Malawi (RBM) and Central Bank of Kenya (CBK)
23.04.2013
8 Bilateral MOU between Reserve Bank of Zimbabwe (RBZ) and Central Bank of Ken-ya (CBK)
15.05.2013
9 Bilateral MOU between Bank of Zambia (BoZ) and Central Bank of Kenya (CBK) 12.06.2013
10 Bilateral MOU between the Financial Reporting Centre and Central Bank of Kenya (CBK)
30.09.2013
11 Bilateral MOU between the Reserve Bank of India and Central Bank of Kenya (CBK) 16.10.2014

C E N T R A L B A N K O F K E N Y ABANK SUPERVISION ANNUAL REPORT 2016
65
Appendix XVIBANKS BRANCH NETWORK PER COUNTY- DECEMBER 2016 Dec-15 Dec-16 Increase/Decrease
1 Baringo 8 10 22 Bomet 8 9 13 Bungoma 19 17 -24 Busia 12 11 -15 Elgeyo/Marakwet 5 6 16 Embu 12 13 17 Garissa 8 9 18 Homa Bay 11 10 -19 Isiolo 8 7 -1
10 Kajiado 48 50 211 Kakamega 16 17 112 Kericho 17 16 -113 Kiambu 80 76 -414 Kilifi 35 34 -115 Kirinyaga 15 16 116 Kisii 27 25 -217 Kisumu 43 44 118 Kitui 14 14 019 Kwale 12 12 020 Laikipia 14 15 121 Lamu 8 9 122 Machakos 29 31 223 Makueni 14 14 024 Mandera 3 3 025 Marsabit 6 7 126 Meru 39 41 227 Migori 13 13 028 Mombasa 134 133 -129 Murang’a 21 20 -130 Nairobi City 608 625 1731 Nakuru 60 59 -132 Nandi 12 12 033 Narok 12 13 134 Nyamira 5 5 035 Nyandarua 10 10 0
36 Nyeri 30 29 -1
37 Samburu 2 2 0
38 Siaya 6 7 1
39 Taita/Taveta 10 10 0
40 Tana River 3 3 0
41 Tharaka-Nithi 5 4 -1
42 Trans Nzoia 19 18 -1
43 Turkana 5 5 0
44 Uasin Gishu 45 44 -1
45 Vihiga 6 7 1
46 Wajir 4 4 0
47 West Pokot 2 2 0
Total 1,523 1,541 18

C E N T R A L B A N K O F K E N Y ABANK SUPERVISION ANNUAL REPORT 2016
66
Appendix XVII
DIRECTORY OF COMMERCIAL BANKS, MORTGAGE FINANCE COMPANIES, KENYA BANKERS ASSOCIATION, NON-OPERATING HOLDING COMPANIES AND AUTHORISED REPRESENTATIVE OFFICES
A: COMMERCIAL BANKS1 African Banking Corporation Limited
Group Managing Director: Mr. Shamaz Savani Postal Address: P.O Box 46452-00100, Nairobi Telephone: +254-20- 4263000, 2223922, 22251540/1, 217856/7/8.4443482 Fax: +254-20-4447354 Email: [email protected]; [email protected] Website: http://www.abcthebank.com Physical Address: ABC Bank House, Mezzanine Floor, Koinange Street Date Licensed: 08-12-1994 Peer Group: Small. Branches: 13.
2 Bank of Africa Kenya Limited Managing Director : Mr. Ronald Marambii Postal Address: P. O. Box 69562-00400 Nairobi Telephone: +254-20- 3275000, 3275223, 0703058000 Fax: +254-20-2211477 Email: [email protected] Website: www.boakenya.com Physical Address: BOA House, Karuna Close off Waiyaki Way, Westlands, Nairobi Date Licenced: July 2004 Peer Group: Medium Branches: 45
3 Bank of Baroda (K) Limited Managing Director: Mr. Yatish Chander Tewari Postal Address: P. O Box 30033 – 00100 Nairobi Telephone: +254-20-2248402/12, 2226416, 2220575, 2227869, 2248402/12, 2226416 Fax: +254-20-316070, 310439 Email: [email protected], [email protected] Website: www.bankofbaroda kenya.com Physical Address: Baroda House, Koinange Street Date Licenced: 01-07-1953 Peer Group: Medium Branches: 14.
4 Bank of India Chief Executive Officer: Mr. Agyey Kumar Azad Postal Address: P. O. Box 30246 - 00100 Nairobi Telephone: +254-20-2221414 /5 /6 /7, 0720606707, 0734636737 Fax: +254-20-2221417 Email: [email protected] Website: www.boikenya.com Physical Address: Bank of India Building, Kenyatta Avenue Date Licenced: 05-06-1953 Peer Group: Medium Branches: 7

C E N T R A L B A N K O F K E N Y ABANK SUPERVISION ANNUAL REPORT 2016
67
5 Barclays Bank of Kenya Limited Managing Director: Mr. Jeremy Awori Postal Address: P. O. Box 30120 – 00100, Nairobi Telephone: +254-20-4254000, 5700059/56 Fax: +254-20-2213915 Email: [email protected] Website: www.barclayskenya.co.ke Physical Address: Barclays Westend, Waiyaki Way, Westlands Date Licenced: 1916 Peer Group: Large Branches: 108, Sales Centre – 1
6 Stanbic Bank Kenya Limited (Formerly CfC Stanbic Bank Ltd.) Chief Executive Officer: Mr. Philip Odera Postal Address: P. O. Box 72833 - 00200 Nairobi Telephone: +254-20-3638000 /11 /17 /18 /20 /21, 3268000, 3269000, 0711-0688000 Fax: +254-20-3752901/7 Email: [email protected] Website: http://www.cfcstanbicbank.co.ke Physical Address: CFC Centre, Chiromo Road, Westlands Date Licensed: 01-06-2008 Peer Group: Medium Branches: 27
7 Charterhouse Bank LimitedUNDER - STATUTORY MANAGEMENT Postal Address: P. O. Box 43252 -00100 Nairobi Telephone: +254-20-2242246 /47 /48/ 49 Fax: +254-20-2219058, 2223060, 2242248 Email: [email protected] Website: Physical Address: Longonot Place. 6th Floor, Kijabe Street Date Licensed: 01-08-1998 Peer Group: Small Branches: 10
8 Chase Bank (K) Limited IN RECEIVERSHIPPostal Address: P. O. Box 66015-00800 Nairobi Telephone: +254-20- 2774000, 0732174100, 0703074000, 0736-432025, 0703074101. Fax: +254-20-4454816/4454800-10 Email: [email protected], [email protected] Website: http://www.chasebankkenya.co.ke Physical Address: Riverside Mews, Riverside Drive Date Licenced: 01-04-1991 Peer Group: Medium Branches: 58
9 Citibank N.A Kenya Chief Executive Officer: Ms. Joyce Anne Wainaina Postal Address: P. O. Box 30711 - 00100 Nairobi Telephone: +254-20- 2754000. 2711221 Fax: +254-20-2714810/1 Email: [email protected] Website: http://www.citibank.co.ke Physical Address: Citibank House, Upper Hill Road, Upper Hill Date Licenced: 01-07-1974 Peer Group: Medium Branches: 3; Agency 1
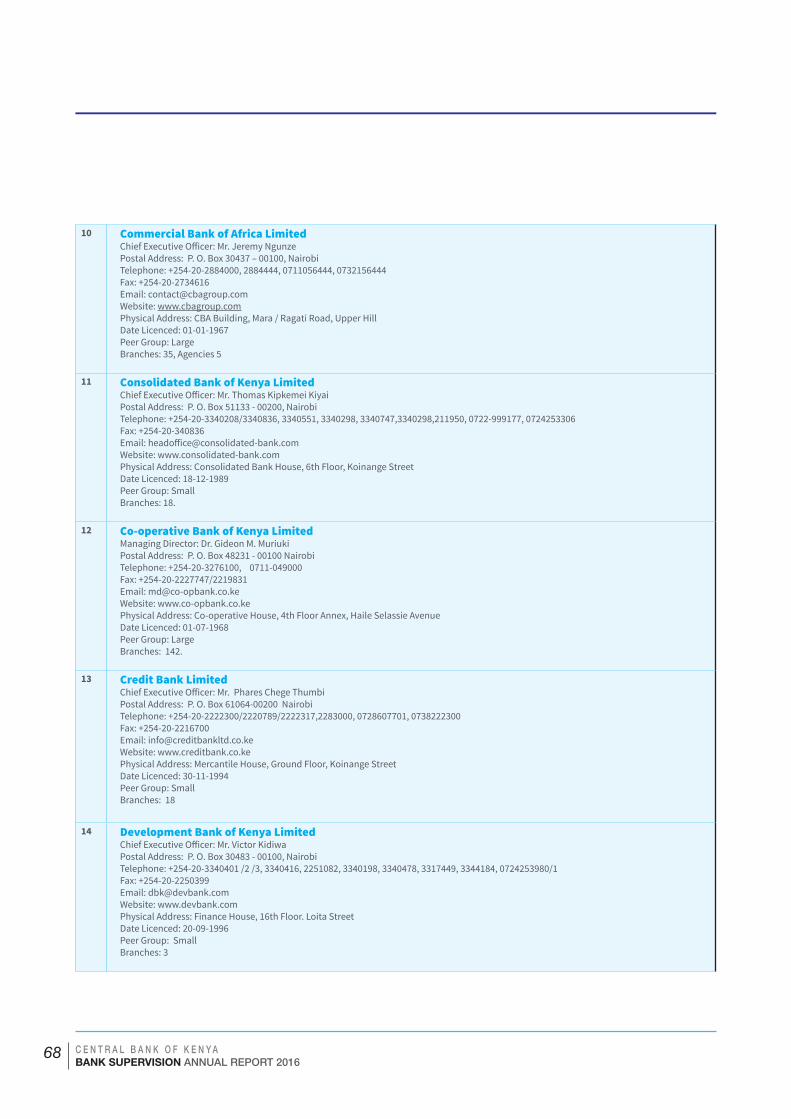
C E N T R A L B A N K O F K E N Y ABANK SUPERVISION ANNUAL REPORT 2016
68
10 Commercial Bank of Africa Limited Chief Executive Officer: Mr. Jeremy Ngunze Postal Address: P. O. Box 30437 – 00100, Nairobi Telephone: +254-20-2884000, 2884444, 0711056444, 0732156444 Fax: +254-20-2734616 Email: [email protected] Website: www.cbagroup.com Physical Address: CBA Building, Mara / Ragati Road, Upper Hill Date Licenced: 01-01-1967 Peer Group: Large Branches: 35, Agencies 5
11 Consolidated Bank of Kenya Limited Chief Executive Officer: Mr. Thomas Kipkemei Kiyai Postal Address: P. O. Box 51133 - 00200, Nairobi Telephone: +254-20-3340208/3340836, 3340551, 3340298, 3340747,3340298,211950, 0722-999177, 0724253306 Fax: +254-20-340836 Email: [email protected] Website: www.consolidated-bank.com Physical Address: Consolidated Bank House, 6th Floor, Koinange Street Date Licenced: 18-12-1989 Peer Group: Small Branches: 18.
12 Co-operative Bank of Kenya Limited Managing Director: Dr. Gideon M. Muriuki Postal Address: P. O. Box 48231 - 00100 Nairobi Telephone: +254-20-3276100, 0711-049000 Fax: +254-20-2227747/2219831 Email: [email protected] Website: www.co-opbank.co.ke Physical Address: Co-operative House, 4th Floor Annex, Haile Selassie Avenue Date Licenced: 01-07-1968 Peer Group: Large Branches: 142.
13 Credit Bank Limited Chief Executive Officer: Mr. Phares Chege Thumbi Postal Address: P. O. Box 61064-00200 Nairobi Telephone: +254-20-2222300/2220789/2222317,2283000, 0728607701, 0738222300 Fax: +254-20-2216700 Email: [email protected] Website: www.creditbank.co.ke Physical Address: Mercantile House, Ground Floor, Koinange Street Date Licenced: 30-11-1994 Peer Group: Small Branches: 18
14 Development Bank of Kenya Limited Chief Executive Officer: Mr. Victor Kidiwa Postal Address: P. O. Box 30483 - 00100, Nairobi Telephone: +254-20-3340401 /2 /3, 3340416, 2251082, 3340198, 3340478, 3317449, 3344184, 0724253980/1 Fax: +254-20-2250399 Email: [email protected] Website: www.devbank.com Physical Address: Finance House, 16th Floor. Loita StreetDate Licenced: 20-09-1996 Peer Group: Small Branches: 3

C E N T R A L B A N K O F K E N Y ABANK SUPERVISION ANNUAL REPORT 2016
69
15 Diamond Trust Bank Kenya Limited Managing Director: Mrs. Nasim M. Devji Postal Address: P. O. Box 61711 – 00200, Nairobi Telephone: +254-20-2849000, 2210988/9, 2210989, 0732121000, 0719031000 Fax: +254-20-2245495 Email: info@dtbafrica,com Website: http://www.dtbafrica.comPhysical Address: DTB Centre, Mombasa Road, Nairobi Date Licenced: 15-11-1994 Peer Group: Large Branches: 63
16 Ecobank Kenya Limited Managing Director: Mr. Samuel Ashitey Adjei Postal Address: P.O. Box 49584- 00100 Nairobi Telephone: +254-20-2883000, 719 098 000, 0722-204863 Fax: +254-20-2249670, 2883815 Email: [email protected] Website: www.ecobank.com Physical Address: Fortis Office Park, Muthangari Drive-Westlands Date Licenced: 16-06-2008 Peer Group: Medium Branches: 31.
17 Spire Bank Limited (Formerly Equatorial Commercial Bank Limited) Managing Director: Mr. Timothy Gitonga Postal Address: P. O. Box 52467-00200 Nairobi Telephone: +254-20- 4981000, 0713600724, 0733333780 Fax: +254-20-2719625, 0703047000, 070304777 Email: [email protected] Website: www.equatorialbank.co.ke Physical Address: Mwalimu Towers, Hill Lane, Upper Hill, Nairobi Date Licenced: 23-06-1995 Peer Group: Small Branches: 154
18 Equity Bank Limited Managing Director & C.E.O: Dr. James N. Mwangi Postal Address: P. O. Box 75104-00200, Nairobi Telephone: +254-20- 2262000, 0711026000, 0711025000, 0734108000 Fax: +254-20-2711439 Email: [email protected] Website: http://www.equitybank .co.ke Physical Address: Equity Centre, 9th Floor. - Hospital Road- Upper Hill Date Licenced: 28-12-2004 Peer Group: Large Branches: 164, Sub-Branches 12.
19 Family Bank Limited Managing Director & CEO: Mr. David Irungu Thuku. Postal Address: P. O. Box 74145-00200 Nairobi Telephone: +254-020- 3318173, 3318940/2/7, 2244166, 2240601, 0733332300, 0728120444/555 Fax: +254-020- 318174 Email: [email protected] Website: www.familybank.co.ke Physical Address: Family Bank Towers, 6th Floor, Muindi Mbingu Street Date Licenced: 01-05-2007 Peer Group: Medium Branches: 91

C E N T R A L B A N K O F K E N Y ABANK SUPERVISION ANNUAL REPORT 2016
70
20 Fidelity Commercial Bank Limited Managing Director: Mr. Rana SenguptaPostal Address: P. O. Box 34886-00100 Nairobi Telephone: +254-20-2242348, 2244187, 2245369, 2220845, 2243461, 315917, 0722372531, 1733911835 Fax: +254-20-2243389/2245370 Email: [email protected] Website: www.fidelitybank.co.ke Physical Address: I.P.S Building, 7th Floor, Kimathi Street Date Licenced: 07-03-1996 Peer Group: Small Branches: 12
21 Guaranty Trust Bank (K) Ltd (Formerly-Fina Bank Limited) Chief Executive: Ms. Ibukunoluwa Odegbaike Postal Address: P. O. Box 20613 – 00200, Nairobi Telephone: +254-20-3284000, 07203084000, 0722-202929 Fax: +254-20-342024 Email: [email protected] Website: http://gtbank.co.ke Physical Address: Sky Park Plaza, Woodvale Close-Westlands Date Licenced: -13-01-1995 Peer Group: Small Branches: 16
22 First Community Bank Limited Chief Executive: Mr. Fazal Mehmood Saib Postal Address: P. O. Box 26219-00100, Nairobi Telephone: +254-20-2843000 -3, 0726-736833, 0738-407521 Fax: +254-20-344101 Email: [email protected] Website: www.firstcommunitybank.co.ke Physical Address: Prudential Assurance Building, 1st Floor, Wabera Street Date Licenced: 29-04-2008 Peer Group: Small Branches: 18
23 Giro Commercial Bank Limited Chief Executive Officer: Mr. Sanjay Gidoomal Postal Address: P. O. Box 13400-00800, Nairobi Telephone: +254-20-4229000, 0722823684, 0722823684, 0788999044 Fax: +254-20-229300 Email: [email protected] Website: Physical Address: Eldama Park- Eldama Ravine Road-Off Peponi Road - Westlands Date Licenced: 17-12-1992 Peer Group: Small Branches: 9
24 Guardian Bank Limited Managing Director: Mr. Vasant K. Shetty Postal Address: P. O. Box 67681 – 00200, Nairobi Telephone: +254-020-2226771, 2226774, 2226341, 222483, 0722-282213, 0733-888060, 0736-444644, 0722-938629 Fax: +254-020 -2216633 Email:[email protected], [email protected], [email protected] Website:www.guardian-bank.com Physical Address: Guardian Centre, Biashara Street Date Licenced: 20-12-1995 Peer Group: Small Branches: 11

C E N T R A L B A N K O F K E N Y ABANK SUPERVISION ANNUAL REPORT 2016
71
25 Gulf African Bank Limited Chief Executive Officer: Mr. Abdallah Abdulkhalik Postal Address: P. O. Box 43683 – 00100, Nairobi Telephone: +254-20-2740000, 2718608/9, 2740111 Fax: +254-20-2715655 Email: [email protected] Website: www.gulfafricanbank.com Physical Address: Gemina Insurance Plaza, Kilimanjaro Avenue, Upper Hill Date Licenced: 01-11-2007 Peer Group: Small Branches: 19
26 Habib Bank A.G Zurich Country Manager: Mr. Mohamed Ali Hussain Postal Address: P. O. Box 30584 - 00100 Nairobi Telephone: +254-20-3341172/76/77, 3340835, 3310694 Fax: +254-20-2217004 /2218699 Email: [email protected] Website: www.habibbank.com Physical Address: Habib House, Koinange Street Date Licenced: 01-07-1978 Peer Group: Small Branches: 6
27 Habib Bank Limited Country Manager: Mr. Salman Ahmed Khan Malik Postal Address: P. O. Box 43157 – 00100, Nairobi Telephone: +254-20-2226433, 2222786, 2226401/7, 0727531143 Fax: +254-20-2224636 Email: [email protected] Website: www.hbl.com Physical Address: Exchange Building, Koinange Street Date Licenced: 02-03-1956 Peer Group: Small Branches : 6
28 Imperial Bank Limited IN - RECEIVERSHIP Postal Address: P. O. Box 44905 – 00100, Nairobi Telephone: +254-20-2874000, 3343416 /12/17/18/19/94, 3342373, 2719617 /8 /9,0711019000,0732119000 Fax: +254-20-2719705/2719652, 342374, 2719498 Email: [email protected] Website: www.imperialbank.co.ke Physical Address: Imperial Court - Westlands Road – Westlands Date Licenced: 08-12-1994 Peer Group: Medium Branches: 26
29 I & M Bank Limited Chief Executive Officer: Mr. Christopher M. Kihara Postal Address: P.O. Box 30238 – 00100, Nairobi Telephone: +254-20- 2711994-8, 3221200/2, 3221000 Fax: +254-20-2211160 Email: [email protected] Website: http://www.imbank.com Physical Address: I & M Bank House, 2nd Ngong Avenue, Off Ngong Road Date Licenced: 27-03-1996 Peer Group: Medium Branches: 36

C E N T R A L B A N K O F K E N Y ABANK SUPERVISION ANNUAL REPORT 2016
72
30 Jamii Bora Bank Limited Chief Executive Officer: Mr. Samuel Kimani Postal Address: P. O. Box 22741 – 00400, Nairobi Telephone: +254-20- 2224238/9, 2214976, 2219626, 2210338/9, 0722-201112, 0734600682 Fax: +254-20-341825 Email: [email protected] Website: http://www.jamiiborabank.co.ke Physical Address: Jamii Bora House, Koinange Street Date Licenced: 02-03-2010 Peer Group: Small Branches: 27
31 KCB Bank Kenya Limited Chief Executive Officer: Mr.Joshua Nyamweya Oigara Postal Address: P. O. Box 48400 – 00100, Nairobi Telephone: +254-20-3270000, 2851000, 2852000, 0711012000, 0734108200 Fax: +254-20-2242408’ 2216405 Email: [email protected] Website: http//www.kcbbankgroup.com Physical Address: Kencom House, 8th Floor, Moi Avenue Date Licenced: 01-01-1896 Peer Group: Large Branches: 198
32 Sidian Bank Limited (Formerly K-Rep Bank) Managing Director: Mr. Titus Karanja Postal Address: P. O. Box 25363 – 00603, Nairobi Telephone: +254-20- 3906000-7, 0711-058000-7, 0732-158000 Fax: +254-20-3568995 Email: [email protected], [email protected] Website: www.k-repbank.com Physical Address: K-Rep Centre, Wood Avenue, Kilimani Date Licenced: 23-03-1999 Peer Group: Small Branches: 39
33 Middle East Bank (K) Limited Managing Director: Mr. Dhirendra Rana Postal Address: P. O. Box 47387 - 00100 Nairobi Telephone: +254-20-2723120/24, 2722879, 2723124, 2723130, 0722-205903’ 0733-333441 Fax: +254-20-343776 / 2256901 Email: [email protected] Website: www.mebkenya.com Physical Address: Mebank Tower - Milimani Road. – Milimani Date Licenced: 15-12-1980 Peer Group: Small Branches: 5
34 National Bank of Kenya Limited Managing Director & CEO: Mr. Wilfred Musau Postal Address: P. O. Box 72866 - 00200 Nairobi Telephone: +254-20-2828000, 2226471, 0711-038000, Fax: +254-20-311444/2223044 Email: [email protected]. Website: www.nationalbank.co.ke Physical Address: National Bank Building, 2nd Floor, Harambee Avenue Date Licenced: 01-01-1968 Peer Group: Medium Branches: 73, Agencies 8

C E N T R A L B A N K O F K E N Y ABANK SUPERVISION ANNUAL REPORT 2016
73
35 NIC Bank Limited Group Managing Director: Mr. John Mburu Gachora Postal Address: P. O. Box 44599 - 00100 Nairobi Telephone: +254-20-2888000, 2888217, 0711041000, 0732141000 Fax: +254-20-2888505 Email: [email protected] Website: http://www.nic-bank.com Physical Address: N.I.C House, Masaba Road,- Upper Hill Date Licenced: 28-09-1995 Peer Group: Medium Branches: 35
36 M-Oriental Commercial Bank Limited Managing Director: Mr. Rakesh Kashyap Postal Address: P.O BOX 44080-00100, Nairobi Telephone: +254-20-2228461/2, 0734333291, 0722209585 Fax: +254-20-2219469 Email: [email protected] Website: www.moriental.co.ke Physical Address: Finance House, 7th Floor, Koinange Street Date Licenced: 08-02-1991 Peer Group: Small Branches: 9.
37 Paramount Bank Limited Chief Executive Officer: Mr. Ayaz A. Merali Postal Address: P. O. Box 14001 -00800 Nairobi Telephone: +254-20-4449266/7/8, 446106 /7, 4443896, 445722, 4441528, 4441527, 0723564254, 0734258020, Fax: +254-20-449265 Email: [email protected] Website: www.paramountbank.co.ke Physical Address: Sound Plaza Building, 4th Floor, Woodvale Grove, Westlands Date Licenced: 05-07-1995 Peer Group: Small Branches: 8
38 Prime Bank Limited Chief Executive Officer: Mr. Bharat Jani Postal Address: P. O. Box 43825 – 00100, Nairobi Telephone: +254-20-4203000 /116 /148, 07220205491, 0733611494 Fax: +254-20-4451247 Email: [email protected] Website: www.primebank.com Physical Address: Prime Bank Building, Chiromo Lane/ Riverside Drive-Junction, Westlands Date Licenced: 03-09-1992 Peer Group: Medium Branches: 20
39 Standard Chartered Bank Kenya Limited Chief Executive Officer: Mr. Lamin Kemba Manjang Postal Address: P. O. Box 30003 - 00100 Nairobi Telephone: +254-20-3293000, 3293900, 3291000, 3294000, 0719081000 Fax: +254-20-3747880 Email: [email protected] Website: www.standardchartered.com Physical Address: Standard Chartered Building-Westlands Road- Chiromo Lane.- Westlands Date Licenced: 10-01-1910 Peer Group: Large Branches: 42

C E N T R A L B A N K O F K E N Y ABANK SUPERVISION ANNUAL REPORT 2016
74
40 Transnational Bank Limited Chief Executive Officer: Mr. Sammy Langat Postal Address: P. O. Box 34353 – 00100 Nairobi Telephone: +254-20-2252216/19, 2224235/6, 2252188/90/91, 0720081772, 0733505656 Fax: +254-20-2252225 Email: [email protected] Website: www.tnbl.co.ke Physical Address: Transnational Plaza, City Hall Way Date Licenced: 08-01-1985 Peer Group: Small Branches: 26
41 UBA Kenya Bank Limited Managing Director: Mr. Isaac Njiru Mwige Postal Address: P. O. Box 34154 - 00100 Nairobi Telephone: +254-020- 3612000 /1 / 2, Fax: +: +254-020-3740817 Email: [email protected] Website: www. ubagroup.com Physical Address: Apollo Centre, 1st Floor, Ring Road / Vale Close, Westlands Date Licenced: 25-09-2009 Peer Group: Small Branches: 4
42 Victoria Commercial Bank Limited Managing Director: Mr. Yogesh K Pattni Postal Address: P. O. Box 41114 - 00100 Nairobi Telephone: +254-20-2719499, 2719815, 2710271, 2716108, 2719814.2713208, 2716196, 0721328183 Fax: +254-20-2713778/2715857 Email: [email protected] Website: www.victoriabank.co.ke Physical Address: Victoria Towers, Mezzanine Floor, Kilimanjaro Avenue, Upper Hill Date Licenced: 11-01-1996 Peer Group: Small Branches: 4
B: MORTGAGE FINANCE COMPANIES1 HFC Limited
Managing Director: Mr. Sam Mwaniki Waweru Postal Address: P. O. Box 30088 -00100 Nairobi Telephone: +254-20- 3262000, 317474, 2221101, 0722201174, 0722201175, 0733617682/3 Fax: +254-20-340299/2250858 Email: [email protected] Website: www.hfgroup.co.ke Physical Address: Rehani House, 2nd Floor, Kenyatta Avenue / Koinange Street – Junction Date Licenced: 07-05-1965 Peer Group: Medium Branches: 27.
C: KENYA BANKERS ASSOCIATION1 Chief Executive Officer: Mr. Habil Olaka
Postal Address: P. O. Box 73100--00200 NairobiTelephone: +254-20-2221704, 2217757, 2224014, 2224015, 0733812770, 0711562910 Fax: +254-20-2221792Email: [email protected]: www.kba.co.kePhysical Address: International House, 13th Floor, Mama Ngina Street, Nairobi

C E N T R A L B A N K O F K E N Y ABANK SUPERVISION ANNUAL REPORT 2016
75
D. AUTHORISED NON-OPERATING BANK HOLDING COMPANIES1 Bakki Holdco Limited
Licensed Subsidiary: Sidian Bank Ltd (formerly K-Rep Bank Ltd) Postal Address: P.O. Box 10518 -00100, Nairobi Telephone: 0709902000 E-mail: [email protected] Website: www.centum.co.ke (NB: Bakki Holdco is a subsidiary of Centum Ltd) Physical Address: 5th Floor, International Life House, Mama Ngina Street, Nairobi Date Authorised: 31st December, 2014
2 Stanbic Holdings LimitedLicensed Subsidiary: CfC Stanbic Bank Ltd Postal Address: P.O Box 72833-00200, Nairobi Telephone: + 254 20 3638000E-mail: [email protected] Website: www.cfcstanbicbank.co.ke Physical Address: CfC Stanbic Centre, 1st Floor, Chiromo Road, Westlands, Nairobi Date Authorised: 21st June 2013
3 Equity Group Holdings Limited Licensed Subsidiary: Equity Bank Kenya LtdPostal Address: P.O. Box 75104 – 00200, Nairobi Telephone: +254 763 3026000 Contact Centre: +254 763 063 000E-mail: [email protected] Website: www.equitygroupholdings.com Physical Address: Equity Centre, 9th Floor, Hospital Road, Upper Hill, Nairobi Date Authorised: 31st December, 2014
4 HF Group LimitedLicensed Subsidiary: HFC LtdPostal Address: PO Box 30088 – 00100, Nairobi Telephone: +254(20)-3262000, 0722715256, 0722708660, 0722201175, 0733617682 E-mail: [email protected] Website: www.hfgroup.co.ke Physical Address: Rehani House, Kenyatta Avenue/ Koinange Street Junction, Nairobi Date Authorised: 3rd June, 2015
5 I & M Holdings Limited Licensed Subsidiary: I & M Bank Kenya LtdPostal Address: P.O. BOX 30238-00100, Nairobi Telephone: +254 20 322 1000, +254 719 088 000, +254 732 100 000, +254 753 221 000 E-mail: [email protected] Website: www.imbank.com Physical Address: I&M Bank House, 2nd Ngong Avenue, Nairobi Date Authorised: 13th May, 2013
6 KCB Group LimitedLicensed Subsidiary: KCB Bank Kenya Ltd Postal Address: 48400 – 00100, Nairobi Telephone: +254 20 3270000 / 2851000 /2852000 / +254 711012 000 / 734 108200 / SMS: 22522E-mail: [email protected] Website: www.kcbbankgroup.com Physical Address: Kencom House, Nairobi Date Authorised: 1st November, 2015

C E N T R A L B A N K O F K E N Y ABANK SUPERVISION ANNUAL REPORT 2016
76
7 M Holdings LimitedLicensed Subsidiary: Oriental Commercial Bank LtdPostal Address: P O Box 73248-00200 Nairobi, KenyaTelephone: + 254 20 2228461/2E-mail address: [email protected] address: Jadala Place, 3rd Floor, Ngong Lane, Ngong Road, NairobiDate Authorised: 18th February, 2015
E. AUTHORISED REPRESENTATIVE OFFICES
1. Bank of China Limited Kenya Representative OfficeChief Representative Officer: Mr. Qi WangAddress: P.O. Box 21357 - 00505 – Nairobi, KenyaTelephone No.: +254 - 20 - 3862811 / 2Telephone No.: +254 - 20 - 3862811 / 2Mobile: +254 - 788808600 Email: [email protected] Address: Unit 1, 5th Floor, Wing B, Morningside Office Park, Ngong Road, NairobiDate Authorised: 29th June 2012
2. Bank of Kigali Ltd Kenya Representative OfficeChief Representative Officer: Mr. Patrick MasumbukoAddress: P.O. Box 73279-00200 GPO– Nairobi, KenyaTelephone No.: +254 (20) 2711076 Email: [email protected] Address: Ground Floor, Capitol Hill Square, Off Chyulu Road, Upper Hill, NairobiDate Authorised: 12th February 2013
3. Central Bank of India Kenya Representative OfficeChief Representative Officer: Mr. S.S. RaoAddress: P.O. Box 66860- 00800 Nairobi, Kenya Telephone No.: +254 20 3742008 Fax No.: +254 20 3742011Mobile : +254 (0)732283722Email: [email protected] Address: Suite No. 5A, MMID Studios, Westlands Road, WestlandsDate Authorised: 12th February 2013
4. FirstRand Bank Limited Kenya Representative OfficeChief Representative Officer: Mrs. Alfetta Koome MungaiAddress: P.O. Box 35909, 00200 – Nairobi, KenyaTelephone No.: +254 20 4908201 / 4908206Cell: +254790469978Email: [email protected] Address: Ground Floor, Eaton Place, UN Crescent, Gigiri, NairobiDate Authorized: 29th November 2011
5. HDFC Bank Limited Kenya Representative OfficeAg. Chief Representative Officer: Mr. Apurva ShethAddress: P.O. Box 14235 - 00800 – Nairobi, KenyaMobile No. : +254 738905141Telephone No: +254 20 3749857/63 Email address : [email protected] Address: Prosperity House, Westlands Road, Off Museum Hill, Westlands, Nairobi Date Authorised: 26th June 2008

C E N T R A L B A N K O F K E N Y ABANK SUPERVISION ANNUAL REPORT 2016
77
E. AUTHORISED REPRESENTATIVE OFFICES
6. Mauritius Commercial Bank Limited Kenya Representative OfficeChief Representative Officer: Ms. Seema DhananiAddress: P.O. Box 35699 - 00800 – Nairobi, KenyaMobile No. : +254 716403709Telephone No: +254 20 44931000 Email address : [email protected] Address: Bloom Centre, KMA Centre, Mara Road, Upper Hill, Nairobi Date Authorised: 27th November 2014
7. Nedbank Limited Kenya Representative OfficeChief Representative Officer: Mr. Jaap van LuijkAddress: P.O Box 39218 - 00623, Nairobi, KenyaTelephone: +254-20 - 8045102 Email: [email protected] Address: The Exchange Building, 3rd Floor, 55 Westlands Road, NairobiDate Authorised: 18th June 2010
8. Cooperatieve Rabobank U.A Kenya Representative OfficeChief Representative Officer: Mr. Johannes de LaatAddress: P.O. Box 1105-00606, Nairobi, Kenya Mobile : +254 202 955 000/1/2 | Mobile : 254 700 331-203/+ 254 700 331 194Email: [email protected] Address: www.rabobank.comPhysical Address: 17th Floor, Delta Corner Tower, Waiyaki Way, Nairobi Date Authorised: 5th June 2014

C E N T R A L B A N K O F K E N Y ABANK SUPERVISION ANNUAL REPORT 2016
78
Appendix XVIII
NO. DIRECTORY OF MICROFINANCE BANKS
1. Caritas Microfinance Bank LimitedChief Executive Officer: Mr. George Mugwe Maina Postal Address: P. O. Box 15352 - 00100, NairobiTelephone: +254 - 020 - 5151500 Email: [email protected]: www.caritas-mfb.co.kePhysical Address: Cardinal Maurice Otunga Plaza, Ground floor, Kaunda StreetDate Licensed: 02.06.2015Branches: 3
2. Century Microfinance Bank Limited Chief Executive Officer: Mr. Reuben MwangiPostal Address: P. O. Box 38319 - 00623, Nairobi Telephone: +254 - 020 - 2664282, 0722 - 168721, 0756 - 305132 Email: [email protected] Website: www.century.co.ke Physical Address: K.K. Plaza, 1st Floor, New Pumwani Road - Gikomba Date Licensed: 17.09.2012Branches: 3
3. Choice Microfinance Bank LimitedActing Chief Executive Officer: Mr. Stanley KasyokaPostal Address: P. O. Box 18263 - 00100, NairobiTelephone: +254 - 020 3882206 / 207, 0736 - 662218, 0724 - 308000 Email: [email protected]: www.choicemfb.comPhysical Address: Siron Place, Ongata Rongai, Magadi Road Date Licensed: 13.05.2015Branches: 2
4. Daraja Microfinance Bank LimitedChief Executive Officer: Mr. Simon Gathecah Postal Address: P.O. Box 100854 - 00101, Nairobi Telephone: +254 - 020 - 3879995 / 0733 - 988888, 0707 – 444888, 0718 - 444888 Email:[email protected] Website:www.darajabank.co.ke Physical Address: Karandini Road, off Naivasha Road Date Licensed: 12.01.2015 Branches: 2

C E N T R A L B A N K O F K E N Y ABANK SUPERVISION ANNUAL REPORT 2016
79
Appendix XVIII
NO. DIRECTORY OF MICROFINANCE BANKS
5. Faulu Microfinance Bank Limited Managing Director: Mr. Apollo Njoroge NderituPostal Address: P. O. Box 60240 - 00200, Nairobi Telephone: +254 - 020 - 3877290/3/7; 3872183/4; 3867503, 0711 - 074074, 0708 - 111000Fax: +254-20-3867504, 3874875 Email: [email protected], [email protected], [email protected] Website: www.faulukenya.com Physical Address: Faulu Kenya House, Ngong Lane - Off Ngong Road Date Licenced: 21.05.2009 Branches: 39
6. Kenya Women Microfinance Bank Limited Managing Director: Mr. James Mwangi Githaiga Postal Address: P. O. Box 4179-00506, Nairobi Telephone: +254 - 020 - 3067000, 2470272-5/2715334-5, 0729920920, 0732633332, 0703 - 067000 Email: [email protected] Website: www.kwftdtm.com Physical Address: Akira House, Kiambere Road, Upper Hill Date Licenced: 31.03.2010 Branches: 32
7. Maisha Microfinance Bank LimitedChief Executive Officer: Mr. Ireneus Gichana Postal Address: 49316 - 00100, Nairobi Telephone: 020 222 0648 | 0736-028-982 | 0792-002-300 Email: [email protected] Website: www.maishabank.com Physical Address: Chester House, 2nd Floor, Koinange Street Date Licensed: 21.05.2016Branches: 2
8. Rafiki Microfinance Bank Limited Managing Director: Mr. Ken Obimbo Postal Address: P. O. Box 12755 - 00400, Nairobi Telephone: +254-020-2166401/0730 170 000/500 Email: [email protected] Website: www.rafiki.co.ke Physical Address: Rafiki House, Biashara Street Date Licensed: 14.06.2011 Branches: 17
9. Remu Microfinance Bank Limited Chief Executive Officer: Mr. David Gachui IrunguPostal Address: P. O. Box 20833 - 00100, Nairobi Telephone: +254 - 020 - 2214483/2215384/ 2215387/8/9, 2631070, 2215380, 2215384/5/7/8/9, 0733-554555 Email: [email protected] Website: www.remultd.co.ke Physical Address: Finance House, 14th Floor, Loita Street Date Licensed: 31.12.2010 Branches: 3

C E N T R A L B A N K O F K E N Y ABANK SUPERVISION ANNUAL REPORT 2016
80
Appendix XVIII
NO. DIRECTORY OF MICROFINANCE BANKS
10. SMEP Microfinance Bank Limited Chief Executive Officer: Mr. Symon Kamore Postal Address: P. O. Box 64063 - 00620, Nairobi Telephone: +254 - 020 - 3572799/2055761, 2673327/8, 0711606900 Email: [email protected] Website: www.smep.co.ke Physical Address: SMEP Building - Kirichwa Road, Off Argwings Kodhek Road Date Licensed: 14.12.2010 Branches: 7
11. Sumac Microfinance Bank Limited Chief Executive Officer: Mr. John Kamau Njihia Postal Address: P. O. Box 11687 - 00100, Nairobi Telephone: +254 - 020 - 2212587, 2210440, 2249047, 0738637245, 0725223499 Fax: 20 2210430 Email: [email protected]: www.sumacmicrofinancebank.co.kePhysical Address: Consolidated Bank House, 2nd Floor, Koinange Street Date Licensed: 29.10.2012 Branches: 4
12. U & I Microfinance Bank Limited Chief Executive Officer: Mr. Simon Mwangi Ngigi Postal Address: 15825 - 00100, Nairobi Telephone: +254 - 020 - 2367288, 0713 - 112791 Email: [email protected] Website: www.uni-microfinance.co.ke Physical Address: Asili Complex, 1st Floor, River Road Date Licensed: 08.04.2013 Branches: 2
13. UWEZO Microfinance Bank LimitedChief Executive Officer: Mr. Wilson NguyoPostal Address: 1654 - 00100, Nairobi Telephone: 2212919, 0703591302 Email: [email protected] Website: www.uwezodtm.com Physical Address: Rehani House, 11th Floor, Koinange Street Date Licensed: 08.11.2010 Branches: 2

C E N T R A L B A N K O F K E N Y ABANK SUPERVISION ANNUAL REPORT 2016
81
Appendix XIX
NO. DIRECTORY OF CREDIT REFERENCE BUREAUS
1. Credit Reference Bureau Africa Limited (Trading as TransUnion)Chief Executive Officer: Mr. Billy Osano OwinoPostal Address: P.O. Box 46406 - 00100, NairobiTelephone: +254 - 020 - 3751799/3751360/2/4/5Fax: +254 - 020 - 3751344Email: [email protected]: www.crbafrica.comPhysical Address: CRB Centre, Prosperity House, 2nd Floor, Westlands Road
2. Creditinfo Credit Reference Bureau Kenya LimitedChief Executive Officer: Mr. Stephen Kamau KunyihaPostal Address: P.O. Box 38941 - 00623, NairobiTelephone: +254 - 020 - 3757272Email: [email protected] or [email protected] Website: www.creditinfo.co.kePhysical Address: Park Suites, Office 12, Second Floor, Parklands Road
3. Metropol Credit Reference Bureau LimitedManaging Director: Mr. Sam OmukokoPostal Address: P.O. Box 35331 - 00200, NairobiTelephone: +254 - 020 - 2713575Email: [email protected]: www.metropolcorporation.comPhysical Address: 1st Floor, Shelter Afrique Centre, Upper Hill

C E N T R A L B A N K O F K E N Y ABANK SUPERVISION ANNUAL REPORT 2016
82
Appendix XXDIRECTORY OF FOREIGN EXCHANGE BUREAUS
Name of Bureau Location E-mail Address & Fax1 Alpha Forex Bureau Ltd
P. O. Box 476 – 00606NairobiTel: 4451435/7
Pamstech House Woodvale Grove Westlands, Nairobi
[email protected]: 254-2-4451436
2 Arcade Forex Bureau LtdP. O. Box 21646 – 00505NairobiTel: 3871946/2189121/0721-810274
Adams Arcade Shopping Centre, Ngong Road, Nairobi
[email protected]: 254-2-571924
3 Aristocrats Forex Bureau LtdP. O. Box 10884 – 00400NairobiTel: 245247/228080
Kenindia House,Loita StreetNairobi
[email protected] [email protected] Fax: 254-2-213794
4 Avenue Forex Bureau LtdP. O. Box 1755 – 80100Mombasa
Motor Mart Building,Moi Avenue,Mombasa
[email protected] [email protected]
5 Bamburi Forex Bureau LtdP. O. Box 97803MombasaTel: 041-5486950, 0722-412649/ 0733-466729
City Mall Nakumatt Nyali, Mombasa - Malindi Road
[email protected] Fax: 254-41-5486948
6 Bay Forex Bureau (Nairobi) LtdP. O. Box 42909 – 00100NairobiTel: 2244186/ 2248289/2244188
The Stanley BuildingKenyatta Avenue, Nairobi
[email protected] [email protected]: 254-2-229665/248676
7 Boston Forex Bureau LimitedP.O. Box 11076–00400NairobiTel: 0205249664/ 0732622429/ 0702022429
Nakumatt Ukay Centre, Westlands, Nairobi
8 CBD Forex Bureau LimitedP. O. Box 10964 – 00400NairobiTel: 316123
Clyde House,Kimathi Street, Nairobi
[email protected]: 254-2-318895
9 Central Forex Bureau LtdP. O. Box 43966 – 00100 NairobiTel: 2226777/ 2224729/317217
I. P. S. Building, Ground Floor,Kaunda Street,Nairobi
[email protected]: 254-2-249016
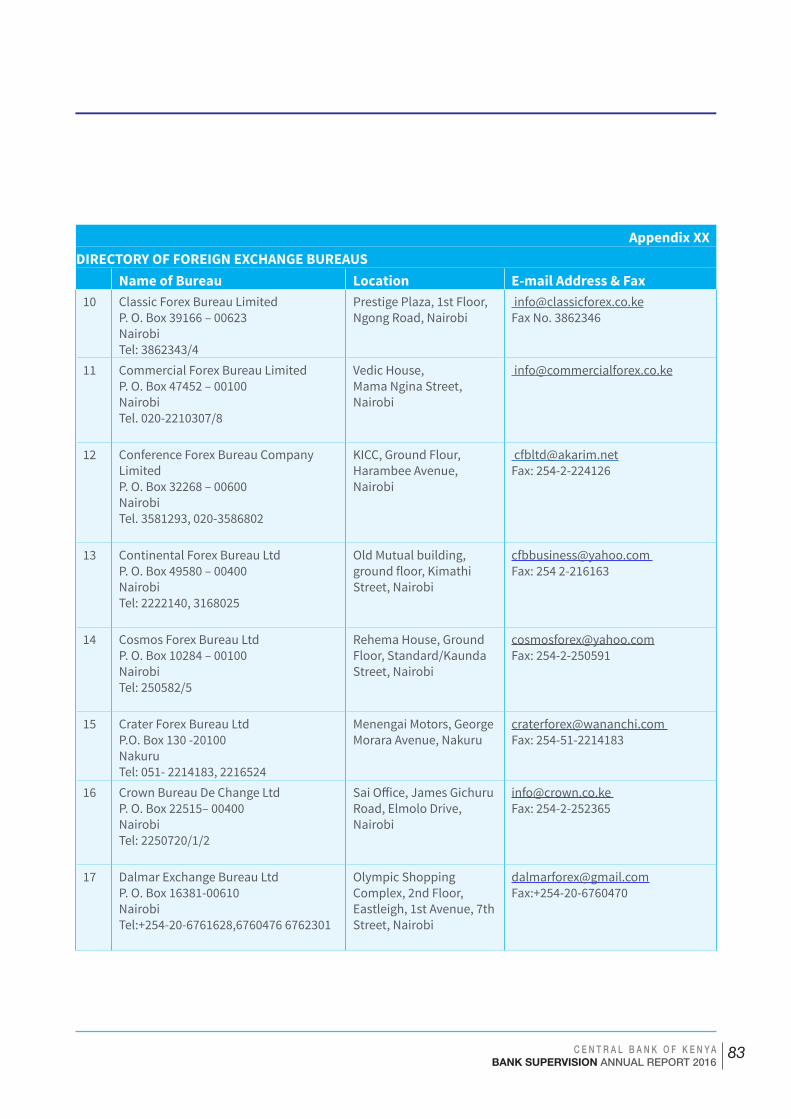
C E N T R A L B A N K O F K E N Y ABANK SUPERVISION ANNUAL REPORT 2016
83
Appendix XXDIRECTORY OF FOREIGN EXCHANGE BUREAUS
Name of Bureau Location E-mail Address & Fax10 Classic Forex Bureau Limited
P. O. Box 39166 – 00623NairobiTel: 3862343/4
Prestige Plaza, 1st Floor,Ngong Road, Nairobi
[email protected] No. 3862346
11 Commercial Forex Bureau LimitedP. O. Box 47452 – 00100NairobiTel. 020-2210307/8
Vedic House,Mama Ngina Street,Nairobi
12 Conference Forex Bureau Company LimitedP. O. Box 32268 – 00600NairobiTel. 3581293, 020-3586802
KICC, Ground Flour, Harambee Avenue,Nairobi
[email protected]: 254-2-224126
13 Continental Forex Bureau LtdP. O. Box 49580 – 00400NairobiTel: 2222140, 3168025
Old Mutual building, ground floor, Kimathi Street, Nairobi
[email protected] Fax: 254 2-216163
14 Cosmos Forex Bureau LtdP. O. Box 10284 – 00100NairobiTel: 250582/5
Rehema House, Ground Floor, Standard/Kaunda Street, Nairobi
[email protected]: 254-2-250591
15 Crater Forex Bureau LtdP.O. Box 130 -20100NakuruTel: 051- 2214183, 2216524
Menengai Motors, GeorgeMorara Avenue, Nakuru
[email protected] Fax: 254-51-2214183
16 Crown Bureau De Change LtdP. O. Box 22515– 00400NairobiTel: 2250720/1/2
Sai Office, James Gichuru Road, Elmolo Drive, Nairobi
[email protected] Fax: 254-2-252365
17 Dalmar Exchange Bureau LtdP. O. Box 16381-00610NairobiTel:+254-20-6761628,6760476 6762301
Olympic Shopping Complex, 2nd Floor, Eastleigh, 1st Avenue, 7th Street, Nairobi
[email protected]:+254-20-6760470

C E N T R A L B A N K O F K E N Y ABANK SUPERVISION ANNUAL REPORT 2016
84
Appendix XXDIRECTORY OF FOREIGN EXCHANGE BUREAUS
Name of Bureau Location E-mail Address & Fax18 Downtown Cambio Forex Bureau Ltd
P. O. Box 42444 – 00100NairobiTel: 608659; 609547/607721
Downtown Building, Wilson Airport, Langata Road, Nairobi
[email protected]: 254-2-608354
19 Forex Bureau Afro LtdP. O. Box 100414 – 00101NairobiTel: 2247041/2250676/222950
Jamia PlazaKigali StreetNairobi
[email protected]: 254-2-7250502
20 Gala Forex Bureau LtdP. O. Box 35021-00100NairobiTel: 020310241Mobile: 0729750000
20th Century, 1st FloorMama Ngina/ Kaunda Street, Nairobi
[email protected] Fax: 254 20 310261
21 Gateway Forex Bureau LtdP. O. Box 11500 – 00100NairobiTel: 2212955/45/49, 0700-003435
Town House,Kaunda Street, Nairobi
[email protected] Fax: 254-20-2212942
22 Giant Forex Bureau de Change LtdP. O. Box 56947 – 00200NairobiTel: 827970
Unit 1, Jomo Kenyatta International Airport, Nairobi
[email protected]: 254-2-825327
23 Give and Take Forex Bureau LtdP. O. Box 51463 – 00200NairobiTel: 7120581/3562152
Gigiri,China GardenNairobi
[email protected]: 254-2-7120046
24 Glory Forex Bureau LtdP. O. Box 42909 – 00100NairobiTel: 2244333/2241164/2243115
Norwich Union HouseKimathi Street,Nairobi
[email protected] Fax: 254-2-245614
25 GNK Forex Bureau LtdP. O. Box 14297 – 00100NairobiTel: 890303/891243/891848/892048
The Great Jubilee Shopping Centre, Ground Floor, Langata Road, Nairobi
[email protected] Fax: 254-2-892266

C E N T R A L B A N K O F K E N Y ABANK SUPERVISION ANNUAL REPORT 2016
85
Appendix XXDIRECTORY OF FOREIGN EXCHANGE BUREAUS
Name of Bureau Location E-mail Address & Fax26 Green Exchange Forex Bureau Ltd
P. O. Box 20809 – 00100Nairobi Tel:+2540202214547/8/9
Emperor Plaza, Ground Floor,Koinange Street, Nairobi
[email protected] Fax: 254-2-2214550
27 Industrial Area Forex Bureau LtdP. O. Box 45746 – 00100NairobiTel: 551186/551198
Bunyala Road,Industrial Area, Nairobi
[email protected]: 254-2-551186
28 Island Forex Bureau LtdP. O. Box 84300 MombasaTel: 041-2223988/ 2229626
Abdulrasul Inst. Building, Makadara Road, Moi Avenue, Mombasa
[email protected] Fax: 254-41-2227057
29 Junction Forex Bureau Limited P. O. Box 43888 – 00100 Nairobi Tel: 3861268/9, 0725-852840
The Junction of Ngong Road/ Dagoreti Corner,Nairobi
30 Kenza Exchange Bureau LtdP. O. Box 21819 – 00400NairobiTel: 822504/ 2245863
JKIA, Arrival Unit 1 Nairobi
[email protected], [email protected]
31 La’che Forex Bureau LtdP. O. Box 45191 – 00100NairobiTel: 3514509, 2119568/9, 0711-229408, 3752109
Diamond Plaza, 2nd Floor,Parklands, Nairobi
[email protected] Fax: 254-2-2733485
32 Legacy Forex Bureau LtdP. O. Box 15710 – 00100NairobiTel. 0791587614, 0719670281, 0728647131
The Hub Karen, Dagoreti Road, Nairobi
[email protected] or [email protected]
33 Leo Forex Bureau LtdP. O. Box 82304– 80100MombasaTel: 041-2230396/7/8; 2230399
T. S. S. TowersNkrumah Road,Mombasa
[email protected] Fax: 254-41-230399
34 Link Forex Bureau LtdP. O. Box 11659 – 00400NairobiTel: 2213619/21, 0724-256480
Uganda House – Arcade,Kenyatta Avenue,Nairobi
[email protected]: 254-2-213620

C E N T R A L B A N K O F K E N Y ABANK SUPERVISION ANNUAL REPORT 2016
86
Appendix XXDIRECTORY OF FOREIGN EXCHANGE BUREAUS
Name of Bureau Location E-mail Address & Fax35 Lion Bureau De Change Ltd
P.O Box 4581-00200NairobiTel: 0732911138, 0731863896, 0202600072
Taj Shopping MallNorth Airport Road,Embakasi, Nairobi
[email protected] [email protected]
36 Magnum Forex Bureau De Change LtdP. O. Box 46434 – 00100Nairobi
Nakumatt Mega,Uhuru Highway, Nairobi
37 Maritime Forex Bureau LtdP. O. Box 43296 – 80100MombasaTel: 041- 2319175/6/7
Hassanali Building, Nkrumah Road, Nairobi
[email protected] Fax: 254-41-2319178
38 Metropolitan Bureau De Change LtdP. O. Box 7080 – 00300NairobiTel: 827963
Galleria Mall, Langata Road, Nairobi
[email protected] [email protected]: 254-2-252116
39 Middletown Forex Bureau LtdP. O. Box 41830 – 00100NairobiTel: 2211227
Westminister HouseKaunda StreetNairobi
[email protected]: 254-2-332534
40 Mona Bureau De Change LtdP. O. Box 46180 – 00100NairobiTel: 828111/2, Cell: 0733-744348
Panari Centre,Mombasa RoadNairobi
[email protected]: 254-2-828113
41 Moneypoint Forex Bureau LtdP. O. Box 3338-00100NairobiTel No. 020-2211346/7
Tubman Road,Anish Plaza, Nairobi
[email protected] Fax:+254-20-2211342
42 Morgan Forex Bureau De Change LtdP. O. Box 79012 – 00400NairobiTel No. 020-4444073
Kipro Centre, Sports Street, Westlands, Nairobi
[email protected] Fax: 254 -2-4444074

C E N T R A L B A N K O F K E N Y ABANK SUPERVISION ANNUAL REPORT 2016
87
Appendix XXDIRECTORY OF FOREIGN EXCHANGE BUREAUS
Name of Bureau Location E-mail Address & Fax43 Mustaqbal Forex Bureau Ltd
P. O. Box 100745 – 00101NairobiTel: 020-2497344
Mosque House, 6th Street, Eastleigh, Nairobi
[email protected] Fax: 254-2-6766650
44 Muthaiga-ABC Forex Bureau LtdP. O. Box 63533 – 00619,Tel: 4048883/4044146Cell: 0722-362665/0733-362665
Muthaiga Shopping Centre, Nairobi
45 Nairobi Bureau De Change LtdP. O. Box 644 – 00624,Village Mkt NairobiTel: 822884
Unit 2 JKIANairobi
[email protected]: 254-2-241307
46 Nairobi Forex Bureau LtdP. O. Box 12523 – 00100NairobiTel: 2244767/2223039
Gujarat House,Muindi Mbingu Street,Nairobi
[email protected] Fax: 254-2-244767
47 Namanga Forex Bureau LtdP. O. Box 12577 – 00100NairobiTel: 02-213642/ 045-5132476
Immigration Building, Namanga Town
48 Nawal Forex Bureau LtdP. O. Box 43888 – 00100NairobiTel: 2720111
Chaka Place,Chaka Road, Nairobi
[email protected]: 254-2-272011
49 Offshore Forex Bureau LimitedP. O. Box 26650 – 00100 NairobiTel: 020 – 310837/8
Cianda House,Ground Floor,Koinange Street, Nairobi
[email protected]: 254-02-310839
50 Pacific Forex Bureau LimitedP. O. Box 24273 – 00100NairobiTel. 310880, 310882/3
Lonhro House,Standard Street, Nairobi
[email protected], ‘[email protected]
51 Peaktop Bureau De Change LtdP. O. Box 13074 – 00100NairobiTel: 2244371/313438, 0722 – 332518
20th Century,Mama Ngina/Kaunda Streets, Nairobi
[email protected], [email protected]: 254-2-210210
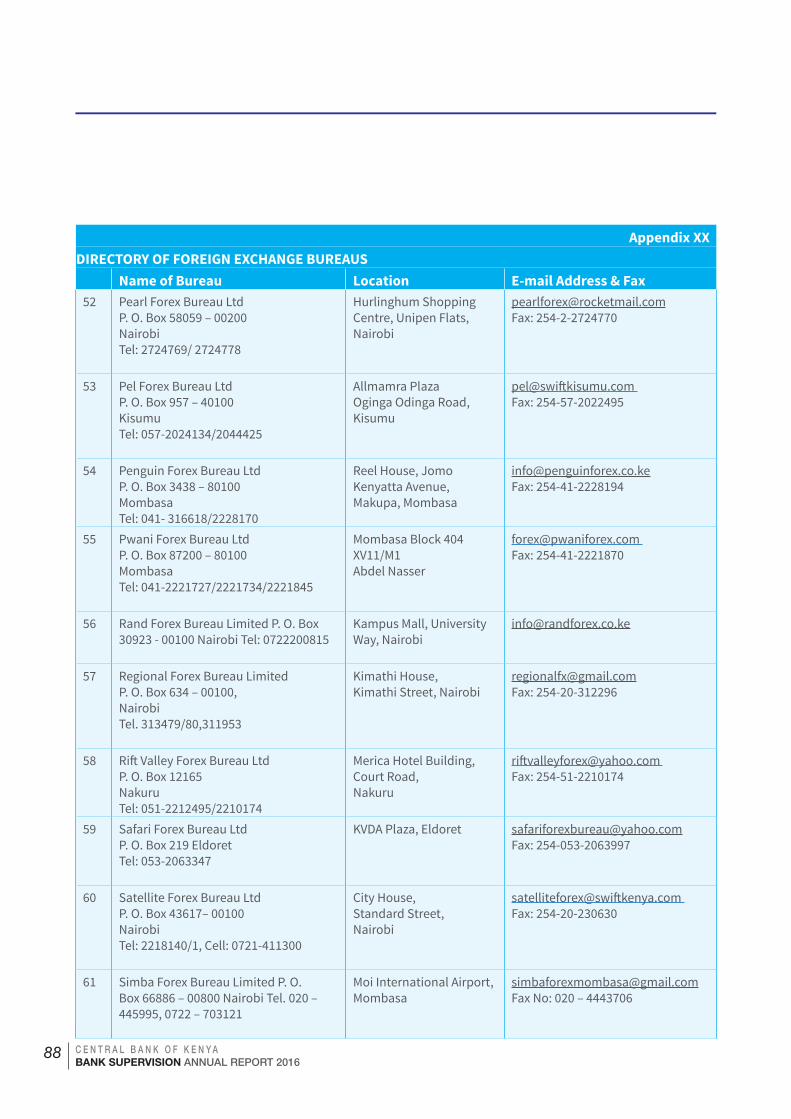
C E N T R A L B A N K O F K E N Y ABANK SUPERVISION ANNUAL REPORT 2016
88
Appendix XXDIRECTORY OF FOREIGN EXCHANGE BUREAUS
Name of Bureau Location E-mail Address & Fax52 Pearl Forex Bureau Ltd
P. O. Box 58059 – 00200NairobiTel: 2724769/ 2724778
Hurlinghum Shopping Centre, Unipen Flats, Nairobi
[email protected]: 254-2-2724770
53 Pel Forex Bureau LtdP. O. Box 957 – 40100KisumuTel: 057-2024134/2044425
Allmamra PlazaOginga Odinga Road, Kisumu
[email protected] Fax: 254-57-2022495
54 Penguin Forex Bureau LtdP. O. Box 3438 – 80100MombasaTel: 041- 316618/2228170
Reel House, Jomo Kenyatta Avenue, Makupa, Mombasa
[email protected]: 254-41-2228194
55 Pwani Forex Bureau LtdP. O. Box 87200 – 80100MombasaTel: 041-2221727/2221734/2221845
Mombasa Block 404 XV11/M1Abdel Nasser
[email protected] Fax: 254-41-2221870
56 Rand Forex Bureau Limited P. O. Box 30923 - 00100 Nairobi Tel: 0722200815
Kampus Mall, University Way, Nairobi
57 Regional Forex Bureau LimitedP. O. Box 634 – 00100,NairobiTel. 313479/80,311953
Kimathi House,Kimathi Street, Nairobi
[email protected]: 254-20-312296
58 Rift Valley Forex Bureau LtdP. O. Box 12165NakuruTel: 051-2212495/2210174
Merica Hotel Building,Court Road,Nakuru
[email protected] Fax: 254-51-2210174
59 Safari Forex Bureau LtdP. O. Box 219 EldoretTel: 053-2063347
KVDA Plaza, Eldoret [email protected]: 254-053-2063997
60 Satellite Forex Bureau LtdP. O. Box 43617– 00100NairobiTel: 2218140/1, Cell: 0721-411300
City House,Standard Street,Nairobi
[email protected] Fax: 254-20-230630
61 Simba Forex Bureau Limited P. O. Box 66886 – 00800 Nairobi Tel. 020 – 445995, 0722 – 703121
Moi International Airport,Mombasa
[email protected] No: 020 – 4443706

C E N T R A L B A N K O F K E N Y ABANK SUPERVISION ANNUAL REPORT 2016
89
Appendix XXDIRECTORY OF FOREIGN EXCHANGE BUREAUS
Name of Bureau Location E-mail Address & Fax62 Sisi Forex Bureau Limited
P.O. Box 60770 - 00200 NairobiTel: 2445846/0722-382995
Agip House,Haile Selasie Avenue, Nairobi
63 Sky Forex Bureau LimitedP. O. Box 26150 – 00100 NairobiTel: 020-2242062/3
20th Century,Mama Ngina/ Kaunda Street, Nairobi
[email protected] No. 020-2242064
64 Solid Exchange Bureau LtdP. O. Box 19257– 00501NairobiTel: 822922/0722-853769
JKIA-Unit 2, Nairobi [email protected]: 254-2-822923
65 Sterling Forex Bureau Ltd P. O. Box 43673 – 00200 Nairobi Tel: 2228923/340624
Laxmi Plaza,Biashara Street, Nairobi
[email protected] Fax: 254-2-330894
66 Sunny Forex Bureau LimitedP. O. Box 34166 – 00100NairobiTel: 2252013/252079
Uniafric House,Koinange Street, Nairobi
[email protected]: 254-2-252076
67 Taipan Forex Bureau LtdP. O. Box 42909 – 00100NairobiTel: 827378
JKIA,International Arrivals Terminal, Nairobi
[email protected] Fax: 254-2-229665/248676
68 Tower Forex Bureau Limited P.O. Box 25934 - 00100 Nairobi Tel. 0723434343, 0739270511, 0772372744
I & M Bank Tower, Kenyatta Avenue, Nairobi

C E N T R A L B A N K O F K E N Y ABANK SUPERVISION ANNUAL REPORT 2016
90
Appendix XXDIRECTORY OF FOREIGN EXCHANGE BUREAUS
Name of Bureau Location E-mail Address & Fax69 Trade Bureau De Change Ltd
P. O. Box 7080 – 00300NairobiTel: 2241107
St Eliss House, City Hall Way, Nairobi
[email protected] [email protected] Fax: 254-2-317759
70 Travellers Forex Bureau LtdP. O. Box 13580 – 00800 NairobiTel: 447204/5/6
The Mall, Ring Road Westlands, Nairobi
[email protected]: 254-2-443859
71 Travel Point Forex Bureau LimitedP. O. Box 75901 – 00200NairobiTel. 827872, 827877
JKIA,International Arrivals Terminal, Nairobi
[email protected]: 254-2-827872
72 Union Forex Bureau LtdP. O. Box 43847– 00100NairobiTel: 4441855/4448327/4447618
Sarit Centre , Lower Kabete Road , Westlands,Nairobi
[email protected] Fax: 254-2-4441855
73 Ventures Forex Exchange Bureau LtdP.O. Box 2665 - 00200NairobiTel: 0722650195
Bishop Magua Centre,1st floor,Ngong Road, Nairobi
[email protected],wanjiru101@[email protected]
74 Victoria Forex Bureau De Change LtdP. O. Box 705 – 40100KisumuTel 057-2025626/2021134/2023809
Sansora Building,Central Square,Kisumu
[email protected]: 254-57-202536
75 Wallstreet Bureau De Change LtdP. O. Box 6841- 30100 EldoretTel: 053-2062907
Bargetuny Plaza,Uganda Road,Eldoret
[email protected]: 254- 53-2062907
76 Westlands Forex Bureau LtdP. O. Box 45746 – 00100NairobiTel: 3748786
14 Riverside Drive, Nairobi.
[email protected] Fax: 254-2-3748785
77 Yaya Centre Exchange Bureau LtdP. O. Box 76302 – 00508NairobiTel: 02-3869097
Yaya Centre Towers, Argwings Kodhek Road, Nairobi
[email protected]: 254-2-3870869

C E N T R A L B A N K O F K E N Y ABANK SUPERVISION ANNUAL REPORT 2016
91
Appendix XXI
DIRECTORY OF MONEY REMITTANCE PROVIDERS (MRPs)
Name of MRP Location Email Address1 Amal Express Money Transfer
Limited P.O.BOX 3165 – 00100NairobiTel: 0722878597 or 0723281122
Amal Plaza, 1st Avenue Eastleigh, Nairobi
2 Amana Money Transfer LtdP.O. Box 68578 – 00622NairobiTel : 6761296 / 2379824
Amana Shopping Complex, Captain Mungai Street, Eastleigh, Nairobi.
[email protected]/ [email protected]
3 Bakaal Express Money Transfer LtdP.O.BOX 71248 – 00610Nairobi Tel: 2394513 or 0717399039
Amco Shopping Mall, 1st Avenue Eastleigh, Nairobi
4 Continental Money Transfer Limited P.O. Box 49387 – 00100NairobiTel : 2217138/40
Eco Bank Towers, Kaunda Street, Nairobi
5 Dahabshill Money Transfer Limited.P.O. Box 68991 – 00622NairobiTel:2222728/9 or 0720169999
20th Century Building, Standard Street, Nairobi
6 Flex Money Transfer Limited P.O. Box 23786-00100 Nairobi Tel:020-3861100/ 0715919391
Green House, 4th Floor, Suite 13, Ngong Road, Nairobi
7 Global Money Transfer Limited P.O. Box 47583 – 00100 Nairobi Tel:020-2321972/ 0722701990
1st Floor Shariff Centre, Eastleigh Nairobi

C E N T R A L B A N K O F K E N Y ABANK SUPERVISION ANNUAL REPORT 2016
92
Appendix XXI
DIRECTORY OF MONEY REMITTANCE PROVIDERS (MRPs) 8 Hodan Global Money
Remittance and Exchange LimitedP.O. Box 68811 – 00622NairobiTel:2084862
Hong Kong Shopping Mall, 1st Avenue, Athumani Kipanga Street, Eastleigh, Nairobi
9 Iftin Express Money Transfer LimitedP.O. Box 100184 – 00101NairobiTel: 2629818
AMCO Shopping Mall, 1st Avenue, Eastleigh, Nairobi
10 Juba Express Money Transfer Limited P.O.BOX 17773 – 00100NairobiTel: 2240540, 0727699669 or 0772699669
Hamilton House, Kaunda StreetNairobi
11 Kaah Express Money Transfer LimitedP.O.BOX 10327 – 00400NairobiTel: 0206767494/604 or 0724710153
Kaah building, 2th Avenue, 8th Street, Eastleigh, Nairobi
12 Kendy Money Transfer LimitedP.O.BOX 76163 – 00508NairobiTel: 0202377054
Sameer Business Park, Block E, Off Mombasa Road
13 Safaricom Money Transfer Services LimitedP. O. Box 66827 – 00800 Nairobi Tel: 20 427 3272 / 0722 00 3272
Safaricom House,Waiyaki Way, Westlands, Nairobi

C E N T R A L B A N K O F K E N Y ABANK SUPERVISION ANNUAL REPORT 2016
93
Appendix XXI
DIRECTORY OF MONEY REMITTANCE PROVIDERS (MRPs) 14 Tawakal Money Transfer Limited
P.O. BOX 42909 – 00100NairobiTel : 6766171
Ubah Center, 5th Street Eastleigh, Nairobi.
15 UAE Exchange Money Remittance LimitedP.O Box 51695 – 00100NairobiTel: 2220101
IPS Building, Kimathi Street, Nairobi.
16 Real Value Money Transfer Ltd. P.O Box 26530 – 00100NairobiTel: 0721297906
Shariff Complex,5th Avenue ,Eastleigh,Nairobi.
17 Upesi Money Transfer LtdP.O Box 60776 – 00100NairobiTel: 0726499656
NHIF Building,1st Floor, Nairobi [email protected]
18 Mobex Money Transfer Services Ltd. P.O Box 1956 – 00621NairobiTel: 0708047188
Woodlands Office Park,4th Floor, Woodlands Road, Nairobi

C E N T R A L B A N K O F K E N Y ABANK SUPERVISION ANNUAL REPORT 2016
94
Haile Selassie Avenue P. O. Box 60000 - 00200 NairobiTel: 20 - 2860000/2861000/ 2863000 Fax: 20 - 340192
www.centralbank.go.ke | www.facebook.com/CentralBankKenya | @CbkKenya