do bank regulation and supervision displace bank auditing? · do bank regulation and supervision...
TRANSCRIPT

Do Bank Regulation and Supervision Displace Bank Auditing
Aloke (Al) Ghosh
Fulbright Distinguished Chair
Zicklin School of Business
Baruch College City University of New York
New York NY 10010
AlokeGhoshbaruchcunyedu
Henry Jarva
Assistant Professor
Department of Accounting
Aalto University School of Business
PO Box 21210 00076 Aalto Finland
HenryJarvaaaltofi
and
Stephen G Ryan
Professor of Accounting
Stern School of Business New York University
44 West Fourth Street
New York NY 10012
sryansternnyuedu
July 2017
We thank the participants of the accounting research seminar at Pennsylvania State University
for useful comments
Do Bank Regulation and Supervision Displace Bank Auditing
ABSTRACT We hypothesize that bank regulatory and supervisory activities substitute for bank
auditing activities providing auditors with incentives to expend less effort on audits of banks
than on audits of similar firms not subject to regulation and supervision We show that banks
exhibit fewer internal control and accounting problems as measured by the frequencies of
disclosed material internal control weaknesses and financial statement restatements than do
similar firms We show that auditors expend less effort as indicated by lower audit fees and
shorter audit report lags in audits of banks than in audits of similar firms more so when bank
regulation and supervision are more intense Lastly we show that banks are more likely than
similar firms to exhibit two types of earnings management that are of minor concern to bank
regulators and supervisors but have previously documented capital market consequences more
frequent small positive earnings changes and longer strings of earnings increases
1
1 Introduction
Auditors of banks face a distinctive benefit-cost trade-off in choosing the audit effort
(broadly defined to include personnel time and quality audit planning test of controls and
substantive and analytical procedures) sufficient to generate audit evidence that provides the
desired level of assurance On the benefit side banksrsquo economic complexity and opacity increase
investor demand for high quality audits all else being equal We expect this ldquoaudit demand effectrdquo
to increase billed hours as auditors must work longer to complete higher quality audits and
perhaps also to increase billed hourly rates as auditors may need to devote personnel with more
experience or specialized skills to audit banks On the cost side banksrsquo importance to the stability
of the financial system (ldquostabilityrdquo) and the health of the overall economy has given rise to
extensive bank regulation and rigorous bank supervision in the United States Bank regulators and
supervisors monitor banks to ensure their safety and soundness their adherence to regulatory
accounting requirements and the effectiveness of their internal controls These activities
particularly of bank supervision overlap considerably with those of bank auditing For example
bank supervisors and bank auditors both evaluate the adequacy of banksrsquo allowances for loan
losses To the extent that auditors can rely on the activities of bank regulators and supervisors this
overlap yields a ldquosubstitution effectrdquo that we expect reduces the audit effort necessary for bank
auditors to provide the desired level of assurance
In this study we posit that the substitution effect dominates the audit demand effect We
propose and test hypotheses that relative to two control samples of similar firms not subject to
regulation and supervision banks exhibit fewer internal control and accounting problems and bank
auditors expend less effort In addition we conduct two sets of tests to provide support for the
conclusion that the associations we document are causal First we show that increased bank
2
regulatory and supervisory intensity leads to less audit effort Second we show that relative to
similar firms banks are more likely to report small positive earnings changes and to sustain strings
of earnings growth We conjecture that these types of earnings management typically accumulate
to relatively small amounts of retained earnings If so these types have relatively minor effects on
banksrsquo solvency ratios and so should be of minor concern to bank regulators and supervisors
primarily concerned with banksrsquo safety and soundness While we are unaware of any extant
empirical evidence supporting our conjecture it is consistent with the absence of any mention of
these types of earnings management in bank supervisory manuals including the portions devoted
to the evaluation of earnings quality (Comptroller of the Currency 2007 p 53 Board of Governors
of the Federal Reserve System 2017 sect40203) In contrast based on the large empirical literature
documenting such earnings management by public firms in general and by public banks in
particular (Burgstahler and Dichev 1997 Beatty et al 2002) as well as the capital market
consequences of such earnings management (Bartov et al 2002 Brown and Caylor 2005) we
expect these types of earnings management to significantly influence banksrsquo investors and
contracting parties and to be of concern to auditors
Considerable research summarized in Acharya and Ryan (2016) suggests that the quality
of banksrsquo financial reporting is central to stability The traditional view is that transparency
enhances stability (Morgan 2002 Nier and Baumann 2006 Acharya and Ryan 2016) Working
against realization of the benefits of transparency however banks are often viewed as opaque due
to their complex and interrelated on- and off-balance sheet exposures (Morgan 2002) The
individual and collective value and risk of these exposures are difficult for banks to convey to
outsiders and for outsiders to evaluate especially during periods of financial system stress
(Flannery et al 2013) Moreover banks are subject to various agency conflicts due to their high
3
leverage and the existence of information asymmetries between banks and their debt and equity
claimants as well as among these claimants (Beatty and Liao 2014 Acharya and Ryan 2016)
These conflicts provide incentives for banks to manage or obscure their accounting information
Because of banksrsquo complexity opaqueness and agency conflicts bank regulators and
supervisors pay close attention to banksrsquo accounting and internal controls For example bank
regulators specify (a relatively small number of) deviations of regulatory accounting principles
(ldquoRAPrdquo) from generally accepted accounting principles (ldquoGAAPrdquo) when they deem such
ldquoprudential filtersrdquo to further regulatory goals (Barth and Landsman 2010) For some accounting
topics notably loan losses bank regulators provide considerably more detailed implementation
guidance than is available in GAAP (Ryan 2011) Bank regulators require individual regulated
banks and bank holding companies to prepare detailed and standardized regulatory reports each
quarter which the regulators make publicly available on their websites to enhance market
discipline of banks (Pettway and Sinkey 1980 Badertscher et al 2016)
Bank supervisors conduct on-site examinations of banks every twelve to eighteen months
depending on banksrsquo size supervisory ratings non-banking activities and supervisory resource
constraints (Nicoletti 2016 Keeley 2017) In these examinations supervisors primarily evaluate
banksrsquo safety and soundness As central parts of these examinations supervisors evaluate the
adherence of banksrsquo accounting to RAP the adequacy of banksrsquo allowance for loan losses banksrsquo
earnings quality and the effectiveness of banksrsquo internal controls Supervisors report examination
results to banksrsquo managements and boards of directors
Between examinations bank supervisors conduct ongoing off-site monitoring of banksrsquo
safety and soundness using a wide range of information and in the context of banksrsquo most recent
4
examination results Supervisors examine banksrsquo quarterly regulatory reports ldquoto monitor the
condition performance and risk profile of individual institutions and the industry as a wholerdquo1
The Federal Deposit Insurance Corporation Improvement Act of 1991 (ldquoFDICIArdquo)
imposes two important internal control and accounting requirements on banks with assets above
$500 million ($1 billion as of December 2005)2 First FDICIA requires these banks to provide the
Federal Deposit Insurance Corporation (ldquoFDICrdquo) with externally audited annual financial
statements Second FDICIA requires bank managements to assess and certify the adequacy of
their internal controls3
Auditors provide independent assurance that reporting firmsrsquo financial statements
faithfully represent their exposures transactions and performance in accordance with GAAP
(DeFond and Zhang 2014) The demand for high quality audits is larger for firms with higher
information risk (Jensen and Meckling 1976 Watts and Zimmerman 1986) Because of banksrsquo
complexity opacity and agency conflicts we expect the demand for high quality audits to be
greater for banks than for non-banks The demand for high quality audits should be particularly
strong for banks that expand beyond traditional lending and deposit-acceptance activities to engage
in derivatives securities and other complex transactions (Barth et al 2009 Acharya 2014
Acharya and Ryan 2016)
1 httpswwwfdicgovregulationsresourcescallindexhtml
2 12 CFR 363 Annual Independent Audits and Reporting Requirements Part 363 of FDICIA initially
specified that these requirements apply to banks holding assets above a threshold of $150 million The
FDIC changed this threshold to $500 million upon its adoption of Part 363 in 1993 to avoid imposing costs
on very small banks
3 Similar requirements became applicable to non-banks only after Sections 302 and 404 of the Sarbanes-
Oxley Act of 2002 (ldquoSOXrdquo) became effective for accelerated filers in 2003 and 2004 respectively
(Altamuro and Beatty 2010)
5
However audits of banks differ from those of similar unregulated firms because the
activities of bank regulators and supervisors may complement or substitute for bank auditing
activities For example complementarity may result from bank regulators and supervisors
understanding the economics of individual banks and the banking system better than auditors
andor from auditors understanding the application and limitations of accounting matters better
than regulators and supervisors Substitutability may result from material overlap in the activities
of bank regulators and supervisors and bank auditors
We propose and test two related hypotheses First we hypothesize that banks exhibit fewer
internal control and accounting problems than do similar firms not subject to regulation and
supervision (ldquocontrol firmsrdquo) Second we hypothesize that auditors expend less effort on audits of
banks than on audits of control firms The principal basis for both hypotheses is that bank
supervisorsrsquo periodic on-site examinations and ongoing off-site monitoring of banks as well as
their communication of examination results to banksrsquo management and directors reduce banksrsquo
audit risk In terms of the constructs of the standard audit risk model we hypothesize that bank
supervision reduces both banksrsquo inherent risk ie the likelihood that their financial statements are
materially misstated and banksrsquo control risk ie the likelihood that their internal control systems
fail to prevent such material misstatements
We test both of these hypotheses on a comprehensive sample of publicly traded banks
drawn from Annual Bank Compustat and two samples of control firms drawn from Annual North
American Compustat (1) non-depository credit institutions (two-digit SIC code 61)4 and (2) all
4 To be a bank as defined in the Bank Holding Company Act of 1956 an institution must both make loans
and accept deposits Non-depository credit institutions do the former but not the latter The lack of deposits
also exempts these institutions from regulation under the Federal Deposit Insurance Act
6
non-banks in the highest five percent of the ratio of accounts receivable (which includes loan and
lease receivables) to total assets We believe the first of these control samples comprises the closest
available unregulated firms to banks We employ the broader and larger second control sample to
demonstrate the robustness of our results
Drawing on prior research we test the first hypothesis using disclosed material weaknesses
in internal control over financial reporting as the proxy for internal control problems (Ashbaugh-
Skaife et al 2007) and restatements of prior period financial statements as the proxy for accounting
problems (Palmrose and Scholz 2004 Kinney et al 2004 Hennes et al 2014) Consistent with
this hypothesis we find that banks are significantly less likely than control firms to report material
weaknesses in internal controls and to restate their financial statements controlling for other
variables that prior research shows to be associated with internal control weaknesses and
restatements
We test the second hypothesis using two measures of audit effort (1) audit fees (Simunic
and Stein 1996) and (2) audit report lag ie the elapsed time between the fiscal year end and the
audit report date (Ashton et al 1987 Bamber et al 1993 and Ghosh and Tang 2015) Auditing
standards require auditors to respond to increases in audit risk by increasing the extent of audit
procedures5 Prior research shows that more extensive audits require auditors to work more hours
increasing both audit fees (Houston et al 1999 Bell et al 2001 Bedard and Johnstone 2004) and
audit report lags (Bronson et al 2011) Consistent with this hypothesis we find that on average
auditors charge significantly less for audits of banks than for audits of control firms and that the
5 Public Company Accounting Oversight Board (PCOAB) Auditing Standard No 8 Audit Risk (AS 1101
under the PCAOBrsquos December 2016 reorganization of auditing standards) Auditing Standard No 12
Identifying and Assessing Risks of Material Misstatement (AS 2110) and Auditing Standard No 13 The
Auditorrsquos Responses to the Risks of Material Misstatement (AS 2301)
7
average audit report lag is significantly shorter for banks than for control firms controlling for
other variables that prior research shows are associated with audit effort
The primary threat to inference in our study is the possibility that factors other than bank
regulation and supervision might explain why audits of banks pose less audit risk than do audits
of control firms Although we cannot rule out this possibility altogether we conduct two analyses
to provide support for bank regulation and supervision as causally explaining the reduced audit
effort in audits of banks that we document First motivated by prior research evidence that (less
stringent) bank supervisors (are more likely to) exercise accounting-related forbearance
(Gallemore 2016 Costello et al 2016) we test whether bank auditors expend less effort when
bank regulation and supervision are more intense We employ two time-series measures (a
numerical index of restrictions in the text of banking regulations and the natural logarithm of the
annual budget of federal regulators) and one cross-sectional measure (Agarwal et alrsquos 2014
estimate of the difference in the supervisory ratings received by state-chartered banks in alternating
examinations from their state supervisors versus from on-average more stringent federal
supervisors6) of the intensity of bank regulation and supervision We find that auditor effort in
audits of banks is lower when bank regulation and supervision are more intense
Second we examine two types of earnings management that we conjecture for reasons
discussed above are unlikely to concern bank regulators and supervisors and that are more likely
to occur as auditor effort decreases (1) the frequency of reporting small positive earnings changes
and (2) the length of strings of consecutive earnings increases We find that banks are more likely
than control firms to exhibit both of these types of earnings management
6 We thank Amit Seru for graciously providing us with this measure
8
To summarize we contribute to the banking and auditing literatures by providing
evidence consistent with auditors expending less effort in auditing banks than in auditing similar
unregulated firms due to the overlap of the activities of bank regulators and supervisors with
those of auditors We emphasize that our evidence does not suggest that the aggregate
monitoring of banksrsquo financial reporting by bank regulators supervisors and auditors differs
from the monitoring of similar firmsrsquo financial reporting by auditors alone it only suggests that
the monitoring conducted by bank auditors is less Because of the importance of banks to
stability and overall economic health a compelling question is what incremental costs arise when
bank auditors as financial reporting specialists expend less effort on bank audits due to the
existence of bank regulation and supervision We provide evidence that this reduced effort leads
to types of earnings management that likely have minor effects on banksrsquo solvency ratios but
have capital market consequences documented by prior research The types of earnings
management may lead to reduced market discipline over banks We expect these results to be of
interest to bank and auditing policymakers
In the remainder of the paper Section 2 develops the hypotheses Sections 3 and 4 describe
the empirical models and variables and the data sources and sample selection respectively
Sections 5 present the empirical results and Section 6 concludes
2 Background and Hypothesis Development
21 Banking Background7
7 Much of the discussion in this section is drawn from Board of Governors of the Federal Reserve System
(2017) To avoid clutter we only cite material from this document that is not widely available from other
sources
9
211 Bank Regulation and Regulators
In the United States banks are subject to a complex set of laws and regulations that restrict
their allowed activities specify minimum capital and liquidity levels and govern other matters
These laws and regulations exhibit cycles in stringency over time (Ryan 2007) For example
during the regulatory period from the Great Depression to the 1970s the Banking Act of 1933
prohibited bank holding companies from owning or being owned by nonfinancial companies and
from underwriting most securities During the deregulatory period in the early to mid-1980s the
Depository Institutions and Monetary Control Act of 1980 phased out interest rate ceilings and
allowed thrift institutions to expand their activities significantly During the regulatory period in
the late 1980s and early 1990s FDICIA required regulators to take prompt corrective action when
banksrsquo leverage capital ratios fall below the levels deemed well-capitalized FDICIA also includes
various requirements regarding banksrsquo financial reporting auditing and internal control discussed
in the introduction
During the deregulatory period in the late 1990s the Gramm-Leach-Bliley Act of 1999
allowed subsidiaries of regulated banks to underwrite securities and financial holding companies
to perform essentially all types of financial services somewhere within their corporate structures
During the post-financial-crisis regulatory period the Dodd-Frank Wall Street Reform and
Consumer Protection Act of 2010 imposed many prudential regulations on large bank holding
companies including increased risk-based capital and liquidity requirements credit exposure
concentration limits and reporting requirements periodic stress tests requirements to plan for
rapid and orderly resolution of the institution in the event of financial distress or failure
requirements to establish risk committees and enhanced public disclosure requirements Efforts
10
to roll back Dodd-Frank and other bank regulations are currently underway in Congress
(Richardson et al 2017)
FDICIArsquos requirement that a bankrsquos management assess and certify the effectiveness of
the bankrsquos internal controls is of particular relevance to this study Control risk is a key component
of audit risk Particularly prior to the effective dates of Sections 302 and 404 of SOX FDICIArsquos
requirements should reduce the internal control risk of banks relative to that of non-banks
(Altamuro and Beatty 2010) Moreover we expect bank supervisors to require banks with
identified internal control deficiencies to remediate those deficiencies promptly further reducing
banksrsquo control risk
Even the most stringent banking laws and regulations can have the intended effects only if
bank regulators and supervisors adequately enforce banksrsquo adherence to these rules Under the
ldquodual banking systemrdquo individual banks may be nationally or state chartered and bank regulation
and supervision is conducted by overlapping sets of federal regulators and state banking
departments National banks are primarily supervised by the Office of the Comptroller of the
Currency (ldquoOCCrdquo) a federal regulator State banks that elect to become members of the Federal
Reserve System (state member banks) are primarily supervised by the Federal Reserve a federal
regulator and their state banking departments State banks that are not members of the Federal
Reserve System (state nonmember banks) are primarily supervised by the FDIC a federal
regulator and their state banking departments All banks accepting insured deposits are also
supervised by the FDIC8
8 Recognizing that the dual banking system and multiple federal bank regulators could lead to
inconsistencies in bank regulation and supervision in 1978 Congress created the Federal Financial
Institutions Examination Council (ldquoFFIECrdquo) an interagency body to promote consistency in these
activities The FFIEC currently is composed of the chairs of the FDIC and the National Credit Union
Administration the Comptroller of the Currency a governor of the Federal Reserve a state banking
11
Individual banks may be owned by bank holding companies which may apply and qualify
to be financial holding companies Bank holding companies typically engage in lending deposit
acceptance and any other allowed activities through their individual bank subsidiaries Financial
holding companies may engage in activities not allowed in individual banks such as insurance
underwriting and merchant banking through non-bank subsidiaries (Ryan 2007 Avraham et al
2012) The Federal Reserve has supervisory authority over all bank holding companies regardless
of how their subsidiary banks are chartered and supervised
212 Bank Supervision
Bank supervision involves the periodic on-site examination and ongoing off-site
monitoring of banksrsquo financial condition and risks the adequacy of banksrsquo accounting internal
control and risk management systems and banksrsquo compliance with applicable laws and
regulations The main goal of supervision is to ensure the safety and soundness of individual banks
and especially of the banking system
Bank supervision shares many similarities with (bank) auditing For example much like
auditorsrsquo risk-based approach to auditing the Federal Reserve indicates that it employs a risk-
focused approach to supervision (Board of Governors of the Federal Reserve System 2017) Under
this approach the Federal Reserve first identifies the primary risks faced by a bank The Federal
Reserve then assesses the bankrsquos ability to measure monitor and control those risks given its (1)
board and senior management oversight (2) policies procedures and risk limits (3) risk
monitoring and management information systems and (4) internal controls
director and the director of the Consumer Financial Protection Bureau The FFIEC has developed uniform
examination principles and standards as well as uniform regulatory reporting forms and systems for
federally supervised banks
12
On-site examinations of individual banks and bank holding companies generally occur
every 12 to 18 months depending on the organizationrsquos size supervisory rating and extent of non-
banking assets as well as supervisory resource constraints For state banks the primary federal
supervisor coordinates its on-site examinations with the state supervisor with the two supervisors
generally conducting examinations in rotation under the ldquoalternating examination programrdquo
(Agarwal et al 2014) The results of an examination which include a confidential supervisory
rating of the bankrsquos overall condition are reported to the bankrsquos board of directors and
management The supervisory rating system is referred to as CAMELS an acroynm for its six
components (1) capital adequacy (2) asset quality (3) management and administration (4)
earnings (5) liquidity and (6) sensitivity to market risk The overall and component CAMELS
ratings efficiently communicate supervisorsrsquo overall assessments of banks as well as any specific
issues that raise concern or require attention
Between examinations bank supervisors use many sources of financial and other
information most importantly banksrsquo quarterly regulatory reports to monitor banks The primary
report for individual banks is the Consolidated Reports of Condition and Income (ldquoCall Reportsrdquo)
These reports provide the raw data for the Uniform Bank Performance Report which presents
ratios that can be compared across banks and time to detect unusual levels of or significant changes
in a banks financial condition The primary report for bank holding companies is the Consolidated
Financial Statements for Bank Holding Companies (FR Y-9C) The Federal Reserve indicates it
uses an automated system to estimate an organizationrsquos CAMELS rating based on its prior
examination results and subsequent quarterly Call Report or FR Y-9C filings (Board of Governors
of the Federal Reserve System 2017)
13
If a supervisor determines that a bank or bank holding company has problems that affect
its safety and soundness the supervisor may take a variety of formal or informal actions to ensure
that the organizationrsquos management and directors undertake measures to address the problems
(Keeley 2017) For example the supervisor may enter into a written agreement with issue a cease-
and-desist order or prompt-corrective-action directive to or levy a fine against the organization
22 Bank Complexity and Opacity
Although a debate exists as to whether stability is enhanced by bank transparency or bank
opacity the traditional and still dominant view is that transparency enhances stability (Morgan
2002 Nier and Baumann 2006 Acharya and Ryan 2016)9 Prior theoretical and empirical research
provides numerous bases for this view For example banksrsquo effectiveness as monitors provides
them with comparative advantages in lending to information-sensitive borrowers (Diamond 1984)
Banksrsquo high leverage multiplies their risk and exacerbates various agency problems such as asset
substitution (Jensen and Meckling 1976) and underinvestment when the benefits of investment
primarily accrue to debtholders (Myers 1977) Such agency problems are exacerbated further by
information asymmetries between banks and their debt and equity claimants as well as among
these claimants (Beatty and Liao 2014 Acharya and Ryan 2016)
Despite the perceived benefits of bank transparency banks are often viewed as opaque due
to their complex and interrelated on- and off-balance sheet exposures The individual and
collective values and risk of these exposures are inherently difficult for banks to convey to
outsiders and for outsiders to evaluate This difficulty likely enhances banksrsquo ability to manage or
obscure their accounting numbers
9 See Dang et al (2014) Holmstroumlm (2015) and Acharya and Ryan (2016) for discussion of the opposing
view that bank opacity enhances stability
14
Prior empirical research provides evidence that banks are more opaque than non-banks and
about the determinants of banksrsquo opacity Morgan (2002) shows that banks receive more split
credit ratings (ie different bond ratings from different rating agencies) than do non-banks a result
he attributes to banksrsquo greater opacity He further shows that banksrsquo opacity varies with their asset
composition increasing with their proportions of loans and trading assets Flannery et al (2013)
provide evidence that bank opacity increases during periods of financial system stress when the
valuations of financial assets become harder to determine and more strongly correlated
We expect that the difference in opacity between banks and non-banks has widened over
time as banks have shifted their activities from relatively understandable deposit-acceptance and
lending activities ie traditional financial intermediation to less easily understandable
nontraditional activities such as derivatives trading securitization and the provision of various
forms of contingent financing Banksrsquo economic exposures resulting from these activities often
exhibit concentrated or correlated risks or state-contingent liquidity requirements and these
exposures often are partly or wholly off-balance sheet (Barth et al 2009 Acharya 2014 Acharya
and Ryan 2016)10
Banksrsquo increasing economic complexity has been accompanied by increasing length and
complexity of their financial reports Accounting standard setters have written many complex and
lengthy standards for financial instruments and transactions to try to adequately portray their
10 In large part reflecting the income generated by these nontraditional activities the average bankrsquos
noninterest revenues as a percentage of net operating revenues increased from below 20 in the 1970s to
around 50 by 2009 (Barth et al 2009) A portion of this increase is attributable to generally declining
interest rates from 1981 to 2009 however
15
economics11 Despite banksrsquo provision of far more extensive financial report information in
compliance with the requirements of these standards (Guay et al 2016) we expect the individual
and collective values and risk of banksrsquo exposures to have become more difficult for banks to
convey to outsiders and for outsiders to evaluate
23 Hypotheses and Empirical Proxies
231 Engagement and Audit Risks
Auditorsrsquo decisions whether to bid for potential engagements the prices at which to bid
and the effort needed to provide the desired level of assurance depend on the risks the engagements
pose for them (Bedard and Johnstone 2004) Overall engagement risk has three interrelated
components (1) clientsrsquo business risk ie the possibility that clientsrsquo financial condition
deteriorates in the limit leading to firm failure (2) auditorsrsquo business risk ie the possibility of
litigation or reputational costs to auditors from their associations with clients and (3) audit risk
ie the possibility that auditors fail to detect material misstatements in financial statements due to
error or fraud In our investigation of whether bank regulation and supervision displace auditing
we focus on audit risk because it is the component of engagement risk that is most directly reduced
by audit effort
In the standard (textbook) model audit risk has three by construction distinct components
(1) inherent risk ie the likelihood that material misstatements of clientsrsquo financial statements
exist prior to the operation of their internal control systems (2) control risk ie the likelihood that
clientsrsquo internal control systems fail to prevent material misstatements and (3) detection risk ie
11 Notable examples of these standards include FAS 133 (1998) and FAS 161 (2009) for derivatives
(Accounting Standard Codification Section 815) and FAS 140 (2000) FIN 46(R) (2003) FAS 166 (2009)
and FAS 167 (2009) for securitizations (Accounting Standards Codification Sections 860 and 810)
16
the likelihood the auditor fails to detect material misstatements not prevented by clientsrsquo internal
control systems We expect bank regulation and supervision to reduce the inherent risk and control
risk components of audit risk and thus to reduce the incentive for auditors to expend effort on
audits of banks
232 Frequency of Internal Control and Accounting Problems
Bank supervisors monitor banksrsquo internal control and accounting systems through periodic
on-site examinations and ongoing off-site monitoring We expect this scrutiny to reduce the
inherent risk and control risk components of audit risk for audits of banks relative to audits of
control firms We formally state this hypothesis in the alternative as
Hypothesis 1 Banks exhibit fewer internal control and accounting problems than do
control firms
233 Audit Effort
It is theoretically unclear whether auditors should expend more or less effort on audits of
banks than on audits of control firms A primary reason why auditors would work more on audits
of banks is that banksrsquo greater complexity and opacity lead to their investors and contracting parties
more strongly benefiting from higher quality audits that increase the informativeness and
reliability of banksrsquo financial statements Due to this audit-demand effect higher quality audits
more strongly reduce the need for firmsrsquo investors and contracting parties to protect themselves
against uninformative or unreliable financial statement numbers by reducing the prices they are
willing to pay for firmsrsquo securities and by requiring contractual protections such as collateral
respectively To satisfy the demand for higher audit quality for audits of banks than for audits of
control firms auditors of banks must expend more effort by increasing the number of billed hours
17
andor by devoting more experienced andor specialized staff to engagements increasing the
average billed hourly fee
A primary reason why auditors would work less on audits of banks than on audits of control
firms is the overlap of the activities of bank regulators and supervisors particularly supervisorsrsquo
periodic examination and ongoing monitoring of banks with the activities of bank auditors Due
to this substitution effect auditors of banks need to perform less extensive audit planning and
substantive testing than do auditors of control firms to provide any given level of assurance We
expect the substitution effect to be more likely to dominate the audit-demand effect when bank
regulation and supervision are more intense for example when regulators and supervisors use
more sophisticated or sensitive approaches such as the Federal Reserversquos risk-focused approach
(Board of Governors of the Federal Reserve System 2017)
Although the two effects yield opposing predictions we expect that the substitution effect
generally dominates the audit demand effect because of substantial extent of the overlap of the
activities of bank regulators and particularly supervisors with those of auditors Relatedly many
aspects of bank regulation and supervision reduce the inherent and control risk components of
audit risk For example when bank supervisors determine that banks exhibit inadequate solvency
or other problems they convey the banksrsquo deficient CAMELS ratings to the banksrsquo management
and boards of directors who are responsible for resolving these problems This expectation yields
our second hypothesis stated in the alternative
Hypothesis 2 Auditors exert lower effort on audits of banks than on audits of control
firms
3 Empirical Models and Variables
31 Frequencies of Internal Control and Accounting Problems
18
We employ two dependent variables in our tests of Hypothesis 1 First we proxy for
problems in banksrsquo internal control using an indicator for material weaknesses in internal control
(Ashbaugh et al 2007) Naturally we can only observe such weaknesses if firms identify and
disclose them as FDICIA requires for banks and Sections 302 and 404 of SOX require for all
firms INTERNAL_WEAKNESS denotes firm-years with disclosed material internal control
weaknesses Second we proxy for problems in banksrsquo accounting using an indicator for financial
statement restatements which arise from GAAP violations and thus suggest audit failures
(Palmrose and Scholz 2004 Kinney et al 2004 Hennes et al 2014)12 ACC_RESTATEMENT
denotes firm-years with restatements of financial statements13 We denote
INTERNAL_WEAKNESS and ACC_RESTATEMENT collectively by Y
The main test variable in our tests of Hypothesis 1 is an indicator for banks denoted BANK
As discussed below we control for numerous client and auditor characteristics that prior research
finds are associated with internal control and accounting problems In addition when the
dependent variable Y is INTERNAL_WEAKNESS (ACC_RESTATEMENT) we control for
ACC_RESTATEMENT (INTERNAL_WEAKNESS) We denote the Y variable that is controlled for
in a given model by Y_CONTROL
12 In untabulated analysis we also proxy for both internal control and accounting problems using auditor
resignations (Krishnan and Krishnan 1997 Shu 2000 Hennes et al 2014) If banks exhibit fewer internal
control and accounting problems than do control firms bank auditors have fewer reasons to resign from
audit engagements However compared to the proxies for these problems in the tabulated analyses auditor
resignations are more likely to capture the components of engagement risk other than audit risk For
example prior research shows that auditors are more likely to resign when clients exhibit greater financial
distress (Schwartz and Soo 1995) more corporate governance problems (Lee et al 2004) and greater
litigation risk (Krishnan and Krishnan 1997 Simunic and Stein 1996)
13 All indicator variables in the paper take a value of one when a firm or firm-year exhibits the specified
condition and zero otherwise
19
Based on prior empirical research examining internal control weaknesses (Altamuro and
Beatty 2010)14 and financial statement restatements (Palmrose and Scholz 2004 Kinney et al
2004 Hennes et al 2008) we use the following logistic model to explain the probability that Y
equals one denoted Prob(Y = 1) in terms of BANK and control variables (collectively denoted
X)15
Prob(Y = 1) = eXβ (1 + eXβ) where
Xβ = β0 + β1BANK + β2LogASSETS + β3ROA + β4LOSS + β5LEVERAGE
+ β6GOODWILL + β7MampA + β8FOREIGN + β9MTB (1)
+ β10GOING_CONCERN + β11Y_CONTROL + β12BUSY_MONTH
+ β13BIG4 + β14ISPEC + year fixed effects
Because Prob(Y = 1) is not directly observable we estimate equation (1) with Y as the dependent
variable Hypothesis 1 predicts that the coefficient β1 on BANK is negative
Equation (1) controls for numerous client characteristics We selected these characteristics
based on prior research findings that firms that have less resources to invest in internal control
systems have undergone major organizational changes and are more complex or otherwise stress
auditorsrsquo capabilities exhibit more frequent internal control and accounting problems (eg Ge and
McVay 2005 Ashbaugh-Skaife et al 2007 Doyle et al 2007ab)
We control for the resources that clients have available to establish effective internal
control systems using the natural logarithm of total assets (LogASSETS) net income divided by
total assets (ROA) an indicator variable for negative net income (LOSS) and the ratio of total
14Altamuro and Beatty (2010) show how FDICIArsquos (1991) internal control requirements affected insured
depository institutions with assets of $500 million or above They do not compare the internal control
quality of banks and non-banks
15 Throughout the paper we omit firm and year subscripts for brevity
20
liabilities to total assets (LEVERAGE) We control for clientsrsquo organizational changes associated
with business acquisitions using the ratio of goodwill to total assets (GOODWILL) and an indicator
variable that equals one when goodwill increases by more than $1 million (MampA) We control for
other determinants of audit complexity using the proportion of foreign sales for control firms and
the proportion of foreign commercial loans for banks (FOREIGN) the ratio of market value of
equity to book value of equity (MTB) an indicator variable for the auditor rendering a going-
concern opinion (GOING_CONCERN) and Y_CONTROL
We control for three auditor characteristics an indicator for December fiscal year end
(BUSY_MONTH) an indicator variable for Big-Four auditor (BIG4) and the auditorrsquos market
share in the industry (ISPEC) Lastly we include fixed year effects to capture unobserved time-
related factors for both clients and auditors
Because the effects of client size may be nonlinear in tabulated specification analyses we
include indicator variables for client total assets in the following categories up to $10 billion (this
indicator is omitted as one must be) from above $10 to $50 billion (B10_50) from above $50 to
$100 billion (B50_100) from above $100 to $500 billion (B100_500) and above $500 billion
(B500) Moreover because the effects of size may vary for banks versus control firms we also
include the interactions of these size indicators with BANK
32 Audit Effort
We test Hypothesis 2 using two dependent variables that prior research indicates proxy for
auditor effort audit fees (Simunic and Stein 1996) and audit report lag (Ashton et al 1987 Bamber
et al 1993 and Ghosh and Tang 2015) Audit fees equal the number of hours worked times the
average fee per hour worked LogFEE denotes the natural logarithm of the sum of audit and audit-
related fees Auditors working more hours is positively associated with audit report lags (Bronson
21
et al 2011) LogREPORT_LAG denotes the natural logarithm of one plus the number of days
between the fiscal year end and the audit report signature date
Based on prior models for audit fees (Simunic 1980 Ghosh and Tang 2015) we use the
following model to explain LogFEE
LogFEE = β0 + β1BANK + β2LogASSETS + β3ROA + β4LOSS + β5SPECIAL_ITEMS
+ β6DISCONTINUED + β7LEVERAGE + β8INVENTORY + β9INTANGIBLES
+ β10GOODWILL + β11MampA + β12NEG_EQUITY + β13FIRM_AGE (2)
+ β14ACCEL_FILER + β15INTERNAL_WEAKNESS + β16MTB + β17RETURN
+ β18STD_RETURN + β19GOING_CONCERN + β20BUSY_MONTH
+ β21BIG4 + β22ISPEC + year fixed effects
Based on prior models for audit report lag (Ashton et al 1987 Bamber et al 1993 Bronson et al
2011 Ghosh and Tang 2015) we use the following model to explain LogREPORT_LAG
LogREPORT_LAG = β0 + β1BANK + β2LogASSETS + β3ROA + β4LOSS
+ β5DISCONTINUED + β6EXTRA_ITEMS + β7ABS_ACCRUALS
+ β8LEVERAGE + β9INVENTORY + β10FOREIGN + β11FIRM_AGE (3)
+ β12 INTERNAL_WEAKNESS + β13AUDITOR_TURNOVER
+ β14GOING_CONCERN + β15BUSY_MONTH + β16BIG4
+ year fixed effects
As in equation (1) the main test variable in equations (2) and (3) is BANK Hypothesis 2 predicts
that the coefficient β1 on BANK is negative in both equations
Equations (2) and (3) control for numerous client and auditor characteristics that prior
research finds are associated with audit fees or audit report lag respectively Many of the control
variables included in Equations (2) and (3) also appear in Equation (1) and are defined above
Equation (2) andor equation (3) include the following additional client characteristics16 Special
16 The sets of control variables in equations (2) and (3) are not identical consistent with the models
estimated in prior research
22
items divided by total assets (SPECIAL_ITEMS) an indicator for absolute value of discontinued
operations above $1 million (DISCONTINUED) and an indicator for absolute value of
extraordinary items above $1 million (EXTRA_ITEMS) capture transitory earnings items The
absolute value of accruals divided by total assets (ABS_ACCRUALS) captures other dimensions of
earnings quality The ratio of inventory to total assets (INVENTORY) and the ratio of intangible
assets to total assets (INTANGIBLES) capture balance sheet composition An indicator for negative
common equity (NEG_EQUITY) and the number of years the firm is listed on Compustat
(FIRM_AGE) capture early-stage or otherwise risky firms An indicator for accelerated filer
(ACCEL_FILER) and an indicator for auditor turnover during the year (AUDITOR_TURNOVER)
capture other auditing stresses Fiscal year stock return (RETURN) and the standard deviation of
monthly stock returns (STD_RETURN) capture the aggregate level and the volatility respectively
of exogenous shocks occuring during the fiscal year
As for equation (1) in tabulated specification analyses we include indicator variables for
client total assets in the various size categories and we also include the interactions of these size
indicators with BANK
33 Earnings Management of Minor Concern to Bank Regulators and Supervisors
As discussed in the introduction we expect bank regulators and supervisors to be relatively
unconcerned about types of earnings management that accumulate to relatively small amounts of
retained earnings Such earnings management has minor effects on banksrsquo solvency ratios and so
should not appreciably affect supervisorsrsquo evaluations of banksrsquo safety and soundness We expect
that if bank regulation and supervision leads to lower audit effort in audits of banks than in audits
of control firms as predicted in Hypothesis 2 banks engage more in these types of earnings
23
management than do control firms Motivated by Burgstahler and Dichev (1997) Beatty et al
(2002) and Graham et al (2005) we examine two proxies for such earnings management
First we examine the frequency of small (from 0 to 001) increases in return on equity
(SMALL_POS)17 Based on Beatty et al (2002) we use the following logistic model to explain
SMALL_POS
Prob(SMALL_POS= 1) = eXβ (1 + eXβ) where
Xβ = β0 + β1BANK + β2LogASSETS + β3LEVERAGE + β4MTB (4)
+ β5ACCEL_FILER + β6BIG4 + year fixed effects
We expect the coefficient β1 on BANK to be positive
Second we examine the length of the longest string of consecutive earnings increases for
each firm (STRING) Based on Beatty et al (2002) we use the following Cox proportional hazard
model to explain STRING
h(STRING|X)= h0(STRING) eXβ where
Xβ= β0 + β1BANK + β2LogASSETS + β3LEVERAGE +β4MTB + β5ACCEL_FILER (5)
+ β6INTERNAL_WEAKNESS + β7BIG4 + year fixed effects
h(STRING|X) denotes the hazard function and h0(STRING) denotes the baseline hazard function
We expect the coefficient β1 on BANK to be positive
17 Specifically we compute return on equity (ROE) as net income divided by common equity SMALL_POS takes a
value of one if the change in ROE is greater than zero but smaller than or equal to 001 and zero otherwise
24
4 Data and Sample Selection
41 Data
We obtain audit fee audit report signature date auditor change internal control weakness
and restatement data from Audit Analytics We obtain financial statement data from Compustatrsquos
annual Bank and North American files We obtain geographic and foreign segment data from
Compustatrsquos Segment file If a given firm-year is available in Compustatrsquos Bank file we classify
the firm-year observation as a bank
Our sample covers the fifteen-year period from 2000 to 2014 The sample period begins in
2000 because audit fees are unavailable prior to that year Because SOX-mandated internal control
weakness data become available in 2004 our analysis of internal control weaknesses is limited to
the eleven-year period from 2004 to 2014 We restrict the sample to firm-year observations with
complete data on audit fees auditor identification and audit report signature date from Audit
Analytics as well as on total assets (item AT) total liabilities (item LT) total common equity (item
CEQ) net income (item NI) closing price (item PRCC) and common shares outstanding (item
CSHO) from Compustat These data requirements yield 7914 bank-year observations (965 unique
banks) 671 firm-year observations in SIC 61 (104 unique firms) and 3111 firm-year observations
in the top five percent of the ratio of accounts receivable to total assets (812 unique firms) from
2000ndash2014 The internal control weakness sample includes 5581 bank-year observations 483
firm-year observations for the SIC 61 control sample and 2254 firm-year observations for the top
five percent of the ratio of accounts receivable to total assets control sample from 2004ndash2014
42 Descriptive Statistics
Table 1 reports means for each of the dependent variables (above the line) and each of the
independent variables (below the line) in equations (1)-(5) for the bank sample SIC 61 control
25
sample and highest 5 ratio of accounts receivable to assets control sample Significant
differences of the means for the bank sample versus the SIC 61 control sample and for the bank
sample versus the highest 5 ratio of accounts receivable to assets control sample are indicated in
the columns for the control samples
The differences of the means for the dependent variables are uniformly significant and
consistent with our hypotheses that banks exhibit fewer internal control and accounting problems
than do control sample firms as well as our expectations that banks engage in more of certain types
of earnings management than do control sample firms Consistent with Hypothesis 1 banks are
less likely than both control samples to disclose material internal control weaknesses
(INTERNAL_WEAKNESS) and to restate their financial statements (ACC_RESTATEMENT)
Consistent with Hypothesis 2 on average audit fees (FEE) are lower and audit report lags
(REPORT_LAG) are shorter for banks than for both control samples Consistent with our
expectations for earnings management banks are more likely to report small positive earnings
changes (SMALL_POS) and on overage report longer strings of positive earnings (STRING)
Most of the differences of the means for the independent variables are also significant For
most of these variables the means for banks are closer to those of the a priori more analogous SIC
61 control sample than to those of the highest 5 ratio of accounts receivable to assets control
sample Accordingly we discuss only the former mean differences Compared to the SIC 61
control sample on average banks are smaller (ASSETS) are more profitable (ROA) and have
fewer losses (LOSS) have fewer transitory earnings items (SPECIAL_ITEMS DISCONTINUED
and EXTRA_ITEMS) and lower absolute accruals (ABS_ACCRUALS) have higher financial
leverage (LEVERAGE) have lower non-financial assets (INVENTORY INTANGIBLES and
GOODWILL) despite engaging in more mergers and acquisitions (MampA) are less likely to have
26
negative equity (NEG_EQUITY) or foreign operations (FOREIGN) have insignificantly different
age (AGE) have lower expected growth (MTB) experience lower exogenous shocks (RETURN
and STD_RETURN) and receive fewer going-concern opinions (GOING_CONCERN)
Compared to the SIC 61 control sample on average banks exhibit one characteristic that
stress auditorsrsquo capabilities more frequent December fiscal year-ends (BUSY_MONTH)
However on average banks are less likely to be accelerated filers (ACCEL_FILER) are less likely
to be audited by a Big 4 auditor (BIG4) are less likely to have auditors with high relative industry
market share (ISPEC) and experience less auditor turnover (AUDITOR_TURNOVER)
5 Empirical Results
51 Frequencies of Internal Control and Accounting Problems
Hypothesis 1 predicts that due to bank regulation and supervision banks exhibit fewer
internal control and accounting problems than do similar unregulated firms To test this hypothesis
Tables 2 and 3 report logistic estimations of equation (1) with the dependent variables
INTERNAL_WEAKNESS and ACC_RESTATEMENT respectively18 We report the estimation of
each model for the combined bank sample and SIC 61 control sample in the left column of the
table and for the combined bank sample and highest 5 ratio of accounts receivable to assets
control sample in the right column of the table
We estimate each model in two different ways Panel A of each table reports the estimation
of the base model To better control for size differences between the bank and control samples
Panel B of each table reports estimations of the equations replacing LogASSETS with the client
18 In untabulated analyses we also examine adverse restatements that reduce ownersrsquo equity and auditor
resignations We find results consistent with those reported in the paper
27
size category indicators (B10_50 B50_100 B100_500 and B500) both separately and interacted
with BANK The coefficient on BANK captures the total effect for the smallest banks (assets less
than $10 billion) The coefficient on the interaction of BANK with a given size category indicator
captures the effect for the banks in that size category incremental to the effect for the smallest
banks The sum of the coefficients on BANK and on the interaction of BANK with a given size
category indicator captures the total effect for the banks in that size category
The model fits and the coefficients on the control variables generally are as expected based
on prior research For simplicity we primarily discuss the statistical and economic significance of
the coefficient β1 on BANK estimated on the combination of the bank sample and the more
analogous SIC 61 control sample reported in the left column of Panel A of the tables We point
out any notable differences of the results for the other models All of these differences pertain to
the coefficients on BANK and the interactions of BANK with the size category indicators in Panel
B which typically indicate that the effects we document are limited to certain size categories In
particular no notable differences arise from the use of different control samples in the estimations
reported in the left and right columns of the tables In discussing economic significance we focus
on eβ1 the differential frequency of internal control and accounting problems for banks versus non-
banks
Examining the estimation of equation (1) with dependent variable
INTERNAL_WEAKNESS reported in the left column of Panel A of Table 2 we find that the
coefficient on BANK is negative (-0781) and significant at the 1 level This coefficient implies
that banks disclose material internal control weaknesses with only 46 of the frequency of SIC
control sample firms controlling for other factors that prior research finds are associated with
28
internal control weaknesses These results are consistent with Hypothesis 1 that bank regulation
and supervision reduce the frequency of banksrsquo internal control problems
In left column of Panel B of Table 2 the coefficient on BANK is negative as expected but
insignificant Notice however that the coefficients on the interactions of BANK with all of the
size category indicators are also negative with these coefficients being significant at the 1 and
10 levels for the interactions of BANK with B10_50 and B50_100 respectively The sum of the
coefficients on BANK and BANKtimesB10_50 is significantly negative at the 1 level and the sum of
the coefficients on BANK and BANKtimesB50_100 is significantly negative at the 10 level These
results imply that banks with assets from $10 billion to $100 billion disclose significantly fewer
internal control weaknesses than do similarly sized control firms consistent with Hypothesis 1
whereas banks in other size categories disclose internal control weaknesses with insignificantly
different frequency
Examining the estimation of equation (1) with dependent variable ACC_RESTATEMENT
reported in the left column of Panel A of Table 3 we find that the coefficient on BANK is negative
(-1075) and significant at the 1 level This coefficient implies that banks report financial
statement restatements with only 34 of the frequency of SIC 61 control sample firms controlling
for other factors that prior research finds are associated with restatements These results are
consistent with Hypothesis 1 that bank regulation and supervision reduce the frequency of banksrsquo
accounting problems
In the left column of Panel B of Table 3 the coefficient on BANK is negative as expected
but insignificant Again notice however that the coefficients on the interactions of BANK with all
of the size category indicators are also negative with the coefficient on the interaction of BANK
with B10_50 significant at the 5 level The sum of the coefficients on BANK and its interaction
29
with B10_50 is significantly negative at the 1 level and the sum of the coefficients on BANK and
its interaction with B100_500 is significantly negative at the 10 level These results imply that
banks with assets from $10 billion to $50 billion and from $100 billion to $500 billion report
significantly fewer accounting restatements than similarly sized control firms consistent with
Hypothesis 1 whereas banks in other size categories report accounting restatements with
insignificantly different frequency
Collectively the results reported in Tables 2 and 3 for disclosed material internal control
weaknesses and accounting restatements are consistent with bank regulation and supervision
rendering engagements for audits banks less risky than for audits of control sample firms for some
size categories and insignificantly differently risky for other size categories
52 Audit Effort
Hypothesis 2 predicts that bank regulation and supervision lead bank auditors to expend
less effort We proxy for (lower) audit effort using (lower) audit fees and (shorter) audit report
lags To test this hypothesis Table 4 reports OLS estimations of equation (2) that explain the
natural logarithm of audit fees (LogFEE) while Table 5 reports OLS estimations of equation (3)
that explain the natural logarithm of the number of days between the fiscal year end and the audit
report signature date (LogREPORT_LAG) The structures of Tables 4 and 5 are the same as those
of Tables 2 and 3 The left columns of the tables report the estimations for the combined bank
sample and SIC 61 control sample The right columns of the tables report the estimations for the
combined bank sample and highest 5 ratio of accounts receivable to assets control sample Panel
A of the tables report the estimation of the base model and Panel B of the tables report the
estimation of the models that include the size category indicators both separately and interacted
with BANK As for the analyses of internal control and accounting problems discussed in Section
30
51 the model fits and the coefficients on the control variables generally are as expected based on
prior literature so we discuss only the statistical and economic significance of the coefficients β1
on BANK in Panel A and of the coefficients on BANK and the interactions of BANK with the size
category indicators in Panel B
Examining the estimation of equation (2) with dependent variable LogFEE reported in the
left column of Panel A of Table 4 we find that the coefficient on BANK is negative (-0705) and
significant at the 1 level This coefficient implies that on average audit fees for banks are only
49 of that for SIC 61 control sample firms controlling for other factors that prior research finds
are associated with audit fees These results are consistent with Hypothesis 2rsquos prediction that bank
regulation and supervision lead to reduced audit effort
In both columns of Panel B of Table 4 the coefficient on BANK is significantly negative
as expected However the coefficient on the interactions of BANK with the largest size category
B500 is significantly positive and of similar absolute magnitude as the coefficient on BANK As a
result the coefficient on the sum of BANK and its interaction with B500 is insignificantly different
from zero whereas the sum of the coefficients on BANK and its interactions with each of the other
size indicators is significantly negative These results imply that relative to similarly sized control
firms audit effort is lower for banks with assets up to $500 billion and audit effort is
insignificantly different for banks with assets exceeding $500 billion The latter result is consistent
with the (relatively few) banks in the largest (money center) size category experiencing elevated
audit fees compared to non-banks of the same size
Examining the estimation of equation (2) with dependent variable LogREPORT_LAG
reported in the left column of Panel A of Table 5 we find that the coefficient on BANK is negative
(-0101) and significant at the 1 level This coefficient implies that on average audit report lag
31
for banks is only 90 of that for SIC 61 control sample firms controlling for other factors that
prior research finds are associated with audit report lag These results are consistent with
Hypothesis 2rsquos prediction that bank regulation and supervision lead to reduced audit effort
In both columns of Panel B of Table 5 the coefficient on BANK is significantly negative
as expected However the coefficients on the interactions of BANK with all of the size categories
are positive often significantly so and of similar absolute magnitude as the coefficient on BANK
As a consequence none of the sums of the coefficients on BANK and its interactions with the size
category indicators is significant These results imply that relative to similarly sized control firms
audit report lag is shorter and thus audit effort is lower for banks with assets up to $10 billion and
audit report lag is insignificantly different for banks with assets exceeding $10 billion
Collectively the audit fee and audit report lag estimation results reported in Tables 4 and
5 provide evidence consistent with bank regulation and supervision leading auditors to expend
lower audit effort on audits of banks in certain size categories
53 Identification Tests for the Audit Fee Model
To provide support for bank regulation and supervision as causally explaining the reduced
audit effort in bank audits that we document in Tables 4 and 5 we estimate expansions of equation
(2) explaining the natural logarithm of audit fees and equation (3) explaining the natural logarithm
of log audit report lag that include time-series or cross-sectional proxies for the intensity of bank
regulation and we test whether audit effort is lower when regulatory intensity is higher As the
inferences generated are similar to conserve space we tabulate and discuss only the results for the
expanded audit fee model
Table 6 reports OLS estimations of equation (2) with LogFEE as the dependent variable
expanded to include one of two measures of time-series measures of bank regulation intensity The
32
sample is limited to 7914 bank-year observations (965 unique banks) from 2000 to 2014 so BANK
is dropped from the equation The first bank regulation intensity measure is based on RegData an
industry- and year-specific regulation index constructed by Al-Ubaydli and McLaughlin (2017)
from textual analysis of the number of constraints (the strings ldquoshallrdquo ldquomustrdquo ldquomay notrdquo
ldquoprohibitedrdquo and ldquorequiredrdquo) in the Code of Federal Regulations (CFR) The measure used is the
natural logarithm of the number of constraints in CFR Title 12 for the banking industry each year
(LogRESTRICTIONS) The second measure is the natural logarithm of the annual budget (in $
millions) of the ldquofinance and bankingrdquo subcategory (which includes the Comptroller of the
Currency Federal Deposit Insurance Corporation and Securities and Exchange Commission)
from Regulatory Reports available at httpswcwustleduregulatory_reports (LogBUDGET)
Figure 1 depicts the evolutions of LogRESTRICTIONS and LogBUDGET from 2000-2014 Panel
A of Table 6 reports descriptive statistics of the two measures of bank regulation intensity
The left (right) columns of Table 6 report the estimation of equation (2) adding
LogBUDGET (LogRESTRICTIONS) to the model The coefficients on LogBUDGET and
LogRESTRICTIONS are both significantly negative at the 1 level consistent with more intense
bank regulation leading to lower audit fees
Table 7 reports the OLS estimations of equation (2) with LogFEE as the dependent variable
expanded to include Agarwal et alrsquos (2014) measure of regulatory leniency (ie inverse intensity)
across state-chartered banks (STATE_REG) This measure is based on the ldquoalternating examination
programrdquo in which state-chartered banks are examined by (more stringent) federal supervisors (the
FDIC or Federal Reserve) and state supervisors in rotation Using a proprietary database Agarwal
et al (2014) estimate the differential examination stringency of federal supervisors versus 44 state
supervisors The left column reports the estimation of an expanded model that includes
33
STATE_REG linearly This model is estimated on 5679 state bankndashyear observations (738 unique
banks) from 2000 to 2014 The right column reports the estimation of an expanded model that
includes STATE_REG both linearly and interacted with an indicator for state-chartered banks
(STATE_BANK) obtained from the FDIC website
(httpswww5fdicgovidaspadvSearchLandingasp) This model is estimated on 7340 (federal
and state) bankndashyear observations (903 unique banks) from 2000 to 2014 The coefficient on
STATE_REG in the left column and the coefficient on STATE_REGtimesSTATE_BANK in the right
column of the table are both significant positive at the 5 level consistent with more lenient state
regulation yielding higher audit fees
Overall the expanded audit fee model estimation results reported Tables 6 and 7 provide
evidence consistent with (more intense) bank regulation and supervision causally explaining the
(more strongly) reduced audit effort in bank audits that we document in Tables 4 and 5
53 Types of Earnings Management of Minor Concern to Bank Regulators and Supervisors
If bank regulation and supervision leads to lower audit effort banks should have more
ability to exercise accounting discretion to manage accounting numbers in ways that do not
significantly concern bank regulators and supervisors Drawing on Beatty et al (2002) we
examine two types of earnings management the frequency of small positive earnings
(SMALL_POS) and the length of the longest string of consecutive earnings increases (STRING)19
We conjecture that these types of earnings management typically accumulate to relatively small
amounts of retained earnings If so these types have relatively minor effects on banksrsquo solvency
19 A side benefit of our use of these earnings management measures is that they are just as naturally applied
to banks as to non-banks In contrast the most commonly used measures of earnings management in the
literature (Jones 1991 Dechow and Dichev 2002) are not as naturally applied to banks
34
ratios and so should be of minor concern to bank regulators and supervisors primarily concerned
with banksrsquo safety and soundness While we are unaware of any supporting empirical evidence for
our conjecture it is consistent with the absence of any mention of these types of earnings
management in bank supervisory manuals including the portions devoted to the evaluation of
earnings quality (Comptroller of the Currency 2007 p 53 Board of Governors of the Federal
Reserve System 2017 sect40203) In contrast based on the large empirical literature documenting
such earnings management and its capital market consequences by public firms in general and by
public banks in particular (Burgstahler and Dichev 1997 Beatty et al 2002 Bartov et al 2002
Brown and Caylor 2005) we expect these types of earnings management to significantly influence
banksrsquo investors and contracting parties and to be of concern to auditors
To test for differences in SMALL_POS for banks versus the firms in the control samples
Table 8 reports the logistic estimation of equation (4) with SMALL_POS as the dependent variable
for the combined BANK sample and SIC 61 control sample (left column) and for the combined
BANK sample and highest 5 ratio of accounts receivable to assets control sample (right column)
A positive coefficient β1 on BANK implies that banks exhibit more frequent small positive earnings
changes than do control firms consistent with bank regulation and supervision leading to lower
bank audit effort In both columns the coefficient on BANK is significantly positive at the 1
level The coefficient in the left (right) column implies that banks report small positive earnings
44 (25) times as frequently as the corresponding control sample firms controlling for other
variables that prior research shows are associated with the frequency of small positive earnings
To test for differences in STRING for banks versus control firms Table 9 reports the
estimation of equation (3) using the Cox proportional hazard approach for the combined BANK
sample and SIC 61 control sample (left column) and for the combined BANK sample and highest
35
5 ratio of accounts receivable to assets control sample (right column) The Cox proportional
hazard approach accounts for the right-censoring of STRING arising from our sample ending in
2014 A positive coefficient β1 on BANK implies that banks exhibit earnings strings with
incrementally longer length than do control firms consistent with bank regulation and supervision
leading to lower bank audit effort In both columns the coefficient on BANK is significantly
positive at the 1 level The coefficient in the left (right) column implies that banks report strings
of positive earnings that are 47 (94) longer than the corresponding control sample firms
controlling for other variables that prior research shows are associated with the length of earnings
strings
Collectively the results from Tables 8 and 9 indicate that compared to control firms banks
are more likely to engage in types of earnings management of minor concern to bank regulators
and supervisors consistent with bank regulation and supervision leading to lower audit effort in
audits of banks
6 Conclusion
A central feature of banks is they are regulated and supervised under numerous banking
laws and regulations Moreover bank supervision involves periodic on-site examinations and off-
site monitoring activities that overlap considerably with auditing activities In this paper we
examine whether bank regulation and supervision displace bank auditing leading to lower audit
effort in audits of banks than in audits of two control samples of similar unregulated firms (1)
non-depository credit institutions (two-digit SIC code 61) and (2) all non-banks in the highest five
percent of the ratio of accounts receivable (which includes loan and lease receivables) to total
assets Our results are consistent with bank regulation and supervision substituting for auditing
36
ie with audit effort being significantly lower in audits of banks than in audits of control sample
firms
We first provide evidence that banking engagements pose less risk to auditors We show
that banks are significantly less likely than control sample firms to disclose material weaknesses
in internal controls and to restate their financial statements controlling for the variables that prior
research shows to be associated with material internal control weaknesses and restatements We
then provide evidence consistent with auditors exerting less effort on audits of banks than on audits
of control sample firms We show that banks exhibit statistically and economically lower audit
fees and shorter audit report lags than do control sample firms controlling for the variables that
prior research shows to be associated with audit fees and audit report lags
We acknowledge that the primary threat to inference in our study is the possibility that
factors other than bank regulation and supervision might explain why audits of banks pose less
audit risk than do audits of control firms Although we cannot rule out this possibility altogether
we conduct two sets of tests to provide support for the conclusion that the associations we
document are causal First we provide evidence that bank auditors expend less effort when bank
regulation and supervision are more intense We use two time-series measures based on the text
of banking regulations and the annual budget of federal regulators and one cross-sectional measure
based on Agarwal et al (2014) of the intensity of bank regulation and supervision Second we
provide evidence that banks are more likely to engage in two types of earnings management that
are of minor concern to bank regulators and supervisors but that prior research shows have capital
market consequences (Bartov et al 2002 Brown and Caylor 2005) We find that banks report more
frequent small positive earnings and longer strings of earnings increases than do similar firms
37
We contribute to the banking and auditing literatures by providing evidence consistent
with auditors expending less effort in auditing banks than in auditing control sample firms due
to the overlap of the activities of bank regulators and supervisors with those of auditors We
emphasize that our evidence does not suggest that the aggregate monitoring of banksrsquo financial
reporting by bank regulators supervisors and auditors differs from the monitoring of similar
firmsrsquo financial reporting by auditors alone it only suggests that the monitoring conducted by
bank auditors is less Because of the importance of banks to stability and overall macroeconomic
health a compelling question is what incremental costs arise when bank auditors as financial
reporting specialists expend less effort on bank audits due to the existence of bank regulation
and supervision We provide evidence that this reduced effort leads to types of earnings
management that likely have minor effects on banksrsquo solvency ratios but have capital market
consequences documented by prior research that may lead to reduced market discipline over
banks We expect these results to be of interest to bank and auditing policymakers
38
References
Acharya V and S Ryan 2016 Banksrsquo financial reporting and financial system stability Journal
of Accounting Research 54 277ndash340
Acharya V 2014 A transparency standard for derivatives Chapter 6 in Risk Topography
Systematic Risk and Macro Modeling edited by M Brunnermeier and A Krishnamurthy
National Bureau of Economic Research University of Chicago Press 2014
Agarwal S D Lucca A Seru and F Trebbi 2014 Inconsistent regulators Evidence from
banking Quarterly Journal of Economics 129 889ndash938
Altamuro J and A Beatty 2010 How does internal control regulation affect financial reporting
Journal of Accounting and Economics 49 58ndash74
Al-Ubaydli O and P McLaughlin 2017 RegData A numerical database on industry-specific
regulations for all United States industries and federal regulations 1997-2012 Regulation
amp Governance 11 109-123
Ashbaugh-Skaife H D Collins and W Kinney Jr 2007 The discovery and reporting of internal
control deficiencies prior to SOX-mandated audits Journal of Accounting and Economics
44 166ndash192
Ashton R J Willingham and R Elliot 1987 An empirical analysis of audit delay Journal of
Accounting Research 25 275ndash292
Avraham D P Selvaggi and J Vickrey 2012 A structural view of US bank holding companies
Federal Reserve Bank of New York Economic Policy Review 18 65ndash81
Badertscher B J Burks and P Easton 2016 The market reaction to bank regulatory filings
Working paper University of Notre Dame
Bamber E L Bamber and M Schoderbek 1993 Audit structure and other determinants of audit
report lag An empirical analysis Auditing A Journal of Practice and Theory 12 1ndash23
Barth J T Li and W Lu 2009 Bank regulation in the United States CESifo Economic Studies
10 2ndash29
Barth M and W Landsman 2010 How did financial reporting contribute to the financial crisis
European Accounting Review 19 399-433
Bartov E D Givoly and C Hayn 2002 The rewards to meeting or beating earnings expectation
Journal of Accounting and Economics 33 (2) 173-204
39
Beatty A B Ke and K Petroni 2002 Earnings management to avoid earnings declines across
publicly and privately held banks The Accounting Review 77 547ndash570
Beatty A and S Liao 2014 Financial accounting in the banking industry A review of the
empirical literature Journal of Accounting and Economics 58 339ndash383
Bedard J and K Johnstone 2004 Earnings manipulation risk corporate governance risk and
auditorsrsquo planning and pricing decisions The Accounting Review 79 277ndash304
Bell T W Landsman and D Shackelford 2001 Auditorsrsquo perceived business risk and audit
fees Analysis and evidence Journal of Accounting Research 39 35ndash43
Board of Governors of the Federal Reserve Board System 2017 Bank Holding Company
Supervision Manual Division of Banking Supervision and Regulation
httpswwwfederalreservegovpublicationssupervision_bhchtm
Bronson S C Hogan M Johnson and K Ramesh 2011 The unintended consequences of
PCAOB auditing standard nos 2 and 3 on the reliability of preliminary earnings releases
Journal of Accounting and Economics 51 95ndash114
Brown L and M Caylor 2005 A temporal analysis of quarterly earnings thresholds Propensities
and valuation consequences The Accounting Review 80 (2) 423-440
Burgstahler D and I Dichev 1997 Earnings management to avoid earnings decreases and losses
Journal of Accounting and Economics 24 99ndash126
Comptroller of the Currency 2007 (last updated 2017) Bank supervision process Comptrollerrsquos
handbook
Costello A J Granja and J Weber 2016 Do strict regulators increase the transparency of the
banking system Working paper Massachusetts Institute of Technology
Dang T G Gorton B Holmstroumlm and Ordontildeez G 2014 Banks as secret keepers PIER working
paper no 14-022
Dechow P and I Dichev 2002 The quality of accruals and earnings The role of accrual
estimation errors The Accounting Review 77 35ndash59
DeFond M and J Zhang 2014 A review of archival auditing research Journal of Accounting
and Economics 58 275ndash326
Diamond D 1984 Financial intermediation and delegated monitoring Review of Economic
Studies 51 393ndash414
40
Doyle J W Ge and S McVay 2007a Accruals quality and internal control over financial
reporting The Accounting Review 82 1141ndash1170
Doyle J W Ge and S McVay 2007b Determinants of weaknesses in internal control over
financial reporting Journal of Accounting and Economics 44 193ndash223
Flannery M S Kwan and M Nimalendran 2013 The 2007ndash2009 financial crisis and bank
opaqueness Journal of Financial Intermediation 22 55ndash84
Francis J E Maydew and H Sparks 1999 The role of big 6 auditors in the credible reporting
of accruals Auditing A Journal of Practice and Theory 18 17ndash34
Gallemore J 2016 Bank financial reporting opacity and regulatory intervention Working paper
University of Chicago
Ge W and S McVay 2005 The disclosure of material weaknesses in internal control after the
Sarbanes-Oxley Act Accounting Horizons 19 137ndash158
Ghosh A and C Tang 2015 Assessing financial reporting quality of family firms The auditorsrsquo
perspective Journal of Accounting and Economics 60 95ndash116
Graham J C Harvey and S Rajgopal 2005 The economic implications of corporate financial
reporting Journal of Accounting and Economics 40 3ndash73
Guay W D Samuels D Taylor 2016 Guiding through the fog Financial statement complexity
and voluntary disclosure Journal of Accounting and Economics 62 234ndash269
Hennes K A Leone and B Miller 2014 Determinants and market consequences of auditor
dismissals after accounting restatements The Accounting Review 89 1051ndash1082
Holmstroumlm B 2015 Understanding the role of debt in the financial system BIS working paper
no 479
Houston R M Peters and J Pratt 1999 The audit risk model business risk and audit‐planning
decisions The Accounting Review 74 281ndash298
Jensen M and W Meckling Theory of the firm Managerial behavior agency costs and
ownership structure Journal of Financial Economics 3 305ndash360
Jones J 1991 Earnings management during import relief investigations Journal of Accounting
Research 29 193ndash228
Keeley J 2017 The impact of regulatory enforcement on bank risk Working paper New York
University
41
Kinney W Palmrose Z and S Scholz 2004 Auditor independence non-audit services and
restatements Was the US government right Journal of Accounting Research 42 561ndash588
Krishnan J and J Krishnan 1997 Litigation risk and auditor resignations The Accounting
Review 72 539ndash560
Lee H V Mande and R Ortman 2004 The effect of audit committee and board of director
independence on auditor resignation Auditing A Journal of Practice and Theory 23 (2)
131ndash146
Morgan D 2002 Rating banks Risk and uncertainty in an opaque industry The American
Economic Review 92 874ndash888
Myers S 1977 Determinants of corporate borrowing Journal of Financial Economics 5 147-
175
Nicoletti A 2016 The effects of auditors and regulators on bank financial reporting Evidence
from loan loss provisions Doctoral dissertation Ohio State University
Nier E and U Baumann 2006 Market discipline disclosure and moral hazard in banking
Journal of Financial Intermediation 15 332ndash361
Palmrose Z and S Scholz 2004 The circumstances and legal consequences of non-GAAP
reporting Evidence from restatements Contemporary Accounting Research 21 139ndash180
Pettway R and J Sinkey 1980 Establishing on-site bank examination priorities An early-
warning system using accounting and market information Journal of Finance XXXV 137ndash
150
Public Company Accounting Oversight Board (PCAOB) Auditing Standard No 8 Audit Risk
Washington DC PCAOB
Public Company Accounting Oversight Board (PCAOB) Auditing Standard No 12 Identifying
and Assessing Risks of Material Misstatement Washington DC PCAOB
Public Company Accounting Oversight Board (PCAOB) Auditing Standard No 13 The
Auditorrsquos Responses to the Risks of Material Misstatement Washington DC PCAOB
Richardson M K Schoenholtz B Tuckman and L White eds 2017 Regulating Wall Street
CHOICE Act vs Dodd-Frank New York Center for Global Economy and Business NYU
Stern School of Business
Ryan S 2007 Financial Instruments and Institutions Accounting and Disclosure Rules Second
edition John Wiley and Sons Hoboken NJ
42
Ryan S 2011 Financial reporting for financial instruments Foundations and Trends in
Accounting 6 187ndash354
Schwartz K and B Soo 1995 An analysis of Form 8-K disclosures of auditor changes by firms
approaching bankruptcy Auditing A Journal of Practice and Theory 14 124ndash136
Shu S Auditor resignations Clientele effects and legal liability Journal of Accounting and
Economics 29 173-205
Simunic D 1980 The pricing of audit services Theory and evidence Journal of Accounting
Research 18 161ndash190
Simunic D and M Stein 1996 The impact of litigation risk on audit pricing A review of the
economics and the evidence Auditing A Journal of Practice and Theory 15 (Supplement)
119ndash134
Watts R L and J L Zimmerman 1986 Positive Accounting Theory Prentice-Hall Inc
43
Table 1 Variable means for banks versus control firms
CONTROL BANK SIC61 High RECAT Mean Mean Difference Mean Difference INTERNAL_WEAKNESS 0024 0051 0026 0066 0042 ACC_RESTATEMENT 0006 0022 0016 0020 0014 FEE ($ million) 1643 6199 4555 3119 1476 REPORT_LAG 59325 68854 9530 68110 8785 SMALL_POS 0174 0063 ndash0111 0063 ndash0110 STRING 5608 4500 ndash1108 3347 ndash2261 ASSETS ($ billion) 39135 102555 63420 30418 8717 ROA 0006 ndash0006 ndash0012 ndash0008 ndash0014 LOSS 0108 0249 0141 0274 0167 SPECIAL_ITEMS ndash0001 ndash0015 ndash0015 ndash0020 ndash0019 DISCONTINUED 0029 0162 0134 0105 0077 EXTRA_ITEMS 0011 0048 0036 0031 0019 ABS_ACCRUALS 0027 0092 0065 0107 0080 LEVERAGE 0902 0722 ndash0180 0610 ndash0292 INVENTORY 0013 0056 0043 0071 0058 INTANGIBLES 0012 0039 0026 0074 0061 GOODWILL 0010 0019 0010 0056 0047 MampA 0198 0152 ndash0046 0228 0030 NEG_EQUITY 0003 0025 0023 0038 0035 FOREIGN 0040 0121 0081 0193 0153 FIRM_AGE 14340 14735 0395 18011 3671 ACCEL_FILER 0626 0689 0063 0608 ndash0018 MTB 1437 1700 0263 2601 1164 RETURN 0106 0171 0065 0179 0073 STD_RETURN 0084 0144 0060 0154 0070 GOING_CONCERN 0006 0015 0009 0028 0022 BUSY_MONTH 0879 0790 ndash0089 0715 ndash0164 BIG4 0444 0668 0224 0630 0185 ISPEC 0115 0166 0051 0162 0046 AUDITOR_TURNOVER 0072 0079 0007 0093 0021
This table reports variable means for the BANK and two CONTROL samples as well as the differences of variable means across the BANK and each CONTROL sample over the period 2000ndash2014 Inclusion in the BANK sample is based on inclusion in the Compustat Bank file (7914 bank-year observations) The SIC61 sample includes non-depository credit institutions with two-digit standard industry classification (SIC) code 61 on the Compustat Annual North American file (671
44
firm-year observations) The High RECTA control sample includes non-bank firms with a ratio of accounts receivable to total assets in the top 5 of the Compustat Annual North American file (3110 firm-year observations) All variables are measured for a given firm-year unless indicated otherwise The dependent variables are reported above the line in the table and are defined as follows INTERNAL_WEAKNESS = 1 if the firm disclosed internal control deficiencies and 0 otherwise ACC_RESTATEMENT = 1 if the firm subsequently restated its 10-K filing for the fiscal year and 0 otherwise FEE = the sum of audit fees and audit-related fees in $ millions REPORT_LAG = the number of days between the fiscal year-end date and auditor signature date (the natural logarithm of this variable is used in the regression analyses) SMALL_POS = 1 if a small ROE increase (000lt∆R0Ele001) is reported STRING = the duration of the longest string of consecutive annual earnings increases for the firm The control variables are reported below the line in the table and are defined as follows ASSETS = total assets ROA = net income divided by total assets LOSS = 1 if the firm reports negative net income and 0 otherwise SPECIAL_ITEMS = special items divided by total assets DISCONTINUED = 1 if discontinued operations exceeds $1 million and 0 otherwise EXTRA_ITEMS = 1 if (absolute) extraordinary items exceeds $1 million and 0 otherwise ABS_ACCRUALS = absolute value of accruals divided by total assets LEVERAGE = total liabilities divided by total assets INVENTORY = inventory divided by total assets INTANGIBLES = intangibles assets divided by total assets GOODWILL = goodwill divided by total assets MampA = 1 if goodwill increases by more than $1 million and 0 otherwise NEG_EQUITY = 1 if common equity is negative and 0 otherwise FOREIGN = 1 if a company reports non-zero foreign exchange income and 0 otherwise FIRM_AGE = the number of years a company is listed in Compustat ACCEL_FILER = 1 if the company is an accelerated filer and 0 otherwise MTB = market value of equity divided by book value of equity RETURN = fiscal year stock return STD_RETURN = standard deviation of monthly stock returns GOING_CONCERN = 1 if the firm received a goingndashconcern modified opinion and 0 otherwise BUSY_MONTH = 1 if the fiscal year-end month is December and 0 otherwise BIG4 = 1 if the company is audited by one of the Big-Four auditors and 0 otherwise ISPEC = auditorrsquos relative market share of audit fees in the clientrsquos FamandashFrench 48 industry classification AUDITOR_TURNOVER = 1 if the firmrsquos auditor changed during the year and 0 otherwise and denote significantly different variable means for the BANK and each CONTROL sample at the 1 5 and 10 levels respectively
45
Table 2 Likelihood of material internal control weaknesses for banks versus control firms
Panel A Logistic estimation of likelihood of material internal control weaknesses CONTROL SIC61 High RECTA BANK ndash0781 (0002) ndash0556 (0001) LogASSETS 0053 (0301) 0014 (0681) ROA 1208 (0441) 0138 (0718) LOSS 1469 (0000) 1335 (0000) LEVERAGE 0663 (0435) ndash0816 (0017) GOODWILL 2950 (0215) 1048 (0206) MampA 0058 (0767) 0194 (0187) FOREIGN ndash0561 (0160) 0463 (0004) MTB 0030 (0536) ndash0041 (0091) GOING_CONCERN 2034 (0000) 1324 (0000) ACC_RESTATEMENT (Y_CONTROL) ndash0076 (0917) 0266 (0574) BUSY_MONTH ndash0020 (0929) 0187 (0203) BIG4 ndash1259 (0029) ndash0863 (0001) ISPEC 4431 (0036) 2211 (0008) Intercept ndash3940 (0001) ndash1463 (0002) Year fixed effects Yes Yes Observations 6064 7834 McFaddens R2 827 952 Panel B Incorporating bank size categories SIC61 High RECTA Intercept ndash4564 (0000) ndash1942 (0000) B10_50 1167 (0041) ndash0047 (0896) B50_100 0308 (0731) ndash0340 (0666) B100_500 ndash0729 (0527) ndash14727 (0983) B500 0032 (0969) ndash0465 (0444) BANK ndash0014 (0968) ndash0499 (0007) BANKB10_50 ndash1704 (0005) ndash0256 (0551) BANKB50_100 ndash2210 (0093) ndash1468 (0246) BANKB100_500 ndash1369 (0296) 12904 (0985) BANKB500 ndash15538 (0978) ndash13901 (0971) Control variables Yes Yes Year fixed effects Yes Yes Observations 6064 7834 McFaddens R2 984 1048
The table reports the logistic estimation of the likelihood of a firm reporting a material weakness in internal control over financial reporting The dependent variable INTERNAL_WEAKNESS = 1 if the firm disclosed a material internal control deficiency and 0 otherwise The main test variable BANK = 1 if the firm is on Bank Compustat and 0 otherwise We estimate the model on the combined BANK sample and one of two control samples of firms that are similar to banks but unregulated (1) The SIC61 control sample comprises non-depository credit institutions with two-digit standard industry classification (SIC) code 61 on Annual North American Compustat (2) the High RECTA control sample comprises non-banks with the top 5 of receivable to assets ratio on Annual North American Compustat The control variables are defined as follows LogASSETS = the natural logarithm of total assets ROA = net income divided by total assets LOSS = 1 if the firm reports negative net income and 0 otherwise LEVERAGE = total liabilities divided by total assets GOODWILL = goodwill divided by total assets MampA = 1 if the firmrsquos goodwill increases by more than $1 million and 0 otherwise FOREIGN = 1 if a firm reports non-zero foreign exchange income and 0 otherwise MTB = market value of equity divided by book value of equity GOING_CONCERN = 1 if a firm receives a going concern modified opinion and 0 otherwise ACC_RESTATEMENT = 1 if the firm subsequently restates its current period Form 10-K filing for the fiscal year BUSY_MONTH = 1 if the fiscal year-end is December and 0 otherwise BIG4 = 1 if the firm is audited by one of the Big-Four auditors and 0 otherwise ISPEC = auditorrsquos relative market share of
46
audit fees in the clientrsquos FamandashFrench 48 industry classification Panel A reports the base model estimation Panel B reports the estimation of an expanded model which includes firm size indicators and their interactions with BANK The firm size indicators are denoted Bj_k=1 if total assets are between j and k $ billion for j=10 50 or 100 and for k=50 100 or 500 and are denoted B500=1 if total assets exceed $500 billion p-values are reported in parentheses
47
Table 3 Likelihood of financial statement restatements for banks versus control firms
Panel A Logistic estimation of restatements CONTROL SIC61 High RECTA BANK ndash1075 (0005) ndash1520 (0000) LogASSETS 0006 (0947) 0082 (0134) ROA 0155 (0934) ndash0815 (0242) LOSS 0271 (0451) 0359 (0167) LEVERAGE ndash0755 (0518) 0890 (0157) GOODWILL ndash13070 (0151) ndash5891 (0014) MampA 0569 (0095) 0527 (0036) FOREIGN ndash0678 (0295) ndash0817 (0026) MTB ndash0050 (0748) 0049 (0084) GOING_CONCERN ndash13976 (0992) ndash14082 (0979) INTERNAL_WEAKNESS (Y_CONTROL) ndash0218 (0768) 0017 (0972) BUSY_MONTH ndash0023 (0952) ndash0439 (0058) BIG4 1087 (0100) 0635 (0111) ISPEC ndash2067 (0399) ndash1643 (0258) Intercept ndash4288 (0000) ndash5118 (0000) Year fixed effects Yes Yes Observations 8585 11024 McFaddens R2 765 902 Panel B Incorporating bank size into the analyses SIC61 High RECTA Intercept ndash5023 (0000) ndash5551 (0000) B10_50 0512 (0550) ndash0022 (0962) B50_100 ndash0080 (0950) ndash0728 (0510) B100_500 0568 (0609) ndash0476 (0584) B500 ndash14268 (0984) ndash1148 (0223) BANK ndash0552 (0294) ndash1349 (0000) BANKB10_50 ndash2798 (0029) ndash2119 (0053) BANKB50_100 ndash13314 (0978) ndash13363 (0986) BANKB100_500 ndash0962 (0359) 0307 (0743) BANKB500 ndash0169 (1000) ndash13623 (0985) Control variables Yes Yes Year fixed effects Yes Yes Observations 8585 11024 McFaddens R2 1029 1035
The table reports the logistic estimation of the likelihood of a firm reporting a financial statement restatement The dependent variable ACC_RESTATEMENT = 1 if the firm subsequently restated its 10-K filing for the fiscal year and zero otherwise The main test variable BANK = 1 if the firm is on Bank Compustat and 0 otherwise We estimate the model on the combined BANK sample and one of two control samples of firms that are similar to banks but unregulated (1) The SIC61 control sample comprises non-depository credit institutions with two-digit standard industry classification (SIC) code 61 on Annual North American Compustat (2) the High RECTA control sample comprises non-banks with the top 5 of receivable to assets ratio on Annual North American Compustat The control variables are defined as follows LogASSETS = the natural logarithm of total assets ROA = net income divided by total assets LOSS = 1 if the firm reports negative net income and 0 otherwise LEVERAGE = total liabilities divided by total assets GOODWILL = goodwill divided by total assets MampA = 1 if the firmrsquos goodwill increases by more than $1 million and 0 otherwise FOREIGN = 1 if a firm reports non-zero foreign exchange income and 0 otherwise MTB = market value of equity divided by book value of equity GOING_CONCERN = 1 if a firm receives a going concern modified opinion and 0 otherwise INTERNAL_WEAKNESS= 1 if the firm disclosed internal control deficiencies and 0 otherwise BUSY_MONTH = 1 if the fiscal year-end is December and 0 otherwise BIG4 = 1 if the firm is audited by one of the Big-Four auditors and 0 otherwise ISPEC = auditorrsquos relative market share of audit fees in the clientrsquos FamandashFrench
48
48 industry classification Panel A reports the base model estimation Panel B reports the estimation of an expanded model which includes firm size indicators and their interactions with BANK The firm size indicators are denoted Bj_k=1 if total assets are between j and k $ billion for j=10 50 or 100 and for k=50 100 or 500 and are denoted B500=1 if total assets exceed $500 billion p-values are reported in parentheses
49
Table 4 Audit fees for banks versus control firms
Panel A OLS estimation of audit fees CONTROL SIC61 High RECTA BANK ndash0705 (0000) ndash0954 (0000) LogASSETS 0601 (0000) 0552 (0000) ROA ndash0754 (0003) ndash0768 (0000) LOSS 0178 (0000) 0196 (0000) SPECIAL_ITEMS 0488 (0003) 0072 (0652) DISCONTINUED 0286 (0000) 0228 (0000) LEVERAGE ndash1496 (0000) ndash0627 (0000) INVENTORY 0291 (0177) 0729 (0000) INTANGIBLES 2637 (0002) 2404 (0000) GOODWILL ndash2665 (0046) ndash0609 (0297) MampA 0081 (0000) 0092 (0000) NEG_EQUITY 0222 (0094) 0466 (0000) FIRM_AGE 0004 (0084) 0007 (0000) ACCEL_FILER ndash0004 (0902) 0029 (0307) INTERNAL_WEAKNESS 0254 (0000) 0260 (0000) MTB ndash0008 (0598) 0021 (0004) RETURN ndash0035 (0048) ndash0001 (0936) STD_RETURN 0802 (0000) 0780 (0000) GOING_CONCERN 0048 (0602) 0055 (0473) BUSY_MONTH 0106 (0014) 0038 (0286) BIG4 0322 (0000) 0327 (0000) ISPEC 0087 (0712) 0240 (0141) Year fixed effects Yes Yes Observations 8585 11024 Adjusted R2 90 24 88 54 Panel B Incorporating firm size into the analyses SIC61 High RECTA B10_50 ndash0215 (0268) 0013 (0935) B50_100 0283 (0074) 0283 (0010) B100_500 0215 (0488) 0219 (0284) B500 0482 (0004) 0519 (0000) BANK ndash0766 (0000) ndash0980 (0000) BANKB10_50 0213 (0283) 0033 (0842) BANKB50_100 ndash0138 (0466) ndash0045 (0772) BANKB100_500 0201 (0523) 0315 (0129) BANKB500 0701 (0000) 0852 (0000) Control variables Yes Yes Year fixed effects Yes Yes Observations 8585 11024 Adjusted R2 90 92 89 32
The table reports the OLS estimation of a model with dependent variable LogFEE = the natural logarithm of the sum of audit fees and audit-related fees The main test variable BANK = 1 if the firm is on Bank Compustat and 0 otherwise We estimate the model on the combined BANK sample and one of two control samples of firms that are similar to banks but unregulated (1) The SIC61 control sample comprises non-depository credit institutions with two-digit standard industry classification (SIC) code 61 on Annual North American Compustat (2) the High RECTA control sample comprises non-banks with the top 5 of receivable to assets ratio on Annual North American Compustat The control variables are defined as follows LogASSETS = the natural logarithm of total assets ROA = net income divided by total assets LOSS = 1 if the firm reports negative net income and 0 otherwise SPECIAL_ITEMS = special items divided by total assets DISCONTINUED = 1 if a firmrsquos discontinued operations exceeds $1 million and
50
0 otherwise LEVERAGE = total liabilities divided by total assets INVENTORY = inventory divided by total assets INTANGIBLES = intangible assets divided by total assets GOODWILL = goodwill divided by total assets MampA = 1 if the firmrsquos goodwill increases by more than $1 million and 0 otherwise NEG_EQUITY = 1 if common equity is negative and 0 otherwise FIRM_AGE = the number of years the firm is listed in Compustat ACCEL_FILER = 1 if the firm is an accelerated filer and 0 otherwise INTERNAL_WEAKNESS = 1 if the firm disclosed a material internal control deficiency and 0 otherwise MTB = market value of equity divided by book value of equity RETURN = fiscal year stock return STD_RETURN = standard deviation of monthly stock returns GOING_CONCERN = 1 if a firm receives a going concern modified opinion and 0 otherwise BUSY_MONTH = 1 if the fiscal year-end is December and 0 otherwise BIG4 = 1 if the firm is audited by one of the Big-Four auditors and 0 otherwise ISPEC = auditorrsquos relative market share of audit fees in the clientrsquos FamandashFrench 48 industry classification Panel A reports the base model estimation Panel B reports the estimation of an expanded model which includes firm size indicators and their interactions with BANK The firm size indicators are denoted Bj_k=1 if total assets are between j and k $ billion for j=10 50 or 100 and for k=50 100 or 500 and are denoted B500=1 if total assets exceed $500 billion Standard errors are clustered at the firm level (two-tailed p-values are in parentheses)
51
Table 5 Audit report lag for banks versus control firms
Panel A OLS estimation of audit report lag CONTROL SIC61 High RECTA BANK ndash0101 (0015) ndash0101 (0000) LogASSETS ndash0014 (0057) ndash0021 (0000) ROA ndash0275 (0022) 0058 (0243) LOSS 0113 (0000) 0144 (0000) DISCONTINUED 0029 (0416) 0035 (0148) EXTRA_ITEMS 0098 (0058) 0137 (0001) ABS_ACCRUALS ndash0021 (0356) 0064 (0061) LEVERAGE 0093 (0397) 0084 (0093) INVENTORY 0408 (0001) 0255 (0005) FOREIGN 0199 (0002) 0067 (0045) FIRM_AGE ndash0007 (0000) ndash0005 (0000) INTERNAL_WEAKNESS 0186 (0000) 0151 (0000) AUDITOR_TURNOVER 0045 (0004) 0050 (0000) GOING_CONCERN 0240 (0001) 0172 (0000) BUSY_MONTH ndash0021 (0411) ndash0021 (0286) BIG4 0111 (0000) 0083 (0000) Year fixed effects Yes Yes Observations 8289 10660 Adjusted R2 51 28 45 53 Panel B Incorporating firm size into the analyses SIC61 High RECTA B10_50 ndash0252 (0000) ndash0124 (0000) B50_100 ndash0190 (0074) ndash0090 (0126) B100_500 ndash0184 (0017) 0091 (0037) B500 0079 (0608) 0161 (0004) BANK ndash0174 (0000) ndash0141 (0000) BANKB10_50 0246 (0001) 0180 (0000) BANKB50_100 0238 (0061) 0229 (0001) BANKB100_500 0290 (0002) 0136 (0008) BANKB500 0101 (0546) 0202 (0001) Control variables Yes Yes Year fixed effects Yes Yes Observations 8289 10660 Adjusted R2 51 67 46 51
The table reports the OLS estimation of a model with dependent variable LogARL = the natural logarithm of the number of days between the fiscal year-end date and auditor signature date The main test variable BANK = 1 if the firm is on Bank Compustat and 0 otherwise We estimate the model on the combined BANK sample and one of two control samples of firms that are similar to banks but unregulated (1) The SIC61 control sample comprises non-depository credit institutions with two-digit standard industry classification (SIC) code 61 on Annual North American Compustat (2) the High RECTA control sample comprises non-banks with the top 5 of receivable to assets ratio on Annual North American Compustat The control variables are defined as follows LogASSETS = the natural logarithm of total assets ROA = net income divided by total assets LOSS = 1 if the firm reports negative net income and 0 otherwise DISCONTINUED = 1 if a firmrsquos discontinued operations exceeds $1 million and 0 otherwise EXTRA_ITEMS = 1 if a firmrsquos (absolute) extraordinary items exceeds $1 million and 0 otherwise ABS_ACCRUALS = absolute value of accruals divided by total assets LEVERAGE = total liabilities divided by total assets INVENTORY = inventory divided by total assets FOREIGN = 1 if a firm reports non-zero foreign exchange income and 0 otherwise FIRM_AGE = the number of years a firm is listed in Compustat INTERNAL_WEAKNESS = 1 if the firm disclosed a material internal control deficiency and 0 otherwise AUDITOR_TURNOVER = 1 if the firmrsquos auditor changed during the year and 0 otherwise GOING_CONCERN = 1 if a firm receives a going concern modified opinion and 0 otherwise
52
BUSY_MONTH = 1 if the fiscal year-end is December and 0 otherwise BIG4 = 1 if the firm is audited by one of the Big-Four auditors and 0 otherwise Panel A reports the base model estimation Panel B reports the estimation of an expanded model which includes firm size indicators and their interactions with BANK The firm size indicators are denoted Bj_k=1 if total assets are between j and k $ billion for j=10 50 or 100 and for k=50 100 or 500 and are denoted B500=1 if total assets exceed $500 billion Standard errors are clustered at the firm level (two-tailed p-values are in parentheses)
53
Table 6 Identification tests for audit fee model using proxies for times-series variation
in the intensity of banking regulation
Panel A Descriptive statistics N Mean Std Q1 Median Q3 BUDGET (in millions $) 15 2757 908 2008 2506 3584 RESTRICTIONS (number of words) 15 29936 9313 24771 25536 30053 Panel B OLS estimation of audit fees
intensity LogBUDGET model LogRESTRICTIONS model LogBUDGET ndash1640 (0000) LogRESTRICTIONS ndash0677 (0000) LogASSETS 0454 (0000) 0467 (0000) ROA ndash1735 (0008) ndash1227 (0083) LOSS 0046 (0008) 0048 (0008) SPECIAL_ITEMS 2113 (0020) 1043 (0281) DISCONTINUED 0057 (0024) 0078 (0003) LEVERAGE ndash0896 (0000) ndash0732 (0000) INVENTORY 0274 (0086) 0228 (0170) INTANGIBLES 1962 (0090) 1632 (0207) GOODWILL ndash0059 (0960) 1379 (0286) MampA 0036 (0000) 0055 (0000) NEG_EQUITY 0099 (0300) 0113 (0244) FIRM_AGE 0177 (0000) 0101 (0000) ACCEL_FILER ndash6728 (0000) ndash3901 (0000) INTERNAL_WEAKNESS 0230 (0000) 0220 (0000) MTB 0005 (0352) 0037 (0002) RETURN ndash0052 (0000) ndash0059 (0000) STD_RETURN 0131 (0040) ndash0209 (0008) GOING_CONCERN 0039 (0441) 0057 (0294) BUSY_MONTH 0043 (0438) 0063 (0273) BIG4 0109 (0002) 0111 (0002) ISPEC 0516 (0000) 0554 (0000) Year fixed effects No No Firm fixed effects Yes Yes Observations 7914 7914 Adjusted R2 9590 9569
Panel A reports descriptive statistics for two measures of bank regulation intensity BUDGET and RESTRICTIONS BUDGET is the annual budget in $ millions of the ldquofinance and bankingrdquo subcategory (which includes the Comptroller of the Currency Federal Deposit Insurance Corporation and Securities and Exchange Commission) from Regulatory Reports available at httpswcwustleduregulatory_reports RESTRICTIONS is based on RegData an industry- and year-specific regulation index constructed by Al-Ubaydli and McLaughlin (2017) from textual analysis of the number of constraints (the strings ldquoshallrdquo ldquomustrdquo ldquomay notrdquo ldquoprohibitedrdquo and ldquorequiredrdquo) in the Code of Federal Regulations (CFR) Title 12 for the banking industry each year Panel B reports the OLS estimation for the BANK sample only of an expansion of the audit fee model with dependent variable LogFEE = the natural logarithm of the sum of audit fees and audit-related fees reported in Table 4 The expanded model includes the natural logarithm of BUDGET or RESTRICTIONS The control variables are defined as follows LogASSETS = the natural logarithm of total assets ROA = net income divided by total assets LOSS = 1 if the firm reports negative net income and 0 otherwise SPECIAL_ITEMS = special items divided by total assets DISCONTINUED = 1 if a firmrsquos discontinued operations exceeds $1 million and 0 otherwise LEVERAGE = total liabilities divided by total assets INVENTORY = inventory divided by total assets INTANGIBLES = intangible assets divided by total assets GOODWILL = goodwill divided by total assets MampA = 1 if the firmrsquos goodwill increases by more than $1 million and 0 otherwise NEG_EQUITY = 1 if common equity is negative and 0 otherwise FIRM_AGE = the number of years a firm is listed in Compustat ACCEL_FILER = 1 if the firm is an accelerated filer and 0 otherwise INTERNAL_WEAKNESS = 1 if the firm disclosed a material internal control
54
deficiency and 0 otherwise MTB = market value of equity divided by book value of equity RETURN = fiscal year stock return STD_RETURN = standard deviation of monthly stock returns GOING_CONCERN = 1 if a firm receives a going concern modified opinion and 0 otherwise BUSY_MONTH = 1 if the fiscal year-end is December and 0 otherwise BIG4 = 1 if the firm is audited by one of the Big-Four auditors and 0 otherwise ISPEC = auditorrsquos relative market share of audit fees in the clientrsquos FamandashFrench 48 industry classification Standard errors are Whites corrected standard errors (two-tailed p-values are in parentheses)
55
Table 7 Identification tests for audit fee model using proxy for cross sectional variation
in the intensity of banking regulation
STATE BANKS ALL BANKS STATE_REG 0664 (0016) ndash0670 (0196) STATE_BANK ndash0088 (0158) STATE_REG x STATE_BANK 1346 (0023) LogASSETS 0537 (0000) 0567 (0000) ROA ndash3904 (0010) ndash4337 (0003) LOSS 0093 (0009) 0116 (0001) SPECIAL_ITEMS 3148 (0057) 3943 (0012) DISCONTINUED 0296 (0001) 0273 (0000) LEVERAGE ndash1964 (0000) ndash1976 (0000) INVENTORY 0780 (0000) 0986 (0000) INTANGIBLES 7261 (0000) 6960 (0000) GOODWILL ndash5674 (0000) ndash5593 (0000) MampA 0091 (0000) 0066 (0000) NEG_EQUITY 0164 (0184) 0027 (0879) FIRM_AGE 0007 (0002) 0008 (0000) ACCEL_FILER 0076 (0014) 0023 (0440) INTERNAL_WEAKNESS 0250 (0000) 0248 (0000) MTB 0005 (0708) ndash0004 (0764) RETURN ndash0047 (0013) ndash0021 (0243) STD_RETURN 0669 (0001) 0637 (0000) GOING_CONCERN ndash0081 (0318) 0017 (0855) BUSY_MONTH 0068 (0055) 0068 (0062) BIG4 0360 (0000) 0331 (0000) ISPEC 0035 (0889) 0003 (0989) Intercept 9320 (0000) 9274 (0000) Year fixed effects Yes Yes Observations 5679 7340 Adjusted R2 8741 8859
The table reports the OLS estimation for the BANK sample only of two expansions of the audit fee model with dependent variable LogFEE = the natural logarithm of the sum of audit fees and audit-related fees in $ millions reported in Table 4 The both expanded models include Agarwal Lucca Seru and Trebbirsquos (2014) measure of regulatory leniency (inverse intensity) across state-chartered banks (STATE_REG) and The measure is based on the ldquoalternating examination programrdquo in which state-chartered banks are examined by (more stringent) federal supervisors (the FDIC or Federal Reserve) and state supervisors on an alternating basis Using a proprietary database Agarwal et al (2014) estimate the differential examination stringency of federal supervisors versus 44 state bank supervisors The expanded reported in right column as includes an indicator for whether bank is a state-chartered bank (STATE_BANK) based on information obtained from the FDIC website (httpswww5fdicgovidaspadvSearchLandingasp) as well as the interaction of STATE_REG with STATE_BANK The control variables are defined as follows LogASSETS = the natural logarithm of total assets ROA = net income divided by total assets LOSS = 1 if the firm reports negative net income and 0 otherwise SPECIAL_ITEMS = special items divided by total assets DISCONTINUED = 1 if a firmrsquos discontinued operations exceeds $1 million and 0 otherwise LEVERAGE = the total liabilities divided by total assets INVENTORY = inventory divided by total assets INTANGIBLES = intangible assets divided by total assets GOODWILL = goodwill divided by total assets MampA = 1 if the firmrsquos goodwill increases by more than $1 million and 0 otherwise NEG_EQUITY = 1 if common equity is negative and 0 otherwise FIRM_AGE = the number of years a firm is listed in Compustat ACCEL_FILER = 1 if the firm is an accelerated filer and 0 otherwise INTERNAL_WEAKNESS = 1 if the firm disclosed a material internal control deficiency and 0 otherwise MTB = market value of equity divided by book value of equity RETURN = fiscal year stock return STD_RETURN = standard deviation of monthly stock returns GOING_CONCERN = 1 if a firm receives a going concern modified opinion and 0 otherwise BUSY_MONTH = 1 if the fiscal year-end is December and 0 otherwise
56
BIG4 = 1 if the firm is audited by one of the Big-Four auditors and 0 otherwise ISPEC = auditorrsquos relative market share of audit fees in the clientrsquos FamandashFrench 48 industry classification Panel A reports the base model estimation Panel B reports the estimation of an expanded model which includes the interactions of firm size with BANK The bank size indicators are denoted Bj_k=1 if total assets are between j and k $ billion for j=10 50 or 100 and for k=50 100 or 500 and are denoted B500=1 if total assets exceed $500 billion Standard errors are clustered at the firm level (two-tailed p-values are in parentheses)
57
Table 8 Likelihood of small earnings increases for banks versus control firms
CONTROL SIC61 High RECTA BANK 1483 (0000) 0897 (0000) LogASSETS ndash0052 (0026) ndash0030 (0168) LEVERAGE ndash1351 (0006) ndash0022 (0952) MTB 0040 (0192) 0001 (0965) ACCEL_FILER 0222 (0003) 0176 (0019) BIG4 ndash0062 (0401) ndash0062 (0399) Intercept ndash1467 (0000) ndash2164 (0000) Year fixed effects Yes Yes Observations 8585 8928 McFaddens R2 312 328
The table reports the logistic estimation of the likelihood that a firm reports a small earnings increase SMALL_POS = 1 if 000 lt ∆ROE le 001 where ROE = net income divided by the book value of common equity and 0 otherwise The main test variable BANK = 1 if the firm is a bank and 0 otherwise We estimate the model on the combined BANK sample and one of two control samples of firms that are similar to banks but unregulated (1) The SIC61 control sample comprises non-depository credit institutions with two-digit standard industry classification (SIC) code 61 on Annual North American Compustat (2) the High RECTA control sample comprises non-banks with the top 5 of receivable to assets ratio on Annual North American Compustat The control variables are defined as follows LogASSETS = the natural logarithm of total assets LEVERAGE = total liabilities divided by total assets MTB = market value of equity divided by book value of equity ACCEL_FILER = 1 if the firm is an accelerated filer and 0 otherwise BIG4 = 1 if the firm is audited by one of the Big-Four auditors and 0 otherwise p-values are reported in parentheses
58
Table 9 Length of string of consecutive earnings increases for banks versus control firms
CONTROL SIC61 High RECTA BANK 0383 (0008) 0663 (0000) LogASSETS ndash0128 (0000) ndash0171 (0000) LEVERAGE ndash0469 (0377) 0516 (0000) MTB ndash0275 (0000) ndash0062 (0000) GOODWILL 1023 (04260 ndash0726 (0070) ACCEL_FILER ndash0446 (0000) ndash0246 (0000) INTERNAL_WEAKNESS ndash0170 (0467) 0041 (0763) BIG4 0101 (0215) 0111 (0058) Intercept Year fixed effects Yes Yes Number of observations 1069 1778 McFaddens R2 417 390
The table reports proportional hazard model estimation of a model with dependent variable STRING = the duration of the longest string of consecutive annual earnings increases The main test variable BANK = 1 if the firm is a bank and 0 otherwise We estimate the model on the combined BANK sample and one of two control samples of firms that are similar to banks but unregulated (1) The SIC61 control sample comprises non-depository credit institutions with two-digit standard industry classification (SIC) code 61 on Annual North American Compustat (2) the High RECTA control sample comprises non-banks with the top 5 of receivable to assets ratio on Annual North American Compustat The control variables are defined as follows LogASSETS = the natural logarithm of total assets LEVERAGE = total liabilities divided by total assets MTB = market value of equity divided by book value of equity ACCEL_FILER = 1 if the firm is an accelerated filer and 0 otherwise BIG4 = 1 if the firm is audited by one of the Big-Four auditors and 0 otherwise p-values are reported in parentheses
59
Figure 1
Plot of time-series measures of the intensity of banking regulation from 2000-2014
LogRestrictions is based on RegData an industry- and year-specific regulation index constructed by Al-Ubaydli and
McLaughlin (2017) from textual analysis of the number of constraints (the strings ldquoshallrdquo ldquomustrdquo ldquomay notrdquo
ldquoprohibitedrdquo and ldquorequiredrdquo) in the Code of Federal Regulations (CFR) This measure is the natural logarithm of the
number of constraints in CFR Title 12 for the banking industry each year LogBudget is the natural logarithm of the
annual budget (in $ millions) of the ldquofinance and bankingrdquo subcategory (which includes the Comptroller of the
Currency Federal Deposit Insurance Corporation and Securities and Exchange Commission) from Regulatory
Reports available at httpswcwustleduregulatory_reports
94
96
98
10
102
104
106
108
11
7
72
74
76
78
8
82
84
86
2000 2001 2002 2003 2004 2005 2006 2007 2008 2009 2010 2011 2012 2013 2014
logBudget logRestrictions
7
average audit report lag is significantly shorter for banks than for control firms controlling for
other variables that prior research shows are associated with audit effort
The primary threat to inference in our study is the possibility that factors other than bank
regulation and supervision might explain why audits of banks pose less audit risk than do audits
of control firms Although we cannot rule out this possibility altogether we conduct two analyses
to provide support for bank regulation and supervision as causally explaining the reduced audit
effort in audits of banks that we document First motivated by prior research evidence that (less
stringent) bank supervisors (are more likely to) exercise accounting-related forbearance
(Gallemore 2016 Costello et al 2016) we test whether bank auditors expend less effort when
bank regulation and supervision are more intense We employ two time-series measures (a
numerical index of restrictions in the text of banking regulations and the natural logarithm of the
annual budget of federal regulators) and one cross-sectional measure (Agarwal et alrsquos 2014
estimate of the difference in the supervisory ratings received by state-chartered banks in alternating
examinations from their state supervisors versus from on-average more stringent federal
supervisors6) of the intensity of bank regulation and supervision We find that auditor effort in
audits of banks is lower when bank regulation and supervision are more intense
Second we examine two types of earnings management that we conjecture for reasons
discussed above are unlikely to concern bank regulators and supervisors and that are more likely
to occur as auditor effort decreases (1) the frequency of reporting small positive earnings changes
and (2) the length of strings of consecutive earnings increases We find that banks are more likely
than control firms to exhibit both of these types of earnings management
6 We thank Amit Seru for graciously providing us with this measure
8
To summarize we contribute to the banking and auditing literatures by providing
evidence consistent with auditors expending less effort in auditing banks than in auditing similar
unregulated firms due to the overlap of the activities of bank regulators and supervisors with
those of auditors We emphasize that our evidence does not suggest that the aggregate
monitoring of banksrsquo financial reporting by bank regulators supervisors and auditors differs
from the monitoring of similar firmsrsquo financial reporting by auditors alone it only suggests that
the monitoring conducted by bank auditors is less Because of the importance of banks to
stability and overall economic health a compelling question is what incremental costs arise when
bank auditors as financial reporting specialists expend less effort on bank audits due to the
existence of bank regulation and supervision We provide evidence that this reduced effort leads
to types of earnings management that likely have minor effects on banksrsquo solvency ratios but
have capital market consequences documented by prior research The types of earnings
management may lead to reduced market discipline over banks We expect these results to be of
interest to bank and auditing policymakers
In the remainder of the paper Section 2 develops the hypotheses Sections 3 and 4 describe
the empirical models and variables and the data sources and sample selection respectively
Sections 5 present the empirical results and Section 6 concludes
2 Background and Hypothesis Development
21 Banking Background7
7 Much of the discussion in this section is drawn from Board of Governors of the Federal Reserve System
(2017) To avoid clutter we only cite material from this document that is not widely available from other
sources
9
211 Bank Regulation and Regulators
In the United States banks are subject to a complex set of laws and regulations that restrict
their allowed activities specify minimum capital and liquidity levels and govern other matters
These laws and regulations exhibit cycles in stringency over time (Ryan 2007) For example
during the regulatory period from the Great Depression to the 1970s the Banking Act of 1933
prohibited bank holding companies from owning or being owned by nonfinancial companies and
from underwriting most securities During the deregulatory period in the early to mid-1980s the
Depository Institutions and Monetary Control Act of 1980 phased out interest rate ceilings and
allowed thrift institutions to expand their activities significantly During the regulatory period in
the late 1980s and early 1990s FDICIA required regulators to take prompt corrective action when
banksrsquo leverage capital ratios fall below the levels deemed well-capitalized FDICIA also includes
various requirements regarding banksrsquo financial reporting auditing and internal control discussed
in the introduction
During the deregulatory period in the late 1990s the Gramm-Leach-Bliley Act of 1999
allowed subsidiaries of regulated banks to underwrite securities and financial holding companies
to perform essentially all types of financial services somewhere within their corporate structures
During the post-financial-crisis regulatory period the Dodd-Frank Wall Street Reform and
Consumer Protection Act of 2010 imposed many prudential regulations on large bank holding
companies including increased risk-based capital and liquidity requirements credit exposure
concentration limits and reporting requirements periodic stress tests requirements to plan for
rapid and orderly resolution of the institution in the event of financial distress or failure
requirements to establish risk committees and enhanced public disclosure requirements Efforts
10
to roll back Dodd-Frank and other bank regulations are currently underway in Congress
(Richardson et al 2017)
FDICIArsquos requirement that a bankrsquos management assess and certify the effectiveness of
the bankrsquos internal controls is of particular relevance to this study Control risk is a key component
of audit risk Particularly prior to the effective dates of Sections 302 and 404 of SOX FDICIArsquos
requirements should reduce the internal control risk of banks relative to that of non-banks
(Altamuro and Beatty 2010) Moreover we expect bank supervisors to require banks with
identified internal control deficiencies to remediate those deficiencies promptly further reducing
banksrsquo control risk
Even the most stringent banking laws and regulations can have the intended effects only if
bank regulators and supervisors adequately enforce banksrsquo adherence to these rules Under the
ldquodual banking systemrdquo individual banks may be nationally or state chartered and bank regulation
and supervision is conducted by overlapping sets of federal regulators and state banking
departments National banks are primarily supervised by the Office of the Comptroller of the
Currency (ldquoOCCrdquo) a federal regulator State banks that elect to become members of the Federal
Reserve System (state member banks) are primarily supervised by the Federal Reserve a federal
regulator and their state banking departments State banks that are not members of the Federal
Reserve System (state nonmember banks) are primarily supervised by the FDIC a federal
regulator and their state banking departments All banks accepting insured deposits are also
supervised by the FDIC8
8 Recognizing that the dual banking system and multiple federal bank regulators could lead to
inconsistencies in bank regulation and supervision in 1978 Congress created the Federal Financial
Institutions Examination Council (ldquoFFIECrdquo) an interagency body to promote consistency in these
activities The FFIEC currently is composed of the chairs of the FDIC and the National Credit Union
Administration the Comptroller of the Currency a governor of the Federal Reserve a state banking
11
Individual banks may be owned by bank holding companies which may apply and qualify
to be financial holding companies Bank holding companies typically engage in lending deposit
acceptance and any other allowed activities through their individual bank subsidiaries Financial
holding companies may engage in activities not allowed in individual banks such as insurance
underwriting and merchant banking through non-bank subsidiaries (Ryan 2007 Avraham et al
2012) The Federal Reserve has supervisory authority over all bank holding companies regardless
of how their subsidiary banks are chartered and supervised
212 Bank Supervision
Bank supervision involves the periodic on-site examination and ongoing off-site
monitoring of banksrsquo financial condition and risks the adequacy of banksrsquo accounting internal
control and risk management systems and banksrsquo compliance with applicable laws and
regulations The main goal of supervision is to ensure the safety and soundness of individual banks
and especially of the banking system
Bank supervision shares many similarities with (bank) auditing For example much like
auditorsrsquo risk-based approach to auditing the Federal Reserve indicates that it employs a risk-
focused approach to supervision (Board of Governors of the Federal Reserve System 2017) Under
this approach the Federal Reserve first identifies the primary risks faced by a bank The Federal
Reserve then assesses the bankrsquos ability to measure monitor and control those risks given its (1)
board and senior management oversight (2) policies procedures and risk limits (3) risk
monitoring and management information systems and (4) internal controls
director and the director of the Consumer Financial Protection Bureau The FFIEC has developed uniform
examination principles and standards as well as uniform regulatory reporting forms and systems for
federally supervised banks
12
On-site examinations of individual banks and bank holding companies generally occur
every 12 to 18 months depending on the organizationrsquos size supervisory rating and extent of non-
banking assets as well as supervisory resource constraints For state banks the primary federal
supervisor coordinates its on-site examinations with the state supervisor with the two supervisors
generally conducting examinations in rotation under the ldquoalternating examination programrdquo
(Agarwal et al 2014) The results of an examination which include a confidential supervisory
rating of the bankrsquos overall condition are reported to the bankrsquos board of directors and
management The supervisory rating system is referred to as CAMELS an acroynm for its six
components (1) capital adequacy (2) asset quality (3) management and administration (4)
earnings (5) liquidity and (6) sensitivity to market risk The overall and component CAMELS
ratings efficiently communicate supervisorsrsquo overall assessments of banks as well as any specific
issues that raise concern or require attention
Between examinations bank supervisors use many sources of financial and other
information most importantly banksrsquo quarterly regulatory reports to monitor banks The primary
report for individual banks is the Consolidated Reports of Condition and Income (ldquoCall Reportsrdquo)
These reports provide the raw data for the Uniform Bank Performance Report which presents
ratios that can be compared across banks and time to detect unusual levels of or significant changes
in a banks financial condition The primary report for bank holding companies is the Consolidated
Financial Statements for Bank Holding Companies (FR Y-9C) The Federal Reserve indicates it
uses an automated system to estimate an organizationrsquos CAMELS rating based on its prior
examination results and subsequent quarterly Call Report or FR Y-9C filings (Board of Governors
of the Federal Reserve System 2017)
13
If a supervisor determines that a bank or bank holding company has problems that affect
its safety and soundness the supervisor may take a variety of formal or informal actions to ensure
that the organizationrsquos management and directors undertake measures to address the problems
(Keeley 2017) For example the supervisor may enter into a written agreement with issue a cease-
and-desist order or prompt-corrective-action directive to or levy a fine against the organization
22 Bank Complexity and Opacity
Although a debate exists as to whether stability is enhanced by bank transparency or bank
opacity the traditional and still dominant view is that transparency enhances stability (Morgan
2002 Nier and Baumann 2006 Acharya and Ryan 2016)9 Prior theoretical and empirical research
provides numerous bases for this view For example banksrsquo effectiveness as monitors provides
them with comparative advantages in lending to information-sensitive borrowers (Diamond 1984)
Banksrsquo high leverage multiplies their risk and exacerbates various agency problems such as asset
substitution (Jensen and Meckling 1976) and underinvestment when the benefits of investment
primarily accrue to debtholders (Myers 1977) Such agency problems are exacerbated further by
information asymmetries between banks and their debt and equity claimants as well as among
these claimants (Beatty and Liao 2014 Acharya and Ryan 2016)
Despite the perceived benefits of bank transparency banks are often viewed as opaque due
to their complex and interrelated on- and off-balance sheet exposures The individual and
collective values and risk of these exposures are inherently difficult for banks to convey to
outsiders and for outsiders to evaluate This difficulty likely enhances banksrsquo ability to manage or
obscure their accounting numbers
9 See Dang et al (2014) Holmstroumlm (2015) and Acharya and Ryan (2016) for discussion of the opposing
view that bank opacity enhances stability
14
Prior empirical research provides evidence that banks are more opaque than non-banks and
about the determinants of banksrsquo opacity Morgan (2002) shows that banks receive more split
credit ratings (ie different bond ratings from different rating agencies) than do non-banks a result
he attributes to banksrsquo greater opacity He further shows that banksrsquo opacity varies with their asset
composition increasing with their proportions of loans and trading assets Flannery et al (2013)
provide evidence that bank opacity increases during periods of financial system stress when the
valuations of financial assets become harder to determine and more strongly correlated
We expect that the difference in opacity between banks and non-banks has widened over
time as banks have shifted their activities from relatively understandable deposit-acceptance and
lending activities ie traditional financial intermediation to less easily understandable
nontraditional activities such as derivatives trading securitization and the provision of various
forms of contingent financing Banksrsquo economic exposures resulting from these activities often
exhibit concentrated or correlated risks or state-contingent liquidity requirements and these
exposures often are partly or wholly off-balance sheet (Barth et al 2009 Acharya 2014 Acharya
and Ryan 2016)10
Banksrsquo increasing economic complexity has been accompanied by increasing length and
complexity of their financial reports Accounting standard setters have written many complex and
lengthy standards for financial instruments and transactions to try to adequately portray their
10 In large part reflecting the income generated by these nontraditional activities the average bankrsquos
noninterest revenues as a percentage of net operating revenues increased from below 20 in the 1970s to
around 50 by 2009 (Barth et al 2009) A portion of this increase is attributable to generally declining
interest rates from 1981 to 2009 however
15
economics11 Despite banksrsquo provision of far more extensive financial report information in
compliance with the requirements of these standards (Guay et al 2016) we expect the individual
and collective values and risk of banksrsquo exposures to have become more difficult for banks to
convey to outsiders and for outsiders to evaluate
23 Hypotheses and Empirical Proxies
231 Engagement and Audit Risks
Auditorsrsquo decisions whether to bid for potential engagements the prices at which to bid
and the effort needed to provide the desired level of assurance depend on the risks the engagements
pose for them (Bedard and Johnstone 2004) Overall engagement risk has three interrelated
components (1) clientsrsquo business risk ie the possibility that clientsrsquo financial condition
deteriorates in the limit leading to firm failure (2) auditorsrsquo business risk ie the possibility of
litigation or reputational costs to auditors from their associations with clients and (3) audit risk
ie the possibility that auditors fail to detect material misstatements in financial statements due to
error or fraud In our investigation of whether bank regulation and supervision displace auditing
we focus on audit risk because it is the component of engagement risk that is most directly reduced
by audit effort
In the standard (textbook) model audit risk has three by construction distinct components
(1) inherent risk ie the likelihood that material misstatements of clientsrsquo financial statements
exist prior to the operation of their internal control systems (2) control risk ie the likelihood that
clientsrsquo internal control systems fail to prevent material misstatements and (3) detection risk ie
11 Notable examples of these standards include FAS 133 (1998) and FAS 161 (2009) for derivatives
(Accounting Standard Codification Section 815) and FAS 140 (2000) FIN 46(R) (2003) FAS 166 (2009)
and FAS 167 (2009) for securitizations (Accounting Standards Codification Sections 860 and 810)
16
the likelihood the auditor fails to detect material misstatements not prevented by clientsrsquo internal
control systems We expect bank regulation and supervision to reduce the inherent risk and control
risk components of audit risk and thus to reduce the incentive for auditors to expend effort on
audits of banks
232 Frequency of Internal Control and Accounting Problems
Bank supervisors monitor banksrsquo internal control and accounting systems through periodic
on-site examinations and ongoing off-site monitoring We expect this scrutiny to reduce the
inherent risk and control risk components of audit risk for audits of banks relative to audits of
control firms We formally state this hypothesis in the alternative as
Hypothesis 1 Banks exhibit fewer internal control and accounting problems than do
control firms
233 Audit Effort
It is theoretically unclear whether auditors should expend more or less effort on audits of
banks than on audits of control firms A primary reason why auditors would work more on audits
of banks is that banksrsquo greater complexity and opacity lead to their investors and contracting parties
more strongly benefiting from higher quality audits that increase the informativeness and
reliability of banksrsquo financial statements Due to this audit-demand effect higher quality audits
more strongly reduce the need for firmsrsquo investors and contracting parties to protect themselves
against uninformative or unreliable financial statement numbers by reducing the prices they are
willing to pay for firmsrsquo securities and by requiring contractual protections such as collateral
respectively To satisfy the demand for higher audit quality for audits of banks than for audits of
control firms auditors of banks must expend more effort by increasing the number of billed hours
17
andor by devoting more experienced andor specialized staff to engagements increasing the
average billed hourly fee
A primary reason why auditors would work less on audits of banks than on audits of control
firms is the overlap of the activities of bank regulators and supervisors particularly supervisorsrsquo
periodic examination and ongoing monitoring of banks with the activities of bank auditors Due
to this substitution effect auditors of banks need to perform less extensive audit planning and
substantive testing than do auditors of control firms to provide any given level of assurance We
expect the substitution effect to be more likely to dominate the audit-demand effect when bank
regulation and supervision are more intense for example when regulators and supervisors use
more sophisticated or sensitive approaches such as the Federal Reserversquos risk-focused approach
(Board of Governors of the Federal Reserve System 2017)
Although the two effects yield opposing predictions we expect that the substitution effect
generally dominates the audit demand effect because of substantial extent of the overlap of the
activities of bank regulators and particularly supervisors with those of auditors Relatedly many
aspects of bank regulation and supervision reduce the inherent and control risk components of
audit risk For example when bank supervisors determine that banks exhibit inadequate solvency
or other problems they convey the banksrsquo deficient CAMELS ratings to the banksrsquo management
and boards of directors who are responsible for resolving these problems This expectation yields
our second hypothesis stated in the alternative
Hypothesis 2 Auditors exert lower effort on audits of banks than on audits of control
firms
3 Empirical Models and Variables
31 Frequencies of Internal Control and Accounting Problems
18
We employ two dependent variables in our tests of Hypothesis 1 First we proxy for
problems in banksrsquo internal control using an indicator for material weaknesses in internal control
(Ashbaugh et al 2007) Naturally we can only observe such weaknesses if firms identify and
disclose them as FDICIA requires for banks and Sections 302 and 404 of SOX require for all
firms INTERNAL_WEAKNESS denotes firm-years with disclosed material internal control
weaknesses Second we proxy for problems in banksrsquo accounting using an indicator for financial
statement restatements which arise from GAAP violations and thus suggest audit failures
(Palmrose and Scholz 2004 Kinney et al 2004 Hennes et al 2014)12 ACC_RESTATEMENT
denotes firm-years with restatements of financial statements13 We denote
INTERNAL_WEAKNESS and ACC_RESTATEMENT collectively by Y
The main test variable in our tests of Hypothesis 1 is an indicator for banks denoted BANK
As discussed below we control for numerous client and auditor characteristics that prior research
finds are associated with internal control and accounting problems In addition when the
dependent variable Y is INTERNAL_WEAKNESS (ACC_RESTATEMENT) we control for
ACC_RESTATEMENT (INTERNAL_WEAKNESS) We denote the Y variable that is controlled for
in a given model by Y_CONTROL
12 In untabulated analysis we also proxy for both internal control and accounting problems using auditor
resignations (Krishnan and Krishnan 1997 Shu 2000 Hennes et al 2014) If banks exhibit fewer internal
control and accounting problems than do control firms bank auditors have fewer reasons to resign from
audit engagements However compared to the proxies for these problems in the tabulated analyses auditor
resignations are more likely to capture the components of engagement risk other than audit risk For
example prior research shows that auditors are more likely to resign when clients exhibit greater financial
distress (Schwartz and Soo 1995) more corporate governance problems (Lee et al 2004) and greater
litigation risk (Krishnan and Krishnan 1997 Simunic and Stein 1996)
13 All indicator variables in the paper take a value of one when a firm or firm-year exhibits the specified
condition and zero otherwise
19
Based on prior empirical research examining internal control weaknesses (Altamuro and
Beatty 2010)14 and financial statement restatements (Palmrose and Scholz 2004 Kinney et al
2004 Hennes et al 2008) we use the following logistic model to explain the probability that Y
equals one denoted Prob(Y = 1) in terms of BANK and control variables (collectively denoted
X)15
Prob(Y = 1) = eXβ (1 + eXβ) where
Xβ = β0 + β1BANK + β2LogASSETS + β3ROA + β4LOSS + β5LEVERAGE
+ β6GOODWILL + β7MampA + β8FOREIGN + β9MTB (1)
+ β10GOING_CONCERN + β11Y_CONTROL + β12BUSY_MONTH
+ β13BIG4 + β14ISPEC + year fixed effects
Because Prob(Y = 1) is not directly observable we estimate equation (1) with Y as the dependent
variable Hypothesis 1 predicts that the coefficient β1 on BANK is negative
Equation (1) controls for numerous client characteristics We selected these characteristics
based on prior research findings that firms that have less resources to invest in internal control
systems have undergone major organizational changes and are more complex or otherwise stress
auditorsrsquo capabilities exhibit more frequent internal control and accounting problems (eg Ge and
McVay 2005 Ashbaugh-Skaife et al 2007 Doyle et al 2007ab)
We control for the resources that clients have available to establish effective internal
control systems using the natural logarithm of total assets (LogASSETS) net income divided by
total assets (ROA) an indicator variable for negative net income (LOSS) and the ratio of total
14Altamuro and Beatty (2010) show how FDICIArsquos (1991) internal control requirements affected insured
depository institutions with assets of $500 million or above They do not compare the internal control
quality of banks and non-banks
15 Throughout the paper we omit firm and year subscripts for brevity
20
liabilities to total assets (LEVERAGE) We control for clientsrsquo organizational changes associated
with business acquisitions using the ratio of goodwill to total assets (GOODWILL) and an indicator
variable that equals one when goodwill increases by more than $1 million (MampA) We control for
other determinants of audit complexity using the proportion of foreign sales for control firms and
the proportion of foreign commercial loans for banks (FOREIGN) the ratio of market value of
equity to book value of equity (MTB) an indicator variable for the auditor rendering a going-
concern opinion (GOING_CONCERN) and Y_CONTROL
We control for three auditor characteristics an indicator for December fiscal year end
(BUSY_MONTH) an indicator variable for Big-Four auditor (BIG4) and the auditorrsquos market
share in the industry (ISPEC) Lastly we include fixed year effects to capture unobserved time-
related factors for both clients and auditors
Because the effects of client size may be nonlinear in tabulated specification analyses we
include indicator variables for client total assets in the following categories up to $10 billion (this
indicator is omitted as one must be) from above $10 to $50 billion (B10_50) from above $50 to
$100 billion (B50_100) from above $100 to $500 billion (B100_500) and above $500 billion
(B500) Moreover because the effects of size may vary for banks versus control firms we also
include the interactions of these size indicators with BANK
32 Audit Effort
We test Hypothesis 2 using two dependent variables that prior research indicates proxy for
auditor effort audit fees (Simunic and Stein 1996) and audit report lag (Ashton et al 1987 Bamber
et al 1993 and Ghosh and Tang 2015) Audit fees equal the number of hours worked times the
average fee per hour worked LogFEE denotes the natural logarithm of the sum of audit and audit-
related fees Auditors working more hours is positively associated with audit report lags (Bronson
21
et al 2011) LogREPORT_LAG denotes the natural logarithm of one plus the number of days
between the fiscal year end and the audit report signature date
Based on prior models for audit fees (Simunic 1980 Ghosh and Tang 2015) we use the
following model to explain LogFEE
LogFEE = β0 + β1BANK + β2LogASSETS + β3ROA + β4LOSS + β5SPECIAL_ITEMS
+ β6DISCONTINUED + β7LEVERAGE + β8INVENTORY + β9INTANGIBLES
+ β10GOODWILL + β11MampA + β12NEG_EQUITY + β13FIRM_AGE (2)
+ β14ACCEL_FILER + β15INTERNAL_WEAKNESS + β16MTB + β17RETURN
+ β18STD_RETURN + β19GOING_CONCERN + β20BUSY_MONTH
+ β21BIG4 + β22ISPEC + year fixed effects
Based on prior models for audit report lag (Ashton et al 1987 Bamber et al 1993 Bronson et al
2011 Ghosh and Tang 2015) we use the following model to explain LogREPORT_LAG
LogREPORT_LAG = β0 + β1BANK + β2LogASSETS + β3ROA + β4LOSS
+ β5DISCONTINUED + β6EXTRA_ITEMS + β7ABS_ACCRUALS
+ β8LEVERAGE + β9INVENTORY + β10FOREIGN + β11FIRM_AGE (3)
+ β12 INTERNAL_WEAKNESS + β13AUDITOR_TURNOVER
+ β14GOING_CONCERN + β15BUSY_MONTH + β16BIG4
+ year fixed effects
As in equation (1) the main test variable in equations (2) and (3) is BANK Hypothesis 2 predicts
that the coefficient β1 on BANK is negative in both equations
Equations (2) and (3) control for numerous client and auditor characteristics that prior
research finds are associated with audit fees or audit report lag respectively Many of the control
variables included in Equations (2) and (3) also appear in Equation (1) and are defined above
Equation (2) andor equation (3) include the following additional client characteristics16 Special
16 The sets of control variables in equations (2) and (3) are not identical consistent with the models
estimated in prior research
22
items divided by total assets (SPECIAL_ITEMS) an indicator for absolute value of discontinued
operations above $1 million (DISCONTINUED) and an indicator for absolute value of
extraordinary items above $1 million (EXTRA_ITEMS) capture transitory earnings items The
absolute value of accruals divided by total assets (ABS_ACCRUALS) captures other dimensions of
earnings quality The ratio of inventory to total assets (INVENTORY) and the ratio of intangible
assets to total assets (INTANGIBLES) capture balance sheet composition An indicator for negative
common equity (NEG_EQUITY) and the number of years the firm is listed on Compustat
(FIRM_AGE) capture early-stage or otherwise risky firms An indicator for accelerated filer
(ACCEL_FILER) and an indicator for auditor turnover during the year (AUDITOR_TURNOVER)
capture other auditing stresses Fiscal year stock return (RETURN) and the standard deviation of
monthly stock returns (STD_RETURN) capture the aggregate level and the volatility respectively
of exogenous shocks occuring during the fiscal year
As for equation (1) in tabulated specification analyses we include indicator variables for
client total assets in the various size categories and we also include the interactions of these size
indicators with BANK
33 Earnings Management of Minor Concern to Bank Regulators and Supervisors
As discussed in the introduction we expect bank regulators and supervisors to be relatively
unconcerned about types of earnings management that accumulate to relatively small amounts of
retained earnings Such earnings management has minor effects on banksrsquo solvency ratios and so
should not appreciably affect supervisorsrsquo evaluations of banksrsquo safety and soundness We expect
that if bank regulation and supervision leads to lower audit effort in audits of banks than in audits
of control firms as predicted in Hypothesis 2 banks engage more in these types of earnings
23
management than do control firms Motivated by Burgstahler and Dichev (1997) Beatty et al
(2002) and Graham et al (2005) we examine two proxies for such earnings management
First we examine the frequency of small (from 0 to 001) increases in return on equity
(SMALL_POS)17 Based on Beatty et al (2002) we use the following logistic model to explain
SMALL_POS
Prob(SMALL_POS= 1) = eXβ (1 + eXβ) where
Xβ = β0 + β1BANK + β2LogASSETS + β3LEVERAGE + β4MTB (4)
+ β5ACCEL_FILER + β6BIG4 + year fixed effects
We expect the coefficient β1 on BANK to be positive
Second we examine the length of the longest string of consecutive earnings increases for
each firm (STRING) Based on Beatty et al (2002) we use the following Cox proportional hazard
model to explain STRING
h(STRING|X)= h0(STRING) eXβ where
Xβ= β0 + β1BANK + β2LogASSETS + β3LEVERAGE +β4MTB + β5ACCEL_FILER (5)
+ β6INTERNAL_WEAKNESS + β7BIG4 + year fixed effects
h(STRING|X) denotes the hazard function and h0(STRING) denotes the baseline hazard function
We expect the coefficient β1 on BANK to be positive
17 Specifically we compute return on equity (ROE) as net income divided by common equity SMALL_POS takes a
value of one if the change in ROE is greater than zero but smaller than or equal to 001 and zero otherwise
24
4 Data and Sample Selection
41 Data
We obtain audit fee audit report signature date auditor change internal control weakness
and restatement data from Audit Analytics We obtain financial statement data from Compustatrsquos
annual Bank and North American files We obtain geographic and foreign segment data from
Compustatrsquos Segment file If a given firm-year is available in Compustatrsquos Bank file we classify
the firm-year observation as a bank
Our sample covers the fifteen-year period from 2000 to 2014 The sample period begins in
2000 because audit fees are unavailable prior to that year Because SOX-mandated internal control
weakness data become available in 2004 our analysis of internal control weaknesses is limited to
the eleven-year period from 2004 to 2014 We restrict the sample to firm-year observations with
complete data on audit fees auditor identification and audit report signature date from Audit
Analytics as well as on total assets (item AT) total liabilities (item LT) total common equity (item
CEQ) net income (item NI) closing price (item PRCC) and common shares outstanding (item
CSHO) from Compustat These data requirements yield 7914 bank-year observations (965 unique
banks) 671 firm-year observations in SIC 61 (104 unique firms) and 3111 firm-year observations
in the top five percent of the ratio of accounts receivable to total assets (812 unique firms) from
2000ndash2014 The internal control weakness sample includes 5581 bank-year observations 483
firm-year observations for the SIC 61 control sample and 2254 firm-year observations for the top
five percent of the ratio of accounts receivable to total assets control sample from 2004ndash2014
42 Descriptive Statistics
Table 1 reports means for each of the dependent variables (above the line) and each of the
independent variables (below the line) in equations (1)-(5) for the bank sample SIC 61 control
25
sample and highest 5 ratio of accounts receivable to assets control sample Significant
differences of the means for the bank sample versus the SIC 61 control sample and for the bank
sample versus the highest 5 ratio of accounts receivable to assets control sample are indicated in
the columns for the control samples
The differences of the means for the dependent variables are uniformly significant and
consistent with our hypotheses that banks exhibit fewer internal control and accounting problems
than do control sample firms as well as our expectations that banks engage in more of certain types
of earnings management than do control sample firms Consistent with Hypothesis 1 banks are
less likely than both control samples to disclose material internal control weaknesses
(INTERNAL_WEAKNESS) and to restate their financial statements (ACC_RESTATEMENT)
Consistent with Hypothesis 2 on average audit fees (FEE) are lower and audit report lags
(REPORT_LAG) are shorter for banks than for both control samples Consistent with our
expectations for earnings management banks are more likely to report small positive earnings
changes (SMALL_POS) and on overage report longer strings of positive earnings (STRING)
Most of the differences of the means for the independent variables are also significant For
most of these variables the means for banks are closer to those of the a priori more analogous SIC
61 control sample than to those of the highest 5 ratio of accounts receivable to assets control
sample Accordingly we discuss only the former mean differences Compared to the SIC 61
control sample on average banks are smaller (ASSETS) are more profitable (ROA) and have
fewer losses (LOSS) have fewer transitory earnings items (SPECIAL_ITEMS DISCONTINUED
and EXTRA_ITEMS) and lower absolute accruals (ABS_ACCRUALS) have higher financial
leverage (LEVERAGE) have lower non-financial assets (INVENTORY INTANGIBLES and
GOODWILL) despite engaging in more mergers and acquisitions (MampA) are less likely to have
26
negative equity (NEG_EQUITY) or foreign operations (FOREIGN) have insignificantly different
age (AGE) have lower expected growth (MTB) experience lower exogenous shocks (RETURN
and STD_RETURN) and receive fewer going-concern opinions (GOING_CONCERN)
Compared to the SIC 61 control sample on average banks exhibit one characteristic that
stress auditorsrsquo capabilities more frequent December fiscal year-ends (BUSY_MONTH)
However on average banks are less likely to be accelerated filers (ACCEL_FILER) are less likely
to be audited by a Big 4 auditor (BIG4) are less likely to have auditors with high relative industry
market share (ISPEC) and experience less auditor turnover (AUDITOR_TURNOVER)
5 Empirical Results
51 Frequencies of Internal Control and Accounting Problems
Hypothesis 1 predicts that due to bank regulation and supervision banks exhibit fewer
internal control and accounting problems than do similar unregulated firms To test this hypothesis
Tables 2 and 3 report logistic estimations of equation (1) with the dependent variables
INTERNAL_WEAKNESS and ACC_RESTATEMENT respectively18 We report the estimation of
each model for the combined bank sample and SIC 61 control sample in the left column of the
table and for the combined bank sample and highest 5 ratio of accounts receivable to assets
control sample in the right column of the table
We estimate each model in two different ways Panel A of each table reports the estimation
of the base model To better control for size differences between the bank and control samples
Panel B of each table reports estimations of the equations replacing LogASSETS with the client
18 In untabulated analyses we also examine adverse restatements that reduce ownersrsquo equity and auditor
resignations We find results consistent with those reported in the paper
27
size category indicators (B10_50 B50_100 B100_500 and B500) both separately and interacted
with BANK The coefficient on BANK captures the total effect for the smallest banks (assets less
than $10 billion) The coefficient on the interaction of BANK with a given size category indicator
captures the effect for the banks in that size category incremental to the effect for the smallest
banks The sum of the coefficients on BANK and on the interaction of BANK with a given size
category indicator captures the total effect for the banks in that size category
The model fits and the coefficients on the control variables generally are as expected based
on prior research For simplicity we primarily discuss the statistical and economic significance of
the coefficient β1 on BANK estimated on the combination of the bank sample and the more
analogous SIC 61 control sample reported in the left column of Panel A of the tables We point
out any notable differences of the results for the other models All of these differences pertain to
the coefficients on BANK and the interactions of BANK with the size category indicators in Panel
B which typically indicate that the effects we document are limited to certain size categories In
particular no notable differences arise from the use of different control samples in the estimations
reported in the left and right columns of the tables In discussing economic significance we focus
on eβ1 the differential frequency of internal control and accounting problems for banks versus non-
banks
Examining the estimation of equation (1) with dependent variable
INTERNAL_WEAKNESS reported in the left column of Panel A of Table 2 we find that the
coefficient on BANK is negative (-0781) and significant at the 1 level This coefficient implies
that banks disclose material internal control weaknesses with only 46 of the frequency of SIC
control sample firms controlling for other factors that prior research finds are associated with
28
internal control weaknesses These results are consistent with Hypothesis 1 that bank regulation
and supervision reduce the frequency of banksrsquo internal control problems
In left column of Panel B of Table 2 the coefficient on BANK is negative as expected but
insignificant Notice however that the coefficients on the interactions of BANK with all of the
size category indicators are also negative with these coefficients being significant at the 1 and
10 levels for the interactions of BANK with B10_50 and B50_100 respectively The sum of the
coefficients on BANK and BANKtimesB10_50 is significantly negative at the 1 level and the sum of
the coefficients on BANK and BANKtimesB50_100 is significantly negative at the 10 level These
results imply that banks with assets from $10 billion to $100 billion disclose significantly fewer
internal control weaknesses than do similarly sized control firms consistent with Hypothesis 1
whereas banks in other size categories disclose internal control weaknesses with insignificantly
different frequency
Examining the estimation of equation (1) with dependent variable ACC_RESTATEMENT
reported in the left column of Panel A of Table 3 we find that the coefficient on BANK is negative
(-1075) and significant at the 1 level This coefficient implies that banks report financial
statement restatements with only 34 of the frequency of SIC 61 control sample firms controlling
for other factors that prior research finds are associated with restatements These results are
consistent with Hypothesis 1 that bank regulation and supervision reduce the frequency of banksrsquo
accounting problems
In the left column of Panel B of Table 3 the coefficient on BANK is negative as expected
but insignificant Again notice however that the coefficients on the interactions of BANK with all
of the size category indicators are also negative with the coefficient on the interaction of BANK
with B10_50 significant at the 5 level The sum of the coefficients on BANK and its interaction
29
with B10_50 is significantly negative at the 1 level and the sum of the coefficients on BANK and
its interaction with B100_500 is significantly negative at the 10 level These results imply that
banks with assets from $10 billion to $50 billion and from $100 billion to $500 billion report
significantly fewer accounting restatements than similarly sized control firms consistent with
Hypothesis 1 whereas banks in other size categories report accounting restatements with
insignificantly different frequency
Collectively the results reported in Tables 2 and 3 for disclosed material internal control
weaknesses and accounting restatements are consistent with bank regulation and supervision
rendering engagements for audits banks less risky than for audits of control sample firms for some
size categories and insignificantly differently risky for other size categories
52 Audit Effort
Hypothesis 2 predicts that bank regulation and supervision lead bank auditors to expend
less effort We proxy for (lower) audit effort using (lower) audit fees and (shorter) audit report
lags To test this hypothesis Table 4 reports OLS estimations of equation (2) that explain the
natural logarithm of audit fees (LogFEE) while Table 5 reports OLS estimations of equation (3)
that explain the natural logarithm of the number of days between the fiscal year end and the audit
report signature date (LogREPORT_LAG) The structures of Tables 4 and 5 are the same as those
of Tables 2 and 3 The left columns of the tables report the estimations for the combined bank
sample and SIC 61 control sample The right columns of the tables report the estimations for the
combined bank sample and highest 5 ratio of accounts receivable to assets control sample Panel
A of the tables report the estimation of the base model and Panel B of the tables report the
estimation of the models that include the size category indicators both separately and interacted
with BANK As for the analyses of internal control and accounting problems discussed in Section
30
51 the model fits and the coefficients on the control variables generally are as expected based on
prior literature so we discuss only the statistical and economic significance of the coefficients β1
on BANK in Panel A and of the coefficients on BANK and the interactions of BANK with the size
category indicators in Panel B
Examining the estimation of equation (2) with dependent variable LogFEE reported in the
left column of Panel A of Table 4 we find that the coefficient on BANK is negative (-0705) and
significant at the 1 level This coefficient implies that on average audit fees for banks are only
49 of that for SIC 61 control sample firms controlling for other factors that prior research finds
are associated with audit fees These results are consistent with Hypothesis 2rsquos prediction that bank
regulation and supervision lead to reduced audit effort
In both columns of Panel B of Table 4 the coefficient on BANK is significantly negative
as expected However the coefficient on the interactions of BANK with the largest size category
B500 is significantly positive and of similar absolute magnitude as the coefficient on BANK As a
result the coefficient on the sum of BANK and its interaction with B500 is insignificantly different
from zero whereas the sum of the coefficients on BANK and its interactions with each of the other
size indicators is significantly negative These results imply that relative to similarly sized control
firms audit effort is lower for banks with assets up to $500 billion and audit effort is
insignificantly different for banks with assets exceeding $500 billion The latter result is consistent
with the (relatively few) banks in the largest (money center) size category experiencing elevated
audit fees compared to non-banks of the same size
Examining the estimation of equation (2) with dependent variable LogREPORT_LAG
reported in the left column of Panel A of Table 5 we find that the coefficient on BANK is negative
(-0101) and significant at the 1 level This coefficient implies that on average audit report lag
31
for banks is only 90 of that for SIC 61 control sample firms controlling for other factors that
prior research finds are associated with audit report lag These results are consistent with
Hypothesis 2rsquos prediction that bank regulation and supervision lead to reduced audit effort
In both columns of Panel B of Table 5 the coefficient on BANK is significantly negative
as expected However the coefficients on the interactions of BANK with all of the size categories
are positive often significantly so and of similar absolute magnitude as the coefficient on BANK
As a consequence none of the sums of the coefficients on BANK and its interactions with the size
category indicators is significant These results imply that relative to similarly sized control firms
audit report lag is shorter and thus audit effort is lower for banks with assets up to $10 billion and
audit report lag is insignificantly different for banks with assets exceeding $10 billion
Collectively the audit fee and audit report lag estimation results reported in Tables 4 and
5 provide evidence consistent with bank regulation and supervision leading auditors to expend
lower audit effort on audits of banks in certain size categories
53 Identification Tests for the Audit Fee Model
To provide support for bank regulation and supervision as causally explaining the reduced
audit effort in bank audits that we document in Tables 4 and 5 we estimate expansions of equation
(2) explaining the natural logarithm of audit fees and equation (3) explaining the natural logarithm
of log audit report lag that include time-series or cross-sectional proxies for the intensity of bank
regulation and we test whether audit effort is lower when regulatory intensity is higher As the
inferences generated are similar to conserve space we tabulate and discuss only the results for the
expanded audit fee model
Table 6 reports OLS estimations of equation (2) with LogFEE as the dependent variable
expanded to include one of two measures of time-series measures of bank regulation intensity The
32
sample is limited to 7914 bank-year observations (965 unique banks) from 2000 to 2014 so BANK
is dropped from the equation The first bank regulation intensity measure is based on RegData an
industry- and year-specific regulation index constructed by Al-Ubaydli and McLaughlin (2017)
from textual analysis of the number of constraints (the strings ldquoshallrdquo ldquomustrdquo ldquomay notrdquo
ldquoprohibitedrdquo and ldquorequiredrdquo) in the Code of Federal Regulations (CFR) The measure used is the
natural logarithm of the number of constraints in CFR Title 12 for the banking industry each year
(LogRESTRICTIONS) The second measure is the natural logarithm of the annual budget (in $
millions) of the ldquofinance and bankingrdquo subcategory (which includes the Comptroller of the
Currency Federal Deposit Insurance Corporation and Securities and Exchange Commission)
from Regulatory Reports available at httpswcwustleduregulatory_reports (LogBUDGET)
Figure 1 depicts the evolutions of LogRESTRICTIONS and LogBUDGET from 2000-2014 Panel
A of Table 6 reports descriptive statistics of the two measures of bank regulation intensity
The left (right) columns of Table 6 report the estimation of equation (2) adding
LogBUDGET (LogRESTRICTIONS) to the model The coefficients on LogBUDGET and
LogRESTRICTIONS are both significantly negative at the 1 level consistent with more intense
bank regulation leading to lower audit fees
Table 7 reports the OLS estimations of equation (2) with LogFEE as the dependent variable
expanded to include Agarwal et alrsquos (2014) measure of regulatory leniency (ie inverse intensity)
across state-chartered banks (STATE_REG) This measure is based on the ldquoalternating examination
programrdquo in which state-chartered banks are examined by (more stringent) federal supervisors (the
FDIC or Federal Reserve) and state supervisors in rotation Using a proprietary database Agarwal
et al (2014) estimate the differential examination stringency of federal supervisors versus 44 state
supervisors The left column reports the estimation of an expanded model that includes
33
STATE_REG linearly This model is estimated on 5679 state bankndashyear observations (738 unique
banks) from 2000 to 2014 The right column reports the estimation of an expanded model that
includes STATE_REG both linearly and interacted with an indicator for state-chartered banks
(STATE_BANK) obtained from the FDIC website
(httpswww5fdicgovidaspadvSearchLandingasp) This model is estimated on 7340 (federal
and state) bankndashyear observations (903 unique banks) from 2000 to 2014 The coefficient on
STATE_REG in the left column and the coefficient on STATE_REGtimesSTATE_BANK in the right
column of the table are both significant positive at the 5 level consistent with more lenient state
regulation yielding higher audit fees
Overall the expanded audit fee model estimation results reported Tables 6 and 7 provide
evidence consistent with (more intense) bank regulation and supervision causally explaining the
(more strongly) reduced audit effort in bank audits that we document in Tables 4 and 5
53 Types of Earnings Management of Minor Concern to Bank Regulators and Supervisors
If bank regulation and supervision leads to lower audit effort banks should have more
ability to exercise accounting discretion to manage accounting numbers in ways that do not
significantly concern bank regulators and supervisors Drawing on Beatty et al (2002) we
examine two types of earnings management the frequency of small positive earnings
(SMALL_POS) and the length of the longest string of consecutive earnings increases (STRING)19
We conjecture that these types of earnings management typically accumulate to relatively small
amounts of retained earnings If so these types have relatively minor effects on banksrsquo solvency
19 A side benefit of our use of these earnings management measures is that they are just as naturally applied
to banks as to non-banks In contrast the most commonly used measures of earnings management in the
literature (Jones 1991 Dechow and Dichev 2002) are not as naturally applied to banks
34
ratios and so should be of minor concern to bank regulators and supervisors primarily concerned
with banksrsquo safety and soundness While we are unaware of any supporting empirical evidence for
our conjecture it is consistent with the absence of any mention of these types of earnings
management in bank supervisory manuals including the portions devoted to the evaluation of
earnings quality (Comptroller of the Currency 2007 p 53 Board of Governors of the Federal
Reserve System 2017 sect40203) In contrast based on the large empirical literature documenting
such earnings management and its capital market consequences by public firms in general and by
public banks in particular (Burgstahler and Dichev 1997 Beatty et al 2002 Bartov et al 2002
Brown and Caylor 2005) we expect these types of earnings management to significantly influence
banksrsquo investors and contracting parties and to be of concern to auditors
To test for differences in SMALL_POS for banks versus the firms in the control samples
Table 8 reports the logistic estimation of equation (4) with SMALL_POS as the dependent variable
for the combined BANK sample and SIC 61 control sample (left column) and for the combined
BANK sample and highest 5 ratio of accounts receivable to assets control sample (right column)
A positive coefficient β1 on BANK implies that banks exhibit more frequent small positive earnings
changes than do control firms consistent with bank regulation and supervision leading to lower
bank audit effort In both columns the coefficient on BANK is significantly positive at the 1
level The coefficient in the left (right) column implies that banks report small positive earnings
44 (25) times as frequently as the corresponding control sample firms controlling for other
variables that prior research shows are associated with the frequency of small positive earnings
To test for differences in STRING for banks versus control firms Table 9 reports the
estimation of equation (3) using the Cox proportional hazard approach for the combined BANK
sample and SIC 61 control sample (left column) and for the combined BANK sample and highest
35
5 ratio of accounts receivable to assets control sample (right column) The Cox proportional
hazard approach accounts for the right-censoring of STRING arising from our sample ending in
2014 A positive coefficient β1 on BANK implies that banks exhibit earnings strings with
incrementally longer length than do control firms consistent with bank regulation and supervision
leading to lower bank audit effort In both columns the coefficient on BANK is significantly
positive at the 1 level The coefficient in the left (right) column implies that banks report strings
of positive earnings that are 47 (94) longer than the corresponding control sample firms
controlling for other variables that prior research shows are associated with the length of earnings
strings
Collectively the results from Tables 8 and 9 indicate that compared to control firms banks
are more likely to engage in types of earnings management of minor concern to bank regulators
and supervisors consistent with bank regulation and supervision leading to lower audit effort in
audits of banks
6 Conclusion
A central feature of banks is they are regulated and supervised under numerous banking
laws and regulations Moreover bank supervision involves periodic on-site examinations and off-
site monitoring activities that overlap considerably with auditing activities In this paper we
examine whether bank regulation and supervision displace bank auditing leading to lower audit
effort in audits of banks than in audits of two control samples of similar unregulated firms (1)
non-depository credit institutions (two-digit SIC code 61) and (2) all non-banks in the highest five
percent of the ratio of accounts receivable (which includes loan and lease receivables) to total
assets Our results are consistent with bank regulation and supervision substituting for auditing
36
ie with audit effort being significantly lower in audits of banks than in audits of control sample
firms
We first provide evidence that banking engagements pose less risk to auditors We show
that banks are significantly less likely than control sample firms to disclose material weaknesses
in internal controls and to restate their financial statements controlling for the variables that prior
research shows to be associated with material internal control weaknesses and restatements We
then provide evidence consistent with auditors exerting less effort on audits of banks than on audits
of control sample firms We show that banks exhibit statistically and economically lower audit
fees and shorter audit report lags than do control sample firms controlling for the variables that
prior research shows to be associated with audit fees and audit report lags
We acknowledge that the primary threat to inference in our study is the possibility that
factors other than bank regulation and supervision might explain why audits of banks pose less
audit risk than do audits of control firms Although we cannot rule out this possibility altogether
we conduct two sets of tests to provide support for the conclusion that the associations we
document are causal First we provide evidence that bank auditors expend less effort when bank
regulation and supervision are more intense We use two time-series measures based on the text
of banking regulations and the annual budget of federal regulators and one cross-sectional measure
based on Agarwal et al (2014) of the intensity of bank regulation and supervision Second we
provide evidence that banks are more likely to engage in two types of earnings management that
are of minor concern to bank regulators and supervisors but that prior research shows have capital
market consequences (Bartov et al 2002 Brown and Caylor 2005) We find that banks report more
frequent small positive earnings and longer strings of earnings increases than do similar firms
37
We contribute to the banking and auditing literatures by providing evidence consistent
with auditors expending less effort in auditing banks than in auditing control sample firms due
to the overlap of the activities of bank regulators and supervisors with those of auditors We
emphasize that our evidence does not suggest that the aggregate monitoring of banksrsquo financial
reporting by bank regulators supervisors and auditors differs from the monitoring of similar
firmsrsquo financial reporting by auditors alone it only suggests that the monitoring conducted by
bank auditors is less Because of the importance of banks to stability and overall macroeconomic
health a compelling question is what incremental costs arise when bank auditors as financial
reporting specialists expend less effort on bank audits due to the existence of bank regulation
and supervision We provide evidence that this reduced effort leads to types of earnings
management that likely have minor effects on banksrsquo solvency ratios but have capital market
consequences documented by prior research that may lead to reduced market discipline over
banks We expect these results to be of interest to bank and auditing policymakers
38
References
Acharya V and S Ryan 2016 Banksrsquo financial reporting and financial system stability Journal
of Accounting Research 54 277ndash340
Acharya V 2014 A transparency standard for derivatives Chapter 6 in Risk Topography
Systematic Risk and Macro Modeling edited by M Brunnermeier and A Krishnamurthy
National Bureau of Economic Research University of Chicago Press 2014
Agarwal S D Lucca A Seru and F Trebbi 2014 Inconsistent regulators Evidence from
banking Quarterly Journal of Economics 129 889ndash938
Altamuro J and A Beatty 2010 How does internal control regulation affect financial reporting
Journal of Accounting and Economics 49 58ndash74
Al-Ubaydli O and P McLaughlin 2017 RegData A numerical database on industry-specific
regulations for all United States industries and federal regulations 1997-2012 Regulation
amp Governance 11 109-123
Ashbaugh-Skaife H D Collins and W Kinney Jr 2007 The discovery and reporting of internal
control deficiencies prior to SOX-mandated audits Journal of Accounting and Economics
44 166ndash192
Ashton R J Willingham and R Elliot 1987 An empirical analysis of audit delay Journal of
Accounting Research 25 275ndash292
Avraham D P Selvaggi and J Vickrey 2012 A structural view of US bank holding companies
Federal Reserve Bank of New York Economic Policy Review 18 65ndash81
Badertscher B J Burks and P Easton 2016 The market reaction to bank regulatory filings
Working paper University of Notre Dame
Bamber E L Bamber and M Schoderbek 1993 Audit structure and other determinants of audit
report lag An empirical analysis Auditing A Journal of Practice and Theory 12 1ndash23
Barth J T Li and W Lu 2009 Bank regulation in the United States CESifo Economic Studies
10 2ndash29
Barth M and W Landsman 2010 How did financial reporting contribute to the financial crisis
European Accounting Review 19 399-433
Bartov E D Givoly and C Hayn 2002 The rewards to meeting or beating earnings expectation
Journal of Accounting and Economics 33 (2) 173-204
39
Beatty A B Ke and K Petroni 2002 Earnings management to avoid earnings declines across
publicly and privately held banks The Accounting Review 77 547ndash570
Beatty A and S Liao 2014 Financial accounting in the banking industry A review of the
empirical literature Journal of Accounting and Economics 58 339ndash383
Bedard J and K Johnstone 2004 Earnings manipulation risk corporate governance risk and
auditorsrsquo planning and pricing decisions The Accounting Review 79 277ndash304
Bell T W Landsman and D Shackelford 2001 Auditorsrsquo perceived business risk and audit
fees Analysis and evidence Journal of Accounting Research 39 35ndash43
Board of Governors of the Federal Reserve Board System 2017 Bank Holding Company
Supervision Manual Division of Banking Supervision and Regulation
httpswwwfederalreservegovpublicationssupervision_bhchtm
Bronson S C Hogan M Johnson and K Ramesh 2011 The unintended consequences of
PCAOB auditing standard nos 2 and 3 on the reliability of preliminary earnings releases
Journal of Accounting and Economics 51 95ndash114
Brown L and M Caylor 2005 A temporal analysis of quarterly earnings thresholds Propensities
and valuation consequences The Accounting Review 80 (2) 423-440
Burgstahler D and I Dichev 1997 Earnings management to avoid earnings decreases and losses
Journal of Accounting and Economics 24 99ndash126
Comptroller of the Currency 2007 (last updated 2017) Bank supervision process Comptrollerrsquos
handbook
Costello A J Granja and J Weber 2016 Do strict regulators increase the transparency of the
banking system Working paper Massachusetts Institute of Technology
Dang T G Gorton B Holmstroumlm and Ordontildeez G 2014 Banks as secret keepers PIER working
paper no 14-022
Dechow P and I Dichev 2002 The quality of accruals and earnings The role of accrual
estimation errors The Accounting Review 77 35ndash59
DeFond M and J Zhang 2014 A review of archival auditing research Journal of Accounting
and Economics 58 275ndash326
Diamond D 1984 Financial intermediation and delegated monitoring Review of Economic
Studies 51 393ndash414
40
Doyle J W Ge and S McVay 2007a Accruals quality and internal control over financial
reporting The Accounting Review 82 1141ndash1170
Doyle J W Ge and S McVay 2007b Determinants of weaknesses in internal control over
financial reporting Journal of Accounting and Economics 44 193ndash223
Flannery M S Kwan and M Nimalendran 2013 The 2007ndash2009 financial crisis and bank
opaqueness Journal of Financial Intermediation 22 55ndash84
Francis J E Maydew and H Sparks 1999 The role of big 6 auditors in the credible reporting
of accruals Auditing A Journal of Practice and Theory 18 17ndash34
Gallemore J 2016 Bank financial reporting opacity and regulatory intervention Working paper
University of Chicago
Ge W and S McVay 2005 The disclosure of material weaknesses in internal control after the
Sarbanes-Oxley Act Accounting Horizons 19 137ndash158
Ghosh A and C Tang 2015 Assessing financial reporting quality of family firms The auditorsrsquo
perspective Journal of Accounting and Economics 60 95ndash116
Graham J C Harvey and S Rajgopal 2005 The economic implications of corporate financial
reporting Journal of Accounting and Economics 40 3ndash73
Guay W D Samuels D Taylor 2016 Guiding through the fog Financial statement complexity
and voluntary disclosure Journal of Accounting and Economics 62 234ndash269
Hennes K A Leone and B Miller 2014 Determinants and market consequences of auditor
dismissals after accounting restatements The Accounting Review 89 1051ndash1082
Holmstroumlm B 2015 Understanding the role of debt in the financial system BIS working paper
no 479
Houston R M Peters and J Pratt 1999 The audit risk model business risk and audit‐planning
decisions The Accounting Review 74 281ndash298
Jensen M and W Meckling Theory of the firm Managerial behavior agency costs and
ownership structure Journal of Financial Economics 3 305ndash360
Jones J 1991 Earnings management during import relief investigations Journal of Accounting
Research 29 193ndash228
Keeley J 2017 The impact of regulatory enforcement on bank risk Working paper New York
University
41
Kinney W Palmrose Z and S Scholz 2004 Auditor independence non-audit services and
restatements Was the US government right Journal of Accounting Research 42 561ndash588
Krishnan J and J Krishnan 1997 Litigation risk and auditor resignations The Accounting
Review 72 539ndash560
Lee H V Mande and R Ortman 2004 The effect of audit committee and board of director
independence on auditor resignation Auditing A Journal of Practice and Theory 23 (2)
131ndash146
Morgan D 2002 Rating banks Risk and uncertainty in an opaque industry The American
Economic Review 92 874ndash888
Myers S 1977 Determinants of corporate borrowing Journal of Financial Economics 5 147-
175
Nicoletti A 2016 The effects of auditors and regulators on bank financial reporting Evidence
from loan loss provisions Doctoral dissertation Ohio State University
Nier E and U Baumann 2006 Market discipline disclosure and moral hazard in banking
Journal of Financial Intermediation 15 332ndash361
Palmrose Z and S Scholz 2004 The circumstances and legal consequences of non-GAAP
reporting Evidence from restatements Contemporary Accounting Research 21 139ndash180
Pettway R and J Sinkey 1980 Establishing on-site bank examination priorities An early-
warning system using accounting and market information Journal of Finance XXXV 137ndash
150
Public Company Accounting Oversight Board (PCAOB) Auditing Standard No 8 Audit Risk
Washington DC PCAOB
Public Company Accounting Oversight Board (PCAOB) Auditing Standard No 12 Identifying
and Assessing Risks of Material Misstatement Washington DC PCAOB
Public Company Accounting Oversight Board (PCAOB) Auditing Standard No 13 The
Auditorrsquos Responses to the Risks of Material Misstatement Washington DC PCAOB
Richardson M K Schoenholtz B Tuckman and L White eds 2017 Regulating Wall Street
CHOICE Act vs Dodd-Frank New York Center for Global Economy and Business NYU
Stern School of Business
Ryan S 2007 Financial Instruments and Institutions Accounting and Disclosure Rules Second
edition John Wiley and Sons Hoboken NJ
42
Ryan S 2011 Financial reporting for financial instruments Foundations and Trends in
Accounting 6 187ndash354
Schwartz K and B Soo 1995 An analysis of Form 8-K disclosures of auditor changes by firms
approaching bankruptcy Auditing A Journal of Practice and Theory 14 124ndash136
Shu S Auditor resignations Clientele effects and legal liability Journal of Accounting and
Economics 29 173-205
Simunic D 1980 The pricing of audit services Theory and evidence Journal of Accounting
Research 18 161ndash190
Simunic D and M Stein 1996 The impact of litigation risk on audit pricing A review of the
economics and the evidence Auditing A Journal of Practice and Theory 15 (Supplement)
119ndash134
Watts R L and J L Zimmerman 1986 Positive Accounting Theory Prentice-Hall Inc
43
Table 1 Variable means for banks versus control firms
CONTROL BANK SIC61 High RECAT Mean Mean Difference Mean Difference INTERNAL_WEAKNESS 0024 0051 0026 0066 0042 ACC_RESTATEMENT 0006 0022 0016 0020 0014 FEE ($ million) 1643 6199 4555 3119 1476 REPORT_LAG 59325 68854 9530 68110 8785 SMALL_POS 0174 0063 ndash0111 0063 ndash0110 STRING 5608 4500 ndash1108 3347 ndash2261 ASSETS ($ billion) 39135 102555 63420 30418 8717 ROA 0006 ndash0006 ndash0012 ndash0008 ndash0014 LOSS 0108 0249 0141 0274 0167 SPECIAL_ITEMS ndash0001 ndash0015 ndash0015 ndash0020 ndash0019 DISCONTINUED 0029 0162 0134 0105 0077 EXTRA_ITEMS 0011 0048 0036 0031 0019 ABS_ACCRUALS 0027 0092 0065 0107 0080 LEVERAGE 0902 0722 ndash0180 0610 ndash0292 INVENTORY 0013 0056 0043 0071 0058 INTANGIBLES 0012 0039 0026 0074 0061 GOODWILL 0010 0019 0010 0056 0047 MampA 0198 0152 ndash0046 0228 0030 NEG_EQUITY 0003 0025 0023 0038 0035 FOREIGN 0040 0121 0081 0193 0153 FIRM_AGE 14340 14735 0395 18011 3671 ACCEL_FILER 0626 0689 0063 0608 ndash0018 MTB 1437 1700 0263 2601 1164 RETURN 0106 0171 0065 0179 0073 STD_RETURN 0084 0144 0060 0154 0070 GOING_CONCERN 0006 0015 0009 0028 0022 BUSY_MONTH 0879 0790 ndash0089 0715 ndash0164 BIG4 0444 0668 0224 0630 0185 ISPEC 0115 0166 0051 0162 0046 AUDITOR_TURNOVER 0072 0079 0007 0093 0021
This table reports variable means for the BANK and two CONTROL samples as well as the differences of variable means across the BANK and each CONTROL sample over the period 2000ndash2014 Inclusion in the BANK sample is based on inclusion in the Compustat Bank file (7914 bank-year observations) The SIC61 sample includes non-depository credit institutions with two-digit standard industry classification (SIC) code 61 on the Compustat Annual North American file (671
44
firm-year observations) The High RECTA control sample includes non-bank firms with a ratio of accounts receivable to total assets in the top 5 of the Compustat Annual North American file (3110 firm-year observations) All variables are measured for a given firm-year unless indicated otherwise The dependent variables are reported above the line in the table and are defined as follows INTERNAL_WEAKNESS = 1 if the firm disclosed internal control deficiencies and 0 otherwise ACC_RESTATEMENT = 1 if the firm subsequently restated its 10-K filing for the fiscal year and 0 otherwise FEE = the sum of audit fees and audit-related fees in $ millions REPORT_LAG = the number of days between the fiscal year-end date and auditor signature date (the natural logarithm of this variable is used in the regression analyses) SMALL_POS = 1 if a small ROE increase (000lt∆R0Ele001) is reported STRING = the duration of the longest string of consecutive annual earnings increases for the firm The control variables are reported below the line in the table and are defined as follows ASSETS = total assets ROA = net income divided by total assets LOSS = 1 if the firm reports negative net income and 0 otherwise SPECIAL_ITEMS = special items divided by total assets DISCONTINUED = 1 if discontinued operations exceeds $1 million and 0 otherwise EXTRA_ITEMS = 1 if (absolute) extraordinary items exceeds $1 million and 0 otherwise ABS_ACCRUALS = absolute value of accruals divided by total assets LEVERAGE = total liabilities divided by total assets INVENTORY = inventory divided by total assets INTANGIBLES = intangibles assets divided by total assets GOODWILL = goodwill divided by total assets MampA = 1 if goodwill increases by more than $1 million and 0 otherwise NEG_EQUITY = 1 if common equity is negative and 0 otherwise FOREIGN = 1 if a company reports non-zero foreign exchange income and 0 otherwise FIRM_AGE = the number of years a company is listed in Compustat ACCEL_FILER = 1 if the company is an accelerated filer and 0 otherwise MTB = market value of equity divided by book value of equity RETURN = fiscal year stock return STD_RETURN = standard deviation of monthly stock returns GOING_CONCERN = 1 if the firm received a goingndashconcern modified opinion and 0 otherwise BUSY_MONTH = 1 if the fiscal year-end month is December and 0 otherwise BIG4 = 1 if the company is audited by one of the Big-Four auditors and 0 otherwise ISPEC = auditorrsquos relative market share of audit fees in the clientrsquos FamandashFrench 48 industry classification AUDITOR_TURNOVER = 1 if the firmrsquos auditor changed during the year and 0 otherwise and denote significantly different variable means for the BANK and each CONTROL sample at the 1 5 and 10 levels respectively
45
Table 2 Likelihood of material internal control weaknesses for banks versus control firms
Panel A Logistic estimation of likelihood of material internal control weaknesses CONTROL SIC61 High RECTA BANK ndash0781 (0002) ndash0556 (0001) LogASSETS 0053 (0301) 0014 (0681) ROA 1208 (0441) 0138 (0718) LOSS 1469 (0000) 1335 (0000) LEVERAGE 0663 (0435) ndash0816 (0017) GOODWILL 2950 (0215) 1048 (0206) MampA 0058 (0767) 0194 (0187) FOREIGN ndash0561 (0160) 0463 (0004) MTB 0030 (0536) ndash0041 (0091) GOING_CONCERN 2034 (0000) 1324 (0000) ACC_RESTATEMENT (Y_CONTROL) ndash0076 (0917) 0266 (0574) BUSY_MONTH ndash0020 (0929) 0187 (0203) BIG4 ndash1259 (0029) ndash0863 (0001) ISPEC 4431 (0036) 2211 (0008) Intercept ndash3940 (0001) ndash1463 (0002) Year fixed effects Yes Yes Observations 6064 7834 McFaddens R2 827 952 Panel B Incorporating bank size categories SIC61 High RECTA Intercept ndash4564 (0000) ndash1942 (0000) B10_50 1167 (0041) ndash0047 (0896) B50_100 0308 (0731) ndash0340 (0666) B100_500 ndash0729 (0527) ndash14727 (0983) B500 0032 (0969) ndash0465 (0444) BANK ndash0014 (0968) ndash0499 (0007) BANKB10_50 ndash1704 (0005) ndash0256 (0551) BANKB50_100 ndash2210 (0093) ndash1468 (0246) BANKB100_500 ndash1369 (0296) 12904 (0985) BANKB500 ndash15538 (0978) ndash13901 (0971) Control variables Yes Yes Year fixed effects Yes Yes Observations 6064 7834 McFaddens R2 984 1048
The table reports the logistic estimation of the likelihood of a firm reporting a material weakness in internal control over financial reporting The dependent variable INTERNAL_WEAKNESS = 1 if the firm disclosed a material internal control deficiency and 0 otherwise The main test variable BANK = 1 if the firm is on Bank Compustat and 0 otherwise We estimate the model on the combined BANK sample and one of two control samples of firms that are similar to banks but unregulated (1) The SIC61 control sample comprises non-depository credit institutions with two-digit standard industry classification (SIC) code 61 on Annual North American Compustat (2) the High RECTA control sample comprises non-banks with the top 5 of receivable to assets ratio on Annual North American Compustat The control variables are defined as follows LogASSETS = the natural logarithm of total assets ROA = net income divided by total assets LOSS = 1 if the firm reports negative net income and 0 otherwise LEVERAGE = total liabilities divided by total assets GOODWILL = goodwill divided by total assets MampA = 1 if the firmrsquos goodwill increases by more than $1 million and 0 otherwise FOREIGN = 1 if a firm reports non-zero foreign exchange income and 0 otherwise MTB = market value of equity divided by book value of equity GOING_CONCERN = 1 if a firm receives a going concern modified opinion and 0 otherwise ACC_RESTATEMENT = 1 if the firm subsequently restates its current period Form 10-K filing for the fiscal year BUSY_MONTH = 1 if the fiscal year-end is December and 0 otherwise BIG4 = 1 if the firm is audited by one of the Big-Four auditors and 0 otherwise ISPEC = auditorrsquos relative market share of
46
audit fees in the clientrsquos FamandashFrench 48 industry classification Panel A reports the base model estimation Panel B reports the estimation of an expanded model which includes firm size indicators and their interactions with BANK The firm size indicators are denoted Bj_k=1 if total assets are between j and k $ billion for j=10 50 or 100 and for k=50 100 or 500 and are denoted B500=1 if total assets exceed $500 billion p-values are reported in parentheses
47
Table 3 Likelihood of financial statement restatements for banks versus control firms
Panel A Logistic estimation of restatements CONTROL SIC61 High RECTA BANK ndash1075 (0005) ndash1520 (0000) LogASSETS 0006 (0947) 0082 (0134) ROA 0155 (0934) ndash0815 (0242) LOSS 0271 (0451) 0359 (0167) LEVERAGE ndash0755 (0518) 0890 (0157) GOODWILL ndash13070 (0151) ndash5891 (0014) MampA 0569 (0095) 0527 (0036) FOREIGN ndash0678 (0295) ndash0817 (0026) MTB ndash0050 (0748) 0049 (0084) GOING_CONCERN ndash13976 (0992) ndash14082 (0979) INTERNAL_WEAKNESS (Y_CONTROL) ndash0218 (0768) 0017 (0972) BUSY_MONTH ndash0023 (0952) ndash0439 (0058) BIG4 1087 (0100) 0635 (0111) ISPEC ndash2067 (0399) ndash1643 (0258) Intercept ndash4288 (0000) ndash5118 (0000) Year fixed effects Yes Yes Observations 8585 11024 McFaddens R2 765 902 Panel B Incorporating bank size into the analyses SIC61 High RECTA Intercept ndash5023 (0000) ndash5551 (0000) B10_50 0512 (0550) ndash0022 (0962) B50_100 ndash0080 (0950) ndash0728 (0510) B100_500 0568 (0609) ndash0476 (0584) B500 ndash14268 (0984) ndash1148 (0223) BANK ndash0552 (0294) ndash1349 (0000) BANKB10_50 ndash2798 (0029) ndash2119 (0053) BANKB50_100 ndash13314 (0978) ndash13363 (0986) BANKB100_500 ndash0962 (0359) 0307 (0743) BANKB500 ndash0169 (1000) ndash13623 (0985) Control variables Yes Yes Year fixed effects Yes Yes Observations 8585 11024 McFaddens R2 1029 1035
The table reports the logistic estimation of the likelihood of a firm reporting a financial statement restatement The dependent variable ACC_RESTATEMENT = 1 if the firm subsequently restated its 10-K filing for the fiscal year and zero otherwise The main test variable BANK = 1 if the firm is on Bank Compustat and 0 otherwise We estimate the model on the combined BANK sample and one of two control samples of firms that are similar to banks but unregulated (1) The SIC61 control sample comprises non-depository credit institutions with two-digit standard industry classification (SIC) code 61 on Annual North American Compustat (2) the High RECTA control sample comprises non-banks with the top 5 of receivable to assets ratio on Annual North American Compustat The control variables are defined as follows LogASSETS = the natural logarithm of total assets ROA = net income divided by total assets LOSS = 1 if the firm reports negative net income and 0 otherwise LEVERAGE = total liabilities divided by total assets GOODWILL = goodwill divided by total assets MampA = 1 if the firmrsquos goodwill increases by more than $1 million and 0 otherwise FOREIGN = 1 if a firm reports non-zero foreign exchange income and 0 otherwise MTB = market value of equity divided by book value of equity GOING_CONCERN = 1 if a firm receives a going concern modified opinion and 0 otherwise INTERNAL_WEAKNESS= 1 if the firm disclosed internal control deficiencies and 0 otherwise BUSY_MONTH = 1 if the fiscal year-end is December and 0 otherwise BIG4 = 1 if the firm is audited by one of the Big-Four auditors and 0 otherwise ISPEC = auditorrsquos relative market share of audit fees in the clientrsquos FamandashFrench
48
48 industry classification Panel A reports the base model estimation Panel B reports the estimation of an expanded model which includes firm size indicators and their interactions with BANK The firm size indicators are denoted Bj_k=1 if total assets are between j and k $ billion for j=10 50 or 100 and for k=50 100 or 500 and are denoted B500=1 if total assets exceed $500 billion p-values are reported in parentheses
49
Table 4 Audit fees for banks versus control firms
Panel A OLS estimation of audit fees CONTROL SIC61 High RECTA BANK ndash0705 (0000) ndash0954 (0000) LogASSETS 0601 (0000) 0552 (0000) ROA ndash0754 (0003) ndash0768 (0000) LOSS 0178 (0000) 0196 (0000) SPECIAL_ITEMS 0488 (0003) 0072 (0652) DISCONTINUED 0286 (0000) 0228 (0000) LEVERAGE ndash1496 (0000) ndash0627 (0000) INVENTORY 0291 (0177) 0729 (0000) INTANGIBLES 2637 (0002) 2404 (0000) GOODWILL ndash2665 (0046) ndash0609 (0297) MampA 0081 (0000) 0092 (0000) NEG_EQUITY 0222 (0094) 0466 (0000) FIRM_AGE 0004 (0084) 0007 (0000) ACCEL_FILER ndash0004 (0902) 0029 (0307) INTERNAL_WEAKNESS 0254 (0000) 0260 (0000) MTB ndash0008 (0598) 0021 (0004) RETURN ndash0035 (0048) ndash0001 (0936) STD_RETURN 0802 (0000) 0780 (0000) GOING_CONCERN 0048 (0602) 0055 (0473) BUSY_MONTH 0106 (0014) 0038 (0286) BIG4 0322 (0000) 0327 (0000) ISPEC 0087 (0712) 0240 (0141) Year fixed effects Yes Yes Observations 8585 11024 Adjusted R2 90 24 88 54 Panel B Incorporating firm size into the analyses SIC61 High RECTA B10_50 ndash0215 (0268) 0013 (0935) B50_100 0283 (0074) 0283 (0010) B100_500 0215 (0488) 0219 (0284) B500 0482 (0004) 0519 (0000) BANK ndash0766 (0000) ndash0980 (0000) BANKB10_50 0213 (0283) 0033 (0842) BANKB50_100 ndash0138 (0466) ndash0045 (0772) BANKB100_500 0201 (0523) 0315 (0129) BANKB500 0701 (0000) 0852 (0000) Control variables Yes Yes Year fixed effects Yes Yes Observations 8585 11024 Adjusted R2 90 92 89 32
The table reports the OLS estimation of a model with dependent variable LogFEE = the natural logarithm of the sum of audit fees and audit-related fees The main test variable BANK = 1 if the firm is on Bank Compustat and 0 otherwise We estimate the model on the combined BANK sample and one of two control samples of firms that are similar to banks but unregulated (1) The SIC61 control sample comprises non-depository credit institutions with two-digit standard industry classification (SIC) code 61 on Annual North American Compustat (2) the High RECTA control sample comprises non-banks with the top 5 of receivable to assets ratio on Annual North American Compustat The control variables are defined as follows LogASSETS = the natural logarithm of total assets ROA = net income divided by total assets LOSS = 1 if the firm reports negative net income and 0 otherwise SPECIAL_ITEMS = special items divided by total assets DISCONTINUED = 1 if a firmrsquos discontinued operations exceeds $1 million and
50
0 otherwise LEVERAGE = total liabilities divided by total assets INVENTORY = inventory divided by total assets INTANGIBLES = intangible assets divided by total assets GOODWILL = goodwill divided by total assets MampA = 1 if the firmrsquos goodwill increases by more than $1 million and 0 otherwise NEG_EQUITY = 1 if common equity is negative and 0 otherwise FIRM_AGE = the number of years the firm is listed in Compustat ACCEL_FILER = 1 if the firm is an accelerated filer and 0 otherwise INTERNAL_WEAKNESS = 1 if the firm disclosed a material internal control deficiency and 0 otherwise MTB = market value of equity divided by book value of equity RETURN = fiscal year stock return STD_RETURN = standard deviation of monthly stock returns GOING_CONCERN = 1 if a firm receives a going concern modified opinion and 0 otherwise BUSY_MONTH = 1 if the fiscal year-end is December and 0 otherwise BIG4 = 1 if the firm is audited by one of the Big-Four auditors and 0 otherwise ISPEC = auditorrsquos relative market share of audit fees in the clientrsquos FamandashFrench 48 industry classification Panel A reports the base model estimation Panel B reports the estimation of an expanded model which includes firm size indicators and their interactions with BANK The firm size indicators are denoted Bj_k=1 if total assets are between j and k $ billion for j=10 50 or 100 and for k=50 100 or 500 and are denoted B500=1 if total assets exceed $500 billion Standard errors are clustered at the firm level (two-tailed p-values are in parentheses)
51
Table 5 Audit report lag for banks versus control firms
Panel A OLS estimation of audit report lag CONTROL SIC61 High RECTA BANK ndash0101 (0015) ndash0101 (0000) LogASSETS ndash0014 (0057) ndash0021 (0000) ROA ndash0275 (0022) 0058 (0243) LOSS 0113 (0000) 0144 (0000) DISCONTINUED 0029 (0416) 0035 (0148) EXTRA_ITEMS 0098 (0058) 0137 (0001) ABS_ACCRUALS ndash0021 (0356) 0064 (0061) LEVERAGE 0093 (0397) 0084 (0093) INVENTORY 0408 (0001) 0255 (0005) FOREIGN 0199 (0002) 0067 (0045) FIRM_AGE ndash0007 (0000) ndash0005 (0000) INTERNAL_WEAKNESS 0186 (0000) 0151 (0000) AUDITOR_TURNOVER 0045 (0004) 0050 (0000) GOING_CONCERN 0240 (0001) 0172 (0000) BUSY_MONTH ndash0021 (0411) ndash0021 (0286) BIG4 0111 (0000) 0083 (0000) Year fixed effects Yes Yes Observations 8289 10660 Adjusted R2 51 28 45 53 Panel B Incorporating firm size into the analyses SIC61 High RECTA B10_50 ndash0252 (0000) ndash0124 (0000) B50_100 ndash0190 (0074) ndash0090 (0126) B100_500 ndash0184 (0017) 0091 (0037) B500 0079 (0608) 0161 (0004) BANK ndash0174 (0000) ndash0141 (0000) BANKB10_50 0246 (0001) 0180 (0000) BANKB50_100 0238 (0061) 0229 (0001) BANKB100_500 0290 (0002) 0136 (0008) BANKB500 0101 (0546) 0202 (0001) Control variables Yes Yes Year fixed effects Yes Yes Observations 8289 10660 Adjusted R2 51 67 46 51
The table reports the OLS estimation of a model with dependent variable LogARL = the natural logarithm of the number of days between the fiscal year-end date and auditor signature date The main test variable BANK = 1 if the firm is on Bank Compustat and 0 otherwise We estimate the model on the combined BANK sample and one of two control samples of firms that are similar to banks but unregulated (1) The SIC61 control sample comprises non-depository credit institutions with two-digit standard industry classification (SIC) code 61 on Annual North American Compustat (2) the High RECTA control sample comprises non-banks with the top 5 of receivable to assets ratio on Annual North American Compustat The control variables are defined as follows LogASSETS = the natural logarithm of total assets ROA = net income divided by total assets LOSS = 1 if the firm reports negative net income and 0 otherwise DISCONTINUED = 1 if a firmrsquos discontinued operations exceeds $1 million and 0 otherwise EXTRA_ITEMS = 1 if a firmrsquos (absolute) extraordinary items exceeds $1 million and 0 otherwise ABS_ACCRUALS = absolute value of accruals divided by total assets LEVERAGE = total liabilities divided by total assets INVENTORY = inventory divided by total assets FOREIGN = 1 if a firm reports non-zero foreign exchange income and 0 otherwise FIRM_AGE = the number of years a firm is listed in Compustat INTERNAL_WEAKNESS = 1 if the firm disclosed a material internal control deficiency and 0 otherwise AUDITOR_TURNOVER = 1 if the firmrsquos auditor changed during the year and 0 otherwise GOING_CONCERN = 1 if a firm receives a going concern modified opinion and 0 otherwise
52
BUSY_MONTH = 1 if the fiscal year-end is December and 0 otherwise BIG4 = 1 if the firm is audited by one of the Big-Four auditors and 0 otherwise Panel A reports the base model estimation Panel B reports the estimation of an expanded model which includes firm size indicators and their interactions with BANK The firm size indicators are denoted Bj_k=1 if total assets are between j and k $ billion for j=10 50 or 100 and for k=50 100 or 500 and are denoted B500=1 if total assets exceed $500 billion Standard errors are clustered at the firm level (two-tailed p-values are in parentheses)
53
Table 6 Identification tests for audit fee model using proxies for times-series variation
in the intensity of banking regulation
Panel A Descriptive statistics N Mean Std Q1 Median Q3 BUDGET (in millions $) 15 2757 908 2008 2506 3584 RESTRICTIONS (number of words) 15 29936 9313 24771 25536 30053 Panel B OLS estimation of audit fees
intensity LogBUDGET model LogRESTRICTIONS model LogBUDGET ndash1640 (0000) LogRESTRICTIONS ndash0677 (0000) LogASSETS 0454 (0000) 0467 (0000) ROA ndash1735 (0008) ndash1227 (0083) LOSS 0046 (0008) 0048 (0008) SPECIAL_ITEMS 2113 (0020) 1043 (0281) DISCONTINUED 0057 (0024) 0078 (0003) LEVERAGE ndash0896 (0000) ndash0732 (0000) INVENTORY 0274 (0086) 0228 (0170) INTANGIBLES 1962 (0090) 1632 (0207) GOODWILL ndash0059 (0960) 1379 (0286) MampA 0036 (0000) 0055 (0000) NEG_EQUITY 0099 (0300) 0113 (0244) FIRM_AGE 0177 (0000) 0101 (0000) ACCEL_FILER ndash6728 (0000) ndash3901 (0000) INTERNAL_WEAKNESS 0230 (0000) 0220 (0000) MTB 0005 (0352) 0037 (0002) RETURN ndash0052 (0000) ndash0059 (0000) STD_RETURN 0131 (0040) ndash0209 (0008) GOING_CONCERN 0039 (0441) 0057 (0294) BUSY_MONTH 0043 (0438) 0063 (0273) BIG4 0109 (0002) 0111 (0002) ISPEC 0516 (0000) 0554 (0000) Year fixed effects No No Firm fixed effects Yes Yes Observations 7914 7914 Adjusted R2 9590 9569
Panel A reports descriptive statistics for two measures of bank regulation intensity BUDGET and RESTRICTIONS BUDGET is the annual budget in $ millions of the ldquofinance and bankingrdquo subcategory (which includes the Comptroller of the Currency Federal Deposit Insurance Corporation and Securities and Exchange Commission) from Regulatory Reports available at httpswcwustleduregulatory_reports RESTRICTIONS is based on RegData an industry- and year-specific regulation index constructed by Al-Ubaydli and McLaughlin (2017) from textual analysis of the number of constraints (the strings ldquoshallrdquo ldquomustrdquo ldquomay notrdquo ldquoprohibitedrdquo and ldquorequiredrdquo) in the Code of Federal Regulations (CFR) Title 12 for the banking industry each year Panel B reports the OLS estimation for the BANK sample only of an expansion of the audit fee model with dependent variable LogFEE = the natural logarithm of the sum of audit fees and audit-related fees reported in Table 4 The expanded model includes the natural logarithm of BUDGET or RESTRICTIONS The control variables are defined as follows LogASSETS = the natural logarithm of total assets ROA = net income divided by total assets LOSS = 1 if the firm reports negative net income and 0 otherwise SPECIAL_ITEMS = special items divided by total assets DISCONTINUED = 1 if a firmrsquos discontinued operations exceeds $1 million and 0 otherwise LEVERAGE = total liabilities divided by total assets INVENTORY = inventory divided by total assets INTANGIBLES = intangible assets divided by total assets GOODWILL = goodwill divided by total assets MampA = 1 if the firmrsquos goodwill increases by more than $1 million and 0 otherwise NEG_EQUITY = 1 if common equity is negative and 0 otherwise FIRM_AGE = the number of years a firm is listed in Compustat ACCEL_FILER = 1 if the firm is an accelerated filer and 0 otherwise INTERNAL_WEAKNESS = 1 if the firm disclosed a material internal control
54
deficiency and 0 otherwise MTB = market value of equity divided by book value of equity RETURN = fiscal year stock return STD_RETURN = standard deviation of monthly stock returns GOING_CONCERN = 1 if a firm receives a going concern modified opinion and 0 otherwise BUSY_MONTH = 1 if the fiscal year-end is December and 0 otherwise BIG4 = 1 if the firm is audited by one of the Big-Four auditors and 0 otherwise ISPEC = auditorrsquos relative market share of audit fees in the clientrsquos FamandashFrench 48 industry classification Standard errors are Whites corrected standard errors (two-tailed p-values are in parentheses)
55
Table 7 Identification tests for audit fee model using proxy for cross sectional variation
in the intensity of banking regulation
STATE BANKS ALL BANKS STATE_REG 0664 (0016) ndash0670 (0196) STATE_BANK ndash0088 (0158) STATE_REG x STATE_BANK 1346 (0023) LogASSETS 0537 (0000) 0567 (0000) ROA ndash3904 (0010) ndash4337 (0003) LOSS 0093 (0009) 0116 (0001) SPECIAL_ITEMS 3148 (0057) 3943 (0012) DISCONTINUED 0296 (0001) 0273 (0000) LEVERAGE ndash1964 (0000) ndash1976 (0000) INVENTORY 0780 (0000) 0986 (0000) INTANGIBLES 7261 (0000) 6960 (0000) GOODWILL ndash5674 (0000) ndash5593 (0000) MampA 0091 (0000) 0066 (0000) NEG_EQUITY 0164 (0184) 0027 (0879) FIRM_AGE 0007 (0002) 0008 (0000) ACCEL_FILER 0076 (0014) 0023 (0440) INTERNAL_WEAKNESS 0250 (0000) 0248 (0000) MTB 0005 (0708) ndash0004 (0764) RETURN ndash0047 (0013) ndash0021 (0243) STD_RETURN 0669 (0001) 0637 (0000) GOING_CONCERN ndash0081 (0318) 0017 (0855) BUSY_MONTH 0068 (0055) 0068 (0062) BIG4 0360 (0000) 0331 (0000) ISPEC 0035 (0889) 0003 (0989) Intercept 9320 (0000) 9274 (0000) Year fixed effects Yes Yes Observations 5679 7340 Adjusted R2 8741 8859
The table reports the OLS estimation for the BANK sample only of two expansions of the audit fee model with dependent variable LogFEE = the natural logarithm of the sum of audit fees and audit-related fees in $ millions reported in Table 4 The both expanded models include Agarwal Lucca Seru and Trebbirsquos (2014) measure of regulatory leniency (inverse intensity) across state-chartered banks (STATE_REG) and The measure is based on the ldquoalternating examination programrdquo in which state-chartered banks are examined by (more stringent) federal supervisors (the FDIC or Federal Reserve) and state supervisors on an alternating basis Using a proprietary database Agarwal et al (2014) estimate the differential examination stringency of federal supervisors versus 44 state bank supervisors The expanded reported in right column as includes an indicator for whether bank is a state-chartered bank (STATE_BANK) based on information obtained from the FDIC website (httpswww5fdicgovidaspadvSearchLandingasp) as well as the interaction of STATE_REG with STATE_BANK The control variables are defined as follows LogASSETS = the natural logarithm of total assets ROA = net income divided by total assets LOSS = 1 if the firm reports negative net income and 0 otherwise SPECIAL_ITEMS = special items divided by total assets DISCONTINUED = 1 if a firmrsquos discontinued operations exceeds $1 million and 0 otherwise LEVERAGE = the total liabilities divided by total assets INVENTORY = inventory divided by total assets INTANGIBLES = intangible assets divided by total assets GOODWILL = goodwill divided by total assets MampA = 1 if the firmrsquos goodwill increases by more than $1 million and 0 otherwise NEG_EQUITY = 1 if common equity is negative and 0 otherwise FIRM_AGE = the number of years a firm is listed in Compustat ACCEL_FILER = 1 if the firm is an accelerated filer and 0 otherwise INTERNAL_WEAKNESS = 1 if the firm disclosed a material internal control deficiency and 0 otherwise MTB = market value of equity divided by book value of equity RETURN = fiscal year stock return STD_RETURN = standard deviation of monthly stock returns GOING_CONCERN = 1 if a firm receives a going concern modified opinion and 0 otherwise BUSY_MONTH = 1 if the fiscal year-end is December and 0 otherwise
56
BIG4 = 1 if the firm is audited by one of the Big-Four auditors and 0 otherwise ISPEC = auditorrsquos relative market share of audit fees in the clientrsquos FamandashFrench 48 industry classification Panel A reports the base model estimation Panel B reports the estimation of an expanded model which includes the interactions of firm size with BANK The bank size indicators are denoted Bj_k=1 if total assets are between j and k $ billion for j=10 50 or 100 and for k=50 100 or 500 and are denoted B500=1 if total assets exceed $500 billion Standard errors are clustered at the firm level (two-tailed p-values are in parentheses)
57
Table 8 Likelihood of small earnings increases for banks versus control firms
CONTROL SIC61 High RECTA BANK 1483 (0000) 0897 (0000) LogASSETS ndash0052 (0026) ndash0030 (0168) LEVERAGE ndash1351 (0006) ndash0022 (0952) MTB 0040 (0192) 0001 (0965) ACCEL_FILER 0222 (0003) 0176 (0019) BIG4 ndash0062 (0401) ndash0062 (0399) Intercept ndash1467 (0000) ndash2164 (0000) Year fixed effects Yes Yes Observations 8585 8928 McFaddens R2 312 328
The table reports the logistic estimation of the likelihood that a firm reports a small earnings increase SMALL_POS = 1 if 000 lt ∆ROE le 001 where ROE = net income divided by the book value of common equity and 0 otherwise The main test variable BANK = 1 if the firm is a bank and 0 otherwise We estimate the model on the combined BANK sample and one of two control samples of firms that are similar to banks but unregulated (1) The SIC61 control sample comprises non-depository credit institutions with two-digit standard industry classification (SIC) code 61 on Annual North American Compustat (2) the High RECTA control sample comprises non-banks with the top 5 of receivable to assets ratio on Annual North American Compustat The control variables are defined as follows LogASSETS = the natural logarithm of total assets LEVERAGE = total liabilities divided by total assets MTB = market value of equity divided by book value of equity ACCEL_FILER = 1 if the firm is an accelerated filer and 0 otherwise BIG4 = 1 if the firm is audited by one of the Big-Four auditors and 0 otherwise p-values are reported in parentheses
58
Table 9 Length of string of consecutive earnings increases for banks versus control firms
CONTROL SIC61 High RECTA BANK 0383 (0008) 0663 (0000) LogASSETS ndash0128 (0000) ndash0171 (0000) LEVERAGE ndash0469 (0377) 0516 (0000) MTB ndash0275 (0000) ndash0062 (0000) GOODWILL 1023 (04260 ndash0726 (0070) ACCEL_FILER ndash0446 (0000) ndash0246 (0000) INTERNAL_WEAKNESS ndash0170 (0467) 0041 (0763) BIG4 0101 (0215) 0111 (0058) Intercept Year fixed effects Yes Yes Number of observations 1069 1778 McFaddens R2 417 390
The table reports proportional hazard model estimation of a model with dependent variable STRING = the duration of the longest string of consecutive annual earnings increases The main test variable BANK = 1 if the firm is a bank and 0 otherwise We estimate the model on the combined BANK sample and one of two control samples of firms that are similar to banks but unregulated (1) The SIC61 control sample comprises non-depository credit institutions with two-digit standard industry classification (SIC) code 61 on Annual North American Compustat (2) the High RECTA control sample comprises non-banks with the top 5 of receivable to assets ratio on Annual North American Compustat The control variables are defined as follows LogASSETS = the natural logarithm of total assets LEVERAGE = total liabilities divided by total assets MTB = market value of equity divided by book value of equity ACCEL_FILER = 1 if the firm is an accelerated filer and 0 otherwise BIG4 = 1 if the firm is audited by one of the Big-Four auditors and 0 otherwise p-values are reported in parentheses
59
Figure 1
Plot of time-series measures of the intensity of banking regulation from 2000-2014
LogRestrictions is based on RegData an industry- and year-specific regulation index constructed by Al-Ubaydli and
McLaughlin (2017) from textual analysis of the number of constraints (the strings ldquoshallrdquo ldquomustrdquo ldquomay notrdquo
ldquoprohibitedrdquo and ldquorequiredrdquo) in the Code of Federal Regulations (CFR) This measure is the natural logarithm of the
number of constraints in CFR Title 12 for the banking industry each year LogBudget is the natural logarithm of the
annual budget (in $ millions) of the ldquofinance and bankingrdquo subcategory (which includes the Comptroller of the
Currency Federal Deposit Insurance Corporation and Securities and Exchange Commission) from Regulatory
Reports available at httpswcwustleduregulatory_reports
94
96
98
10
102
104
106
108
11
7
72
74
76
78
8
82
84
86
2000 2001 2002 2003 2004 2005 2006 2007 2008 2009 2010 2011 2012 2013 2014
logBudget logRestrictions

8
To summarize we contribute to the banking and auditing literatures by providing
evidence consistent with auditors expending less effort in auditing banks than in auditing similar
unregulated firms due to the overlap of the activities of bank regulators and supervisors with
those of auditors We emphasize that our evidence does not suggest that the aggregate
monitoring of banksrsquo financial reporting by bank regulators supervisors and auditors differs
from the monitoring of similar firmsrsquo financial reporting by auditors alone it only suggests that
the monitoring conducted by bank auditors is less Because of the importance of banks to
stability and overall economic health a compelling question is what incremental costs arise when
bank auditors as financial reporting specialists expend less effort on bank audits due to the
existence of bank regulation and supervision We provide evidence that this reduced effort leads
to types of earnings management that likely have minor effects on banksrsquo solvency ratios but
have capital market consequences documented by prior research The types of earnings
management may lead to reduced market discipline over banks We expect these results to be of
interest to bank and auditing policymakers
In the remainder of the paper Section 2 develops the hypotheses Sections 3 and 4 describe
the empirical models and variables and the data sources and sample selection respectively
Sections 5 present the empirical results and Section 6 concludes
2 Background and Hypothesis Development
21 Banking Background7
7 Much of the discussion in this section is drawn from Board of Governors of the Federal Reserve System
(2017) To avoid clutter we only cite material from this document that is not widely available from other
sources
9
211 Bank Regulation and Regulators
In the United States banks are subject to a complex set of laws and regulations that restrict
their allowed activities specify minimum capital and liquidity levels and govern other matters
These laws and regulations exhibit cycles in stringency over time (Ryan 2007) For example
during the regulatory period from the Great Depression to the 1970s the Banking Act of 1933
prohibited bank holding companies from owning or being owned by nonfinancial companies and
from underwriting most securities During the deregulatory period in the early to mid-1980s the
Depository Institutions and Monetary Control Act of 1980 phased out interest rate ceilings and
allowed thrift institutions to expand their activities significantly During the regulatory period in
the late 1980s and early 1990s FDICIA required regulators to take prompt corrective action when
banksrsquo leverage capital ratios fall below the levels deemed well-capitalized FDICIA also includes
various requirements regarding banksrsquo financial reporting auditing and internal control discussed
in the introduction
During the deregulatory period in the late 1990s the Gramm-Leach-Bliley Act of 1999
allowed subsidiaries of regulated banks to underwrite securities and financial holding companies
to perform essentially all types of financial services somewhere within their corporate structures
During the post-financial-crisis regulatory period the Dodd-Frank Wall Street Reform and
Consumer Protection Act of 2010 imposed many prudential regulations on large bank holding
companies including increased risk-based capital and liquidity requirements credit exposure
concentration limits and reporting requirements periodic stress tests requirements to plan for
rapid and orderly resolution of the institution in the event of financial distress or failure
requirements to establish risk committees and enhanced public disclosure requirements Efforts
10
to roll back Dodd-Frank and other bank regulations are currently underway in Congress
(Richardson et al 2017)
FDICIArsquos requirement that a bankrsquos management assess and certify the effectiveness of
the bankrsquos internal controls is of particular relevance to this study Control risk is a key component
of audit risk Particularly prior to the effective dates of Sections 302 and 404 of SOX FDICIArsquos
requirements should reduce the internal control risk of banks relative to that of non-banks
(Altamuro and Beatty 2010) Moreover we expect bank supervisors to require banks with
identified internal control deficiencies to remediate those deficiencies promptly further reducing
banksrsquo control risk
Even the most stringent banking laws and regulations can have the intended effects only if
bank regulators and supervisors adequately enforce banksrsquo adherence to these rules Under the
ldquodual banking systemrdquo individual banks may be nationally or state chartered and bank regulation
and supervision is conducted by overlapping sets of federal regulators and state banking
departments National banks are primarily supervised by the Office of the Comptroller of the
Currency (ldquoOCCrdquo) a federal regulator State banks that elect to become members of the Federal
Reserve System (state member banks) are primarily supervised by the Federal Reserve a federal
regulator and their state banking departments State banks that are not members of the Federal
Reserve System (state nonmember banks) are primarily supervised by the FDIC a federal
regulator and their state banking departments All banks accepting insured deposits are also
supervised by the FDIC8
8 Recognizing that the dual banking system and multiple federal bank regulators could lead to
inconsistencies in bank regulation and supervision in 1978 Congress created the Federal Financial
Institutions Examination Council (ldquoFFIECrdquo) an interagency body to promote consistency in these
activities The FFIEC currently is composed of the chairs of the FDIC and the National Credit Union
Administration the Comptroller of the Currency a governor of the Federal Reserve a state banking
11
Individual banks may be owned by bank holding companies which may apply and qualify
to be financial holding companies Bank holding companies typically engage in lending deposit
acceptance and any other allowed activities through their individual bank subsidiaries Financial
holding companies may engage in activities not allowed in individual banks such as insurance
underwriting and merchant banking through non-bank subsidiaries (Ryan 2007 Avraham et al
2012) The Federal Reserve has supervisory authority over all bank holding companies regardless
of how their subsidiary banks are chartered and supervised
212 Bank Supervision
Bank supervision involves the periodic on-site examination and ongoing off-site
monitoring of banksrsquo financial condition and risks the adequacy of banksrsquo accounting internal
control and risk management systems and banksrsquo compliance with applicable laws and
regulations The main goal of supervision is to ensure the safety and soundness of individual banks
and especially of the banking system
Bank supervision shares many similarities with (bank) auditing For example much like
auditorsrsquo risk-based approach to auditing the Federal Reserve indicates that it employs a risk-
focused approach to supervision (Board of Governors of the Federal Reserve System 2017) Under
this approach the Federal Reserve first identifies the primary risks faced by a bank The Federal
Reserve then assesses the bankrsquos ability to measure monitor and control those risks given its (1)
board and senior management oversight (2) policies procedures and risk limits (3) risk
monitoring and management information systems and (4) internal controls
director and the director of the Consumer Financial Protection Bureau The FFIEC has developed uniform
examination principles and standards as well as uniform regulatory reporting forms and systems for
federally supervised banks
12
On-site examinations of individual banks and bank holding companies generally occur
every 12 to 18 months depending on the organizationrsquos size supervisory rating and extent of non-
banking assets as well as supervisory resource constraints For state banks the primary federal
supervisor coordinates its on-site examinations with the state supervisor with the two supervisors
generally conducting examinations in rotation under the ldquoalternating examination programrdquo
(Agarwal et al 2014) The results of an examination which include a confidential supervisory
rating of the bankrsquos overall condition are reported to the bankrsquos board of directors and
management The supervisory rating system is referred to as CAMELS an acroynm for its six
components (1) capital adequacy (2) asset quality (3) management and administration (4)
earnings (5) liquidity and (6) sensitivity to market risk The overall and component CAMELS
ratings efficiently communicate supervisorsrsquo overall assessments of banks as well as any specific
issues that raise concern or require attention
Between examinations bank supervisors use many sources of financial and other
information most importantly banksrsquo quarterly regulatory reports to monitor banks The primary
report for individual banks is the Consolidated Reports of Condition and Income (ldquoCall Reportsrdquo)
These reports provide the raw data for the Uniform Bank Performance Report which presents
ratios that can be compared across banks and time to detect unusual levels of or significant changes
in a banks financial condition The primary report for bank holding companies is the Consolidated
Financial Statements for Bank Holding Companies (FR Y-9C) The Federal Reserve indicates it
uses an automated system to estimate an organizationrsquos CAMELS rating based on its prior
examination results and subsequent quarterly Call Report or FR Y-9C filings (Board of Governors
of the Federal Reserve System 2017)
13
If a supervisor determines that a bank or bank holding company has problems that affect
its safety and soundness the supervisor may take a variety of formal or informal actions to ensure
that the organizationrsquos management and directors undertake measures to address the problems
(Keeley 2017) For example the supervisor may enter into a written agreement with issue a cease-
and-desist order or prompt-corrective-action directive to or levy a fine against the organization
22 Bank Complexity and Opacity
Although a debate exists as to whether stability is enhanced by bank transparency or bank
opacity the traditional and still dominant view is that transparency enhances stability (Morgan
2002 Nier and Baumann 2006 Acharya and Ryan 2016)9 Prior theoretical and empirical research
provides numerous bases for this view For example banksrsquo effectiveness as monitors provides
them with comparative advantages in lending to information-sensitive borrowers (Diamond 1984)
Banksrsquo high leverage multiplies their risk and exacerbates various agency problems such as asset
substitution (Jensen and Meckling 1976) and underinvestment when the benefits of investment
primarily accrue to debtholders (Myers 1977) Such agency problems are exacerbated further by
information asymmetries between banks and their debt and equity claimants as well as among
these claimants (Beatty and Liao 2014 Acharya and Ryan 2016)
Despite the perceived benefits of bank transparency banks are often viewed as opaque due
to their complex and interrelated on- and off-balance sheet exposures The individual and
collective values and risk of these exposures are inherently difficult for banks to convey to
outsiders and for outsiders to evaluate This difficulty likely enhances banksrsquo ability to manage or
obscure their accounting numbers
9 See Dang et al (2014) Holmstroumlm (2015) and Acharya and Ryan (2016) for discussion of the opposing
view that bank opacity enhances stability
14
Prior empirical research provides evidence that banks are more opaque than non-banks and
about the determinants of banksrsquo opacity Morgan (2002) shows that banks receive more split
credit ratings (ie different bond ratings from different rating agencies) than do non-banks a result
he attributes to banksrsquo greater opacity He further shows that banksrsquo opacity varies with their asset
composition increasing with their proportions of loans and trading assets Flannery et al (2013)
provide evidence that bank opacity increases during periods of financial system stress when the
valuations of financial assets become harder to determine and more strongly correlated
We expect that the difference in opacity between banks and non-banks has widened over
time as banks have shifted their activities from relatively understandable deposit-acceptance and
lending activities ie traditional financial intermediation to less easily understandable
nontraditional activities such as derivatives trading securitization and the provision of various
forms of contingent financing Banksrsquo economic exposures resulting from these activities often
exhibit concentrated or correlated risks or state-contingent liquidity requirements and these
exposures often are partly or wholly off-balance sheet (Barth et al 2009 Acharya 2014 Acharya
and Ryan 2016)10
Banksrsquo increasing economic complexity has been accompanied by increasing length and
complexity of their financial reports Accounting standard setters have written many complex and
lengthy standards for financial instruments and transactions to try to adequately portray their
10 In large part reflecting the income generated by these nontraditional activities the average bankrsquos
noninterest revenues as a percentage of net operating revenues increased from below 20 in the 1970s to
around 50 by 2009 (Barth et al 2009) A portion of this increase is attributable to generally declining
interest rates from 1981 to 2009 however
15
economics11 Despite banksrsquo provision of far more extensive financial report information in
compliance with the requirements of these standards (Guay et al 2016) we expect the individual
and collective values and risk of banksrsquo exposures to have become more difficult for banks to
convey to outsiders and for outsiders to evaluate
23 Hypotheses and Empirical Proxies
231 Engagement and Audit Risks
Auditorsrsquo decisions whether to bid for potential engagements the prices at which to bid
and the effort needed to provide the desired level of assurance depend on the risks the engagements
pose for them (Bedard and Johnstone 2004) Overall engagement risk has three interrelated
components (1) clientsrsquo business risk ie the possibility that clientsrsquo financial condition
deteriorates in the limit leading to firm failure (2) auditorsrsquo business risk ie the possibility of
litigation or reputational costs to auditors from their associations with clients and (3) audit risk
ie the possibility that auditors fail to detect material misstatements in financial statements due to
error or fraud In our investigation of whether bank regulation and supervision displace auditing
we focus on audit risk because it is the component of engagement risk that is most directly reduced
by audit effort
In the standard (textbook) model audit risk has three by construction distinct components
(1) inherent risk ie the likelihood that material misstatements of clientsrsquo financial statements
exist prior to the operation of their internal control systems (2) control risk ie the likelihood that
clientsrsquo internal control systems fail to prevent material misstatements and (3) detection risk ie
11 Notable examples of these standards include FAS 133 (1998) and FAS 161 (2009) for derivatives
(Accounting Standard Codification Section 815) and FAS 140 (2000) FIN 46(R) (2003) FAS 166 (2009)
and FAS 167 (2009) for securitizations (Accounting Standards Codification Sections 860 and 810)
16
the likelihood the auditor fails to detect material misstatements not prevented by clientsrsquo internal
control systems We expect bank regulation and supervision to reduce the inherent risk and control
risk components of audit risk and thus to reduce the incentive for auditors to expend effort on
audits of banks
232 Frequency of Internal Control and Accounting Problems
Bank supervisors monitor banksrsquo internal control and accounting systems through periodic
on-site examinations and ongoing off-site monitoring We expect this scrutiny to reduce the
inherent risk and control risk components of audit risk for audits of banks relative to audits of
control firms We formally state this hypothesis in the alternative as
Hypothesis 1 Banks exhibit fewer internal control and accounting problems than do
control firms
233 Audit Effort
It is theoretically unclear whether auditors should expend more or less effort on audits of
banks than on audits of control firms A primary reason why auditors would work more on audits
of banks is that banksrsquo greater complexity and opacity lead to their investors and contracting parties
more strongly benefiting from higher quality audits that increase the informativeness and
reliability of banksrsquo financial statements Due to this audit-demand effect higher quality audits
more strongly reduce the need for firmsrsquo investors and contracting parties to protect themselves
against uninformative or unreliable financial statement numbers by reducing the prices they are
willing to pay for firmsrsquo securities and by requiring contractual protections such as collateral
respectively To satisfy the demand for higher audit quality for audits of banks than for audits of
control firms auditors of banks must expend more effort by increasing the number of billed hours
17
andor by devoting more experienced andor specialized staff to engagements increasing the
average billed hourly fee
A primary reason why auditors would work less on audits of banks than on audits of control
firms is the overlap of the activities of bank regulators and supervisors particularly supervisorsrsquo
periodic examination and ongoing monitoring of banks with the activities of bank auditors Due
to this substitution effect auditors of banks need to perform less extensive audit planning and
substantive testing than do auditors of control firms to provide any given level of assurance We
expect the substitution effect to be more likely to dominate the audit-demand effect when bank
regulation and supervision are more intense for example when regulators and supervisors use
more sophisticated or sensitive approaches such as the Federal Reserversquos risk-focused approach
(Board of Governors of the Federal Reserve System 2017)
Although the two effects yield opposing predictions we expect that the substitution effect
generally dominates the audit demand effect because of substantial extent of the overlap of the
activities of bank regulators and particularly supervisors with those of auditors Relatedly many
aspects of bank regulation and supervision reduce the inherent and control risk components of
audit risk For example when bank supervisors determine that banks exhibit inadequate solvency
or other problems they convey the banksrsquo deficient CAMELS ratings to the banksrsquo management
and boards of directors who are responsible for resolving these problems This expectation yields
our second hypothesis stated in the alternative
Hypothesis 2 Auditors exert lower effort on audits of banks than on audits of control
firms
3 Empirical Models and Variables
31 Frequencies of Internal Control and Accounting Problems
18
We employ two dependent variables in our tests of Hypothesis 1 First we proxy for
problems in banksrsquo internal control using an indicator for material weaknesses in internal control
(Ashbaugh et al 2007) Naturally we can only observe such weaknesses if firms identify and
disclose them as FDICIA requires for banks and Sections 302 and 404 of SOX require for all
firms INTERNAL_WEAKNESS denotes firm-years with disclosed material internal control
weaknesses Second we proxy for problems in banksrsquo accounting using an indicator for financial
statement restatements which arise from GAAP violations and thus suggest audit failures
(Palmrose and Scholz 2004 Kinney et al 2004 Hennes et al 2014)12 ACC_RESTATEMENT
denotes firm-years with restatements of financial statements13 We denote
INTERNAL_WEAKNESS and ACC_RESTATEMENT collectively by Y
The main test variable in our tests of Hypothesis 1 is an indicator for banks denoted BANK
As discussed below we control for numerous client and auditor characteristics that prior research
finds are associated with internal control and accounting problems In addition when the
dependent variable Y is INTERNAL_WEAKNESS (ACC_RESTATEMENT) we control for
ACC_RESTATEMENT (INTERNAL_WEAKNESS) We denote the Y variable that is controlled for
in a given model by Y_CONTROL
12 In untabulated analysis we also proxy for both internal control and accounting problems using auditor
resignations (Krishnan and Krishnan 1997 Shu 2000 Hennes et al 2014) If banks exhibit fewer internal
control and accounting problems than do control firms bank auditors have fewer reasons to resign from
audit engagements However compared to the proxies for these problems in the tabulated analyses auditor
resignations are more likely to capture the components of engagement risk other than audit risk For
example prior research shows that auditors are more likely to resign when clients exhibit greater financial
distress (Schwartz and Soo 1995) more corporate governance problems (Lee et al 2004) and greater
litigation risk (Krishnan and Krishnan 1997 Simunic and Stein 1996)
13 All indicator variables in the paper take a value of one when a firm or firm-year exhibits the specified
condition and zero otherwise
19
Based on prior empirical research examining internal control weaknesses (Altamuro and
Beatty 2010)14 and financial statement restatements (Palmrose and Scholz 2004 Kinney et al
2004 Hennes et al 2008) we use the following logistic model to explain the probability that Y
equals one denoted Prob(Y = 1) in terms of BANK and control variables (collectively denoted
X)15
Prob(Y = 1) = eXβ (1 + eXβ) where
Xβ = β0 + β1BANK + β2LogASSETS + β3ROA + β4LOSS + β5LEVERAGE
+ β6GOODWILL + β7MampA + β8FOREIGN + β9MTB (1)
+ β10GOING_CONCERN + β11Y_CONTROL + β12BUSY_MONTH
+ β13BIG4 + β14ISPEC + year fixed effects
Because Prob(Y = 1) is not directly observable we estimate equation (1) with Y as the dependent
variable Hypothesis 1 predicts that the coefficient β1 on BANK is negative
Equation (1) controls for numerous client characteristics We selected these characteristics
based on prior research findings that firms that have less resources to invest in internal control
systems have undergone major organizational changes and are more complex or otherwise stress
auditorsrsquo capabilities exhibit more frequent internal control and accounting problems (eg Ge and
McVay 2005 Ashbaugh-Skaife et al 2007 Doyle et al 2007ab)
We control for the resources that clients have available to establish effective internal
control systems using the natural logarithm of total assets (LogASSETS) net income divided by
total assets (ROA) an indicator variable for negative net income (LOSS) and the ratio of total
14Altamuro and Beatty (2010) show how FDICIArsquos (1991) internal control requirements affected insured
depository institutions with assets of $500 million or above They do not compare the internal control
quality of banks and non-banks
15 Throughout the paper we omit firm and year subscripts for brevity
20
liabilities to total assets (LEVERAGE) We control for clientsrsquo organizational changes associated
with business acquisitions using the ratio of goodwill to total assets (GOODWILL) and an indicator
variable that equals one when goodwill increases by more than $1 million (MampA) We control for
other determinants of audit complexity using the proportion of foreign sales for control firms and
the proportion of foreign commercial loans for banks (FOREIGN) the ratio of market value of
equity to book value of equity (MTB) an indicator variable for the auditor rendering a going-
concern opinion (GOING_CONCERN) and Y_CONTROL
We control for three auditor characteristics an indicator for December fiscal year end
(BUSY_MONTH) an indicator variable for Big-Four auditor (BIG4) and the auditorrsquos market
share in the industry (ISPEC) Lastly we include fixed year effects to capture unobserved time-
related factors for both clients and auditors
Because the effects of client size may be nonlinear in tabulated specification analyses we
include indicator variables for client total assets in the following categories up to $10 billion (this
indicator is omitted as one must be) from above $10 to $50 billion (B10_50) from above $50 to
$100 billion (B50_100) from above $100 to $500 billion (B100_500) and above $500 billion
(B500) Moreover because the effects of size may vary for banks versus control firms we also
include the interactions of these size indicators with BANK
32 Audit Effort
We test Hypothesis 2 using two dependent variables that prior research indicates proxy for
auditor effort audit fees (Simunic and Stein 1996) and audit report lag (Ashton et al 1987 Bamber
et al 1993 and Ghosh and Tang 2015) Audit fees equal the number of hours worked times the
average fee per hour worked LogFEE denotes the natural logarithm of the sum of audit and audit-
related fees Auditors working more hours is positively associated with audit report lags (Bronson
21
et al 2011) LogREPORT_LAG denotes the natural logarithm of one plus the number of days
between the fiscal year end and the audit report signature date
Based on prior models for audit fees (Simunic 1980 Ghosh and Tang 2015) we use the
following model to explain LogFEE
LogFEE = β0 + β1BANK + β2LogASSETS + β3ROA + β4LOSS + β5SPECIAL_ITEMS
+ β6DISCONTINUED + β7LEVERAGE + β8INVENTORY + β9INTANGIBLES
+ β10GOODWILL + β11MampA + β12NEG_EQUITY + β13FIRM_AGE (2)
+ β14ACCEL_FILER + β15INTERNAL_WEAKNESS + β16MTB + β17RETURN
+ β18STD_RETURN + β19GOING_CONCERN + β20BUSY_MONTH
+ β21BIG4 + β22ISPEC + year fixed effects
Based on prior models for audit report lag (Ashton et al 1987 Bamber et al 1993 Bronson et al
2011 Ghosh and Tang 2015) we use the following model to explain LogREPORT_LAG
LogREPORT_LAG = β0 + β1BANK + β2LogASSETS + β3ROA + β4LOSS
+ β5DISCONTINUED + β6EXTRA_ITEMS + β7ABS_ACCRUALS
+ β8LEVERAGE + β9INVENTORY + β10FOREIGN + β11FIRM_AGE (3)
+ β12 INTERNAL_WEAKNESS + β13AUDITOR_TURNOVER
+ β14GOING_CONCERN + β15BUSY_MONTH + β16BIG4
+ year fixed effects
As in equation (1) the main test variable in equations (2) and (3) is BANK Hypothesis 2 predicts
that the coefficient β1 on BANK is negative in both equations
Equations (2) and (3) control for numerous client and auditor characteristics that prior
research finds are associated with audit fees or audit report lag respectively Many of the control
variables included in Equations (2) and (3) also appear in Equation (1) and are defined above
Equation (2) andor equation (3) include the following additional client characteristics16 Special
16 The sets of control variables in equations (2) and (3) are not identical consistent with the models
estimated in prior research
22
items divided by total assets (SPECIAL_ITEMS) an indicator for absolute value of discontinued
operations above $1 million (DISCONTINUED) and an indicator for absolute value of
extraordinary items above $1 million (EXTRA_ITEMS) capture transitory earnings items The
absolute value of accruals divided by total assets (ABS_ACCRUALS) captures other dimensions of
earnings quality The ratio of inventory to total assets (INVENTORY) and the ratio of intangible
assets to total assets (INTANGIBLES) capture balance sheet composition An indicator for negative
common equity (NEG_EQUITY) and the number of years the firm is listed on Compustat
(FIRM_AGE) capture early-stage or otherwise risky firms An indicator for accelerated filer
(ACCEL_FILER) and an indicator for auditor turnover during the year (AUDITOR_TURNOVER)
capture other auditing stresses Fiscal year stock return (RETURN) and the standard deviation of
monthly stock returns (STD_RETURN) capture the aggregate level and the volatility respectively
of exogenous shocks occuring during the fiscal year
As for equation (1) in tabulated specification analyses we include indicator variables for
client total assets in the various size categories and we also include the interactions of these size
indicators with BANK
33 Earnings Management of Minor Concern to Bank Regulators and Supervisors
As discussed in the introduction we expect bank regulators and supervisors to be relatively
unconcerned about types of earnings management that accumulate to relatively small amounts of
retained earnings Such earnings management has minor effects on banksrsquo solvency ratios and so
should not appreciably affect supervisorsrsquo evaluations of banksrsquo safety and soundness We expect
that if bank regulation and supervision leads to lower audit effort in audits of banks than in audits
of control firms as predicted in Hypothesis 2 banks engage more in these types of earnings
23
management than do control firms Motivated by Burgstahler and Dichev (1997) Beatty et al
(2002) and Graham et al (2005) we examine two proxies for such earnings management
First we examine the frequency of small (from 0 to 001) increases in return on equity
(SMALL_POS)17 Based on Beatty et al (2002) we use the following logistic model to explain
SMALL_POS
Prob(SMALL_POS= 1) = eXβ (1 + eXβ) where
Xβ = β0 + β1BANK + β2LogASSETS + β3LEVERAGE + β4MTB (4)
+ β5ACCEL_FILER + β6BIG4 + year fixed effects
We expect the coefficient β1 on BANK to be positive
Second we examine the length of the longest string of consecutive earnings increases for
each firm (STRING) Based on Beatty et al (2002) we use the following Cox proportional hazard
model to explain STRING
h(STRING|X)= h0(STRING) eXβ where
Xβ= β0 + β1BANK + β2LogASSETS + β3LEVERAGE +β4MTB + β5ACCEL_FILER (5)
+ β6INTERNAL_WEAKNESS + β7BIG4 + year fixed effects
h(STRING|X) denotes the hazard function and h0(STRING) denotes the baseline hazard function
We expect the coefficient β1 on BANK to be positive
17 Specifically we compute return on equity (ROE) as net income divided by common equity SMALL_POS takes a
value of one if the change in ROE is greater than zero but smaller than or equal to 001 and zero otherwise
24
4 Data and Sample Selection
41 Data
We obtain audit fee audit report signature date auditor change internal control weakness
and restatement data from Audit Analytics We obtain financial statement data from Compustatrsquos
annual Bank and North American files We obtain geographic and foreign segment data from
Compustatrsquos Segment file If a given firm-year is available in Compustatrsquos Bank file we classify
the firm-year observation as a bank
Our sample covers the fifteen-year period from 2000 to 2014 The sample period begins in
2000 because audit fees are unavailable prior to that year Because SOX-mandated internal control
weakness data become available in 2004 our analysis of internal control weaknesses is limited to
the eleven-year period from 2004 to 2014 We restrict the sample to firm-year observations with
complete data on audit fees auditor identification and audit report signature date from Audit
Analytics as well as on total assets (item AT) total liabilities (item LT) total common equity (item
CEQ) net income (item NI) closing price (item PRCC) and common shares outstanding (item
CSHO) from Compustat These data requirements yield 7914 bank-year observations (965 unique
banks) 671 firm-year observations in SIC 61 (104 unique firms) and 3111 firm-year observations
in the top five percent of the ratio of accounts receivable to total assets (812 unique firms) from
2000ndash2014 The internal control weakness sample includes 5581 bank-year observations 483
firm-year observations for the SIC 61 control sample and 2254 firm-year observations for the top
five percent of the ratio of accounts receivable to total assets control sample from 2004ndash2014
42 Descriptive Statistics
Table 1 reports means for each of the dependent variables (above the line) and each of the
independent variables (below the line) in equations (1)-(5) for the bank sample SIC 61 control
25
sample and highest 5 ratio of accounts receivable to assets control sample Significant
differences of the means for the bank sample versus the SIC 61 control sample and for the bank
sample versus the highest 5 ratio of accounts receivable to assets control sample are indicated in
the columns for the control samples
The differences of the means for the dependent variables are uniformly significant and
consistent with our hypotheses that banks exhibit fewer internal control and accounting problems
than do control sample firms as well as our expectations that banks engage in more of certain types
of earnings management than do control sample firms Consistent with Hypothesis 1 banks are
less likely than both control samples to disclose material internal control weaknesses
(INTERNAL_WEAKNESS) and to restate their financial statements (ACC_RESTATEMENT)
Consistent with Hypothesis 2 on average audit fees (FEE) are lower and audit report lags
(REPORT_LAG) are shorter for banks than for both control samples Consistent with our
expectations for earnings management banks are more likely to report small positive earnings
changes (SMALL_POS) and on overage report longer strings of positive earnings (STRING)
Most of the differences of the means for the independent variables are also significant For
most of these variables the means for banks are closer to those of the a priori more analogous SIC
61 control sample than to those of the highest 5 ratio of accounts receivable to assets control
sample Accordingly we discuss only the former mean differences Compared to the SIC 61
control sample on average banks are smaller (ASSETS) are more profitable (ROA) and have
fewer losses (LOSS) have fewer transitory earnings items (SPECIAL_ITEMS DISCONTINUED
and EXTRA_ITEMS) and lower absolute accruals (ABS_ACCRUALS) have higher financial
leverage (LEVERAGE) have lower non-financial assets (INVENTORY INTANGIBLES and
GOODWILL) despite engaging in more mergers and acquisitions (MampA) are less likely to have
26
negative equity (NEG_EQUITY) or foreign operations (FOREIGN) have insignificantly different
age (AGE) have lower expected growth (MTB) experience lower exogenous shocks (RETURN
and STD_RETURN) and receive fewer going-concern opinions (GOING_CONCERN)
Compared to the SIC 61 control sample on average banks exhibit one characteristic that
stress auditorsrsquo capabilities more frequent December fiscal year-ends (BUSY_MONTH)
However on average banks are less likely to be accelerated filers (ACCEL_FILER) are less likely
to be audited by a Big 4 auditor (BIG4) are less likely to have auditors with high relative industry
market share (ISPEC) and experience less auditor turnover (AUDITOR_TURNOVER)
5 Empirical Results
51 Frequencies of Internal Control and Accounting Problems
Hypothesis 1 predicts that due to bank regulation and supervision banks exhibit fewer
internal control and accounting problems than do similar unregulated firms To test this hypothesis
Tables 2 and 3 report logistic estimations of equation (1) with the dependent variables
INTERNAL_WEAKNESS and ACC_RESTATEMENT respectively18 We report the estimation of
each model for the combined bank sample and SIC 61 control sample in the left column of the
table and for the combined bank sample and highest 5 ratio of accounts receivable to assets
control sample in the right column of the table
We estimate each model in two different ways Panel A of each table reports the estimation
of the base model To better control for size differences between the bank and control samples
Panel B of each table reports estimations of the equations replacing LogASSETS with the client
18 In untabulated analyses we also examine adverse restatements that reduce ownersrsquo equity and auditor
resignations We find results consistent with those reported in the paper
27
size category indicators (B10_50 B50_100 B100_500 and B500) both separately and interacted
with BANK The coefficient on BANK captures the total effect for the smallest banks (assets less
than $10 billion) The coefficient on the interaction of BANK with a given size category indicator
captures the effect for the banks in that size category incremental to the effect for the smallest
banks The sum of the coefficients on BANK and on the interaction of BANK with a given size
category indicator captures the total effect for the banks in that size category
The model fits and the coefficients on the control variables generally are as expected based
on prior research For simplicity we primarily discuss the statistical and economic significance of
the coefficient β1 on BANK estimated on the combination of the bank sample and the more
analogous SIC 61 control sample reported in the left column of Panel A of the tables We point
out any notable differences of the results for the other models All of these differences pertain to
the coefficients on BANK and the interactions of BANK with the size category indicators in Panel
B which typically indicate that the effects we document are limited to certain size categories In
particular no notable differences arise from the use of different control samples in the estimations
reported in the left and right columns of the tables In discussing economic significance we focus
on eβ1 the differential frequency of internal control and accounting problems for banks versus non-
banks
Examining the estimation of equation (1) with dependent variable
INTERNAL_WEAKNESS reported in the left column of Panel A of Table 2 we find that the
coefficient on BANK is negative (-0781) and significant at the 1 level This coefficient implies
that banks disclose material internal control weaknesses with only 46 of the frequency of SIC
control sample firms controlling for other factors that prior research finds are associated with
28
internal control weaknesses These results are consistent with Hypothesis 1 that bank regulation
and supervision reduce the frequency of banksrsquo internal control problems
In left column of Panel B of Table 2 the coefficient on BANK is negative as expected but
insignificant Notice however that the coefficients on the interactions of BANK with all of the
size category indicators are also negative with these coefficients being significant at the 1 and
10 levels for the interactions of BANK with B10_50 and B50_100 respectively The sum of the
coefficients on BANK and BANKtimesB10_50 is significantly negative at the 1 level and the sum of
the coefficients on BANK and BANKtimesB50_100 is significantly negative at the 10 level These
results imply that banks with assets from $10 billion to $100 billion disclose significantly fewer
internal control weaknesses than do similarly sized control firms consistent with Hypothesis 1
whereas banks in other size categories disclose internal control weaknesses with insignificantly
different frequency
Examining the estimation of equation (1) with dependent variable ACC_RESTATEMENT
reported in the left column of Panel A of Table 3 we find that the coefficient on BANK is negative
(-1075) and significant at the 1 level This coefficient implies that banks report financial
statement restatements with only 34 of the frequency of SIC 61 control sample firms controlling
for other factors that prior research finds are associated with restatements These results are
consistent with Hypothesis 1 that bank regulation and supervision reduce the frequency of banksrsquo
accounting problems
In the left column of Panel B of Table 3 the coefficient on BANK is negative as expected
but insignificant Again notice however that the coefficients on the interactions of BANK with all
of the size category indicators are also negative with the coefficient on the interaction of BANK
with B10_50 significant at the 5 level The sum of the coefficients on BANK and its interaction
29
with B10_50 is significantly negative at the 1 level and the sum of the coefficients on BANK and
its interaction with B100_500 is significantly negative at the 10 level These results imply that
banks with assets from $10 billion to $50 billion and from $100 billion to $500 billion report
significantly fewer accounting restatements than similarly sized control firms consistent with
Hypothesis 1 whereas banks in other size categories report accounting restatements with
insignificantly different frequency
Collectively the results reported in Tables 2 and 3 for disclosed material internal control
weaknesses and accounting restatements are consistent with bank regulation and supervision
rendering engagements for audits banks less risky than for audits of control sample firms for some
size categories and insignificantly differently risky for other size categories
52 Audit Effort
Hypothesis 2 predicts that bank regulation and supervision lead bank auditors to expend
less effort We proxy for (lower) audit effort using (lower) audit fees and (shorter) audit report
lags To test this hypothesis Table 4 reports OLS estimations of equation (2) that explain the
natural logarithm of audit fees (LogFEE) while Table 5 reports OLS estimations of equation (3)
that explain the natural logarithm of the number of days between the fiscal year end and the audit
report signature date (LogREPORT_LAG) The structures of Tables 4 and 5 are the same as those
of Tables 2 and 3 The left columns of the tables report the estimations for the combined bank
sample and SIC 61 control sample The right columns of the tables report the estimations for the
combined bank sample and highest 5 ratio of accounts receivable to assets control sample Panel
A of the tables report the estimation of the base model and Panel B of the tables report the
estimation of the models that include the size category indicators both separately and interacted
with BANK As for the analyses of internal control and accounting problems discussed in Section
30
51 the model fits and the coefficients on the control variables generally are as expected based on
prior literature so we discuss only the statistical and economic significance of the coefficients β1
on BANK in Panel A and of the coefficients on BANK and the interactions of BANK with the size
category indicators in Panel B
Examining the estimation of equation (2) with dependent variable LogFEE reported in the
left column of Panel A of Table 4 we find that the coefficient on BANK is negative (-0705) and
significant at the 1 level This coefficient implies that on average audit fees for banks are only
49 of that for SIC 61 control sample firms controlling for other factors that prior research finds
are associated with audit fees These results are consistent with Hypothesis 2rsquos prediction that bank
regulation and supervision lead to reduced audit effort
In both columns of Panel B of Table 4 the coefficient on BANK is significantly negative
as expected However the coefficient on the interactions of BANK with the largest size category
B500 is significantly positive and of similar absolute magnitude as the coefficient on BANK As a
result the coefficient on the sum of BANK and its interaction with B500 is insignificantly different
from zero whereas the sum of the coefficients on BANK and its interactions with each of the other
size indicators is significantly negative These results imply that relative to similarly sized control
firms audit effort is lower for banks with assets up to $500 billion and audit effort is
insignificantly different for banks with assets exceeding $500 billion The latter result is consistent
with the (relatively few) banks in the largest (money center) size category experiencing elevated
audit fees compared to non-banks of the same size
Examining the estimation of equation (2) with dependent variable LogREPORT_LAG
reported in the left column of Panel A of Table 5 we find that the coefficient on BANK is negative
(-0101) and significant at the 1 level This coefficient implies that on average audit report lag
31
for banks is only 90 of that for SIC 61 control sample firms controlling for other factors that
prior research finds are associated with audit report lag These results are consistent with
Hypothesis 2rsquos prediction that bank regulation and supervision lead to reduced audit effort
In both columns of Panel B of Table 5 the coefficient on BANK is significantly negative
as expected However the coefficients on the interactions of BANK with all of the size categories
are positive often significantly so and of similar absolute magnitude as the coefficient on BANK
As a consequence none of the sums of the coefficients on BANK and its interactions with the size
category indicators is significant These results imply that relative to similarly sized control firms
audit report lag is shorter and thus audit effort is lower for banks with assets up to $10 billion and
audit report lag is insignificantly different for banks with assets exceeding $10 billion
Collectively the audit fee and audit report lag estimation results reported in Tables 4 and
5 provide evidence consistent with bank regulation and supervision leading auditors to expend
lower audit effort on audits of banks in certain size categories
53 Identification Tests for the Audit Fee Model
To provide support for bank regulation and supervision as causally explaining the reduced
audit effort in bank audits that we document in Tables 4 and 5 we estimate expansions of equation
(2) explaining the natural logarithm of audit fees and equation (3) explaining the natural logarithm
of log audit report lag that include time-series or cross-sectional proxies for the intensity of bank
regulation and we test whether audit effort is lower when regulatory intensity is higher As the
inferences generated are similar to conserve space we tabulate and discuss only the results for the
expanded audit fee model
Table 6 reports OLS estimations of equation (2) with LogFEE as the dependent variable
expanded to include one of two measures of time-series measures of bank regulation intensity The
32
sample is limited to 7914 bank-year observations (965 unique banks) from 2000 to 2014 so BANK
is dropped from the equation The first bank regulation intensity measure is based on RegData an
industry- and year-specific regulation index constructed by Al-Ubaydli and McLaughlin (2017)
from textual analysis of the number of constraints (the strings ldquoshallrdquo ldquomustrdquo ldquomay notrdquo
ldquoprohibitedrdquo and ldquorequiredrdquo) in the Code of Federal Regulations (CFR) The measure used is the
natural logarithm of the number of constraints in CFR Title 12 for the banking industry each year
(LogRESTRICTIONS) The second measure is the natural logarithm of the annual budget (in $
millions) of the ldquofinance and bankingrdquo subcategory (which includes the Comptroller of the
Currency Federal Deposit Insurance Corporation and Securities and Exchange Commission)
from Regulatory Reports available at httpswcwustleduregulatory_reports (LogBUDGET)
Figure 1 depicts the evolutions of LogRESTRICTIONS and LogBUDGET from 2000-2014 Panel
A of Table 6 reports descriptive statistics of the two measures of bank regulation intensity
The left (right) columns of Table 6 report the estimation of equation (2) adding
LogBUDGET (LogRESTRICTIONS) to the model The coefficients on LogBUDGET and
LogRESTRICTIONS are both significantly negative at the 1 level consistent with more intense
bank regulation leading to lower audit fees
Table 7 reports the OLS estimations of equation (2) with LogFEE as the dependent variable
expanded to include Agarwal et alrsquos (2014) measure of regulatory leniency (ie inverse intensity)
across state-chartered banks (STATE_REG) This measure is based on the ldquoalternating examination
programrdquo in which state-chartered banks are examined by (more stringent) federal supervisors (the
FDIC or Federal Reserve) and state supervisors in rotation Using a proprietary database Agarwal
et al (2014) estimate the differential examination stringency of federal supervisors versus 44 state
supervisors The left column reports the estimation of an expanded model that includes
33
STATE_REG linearly This model is estimated on 5679 state bankndashyear observations (738 unique
banks) from 2000 to 2014 The right column reports the estimation of an expanded model that
includes STATE_REG both linearly and interacted with an indicator for state-chartered banks
(STATE_BANK) obtained from the FDIC website
(httpswww5fdicgovidaspadvSearchLandingasp) This model is estimated on 7340 (federal
and state) bankndashyear observations (903 unique banks) from 2000 to 2014 The coefficient on
STATE_REG in the left column and the coefficient on STATE_REGtimesSTATE_BANK in the right
column of the table are both significant positive at the 5 level consistent with more lenient state
regulation yielding higher audit fees
Overall the expanded audit fee model estimation results reported Tables 6 and 7 provide
evidence consistent with (more intense) bank regulation and supervision causally explaining the
(more strongly) reduced audit effort in bank audits that we document in Tables 4 and 5
53 Types of Earnings Management of Minor Concern to Bank Regulators and Supervisors
If bank regulation and supervision leads to lower audit effort banks should have more
ability to exercise accounting discretion to manage accounting numbers in ways that do not
significantly concern bank regulators and supervisors Drawing on Beatty et al (2002) we
examine two types of earnings management the frequency of small positive earnings
(SMALL_POS) and the length of the longest string of consecutive earnings increases (STRING)19
We conjecture that these types of earnings management typically accumulate to relatively small
amounts of retained earnings If so these types have relatively minor effects on banksrsquo solvency
19 A side benefit of our use of these earnings management measures is that they are just as naturally applied
to banks as to non-banks In contrast the most commonly used measures of earnings management in the
literature (Jones 1991 Dechow and Dichev 2002) are not as naturally applied to banks
34
ratios and so should be of minor concern to bank regulators and supervisors primarily concerned
with banksrsquo safety and soundness While we are unaware of any supporting empirical evidence for
our conjecture it is consistent with the absence of any mention of these types of earnings
management in bank supervisory manuals including the portions devoted to the evaluation of
earnings quality (Comptroller of the Currency 2007 p 53 Board of Governors of the Federal
Reserve System 2017 sect40203) In contrast based on the large empirical literature documenting
such earnings management and its capital market consequences by public firms in general and by
public banks in particular (Burgstahler and Dichev 1997 Beatty et al 2002 Bartov et al 2002
Brown and Caylor 2005) we expect these types of earnings management to significantly influence
banksrsquo investors and contracting parties and to be of concern to auditors
To test for differences in SMALL_POS for banks versus the firms in the control samples
Table 8 reports the logistic estimation of equation (4) with SMALL_POS as the dependent variable
for the combined BANK sample and SIC 61 control sample (left column) and for the combined
BANK sample and highest 5 ratio of accounts receivable to assets control sample (right column)
A positive coefficient β1 on BANK implies that banks exhibit more frequent small positive earnings
changes than do control firms consistent with bank regulation and supervision leading to lower
bank audit effort In both columns the coefficient on BANK is significantly positive at the 1
level The coefficient in the left (right) column implies that banks report small positive earnings
44 (25) times as frequently as the corresponding control sample firms controlling for other
variables that prior research shows are associated with the frequency of small positive earnings
To test for differences in STRING for banks versus control firms Table 9 reports the
estimation of equation (3) using the Cox proportional hazard approach for the combined BANK
sample and SIC 61 control sample (left column) and for the combined BANK sample and highest
35
5 ratio of accounts receivable to assets control sample (right column) The Cox proportional
hazard approach accounts for the right-censoring of STRING arising from our sample ending in
2014 A positive coefficient β1 on BANK implies that banks exhibit earnings strings with
incrementally longer length than do control firms consistent with bank regulation and supervision
leading to lower bank audit effort In both columns the coefficient on BANK is significantly
positive at the 1 level The coefficient in the left (right) column implies that banks report strings
of positive earnings that are 47 (94) longer than the corresponding control sample firms
controlling for other variables that prior research shows are associated with the length of earnings
strings
Collectively the results from Tables 8 and 9 indicate that compared to control firms banks
are more likely to engage in types of earnings management of minor concern to bank regulators
and supervisors consistent with bank regulation and supervision leading to lower audit effort in
audits of banks
6 Conclusion
A central feature of banks is they are regulated and supervised under numerous banking
laws and regulations Moreover bank supervision involves periodic on-site examinations and off-
site monitoring activities that overlap considerably with auditing activities In this paper we
examine whether bank regulation and supervision displace bank auditing leading to lower audit
effort in audits of banks than in audits of two control samples of similar unregulated firms (1)
non-depository credit institutions (two-digit SIC code 61) and (2) all non-banks in the highest five
percent of the ratio of accounts receivable (which includes loan and lease receivables) to total
assets Our results are consistent with bank regulation and supervision substituting for auditing
36
ie with audit effort being significantly lower in audits of banks than in audits of control sample
firms
We first provide evidence that banking engagements pose less risk to auditors We show
that banks are significantly less likely than control sample firms to disclose material weaknesses
in internal controls and to restate their financial statements controlling for the variables that prior
research shows to be associated with material internal control weaknesses and restatements We
then provide evidence consistent with auditors exerting less effort on audits of banks than on audits
of control sample firms We show that banks exhibit statistically and economically lower audit
fees and shorter audit report lags than do control sample firms controlling for the variables that
prior research shows to be associated with audit fees and audit report lags
We acknowledge that the primary threat to inference in our study is the possibility that
factors other than bank regulation and supervision might explain why audits of banks pose less
audit risk than do audits of control firms Although we cannot rule out this possibility altogether
we conduct two sets of tests to provide support for the conclusion that the associations we
document are causal First we provide evidence that bank auditors expend less effort when bank
regulation and supervision are more intense We use two time-series measures based on the text
of banking regulations and the annual budget of federal regulators and one cross-sectional measure
based on Agarwal et al (2014) of the intensity of bank regulation and supervision Second we
provide evidence that banks are more likely to engage in two types of earnings management that
are of minor concern to bank regulators and supervisors but that prior research shows have capital
market consequences (Bartov et al 2002 Brown and Caylor 2005) We find that banks report more
frequent small positive earnings and longer strings of earnings increases than do similar firms
37
We contribute to the banking and auditing literatures by providing evidence consistent
with auditors expending less effort in auditing banks than in auditing control sample firms due
to the overlap of the activities of bank regulators and supervisors with those of auditors We
emphasize that our evidence does not suggest that the aggregate monitoring of banksrsquo financial
reporting by bank regulators supervisors and auditors differs from the monitoring of similar
firmsrsquo financial reporting by auditors alone it only suggests that the monitoring conducted by
bank auditors is less Because of the importance of banks to stability and overall macroeconomic
health a compelling question is what incremental costs arise when bank auditors as financial
reporting specialists expend less effort on bank audits due to the existence of bank regulation
and supervision We provide evidence that this reduced effort leads to types of earnings
management that likely have minor effects on banksrsquo solvency ratios but have capital market
consequences documented by prior research that may lead to reduced market discipline over
banks We expect these results to be of interest to bank and auditing policymakers
38
References
Acharya V and S Ryan 2016 Banksrsquo financial reporting and financial system stability Journal
of Accounting Research 54 277ndash340
Acharya V 2014 A transparency standard for derivatives Chapter 6 in Risk Topography
Systematic Risk and Macro Modeling edited by M Brunnermeier and A Krishnamurthy
National Bureau of Economic Research University of Chicago Press 2014
Agarwal S D Lucca A Seru and F Trebbi 2014 Inconsistent regulators Evidence from
banking Quarterly Journal of Economics 129 889ndash938
Altamuro J and A Beatty 2010 How does internal control regulation affect financial reporting
Journal of Accounting and Economics 49 58ndash74
Al-Ubaydli O and P McLaughlin 2017 RegData A numerical database on industry-specific
regulations for all United States industries and federal regulations 1997-2012 Regulation
amp Governance 11 109-123
Ashbaugh-Skaife H D Collins and W Kinney Jr 2007 The discovery and reporting of internal
control deficiencies prior to SOX-mandated audits Journal of Accounting and Economics
44 166ndash192
Ashton R J Willingham and R Elliot 1987 An empirical analysis of audit delay Journal of
Accounting Research 25 275ndash292
Avraham D P Selvaggi and J Vickrey 2012 A structural view of US bank holding companies
Federal Reserve Bank of New York Economic Policy Review 18 65ndash81
Badertscher B J Burks and P Easton 2016 The market reaction to bank regulatory filings
Working paper University of Notre Dame
Bamber E L Bamber and M Schoderbek 1993 Audit structure and other determinants of audit
report lag An empirical analysis Auditing A Journal of Practice and Theory 12 1ndash23
Barth J T Li and W Lu 2009 Bank regulation in the United States CESifo Economic Studies
10 2ndash29
Barth M and W Landsman 2010 How did financial reporting contribute to the financial crisis
European Accounting Review 19 399-433
Bartov E D Givoly and C Hayn 2002 The rewards to meeting or beating earnings expectation
Journal of Accounting and Economics 33 (2) 173-204
39
Beatty A B Ke and K Petroni 2002 Earnings management to avoid earnings declines across
publicly and privately held banks The Accounting Review 77 547ndash570
Beatty A and S Liao 2014 Financial accounting in the banking industry A review of the
empirical literature Journal of Accounting and Economics 58 339ndash383
Bedard J and K Johnstone 2004 Earnings manipulation risk corporate governance risk and
auditorsrsquo planning and pricing decisions The Accounting Review 79 277ndash304
Bell T W Landsman and D Shackelford 2001 Auditorsrsquo perceived business risk and audit
fees Analysis and evidence Journal of Accounting Research 39 35ndash43
Board of Governors of the Federal Reserve Board System 2017 Bank Holding Company
Supervision Manual Division of Banking Supervision and Regulation
httpswwwfederalreservegovpublicationssupervision_bhchtm
Bronson S C Hogan M Johnson and K Ramesh 2011 The unintended consequences of
PCAOB auditing standard nos 2 and 3 on the reliability of preliminary earnings releases
Journal of Accounting and Economics 51 95ndash114
Brown L and M Caylor 2005 A temporal analysis of quarterly earnings thresholds Propensities
and valuation consequences The Accounting Review 80 (2) 423-440
Burgstahler D and I Dichev 1997 Earnings management to avoid earnings decreases and losses
Journal of Accounting and Economics 24 99ndash126
Comptroller of the Currency 2007 (last updated 2017) Bank supervision process Comptrollerrsquos
handbook
Costello A J Granja and J Weber 2016 Do strict regulators increase the transparency of the
banking system Working paper Massachusetts Institute of Technology
Dang T G Gorton B Holmstroumlm and Ordontildeez G 2014 Banks as secret keepers PIER working
paper no 14-022
Dechow P and I Dichev 2002 The quality of accruals and earnings The role of accrual
estimation errors The Accounting Review 77 35ndash59
DeFond M and J Zhang 2014 A review of archival auditing research Journal of Accounting
and Economics 58 275ndash326
Diamond D 1984 Financial intermediation and delegated monitoring Review of Economic
Studies 51 393ndash414
40
Doyle J W Ge and S McVay 2007a Accruals quality and internal control over financial
reporting The Accounting Review 82 1141ndash1170
Doyle J W Ge and S McVay 2007b Determinants of weaknesses in internal control over
financial reporting Journal of Accounting and Economics 44 193ndash223
Flannery M S Kwan and M Nimalendran 2013 The 2007ndash2009 financial crisis and bank
opaqueness Journal of Financial Intermediation 22 55ndash84
Francis J E Maydew and H Sparks 1999 The role of big 6 auditors in the credible reporting
of accruals Auditing A Journal of Practice and Theory 18 17ndash34
Gallemore J 2016 Bank financial reporting opacity and regulatory intervention Working paper
University of Chicago
Ge W and S McVay 2005 The disclosure of material weaknesses in internal control after the
Sarbanes-Oxley Act Accounting Horizons 19 137ndash158
Ghosh A and C Tang 2015 Assessing financial reporting quality of family firms The auditorsrsquo
perspective Journal of Accounting and Economics 60 95ndash116
Graham J C Harvey and S Rajgopal 2005 The economic implications of corporate financial
reporting Journal of Accounting and Economics 40 3ndash73
Guay W D Samuels D Taylor 2016 Guiding through the fog Financial statement complexity
and voluntary disclosure Journal of Accounting and Economics 62 234ndash269
Hennes K A Leone and B Miller 2014 Determinants and market consequences of auditor
dismissals after accounting restatements The Accounting Review 89 1051ndash1082
Holmstroumlm B 2015 Understanding the role of debt in the financial system BIS working paper
no 479
Houston R M Peters and J Pratt 1999 The audit risk model business risk and audit‐planning
decisions The Accounting Review 74 281ndash298
Jensen M and W Meckling Theory of the firm Managerial behavior agency costs and
ownership structure Journal of Financial Economics 3 305ndash360
Jones J 1991 Earnings management during import relief investigations Journal of Accounting
Research 29 193ndash228
Keeley J 2017 The impact of regulatory enforcement on bank risk Working paper New York
University
41
Kinney W Palmrose Z and S Scholz 2004 Auditor independence non-audit services and
restatements Was the US government right Journal of Accounting Research 42 561ndash588
Krishnan J and J Krishnan 1997 Litigation risk and auditor resignations The Accounting
Review 72 539ndash560
Lee H V Mande and R Ortman 2004 The effect of audit committee and board of director
independence on auditor resignation Auditing A Journal of Practice and Theory 23 (2)
131ndash146
Morgan D 2002 Rating banks Risk and uncertainty in an opaque industry The American
Economic Review 92 874ndash888
Myers S 1977 Determinants of corporate borrowing Journal of Financial Economics 5 147-
175
Nicoletti A 2016 The effects of auditors and regulators on bank financial reporting Evidence
from loan loss provisions Doctoral dissertation Ohio State University
Nier E and U Baumann 2006 Market discipline disclosure and moral hazard in banking
Journal of Financial Intermediation 15 332ndash361
Palmrose Z and S Scholz 2004 The circumstances and legal consequences of non-GAAP
reporting Evidence from restatements Contemporary Accounting Research 21 139ndash180
Pettway R and J Sinkey 1980 Establishing on-site bank examination priorities An early-
warning system using accounting and market information Journal of Finance XXXV 137ndash
150
Public Company Accounting Oversight Board (PCAOB) Auditing Standard No 8 Audit Risk
Washington DC PCAOB
Public Company Accounting Oversight Board (PCAOB) Auditing Standard No 12 Identifying
and Assessing Risks of Material Misstatement Washington DC PCAOB
Public Company Accounting Oversight Board (PCAOB) Auditing Standard No 13 The
Auditorrsquos Responses to the Risks of Material Misstatement Washington DC PCAOB
Richardson M K Schoenholtz B Tuckman and L White eds 2017 Regulating Wall Street
CHOICE Act vs Dodd-Frank New York Center for Global Economy and Business NYU
Stern School of Business
Ryan S 2007 Financial Instruments and Institutions Accounting and Disclosure Rules Second
edition John Wiley and Sons Hoboken NJ
42
Ryan S 2011 Financial reporting for financial instruments Foundations and Trends in
Accounting 6 187ndash354
Schwartz K and B Soo 1995 An analysis of Form 8-K disclosures of auditor changes by firms
approaching bankruptcy Auditing A Journal of Practice and Theory 14 124ndash136
Shu S Auditor resignations Clientele effects and legal liability Journal of Accounting and
Economics 29 173-205
Simunic D 1980 The pricing of audit services Theory and evidence Journal of Accounting
Research 18 161ndash190
Simunic D and M Stein 1996 The impact of litigation risk on audit pricing A review of the
economics and the evidence Auditing A Journal of Practice and Theory 15 (Supplement)
119ndash134
Watts R L and J L Zimmerman 1986 Positive Accounting Theory Prentice-Hall Inc
43
Table 1 Variable means for banks versus control firms
CONTROL BANK SIC61 High RECAT Mean Mean Difference Mean Difference INTERNAL_WEAKNESS 0024 0051 0026 0066 0042 ACC_RESTATEMENT 0006 0022 0016 0020 0014 FEE ($ million) 1643 6199 4555 3119 1476 REPORT_LAG 59325 68854 9530 68110 8785 SMALL_POS 0174 0063 ndash0111 0063 ndash0110 STRING 5608 4500 ndash1108 3347 ndash2261 ASSETS ($ billion) 39135 102555 63420 30418 8717 ROA 0006 ndash0006 ndash0012 ndash0008 ndash0014 LOSS 0108 0249 0141 0274 0167 SPECIAL_ITEMS ndash0001 ndash0015 ndash0015 ndash0020 ndash0019 DISCONTINUED 0029 0162 0134 0105 0077 EXTRA_ITEMS 0011 0048 0036 0031 0019 ABS_ACCRUALS 0027 0092 0065 0107 0080 LEVERAGE 0902 0722 ndash0180 0610 ndash0292 INVENTORY 0013 0056 0043 0071 0058 INTANGIBLES 0012 0039 0026 0074 0061 GOODWILL 0010 0019 0010 0056 0047 MampA 0198 0152 ndash0046 0228 0030 NEG_EQUITY 0003 0025 0023 0038 0035 FOREIGN 0040 0121 0081 0193 0153 FIRM_AGE 14340 14735 0395 18011 3671 ACCEL_FILER 0626 0689 0063 0608 ndash0018 MTB 1437 1700 0263 2601 1164 RETURN 0106 0171 0065 0179 0073 STD_RETURN 0084 0144 0060 0154 0070 GOING_CONCERN 0006 0015 0009 0028 0022 BUSY_MONTH 0879 0790 ndash0089 0715 ndash0164 BIG4 0444 0668 0224 0630 0185 ISPEC 0115 0166 0051 0162 0046 AUDITOR_TURNOVER 0072 0079 0007 0093 0021
This table reports variable means for the BANK and two CONTROL samples as well as the differences of variable means across the BANK and each CONTROL sample over the period 2000ndash2014 Inclusion in the BANK sample is based on inclusion in the Compustat Bank file (7914 bank-year observations) The SIC61 sample includes non-depository credit institutions with two-digit standard industry classification (SIC) code 61 on the Compustat Annual North American file (671
44
firm-year observations) The High RECTA control sample includes non-bank firms with a ratio of accounts receivable to total assets in the top 5 of the Compustat Annual North American file (3110 firm-year observations) All variables are measured for a given firm-year unless indicated otherwise The dependent variables are reported above the line in the table and are defined as follows INTERNAL_WEAKNESS = 1 if the firm disclosed internal control deficiencies and 0 otherwise ACC_RESTATEMENT = 1 if the firm subsequently restated its 10-K filing for the fiscal year and 0 otherwise FEE = the sum of audit fees and audit-related fees in $ millions REPORT_LAG = the number of days between the fiscal year-end date and auditor signature date (the natural logarithm of this variable is used in the regression analyses) SMALL_POS = 1 if a small ROE increase (000lt∆R0Ele001) is reported STRING = the duration of the longest string of consecutive annual earnings increases for the firm The control variables are reported below the line in the table and are defined as follows ASSETS = total assets ROA = net income divided by total assets LOSS = 1 if the firm reports negative net income and 0 otherwise SPECIAL_ITEMS = special items divided by total assets DISCONTINUED = 1 if discontinued operations exceeds $1 million and 0 otherwise EXTRA_ITEMS = 1 if (absolute) extraordinary items exceeds $1 million and 0 otherwise ABS_ACCRUALS = absolute value of accruals divided by total assets LEVERAGE = total liabilities divided by total assets INVENTORY = inventory divided by total assets INTANGIBLES = intangibles assets divided by total assets GOODWILL = goodwill divided by total assets MampA = 1 if goodwill increases by more than $1 million and 0 otherwise NEG_EQUITY = 1 if common equity is negative and 0 otherwise FOREIGN = 1 if a company reports non-zero foreign exchange income and 0 otherwise FIRM_AGE = the number of years a company is listed in Compustat ACCEL_FILER = 1 if the company is an accelerated filer and 0 otherwise MTB = market value of equity divided by book value of equity RETURN = fiscal year stock return STD_RETURN = standard deviation of monthly stock returns GOING_CONCERN = 1 if the firm received a goingndashconcern modified opinion and 0 otherwise BUSY_MONTH = 1 if the fiscal year-end month is December and 0 otherwise BIG4 = 1 if the company is audited by one of the Big-Four auditors and 0 otherwise ISPEC = auditorrsquos relative market share of audit fees in the clientrsquos FamandashFrench 48 industry classification AUDITOR_TURNOVER = 1 if the firmrsquos auditor changed during the year and 0 otherwise and denote significantly different variable means for the BANK and each CONTROL sample at the 1 5 and 10 levels respectively
45
Table 2 Likelihood of material internal control weaknesses for banks versus control firms
Panel A Logistic estimation of likelihood of material internal control weaknesses CONTROL SIC61 High RECTA BANK ndash0781 (0002) ndash0556 (0001) LogASSETS 0053 (0301) 0014 (0681) ROA 1208 (0441) 0138 (0718) LOSS 1469 (0000) 1335 (0000) LEVERAGE 0663 (0435) ndash0816 (0017) GOODWILL 2950 (0215) 1048 (0206) MampA 0058 (0767) 0194 (0187) FOREIGN ndash0561 (0160) 0463 (0004) MTB 0030 (0536) ndash0041 (0091) GOING_CONCERN 2034 (0000) 1324 (0000) ACC_RESTATEMENT (Y_CONTROL) ndash0076 (0917) 0266 (0574) BUSY_MONTH ndash0020 (0929) 0187 (0203) BIG4 ndash1259 (0029) ndash0863 (0001) ISPEC 4431 (0036) 2211 (0008) Intercept ndash3940 (0001) ndash1463 (0002) Year fixed effects Yes Yes Observations 6064 7834 McFaddens R2 827 952 Panel B Incorporating bank size categories SIC61 High RECTA Intercept ndash4564 (0000) ndash1942 (0000) B10_50 1167 (0041) ndash0047 (0896) B50_100 0308 (0731) ndash0340 (0666) B100_500 ndash0729 (0527) ndash14727 (0983) B500 0032 (0969) ndash0465 (0444) BANK ndash0014 (0968) ndash0499 (0007) BANKB10_50 ndash1704 (0005) ndash0256 (0551) BANKB50_100 ndash2210 (0093) ndash1468 (0246) BANKB100_500 ndash1369 (0296) 12904 (0985) BANKB500 ndash15538 (0978) ndash13901 (0971) Control variables Yes Yes Year fixed effects Yes Yes Observations 6064 7834 McFaddens R2 984 1048
The table reports the logistic estimation of the likelihood of a firm reporting a material weakness in internal control over financial reporting The dependent variable INTERNAL_WEAKNESS = 1 if the firm disclosed a material internal control deficiency and 0 otherwise The main test variable BANK = 1 if the firm is on Bank Compustat and 0 otherwise We estimate the model on the combined BANK sample and one of two control samples of firms that are similar to banks but unregulated (1) The SIC61 control sample comprises non-depository credit institutions with two-digit standard industry classification (SIC) code 61 on Annual North American Compustat (2) the High RECTA control sample comprises non-banks with the top 5 of receivable to assets ratio on Annual North American Compustat The control variables are defined as follows LogASSETS = the natural logarithm of total assets ROA = net income divided by total assets LOSS = 1 if the firm reports negative net income and 0 otherwise LEVERAGE = total liabilities divided by total assets GOODWILL = goodwill divided by total assets MampA = 1 if the firmrsquos goodwill increases by more than $1 million and 0 otherwise FOREIGN = 1 if a firm reports non-zero foreign exchange income and 0 otherwise MTB = market value of equity divided by book value of equity GOING_CONCERN = 1 if a firm receives a going concern modified opinion and 0 otherwise ACC_RESTATEMENT = 1 if the firm subsequently restates its current period Form 10-K filing for the fiscal year BUSY_MONTH = 1 if the fiscal year-end is December and 0 otherwise BIG4 = 1 if the firm is audited by one of the Big-Four auditors and 0 otherwise ISPEC = auditorrsquos relative market share of
46
audit fees in the clientrsquos FamandashFrench 48 industry classification Panel A reports the base model estimation Panel B reports the estimation of an expanded model which includes firm size indicators and their interactions with BANK The firm size indicators are denoted Bj_k=1 if total assets are between j and k $ billion for j=10 50 or 100 and for k=50 100 or 500 and are denoted B500=1 if total assets exceed $500 billion p-values are reported in parentheses
47
Table 3 Likelihood of financial statement restatements for banks versus control firms
Panel A Logistic estimation of restatements CONTROL SIC61 High RECTA BANK ndash1075 (0005) ndash1520 (0000) LogASSETS 0006 (0947) 0082 (0134) ROA 0155 (0934) ndash0815 (0242) LOSS 0271 (0451) 0359 (0167) LEVERAGE ndash0755 (0518) 0890 (0157) GOODWILL ndash13070 (0151) ndash5891 (0014) MampA 0569 (0095) 0527 (0036) FOREIGN ndash0678 (0295) ndash0817 (0026) MTB ndash0050 (0748) 0049 (0084) GOING_CONCERN ndash13976 (0992) ndash14082 (0979) INTERNAL_WEAKNESS (Y_CONTROL) ndash0218 (0768) 0017 (0972) BUSY_MONTH ndash0023 (0952) ndash0439 (0058) BIG4 1087 (0100) 0635 (0111) ISPEC ndash2067 (0399) ndash1643 (0258) Intercept ndash4288 (0000) ndash5118 (0000) Year fixed effects Yes Yes Observations 8585 11024 McFaddens R2 765 902 Panel B Incorporating bank size into the analyses SIC61 High RECTA Intercept ndash5023 (0000) ndash5551 (0000) B10_50 0512 (0550) ndash0022 (0962) B50_100 ndash0080 (0950) ndash0728 (0510) B100_500 0568 (0609) ndash0476 (0584) B500 ndash14268 (0984) ndash1148 (0223) BANK ndash0552 (0294) ndash1349 (0000) BANKB10_50 ndash2798 (0029) ndash2119 (0053) BANKB50_100 ndash13314 (0978) ndash13363 (0986) BANKB100_500 ndash0962 (0359) 0307 (0743) BANKB500 ndash0169 (1000) ndash13623 (0985) Control variables Yes Yes Year fixed effects Yes Yes Observations 8585 11024 McFaddens R2 1029 1035
The table reports the logistic estimation of the likelihood of a firm reporting a financial statement restatement The dependent variable ACC_RESTATEMENT = 1 if the firm subsequently restated its 10-K filing for the fiscal year and zero otherwise The main test variable BANK = 1 if the firm is on Bank Compustat and 0 otherwise We estimate the model on the combined BANK sample and one of two control samples of firms that are similar to banks but unregulated (1) The SIC61 control sample comprises non-depository credit institutions with two-digit standard industry classification (SIC) code 61 on Annual North American Compustat (2) the High RECTA control sample comprises non-banks with the top 5 of receivable to assets ratio on Annual North American Compustat The control variables are defined as follows LogASSETS = the natural logarithm of total assets ROA = net income divided by total assets LOSS = 1 if the firm reports negative net income and 0 otherwise LEVERAGE = total liabilities divided by total assets GOODWILL = goodwill divided by total assets MampA = 1 if the firmrsquos goodwill increases by more than $1 million and 0 otherwise FOREIGN = 1 if a firm reports non-zero foreign exchange income and 0 otherwise MTB = market value of equity divided by book value of equity GOING_CONCERN = 1 if a firm receives a going concern modified opinion and 0 otherwise INTERNAL_WEAKNESS= 1 if the firm disclosed internal control deficiencies and 0 otherwise BUSY_MONTH = 1 if the fiscal year-end is December and 0 otherwise BIG4 = 1 if the firm is audited by one of the Big-Four auditors and 0 otherwise ISPEC = auditorrsquos relative market share of audit fees in the clientrsquos FamandashFrench
48
48 industry classification Panel A reports the base model estimation Panel B reports the estimation of an expanded model which includes firm size indicators and their interactions with BANK The firm size indicators are denoted Bj_k=1 if total assets are between j and k $ billion for j=10 50 or 100 and for k=50 100 or 500 and are denoted B500=1 if total assets exceed $500 billion p-values are reported in parentheses
49
Table 4 Audit fees for banks versus control firms
Panel A OLS estimation of audit fees CONTROL SIC61 High RECTA BANK ndash0705 (0000) ndash0954 (0000) LogASSETS 0601 (0000) 0552 (0000) ROA ndash0754 (0003) ndash0768 (0000) LOSS 0178 (0000) 0196 (0000) SPECIAL_ITEMS 0488 (0003) 0072 (0652) DISCONTINUED 0286 (0000) 0228 (0000) LEVERAGE ndash1496 (0000) ndash0627 (0000) INVENTORY 0291 (0177) 0729 (0000) INTANGIBLES 2637 (0002) 2404 (0000) GOODWILL ndash2665 (0046) ndash0609 (0297) MampA 0081 (0000) 0092 (0000) NEG_EQUITY 0222 (0094) 0466 (0000) FIRM_AGE 0004 (0084) 0007 (0000) ACCEL_FILER ndash0004 (0902) 0029 (0307) INTERNAL_WEAKNESS 0254 (0000) 0260 (0000) MTB ndash0008 (0598) 0021 (0004) RETURN ndash0035 (0048) ndash0001 (0936) STD_RETURN 0802 (0000) 0780 (0000) GOING_CONCERN 0048 (0602) 0055 (0473) BUSY_MONTH 0106 (0014) 0038 (0286) BIG4 0322 (0000) 0327 (0000) ISPEC 0087 (0712) 0240 (0141) Year fixed effects Yes Yes Observations 8585 11024 Adjusted R2 90 24 88 54 Panel B Incorporating firm size into the analyses SIC61 High RECTA B10_50 ndash0215 (0268) 0013 (0935) B50_100 0283 (0074) 0283 (0010) B100_500 0215 (0488) 0219 (0284) B500 0482 (0004) 0519 (0000) BANK ndash0766 (0000) ndash0980 (0000) BANKB10_50 0213 (0283) 0033 (0842) BANKB50_100 ndash0138 (0466) ndash0045 (0772) BANKB100_500 0201 (0523) 0315 (0129) BANKB500 0701 (0000) 0852 (0000) Control variables Yes Yes Year fixed effects Yes Yes Observations 8585 11024 Adjusted R2 90 92 89 32
The table reports the OLS estimation of a model with dependent variable LogFEE = the natural logarithm of the sum of audit fees and audit-related fees The main test variable BANK = 1 if the firm is on Bank Compustat and 0 otherwise We estimate the model on the combined BANK sample and one of two control samples of firms that are similar to banks but unregulated (1) The SIC61 control sample comprises non-depository credit institutions with two-digit standard industry classification (SIC) code 61 on Annual North American Compustat (2) the High RECTA control sample comprises non-banks with the top 5 of receivable to assets ratio on Annual North American Compustat The control variables are defined as follows LogASSETS = the natural logarithm of total assets ROA = net income divided by total assets LOSS = 1 if the firm reports negative net income and 0 otherwise SPECIAL_ITEMS = special items divided by total assets DISCONTINUED = 1 if a firmrsquos discontinued operations exceeds $1 million and
50
0 otherwise LEVERAGE = total liabilities divided by total assets INVENTORY = inventory divided by total assets INTANGIBLES = intangible assets divided by total assets GOODWILL = goodwill divided by total assets MampA = 1 if the firmrsquos goodwill increases by more than $1 million and 0 otherwise NEG_EQUITY = 1 if common equity is negative and 0 otherwise FIRM_AGE = the number of years the firm is listed in Compustat ACCEL_FILER = 1 if the firm is an accelerated filer and 0 otherwise INTERNAL_WEAKNESS = 1 if the firm disclosed a material internal control deficiency and 0 otherwise MTB = market value of equity divided by book value of equity RETURN = fiscal year stock return STD_RETURN = standard deviation of monthly stock returns GOING_CONCERN = 1 if a firm receives a going concern modified opinion and 0 otherwise BUSY_MONTH = 1 if the fiscal year-end is December and 0 otherwise BIG4 = 1 if the firm is audited by one of the Big-Four auditors and 0 otherwise ISPEC = auditorrsquos relative market share of audit fees in the clientrsquos FamandashFrench 48 industry classification Panel A reports the base model estimation Panel B reports the estimation of an expanded model which includes firm size indicators and their interactions with BANK The firm size indicators are denoted Bj_k=1 if total assets are between j and k $ billion for j=10 50 or 100 and for k=50 100 or 500 and are denoted B500=1 if total assets exceed $500 billion Standard errors are clustered at the firm level (two-tailed p-values are in parentheses)
51
Table 5 Audit report lag for banks versus control firms
Panel A OLS estimation of audit report lag CONTROL SIC61 High RECTA BANK ndash0101 (0015) ndash0101 (0000) LogASSETS ndash0014 (0057) ndash0021 (0000) ROA ndash0275 (0022) 0058 (0243) LOSS 0113 (0000) 0144 (0000) DISCONTINUED 0029 (0416) 0035 (0148) EXTRA_ITEMS 0098 (0058) 0137 (0001) ABS_ACCRUALS ndash0021 (0356) 0064 (0061) LEVERAGE 0093 (0397) 0084 (0093) INVENTORY 0408 (0001) 0255 (0005) FOREIGN 0199 (0002) 0067 (0045) FIRM_AGE ndash0007 (0000) ndash0005 (0000) INTERNAL_WEAKNESS 0186 (0000) 0151 (0000) AUDITOR_TURNOVER 0045 (0004) 0050 (0000) GOING_CONCERN 0240 (0001) 0172 (0000) BUSY_MONTH ndash0021 (0411) ndash0021 (0286) BIG4 0111 (0000) 0083 (0000) Year fixed effects Yes Yes Observations 8289 10660 Adjusted R2 51 28 45 53 Panel B Incorporating firm size into the analyses SIC61 High RECTA B10_50 ndash0252 (0000) ndash0124 (0000) B50_100 ndash0190 (0074) ndash0090 (0126) B100_500 ndash0184 (0017) 0091 (0037) B500 0079 (0608) 0161 (0004) BANK ndash0174 (0000) ndash0141 (0000) BANKB10_50 0246 (0001) 0180 (0000) BANKB50_100 0238 (0061) 0229 (0001) BANKB100_500 0290 (0002) 0136 (0008) BANKB500 0101 (0546) 0202 (0001) Control variables Yes Yes Year fixed effects Yes Yes Observations 8289 10660 Adjusted R2 51 67 46 51
The table reports the OLS estimation of a model with dependent variable LogARL = the natural logarithm of the number of days between the fiscal year-end date and auditor signature date The main test variable BANK = 1 if the firm is on Bank Compustat and 0 otherwise We estimate the model on the combined BANK sample and one of two control samples of firms that are similar to banks but unregulated (1) The SIC61 control sample comprises non-depository credit institutions with two-digit standard industry classification (SIC) code 61 on Annual North American Compustat (2) the High RECTA control sample comprises non-banks with the top 5 of receivable to assets ratio on Annual North American Compustat The control variables are defined as follows LogASSETS = the natural logarithm of total assets ROA = net income divided by total assets LOSS = 1 if the firm reports negative net income and 0 otherwise DISCONTINUED = 1 if a firmrsquos discontinued operations exceeds $1 million and 0 otherwise EXTRA_ITEMS = 1 if a firmrsquos (absolute) extraordinary items exceeds $1 million and 0 otherwise ABS_ACCRUALS = absolute value of accruals divided by total assets LEVERAGE = total liabilities divided by total assets INVENTORY = inventory divided by total assets FOREIGN = 1 if a firm reports non-zero foreign exchange income and 0 otherwise FIRM_AGE = the number of years a firm is listed in Compustat INTERNAL_WEAKNESS = 1 if the firm disclosed a material internal control deficiency and 0 otherwise AUDITOR_TURNOVER = 1 if the firmrsquos auditor changed during the year and 0 otherwise GOING_CONCERN = 1 if a firm receives a going concern modified opinion and 0 otherwise
52
BUSY_MONTH = 1 if the fiscal year-end is December and 0 otherwise BIG4 = 1 if the firm is audited by one of the Big-Four auditors and 0 otherwise Panel A reports the base model estimation Panel B reports the estimation of an expanded model which includes firm size indicators and their interactions with BANK The firm size indicators are denoted Bj_k=1 if total assets are between j and k $ billion for j=10 50 or 100 and for k=50 100 or 500 and are denoted B500=1 if total assets exceed $500 billion Standard errors are clustered at the firm level (two-tailed p-values are in parentheses)
53
Table 6 Identification tests for audit fee model using proxies for times-series variation
in the intensity of banking regulation
Panel A Descriptive statistics N Mean Std Q1 Median Q3 BUDGET (in millions $) 15 2757 908 2008 2506 3584 RESTRICTIONS (number of words) 15 29936 9313 24771 25536 30053 Panel B OLS estimation of audit fees
intensity LogBUDGET model LogRESTRICTIONS model LogBUDGET ndash1640 (0000) LogRESTRICTIONS ndash0677 (0000) LogASSETS 0454 (0000) 0467 (0000) ROA ndash1735 (0008) ndash1227 (0083) LOSS 0046 (0008) 0048 (0008) SPECIAL_ITEMS 2113 (0020) 1043 (0281) DISCONTINUED 0057 (0024) 0078 (0003) LEVERAGE ndash0896 (0000) ndash0732 (0000) INVENTORY 0274 (0086) 0228 (0170) INTANGIBLES 1962 (0090) 1632 (0207) GOODWILL ndash0059 (0960) 1379 (0286) MampA 0036 (0000) 0055 (0000) NEG_EQUITY 0099 (0300) 0113 (0244) FIRM_AGE 0177 (0000) 0101 (0000) ACCEL_FILER ndash6728 (0000) ndash3901 (0000) INTERNAL_WEAKNESS 0230 (0000) 0220 (0000) MTB 0005 (0352) 0037 (0002) RETURN ndash0052 (0000) ndash0059 (0000) STD_RETURN 0131 (0040) ndash0209 (0008) GOING_CONCERN 0039 (0441) 0057 (0294) BUSY_MONTH 0043 (0438) 0063 (0273) BIG4 0109 (0002) 0111 (0002) ISPEC 0516 (0000) 0554 (0000) Year fixed effects No No Firm fixed effects Yes Yes Observations 7914 7914 Adjusted R2 9590 9569
Panel A reports descriptive statistics for two measures of bank regulation intensity BUDGET and RESTRICTIONS BUDGET is the annual budget in $ millions of the ldquofinance and bankingrdquo subcategory (which includes the Comptroller of the Currency Federal Deposit Insurance Corporation and Securities and Exchange Commission) from Regulatory Reports available at httpswcwustleduregulatory_reports RESTRICTIONS is based on RegData an industry- and year-specific regulation index constructed by Al-Ubaydli and McLaughlin (2017) from textual analysis of the number of constraints (the strings ldquoshallrdquo ldquomustrdquo ldquomay notrdquo ldquoprohibitedrdquo and ldquorequiredrdquo) in the Code of Federal Regulations (CFR) Title 12 for the banking industry each year Panel B reports the OLS estimation for the BANK sample only of an expansion of the audit fee model with dependent variable LogFEE = the natural logarithm of the sum of audit fees and audit-related fees reported in Table 4 The expanded model includes the natural logarithm of BUDGET or RESTRICTIONS The control variables are defined as follows LogASSETS = the natural logarithm of total assets ROA = net income divided by total assets LOSS = 1 if the firm reports negative net income and 0 otherwise SPECIAL_ITEMS = special items divided by total assets DISCONTINUED = 1 if a firmrsquos discontinued operations exceeds $1 million and 0 otherwise LEVERAGE = total liabilities divided by total assets INVENTORY = inventory divided by total assets INTANGIBLES = intangible assets divided by total assets GOODWILL = goodwill divided by total assets MampA = 1 if the firmrsquos goodwill increases by more than $1 million and 0 otherwise NEG_EQUITY = 1 if common equity is negative and 0 otherwise FIRM_AGE = the number of years a firm is listed in Compustat ACCEL_FILER = 1 if the firm is an accelerated filer and 0 otherwise INTERNAL_WEAKNESS = 1 if the firm disclosed a material internal control
54
deficiency and 0 otherwise MTB = market value of equity divided by book value of equity RETURN = fiscal year stock return STD_RETURN = standard deviation of monthly stock returns GOING_CONCERN = 1 if a firm receives a going concern modified opinion and 0 otherwise BUSY_MONTH = 1 if the fiscal year-end is December and 0 otherwise BIG4 = 1 if the firm is audited by one of the Big-Four auditors and 0 otherwise ISPEC = auditorrsquos relative market share of audit fees in the clientrsquos FamandashFrench 48 industry classification Standard errors are Whites corrected standard errors (two-tailed p-values are in parentheses)
55
Table 7 Identification tests for audit fee model using proxy for cross sectional variation
in the intensity of banking regulation
STATE BANKS ALL BANKS STATE_REG 0664 (0016) ndash0670 (0196) STATE_BANK ndash0088 (0158) STATE_REG x STATE_BANK 1346 (0023) LogASSETS 0537 (0000) 0567 (0000) ROA ndash3904 (0010) ndash4337 (0003) LOSS 0093 (0009) 0116 (0001) SPECIAL_ITEMS 3148 (0057) 3943 (0012) DISCONTINUED 0296 (0001) 0273 (0000) LEVERAGE ndash1964 (0000) ndash1976 (0000) INVENTORY 0780 (0000) 0986 (0000) INTANGIBLES 7261 (0000) 6960 (0000) GOODWILL ndash5674 (0000) ndash5593 (0000) MampA 0091 (0000) 0066 (0000) NEG_EQUITY 0164 (0184) 0027 (0879) FIRM_AGE 0007 (0002) 0008 (0000) ACCEL_FILER 0076 (0014) 0023 (0440) INTERNAL_WEAKNESS 0250 (0000) 0248 (0000) MTB 0005 (0708) ndash0004 (0764) RETURN ndash0047 (0013) ndash0021 (0243) STD_RETURN 0669 (0001) 0637 (0000) GOING_CONCERN ndash0081 (0318) 0017 (0855) BUSY_MONTH 0068 (0055) 0068 (0062) BIG4 0360 (0000) 0331 (0000) ISPEC 0035 (0889) 0003 (0989) Intercept 9320 (0000) 9274 (0000) Year fixed effects Yes Yes Observations 5679 7340 Adjusted R2 8741 8859
The table reports the OLS estimation for the BANK sample only of two expansions of the audit fee model with dependent variable LogFEE = the natural logarithm of the sum of audit fees and audit-related fees in $ millions reported in Table 4 The both expanded models include Agarwal Lucca Seru and Trebbirsquos (2014) measure of regulatory leniency (inverse intensity) across state-chartered banks (STATE_REG) and The measure is based on the ldquoalternating examination programrdquo in which state-chartered banks are examined by (more stringent) federal supervisors (the FDIC or Federal Reserve) and state supervisors on an alternating basis Using a proprietary database Agarwal et al (2014) estimate the differential examination stringency of federal supervisors versus 44 state bank supervisors The expanded reported in right column as includes an indicator for whether bank is a state-chartered bank (STATE_BANK) based on information obtained from the FDIC website (httpswww5fdicgovidaspadvSearchLandingasp) as well as the interaction of STATE_REG with STATE_BANK The control variables are defined as follows LogASSETS = the natural logarithm of total assets ROA = net income divided by total assets LOSS = 1 if the firm reports negative net income and 0 otherwise SPECIAL_ITEMS = special items divided by total assets DISCONTINUED = 1 if a firmrsquos discontinued operations exceeds $1 million and 0 otherwise LEVERAGE = the total liabilities divided by total assets INVENTORY = inventory divided by total assets INTANGIBLES = intangible assets divided by total assets GOODWILL = goodwill divided by total assets MampA = 1 if the firmrsquos goodwill increases by more than $1 million and 0 otherwise NEG_EQUITY = 1 if common equity is negative and 0 otherwise FIRM_AGE = the number of years a firm is listed in Compustat ACCEL_FILER = 1 if the firm is an accelerated filer and 0 otherwise INTERNAL_WEAKNESS = 1 if the firm disclosed a material internal control deficiency and 0 otherwise MTB = market value of equity divided by book value of equity RETURN = fiscal year stock return STD_RETURN = standard deviation of monthly stock returns GOING_CONCERN = 1 if a firm receives a going concern modified opinion and 0 otherwise BUSY_MONTH = 1 if the fiscal year-end is December and 0 otherwise
56
BIG4 = 1 if the firm is audited by one of the Big-Four auditors and 0 otherwise ISPEC = auditorrsquos relative market share of audit fees in the clientrsquos FamandashFrench 48 industry classification Panel A reports the base model estimation Panel B reports the estimation of an expanded model which includes the interactions of firm size with BANK The bank size indicators are denoted Bj_k=1 if total assets are between j and k $ billion for j=10 50 or 100 and for k=50 100 or 500 and are denoted B500=1 if total assets exceed $500 billion Standard errors are clustered at the firm level (two-tailed p-values are in parentheses)
57
Table 8 Likelihood of small earnings increases for banks versus control firms
CONTROL SIC61 High RECTA BANK 1483 (0000) 0897 (0000) LogASSETS ndash0052 (0026) ndash0030 (0168) LEVERAGE ndash1351 (0006) ndash0022 (0952) MTB 0040 (0192) 0001 (0965) ACCEL_FILER 0222 (0003) 0176 (0019) BIG4 ndash0062 (0401) ndash0062 (0399) Intercept ndash1467 (0000) ndash2164 (0000) Year fixed effects Yes Yes Observations 8585 8928 McFaddens R2 312 328
The table reports the logistic estimation of the likelihood that a firm reports a small earnings increase SMALL_POS = 1 if 000 lt ∆ROE le 001 where ROE = net income divided by the book value of common equity and 0 otherwise The main test variable BANK = 1 if the firm is a bank and 0 otherwise We estimate the model on the combined BANK sample and one of two control samples of firms that are similar to banks but unregulated (1) The SIC61 control sample comprises non-depository credit institutions with two-digit standard industry classification (SIC) code 61 on Annual North American Compustat (2) the High RECTA control sample comprises non-banks with the top 5 of receivable to assets ratio on Annual North American Compustat The control variables are defined as follows LogASSETS = the natural logarithm of total assets LEVERAGE = total liabilities divided by total assets MTB = market value of equity divided by book value of equity ACCEL_FILER = 1 if the firm is an accelerated filer and 0 otherwise BIG4 = 1 if the firm is audited by one of the Big-Four auditors and 0 otherwise p-values are reported in parentheses
58
Table 9 Length of string of consecutive earnings increases for banks versus control firms
CONTROL SIC61 High RECTA BANK 0383 (0008) 0663 (0000) LogASSETS ndash0128 (0000) ndash0171 (0000) LEVERAGE ndash0469 (0377) 0516 (0000) MTB ndash0275 (0000) ndash0062 (0000) GOODWILL 1023 (04260 ndash0726 (0070) ACCEL_FILER ndash0446 (0000) ndash0246 (0000) INTERNAL_WEAKNESS ndash0170 (0467) 0041 (0763) BIG4 0101 (0215) 0111 (0058) Intercept Year fixed effects Yes Yes Number of observations 1069 1778 McFaddens R2 417 390
The table reports proportional hazard model estimation of a model with dependent variable STRING = the duration of the longest string of consecutive annual earnings increases The main test variable BANK = 1 if the firm is a bank and 0 otherwise We estimate the model on the combined BANK sample and one of two control samples of firms that are similar to banks but unregulated (1) The SIC61 control sample comprises non-depository credit institutions with two-digit standard industry classification (SIC) code 61 on Annual North American Compustat (2) the High RECTA control sample comprises non-banks with the top 5 of receivable to assets ratio on Annual North American Compustat The control variables are defined as follows LogASSETS = the natural logarithm of total assets LEVERAGE = total liabilities divided by total assets MTB = market value of equity divided by book value of equity ACCEL_FILER = 1 if the firm is an accelerated filer and 0 otherwise BIG4 = 1 if the firm is audited by one of the Big-Four auditors and 0 otherwise p-values are reported in parentheses
59
Figure 1
Plot of time-series measures of the intensity of banking regulation from 2000-2014
LogRestrictions is based on RegData an industry- and year-specific regulation index constructed by Al-Ubaydli and
McLaughlin (2017) from textual analysis of the number of constraints (the strings ldquoshallrdquo ldquomustrdquo ldquomay notrdquo
ldquoprohibitedrdquo and ldquorequiredrdquo) in the Code of Federal Regulations (CFR) This measure is the natural logarithm of the
number of constraints in CFR Title 12 for the banking industry each year LogBudget is the natural logarithm of the
annual budget (in $ millions) of the ldquofinance and bankingrdquo subcategory (which includes the Comptroller of the
Currency Federal Deposit Insurance Corporation and Securities and Exchange Commission) from Regulatory
Reports available at httpswcwustleduregulatory_reports
94
96
98
10
102
104
106
108
11
7
72
74
76
78
8
82
84
86
2000 2001 2002 2003 2004 2005 2006 2007 2008 2009 2010 2011 2012 2013 2014
logBudget logRestrictions

10
to roll back Dodd-Frank and other bank regulations are currently underway in Congress
(Richardson et al 2017)
FDICIArsquos requirement that a bankrsquos management assess and certify the effectiveness of
the bankrsquos internal controls is of particular relevance to this study Control risk is a key component
of audit risk Particularly prior to the effective dates of Sections 302 and 404 of SOX FDICIArsquos
requirements should reduce the internal control risk of banks relative to that of non-banks
(Altamuro and Beatty 2010) Moreover we expect bank supervisors to require banks with
identified internal control deficiencies to remediate those deficiencies promptly further reducing
banksrsquo control risk
Even the most stringent banking laws and regulations can have the intended effects only if
bank regulators and supervisors adequately enforce banksrsquo adherence to these rules Under the
ldquodual banking systemrdquo individual banks may be nationally or state chartered and bank regulation
and supervision is conducted by overlapping sets of federal regulators and state banking
departments National banks are primarily supervised by the Office of the Comptroller of the
Currency (ldquoOCCrdquo) a federal regulator State banks that elect to become members of the Federal
Reserve System (state member banks) are primarily supervised by the Federal Reserve a federal
regulator and their state banking departments State banks that are not members of the Federal
Reserve System (state nonmember banks) are primarily supervised by the FDIC a federal
regulator and their state banking departments All banks accepting insured deposits are also
supervised by the FDIC8
8 Recognizing that the dual banking system and multiple federal bank regulators could lead to
inconsistencies in bank regulation and supervision in 1978 Congress created the Federal Financial
Institutions Examination Council (ldquoFFIECrdquo) an interagency body to promote consistency in these
activities The FFIEC currently is composed of the chairs of the FDIC and the National Credit Union
Administration the Comptroller of the Currency a governor of the Federal Reserve a state banking
11
Individual banks may be owned by bank holding companies which may apply and qualify
to be financial holding companies Bank holding companies typically engage in lending deposit
acceptance and any other allowed activities through their individual bank subsidiaries Financial
holding companies may engage in activities not allowed in individual banks such as insurance
underwriting and merchant banking through non-bank subsidiaries (Ryan 2007 Avraham et al
2012) The Federal Reserve has supervisory authority over all bank holding companies regardless
of how their subsidiary banks are chartered and supervised
212 Bank Supervision
Bank supervision involves the periodic on-site examination and ongoing off-site
monitoring of banksrsquo financial condition and risks the adequacy of banksrsquo accounting internal
control and risk management systems and banksrsquo compliance with applicable laws and
regulations The main goal of supervision is to ensure the safety and soundness of individual banks
and especially of the banking system
Bank supervision shares many similarities with (bank) auditing For example much like
auditorsrsquo risk-based approach to auditing the Federal Reserve indicates that it employs a risk-
focused approach to supervision (Board of Governors of the Federal Reserve System 2017) Under
this approach the Federal Reserve first identifies the primary risks faced by a bank The Federal
Reserve then assesses the bankrsquos ability to measure monitor and control those risks given its (1)
board and senior management oversight (2) policies procedures and risk limits (3) risk
monitoring and management information systems and (4) internal controls
director and the director of the Consumer Financial Protection Bureau The FFIEC has developed uniform
examination principles and standards as well as uniform regulatory reporting forms and systems for
federally supervised banks
12
On-site examinations of individual banks and bank holding companies generally occur
every 12 to 18 months depending on the organizationrsquos size supervisory rating and extent of non-
banking assets as well as supervisory resource constraints For state banks the primary federal
supervisor coordinates its on-site examinations with the state supervisor with the two supervisors
generally conducting examinations in rotation under the ldquoalternating examination programrdquo
(Agarwal et al 2014) The results of an examination which include a confidential supervisory
rating of the bankrsquos overall condition are reported to the bankrsquos board of directors and
management The supervisory rating system is referred to as CAMELS an acroynm for its six
components (1) capital adequacy (2) asset quality (3) management and administration (4)
earnings (5) liquidity and (6) sensitivity to market risk The overall and component CAMELS
ratings efficiently communicate supervisorsrsquo overall assessments of banks as well as any specific
issues that raise concern or require attention
Between examinations bank supervisors use many sources of financial and other
information most importantly banksrsquo quarterly regulatory reports to monitor banks The primary
report for individual banks is the Consolidated Reports of Condition and Income (ldquoCall Reportsrdquo)
These reports provide the raw data for the Uniform Bank Performance Report which presents
ratios that can be compared across banks and time to detect unusual levels of or significant changes
in a banks financial condition The primary report for bank holding companies is the Consolidated
Financial Statements for Bank Holding Companies (FR Y-9C) The Federal Reserve indicates it
uses an automated system to estimate an organizationrsquos CAMELS rating based on its prior
examination results and subsequent quarterly Call Report or FR Y-9C filings (Board of Governors
of the Federal Reserve System 2017)
13
If a supervisor determines that a bank or bank holding company has problems that affect
its safety and soundness the supervisor may take a variety of formal or informal actions to ensure
that the organizationrsquos management and directors undertake measures to address the problems
(Keeley 2017) For example the supervisor may enter into a written agreement with issue a cease-
and-desist order or prompt-corrective-action directive to or levy a fine against the organization
22 Bank Complexity and Opacity
Although a debate exists as to whether stability is enhanced by bank transparency or bank
opacity the traditional and still dominant view is that transparency enhances stability (Morgan
2002 Nier and Baumann 2006 Acharya and Ryan 2016)9 Prior theoretical and empirical research
provides numerous bases for this view For example banksrsquo effectiveness as monitors provides
them with comparative advantages in lending to information-sensitive borrowers (Diamond 1984)
Banksrsquo high leverage multiplies their risk and exacerbates various agency problems such as asset
substitution (Jensen and Meckling 1976) and underinvestment when the benefits of investment
primarily accrue to debtholders (Myers 1977) Such agency problems are exacerbated further by
information asymmetries between banks and their debt and equity claimants as well as among
these claimants (Beatty and Liao 2014 Acharya and Ryan 2016)
Despite the perceived benefits of bank transparency banks are often viewed as opaque due
to their complex and interrelated on- and off-balance sheet exposures The individual and
collective values and risk of these exposures are inherently difficult for banks to convey to
outsiders and for outsiders to evaluate This difficulty likely enhances banksrsquo ability to manage or
obscure their accounting numbers
9 See Dang et al (2014) Holmstroumlm (2015) and Acharya and Ryan (2016) for discussion of the opposing
view that bank opacity enhances stability
14
Prior empirical research provides evidence that banks are more opaque than non-banks and
about the determinants of banksrsquo opacity Morgan (2002) shows that banks receive more split
credit ratings (ie different bond ratings from different rating agencies) than do non-banks a result
he attributes to banksrsquo greater opacity He further shows that banksrsquo opacity varies with their asset
composition increasing with their proportions of loans and trading assets Flannery et al (2013)
provide evidence that bank opacity increases during periods of financial system stress when the
valuations of financial assets become harder to determine and more strongly correlated
We expect that the difference in opacity between banks and non-banks has widened over
time as banks have shifted their activities from relatively understandable deposit-acceptance and
lending activities ie traditional financial intermediation to less easily understandable
nontraditional activities such as derivatives trading securitization and the provision of various
forms of contingent financing Banksrsquo economic exposures resulting from these activities often
exhibit concentrated or correlated risks or state-contingent liquidity requirements and these
exposures often are partly or wholly off-balance sheet (Barth et al 2009 Acharya 2014 Acharya
and Ryan 2016)10
Banksrsquo increasing economic complexity has been accompanied by increasing length and
complexity of their financial reports Accounting standard setters have written many complex and
lengthy standards for financial instruments and transactions to try to adequately portray their
10 In large part reflecting the income generated by these nontraditional activities the average bankrsquos
noninterest revenues as a percentage of net operating revenues increased from below 20 in the 1970s to
around 50 by 2009 (Barth et al 2009) A portion of this increase is attributable to generally declining
interest rates from 1981 to 2009 however
15
economics11 Despite banksrsquo provision of far more extensive financial report information in
compliance with the requirements of these standards (Guay et al 2016) we expect the individual
and collective values and risk of banksrsquo exposures to have become more difficult for banks to
convey to outsiders and for outsiders to evaluate
23 Hypotheses and Empirical Proxies
231 Engagement and Audit Risks
Auditorsrsquo decisions whether to bid for potential engagements the prices at which to bid
and the effort needed to provide the desired level of assurance depend on the risks the engagements
pose for them (Bedard and Johnstone 2004) Overall engagement risk has three interrelated
components (1) clientsrsquo business risk ie the possibility that clientsrsquo financial condition
deteriorates in the limit leading to firm failure (2) auditorsrsquo business risk ie the possibility of
litigation or reputational costs to auditors from their associations with clients and (3) audit risk
ie the possibility that auditors fail to detect material misstatements in financial statements due to
error or fraud In our investigation of whether bank regulation and supervision displace auditing
we focus on audit risk because it is the component of engagement risk that is most directly reduced
by audit effort
In the standard (textbook) model audit risk has three by construction distinct components
(1) inherent risk ie the likelihood that material misstatements of clientsrsquo financial statements
exist prior to the operation of their internal control systems (2) control risk ie the likelihood that
clientsrsquo internal control systems fail to prevent material misstatements and (3) detection risk ie
11 Notable examples of these standards include FAS 133 (1998) and FAS 161 (2009) for derivatives
(Accounting Standard Codification Section 815) and FAS 140 (2000) FIN 46(R) (2003) FAS 166 (2009)
and FAS 167 (2009) for securitizations (Accounting Standards Codification Sections 860 and 810)
16
the likelihood the auditor fails to detect material misstatements not prevented by clientsrsquo internal
control systems We expect bank regulation and supervision to reduce the inherent risk and control
risk components of audit risk and thus to reduce the incentive for auditors to expend effort on
audits of banks
232 Frequency of Internal Control and Accounting Problems
Bank supervisors monitor banksrsquo internal control and accounting systems through periodic
on-site examinations and ongoing off-site monitoring We expect this scrutiny to reduce the
inherent risk and control risk components of audit risk for audits of banks relative to audits of
control firms We formally state this hypothesis in the alternative as
Hypothesis 1 Banks exhibit fewer internal control and accounting problems than do
control firms
233 Audit Effort
It is theoretically unclear whether auditors should expend more or less effort on audits of
banks than on audits of control firms A primary reason why auditors would work more on audits
of banks is that banksrsquo greater complexity and opacity lead to their investors and contracting parties
more strongly benefiting from higher quality audits that increase the informativeness and
reliability of banksrsquo financial statements Due to this audit-demand effect higher quality audits
more strongly reduce the need for firmsrsquo investors and contracting parties to protect themselves
against uninformative or unreliable financial statement numbers by reducing the prices they are
willing to pay for firmsrsquo securities and by requiring contractual protections such as collateral
respectively To satisfy the demand for higher audit quality for audits of banks than for audits of
control firms auditors of banks must expend more effort by increasing the number of billed hours
17
andor by devoting more experienced andor specialized staff to engagements increasing the
average billed hourly fee
A primary reason why auditors would work less on audits of banks than on audits of control
firms is the overlap of the activities of bank regulators and supervisors particularly supervisorsrsquo
periodic examination and ongoing monitoring of banks with the activities of bank auditors Due
to this substitution effect auditors of banks need to perform less extensive audit planning and
substantive testing than do auditors of control firms to provide any given level of assurance We
expect the substitution effect to be more likely to dominate the audit-demand effect when bank
regulation and supervision are more intense for example when regulators and supervisors use
more sophisticated or sensitive approaches such as the Federal Reserversquos risk-focused approach
(Board of Governors of the Federal Reserve System 2017)
Although the two effects yield opposing predictions we expect that the substitution effect
generally dominates the audit demand effect because of substantial extent of the overlap of the
activities of bank regulators and particularly supervisors with those of auditors Relatedly many
aspects of bank regulation and supervision reduce the inherent and control risk components of
audit risk For example when bank supervisors determine that banks exhibit inadequate solvency
or other problems they convey the banksrsquo deficient CAMELS ratings to the banksrsquo management
and boards of directors who are responsible for resolving these problems This expectation yields
our second hypothesis stated in the alternative
Hypothesis 2 Auditors exert lower effort on audits of banks than on audits of control
firms
3 Empirical Models and Variables
31 Frequencies of Internal Control and Accounting Problems
18
We employ two dependent variables in our tests of Hypothesis 1 First we proxy for
problems in banksrsquo internal control using an indicator for material weaknesses in internal control
(Ashbaugh et al 2007) Naturally we can only observe such weaknesses if firms identify and
disclose them as FDICIA requires for banks and Sections 302 and 404 of SOX require for all
firms INTERNAL_WEAKNESS denotes firm-years with disclosed material internal control
weaknesses Second we proxy for problems in banksrsquo accounting using an indicator for financial
statement restatements which arise from GAAP violations and thus suggest audit failures
(Palmrose and Scholz 2004 Kinney et al 2004 Hennes et al 2014)12 ACC_RESTATEMENT
denotes firm-years with restatements of financial statements13 We denote
INTERNAL_WEAKNESS and ACC_RESTATEMENT collectively by Y
The main test variable in our tests of Hypothesis 1 is an indicator for banks denoted BANK
As discussed below we control for numerous client and auditor characteristics that prior research
finds are associated with internal control and accounting problems In addition when the
dependent variable Y is INTERNAL_WEAKNESS (ACC_RESTATEMENT) we control for
ACC_RESTATEMENT (INTERNAL_WEAKNESS) We denote the Y variable that is controlled for
in a given model by Y_CONTROL
12 In untabulated analysis we also proxy for both internal control and accounting problems using auditor
resignations (Krishnan and Krishnan 1997 Shu 2000 Hennes et al 2014) If banks exhibit fewer internal
control and accounting problems than do control firms bank auditors have fewer reasons to resign from
audit engagements However compared to the proxies for these problems in the tabulated analyses auditor
resignations are more likely to capture the components of engagement risk other than audit risk For
example prior research shows that auditors are more likely to resign when clients exhibit greater financial
distress (Schwartz and Soo 1995) more corporate governance problems (Lee et al 2004) and greater
litigation risk (Krishnan and Krishnan 1997 Simunic and Stein 1996)
13 All indicator variables in the paper take a value of one when a firm or firm-year exhibits the specified
condition and zero otherwise
19
Based on prior empirical research examining internal control weaknesses (Altamuro and
Beatty 2010)14 and financial statement restatements (Palmrose and Scholz 2004 Kinney et al
2004 Hennes et al 2008) we use the following logistic model to explain the probability that Y
equals one denoted Prob(Y = 1) in terms of BANK and control variables (collectively denoted
X)15
Prob(Y = 1) = eXβ (1 + eXβ) where
Xβ = β0 + β1BANK + β2LogASSETS + β3ROA + β4LOSS + β5LEVERAGE
+ β6GOODWILL + β7MampA + β8FOREIGN + β9MTB (1)
+ β10GOING_CONCERN + β11Y_CONTROL + β12BUSY_MONTH
+ β13BIG4 + β14ISPEC + year fixed effects
Because Prob(Y = 1) is not directly observable we estimate equation (1) with Y as the dependent
variable Hypothesis 1 predicts that the coefficient β1 on BANK is negative
Equation (1) controls for numerous client characteristics We selected these characteristics
based on prior research findings that firms that have less resources to invest in internal control
systems have undergone major organizational changes and are more complex or otherwise stress
auditorsrsquo capabilities exhibit more frequent internal control and accounting problems (eg Ge and
McVay 2005 Ashbaugh-Skaife et al 2007 Doyle et al 2007ab)
We control for the resources that clients have available to establish effective internal
control systems using the natural logarithm of total assets (LogASSETS) net income divided by
total assets (ROA) an indicator variable for negative net income (LOSS) and the ratio of total
14Altamuro and Beatty (2010) show how FDICIArsquos (1991) internal control requirements affected insured
depository institutions with assets of $500 million or above They do not compare the internal control
quality of banks and non-banks
15 Throughout the paper we omit firm and year subscripts for brevity
20
liabilities to total assets (LEVERAGE) We control for clientsrsquo organizational changes associated
with business acquisitions using the ratio of goodwill to total assets (GOODWILL) and an indicator
variable that equals one when goodwill increases by more than $1 million (MampA) We control for
other determinants of audit complexity using the proportion of foreign sales for control firms and
the proportion of foreign commercial loans for banks (FOREIGN) the ratio of market value of
equity to book value of equity (MTB) an indicator variable for the auditor rendering a going-
concern opinion (GOING_CONCERN) and Y_CONTROL
We control for three auditor characteristics an indicator for December fiscal year end
(BUSY_MONTH) an indicator variable for Big-Four auditor (BIG4) and the auditorrsquos market
share in the industry (ISPEC) Lastly we include fixed year effects to capture unobserved time-
related factors for both clients and auditors
Because the effects of client size may be nonlinear in tabulated specification analyses we
include indicator variables for client total assets in the following categories up to $10 billion (this
indicator is omitted as one must be) from above $10 to $50 billion (B10_50) from above $50 to
$100 billion (B50_100) from above $100 to $500 billion (B100_500) and above $500 billion
(B500) Moreover because the effects of size may vary for banks versus control firms we also
include the interactions of these size indicators with BANK
32 Audit Effort
We test Hypothesis 2 using two dependent variables that prior research indicates proxy for
auditor effort audit fees (Simunic and Stein 1996) and audit report lag (Ashton et al 1987 Bamber
et al 1993 and Ghosh and Tang 2015) Audit fees equal the number of hours worked times the
average fee per hour worked LogFEE denotes the natural logarithm of the sum of audit and audit-
related fees Auditors working more hours is positively associated with audit report lags (Bronson
21
et al 2011) LogREPORT_LAG denotes the natural logarithm of one plus the number of days
between the fiscal year end and the audit report signature date
Based on prior models for audit fees (Simunic 1980 Ghosh and Tang 2015) we use the
following model to explain LogFEE
LogFEE = β0 + β1BANK + β2LogASSETS + β3ROA + β4LOSS + β5SPECIAL_ITEMS
+ β6DISCONTINUED + β7LEVERAGE + β8INVENTORY + β9INTANGIBLES
+ β10GOODWILL + β11MampA + β12NEG_EQUITY + β13FIRM_AGE (2)
+ β14ACCEL_FILER + β15INTERNAL_WEAKNESS + β16MTB + β17RETURN
+ β18STD_RETURN + β19GOING_CONCERN + β20BUSY_MONTH
+ β21BIG4 + β22ISPEC + year fixed effects
Based on prior models for audit report lag (Ashton et al 1987 Bamber et al 1993 Bronson et al
2011 Ghosh and Tang 2015) we use the following model to explain LogREPORT_LAG
LogREPORT_LAG = β0 + β1BANK + β2LogASSETS + β3ROA + β4LOSS
+ β5DISCONTINUED + β6EXTRA_ITEMS + β7ABS_ACCRUALS
+ β8LEVERAGE + β9INVENTORY + β10FOREIGN + β11FIRM_AGE (3)
+ β12 INTERNAL_WEAKNESS + β13AUDITOR_TURNOVER
+ β14GOING_CONCERN + β15BUSY_MONTH + β16BIG4
+ year fixed effects
As in equation (1) the main test variable in equations (2) and (3) is BANK Hypothesis 2 predicts
that the coefficient β1 on BANK is negative in both equations
Equations (2) and (3) control for numerous client and auditor characteristics that prior
research finds are associated with audit fees or audit report lag respectively Many of the control
variables included in Equations (2) and (3) also appear in Equation (1) and are defined above
Equation (2) andor equation (3) include the following additional client characteristics16 Special
16 The sets of control variables in equations (2) and (3) are not identical consistent with the models
estimated in prior research
22
items divided by total assets (SPECIAL_ITEMS) an indicator for absolute value of discontinued
operations above $1 million (DISCONTINUED) and an indicator for absolute value of
extraordinary items above $1 million (EXTRA_ITEMS) capture transitory earnings items The
absolute value of accruals divided by total assets (ABS_ACCRUALS) captures other dimensions of
earnings quality The ratio of inventory to total assets (INVENTORY) and the ratio of intangible
assets to total assets (INTANGIBLES) capture balance sheet composition An indicator for negative
common equity (NEG_EQUITY) and the number of years the firm is listed on Compustat
(FIRM_AGE) capture early-stage or otherwise risky firms An indicator for accelerated filer
(ACCEL_FILER) and an indicator for auditor turnover during the year (AUDITOR_TURNOVER)
capture other auditing stresses Fiscal year stock return (RETURN) and the standard deviation of
monthly stock returns (STD_RETURN) capture the aggregate level and the volatility respectively
of exogenous shocks occuring during the fiscal year
As for equation (1) in tabulated specification analyses we include indicator variables for
client total assets in the various size categories and we also include the interactions of these size
indicators with BANK
33 Earnings Management of Minor Concern to Bank Regulators and Supervisors
As discussed in the introduction we expect bank regulators and supervisors to be relatively
unconcerned about types of earnings management that accumulate to relatively small amounts of
retained earnings Such earnings management has minor effects on banksrsquo solvency ratios and so
should not appreciably affect supervisorsrsquo evaluations of banksrsquo safety and soundness We expect
that if bank regulation and supervision leads to lower audit effort in audits of banks than in audits
of control firms as predicted in Hypothesis 2 banks engage more in these types of earnings
23
management than do control firms Motivated by Burgstahler and Dichev (1997) Beatty et al
(2002) and Graham et al (2005) we examine two proxies for such earnings management
First we examine the frequency of small (from 0 to 001) increases in return on equity
(SMALL_POS)17 Based on Beatty et al (2002) we use the following logistic model to explain
SMALL_POS
Prob(SMALL_POS= 1) = eXβ (1 + eXβ) where
Xβ = β0 + β1BANK + β2LogASSETS + β3LEVERAGE + β4MTB (4)
+ β5ACCEL_FILER + β6BIG4 + year fixed effects
We expect the coefficient β1 on BANK to be positive
Second we examine the length of the longest string of consecutive earnings increases for
each firm (STRING) Based on Beatty et al (2002) we use the following Cox proportional hazard
model to explain STRING
h(STRING|X)= h0(STRING) eXβ where
Xβ= β0 + β1BANK + β2LogASSETS + β3LEVERAGE +β4MTB + β5ACCEL_FILER (5)
+ β6INTERNAL_WEAKNESS + β7BIG4 + year fixed effects
h(STRING|X) denotes the hazard function and h0(STRING) denotes the baseline hazard function
We expect the coefficient β1 on BANK to be positive
17 Specifically we compute return on equity (ROE) as net income divided by common equity SMALL_POS takes a
value of one if the change in ROE is greater than zero but smaller than or equal to 001 and zero otherwise
24
4 Data and Sample Selection
41 Data
We obtain audit fee audit report signature date auditor change internal control weakness
and restatement data from Audit Analytics We obtain financial statement data from Compustatrsquos
annual Bank and North American files We obtain geographic and foreign segment data from
Compustatrsquos Segment file If a given firm-year is available in Compustatrsquos Bank file we classify
the firm-year observation as a bank
Our sample covers the fifteen-year period from 2000 to 2014 The sample period begins in
2000 because audit fees are unavailable prior to that year Because SOX-mandated internal control
weakness data become available in 2004 our analysis of internal control weaknesses is limited to
the eleven-year period from 2004 to 2014 We restrict the sample to firm-year observations with
complete data on audit fees auditor identification and audit report signature date from Audit
Analytics as well as on total assets (item AT) total liabilities (item LT) total common equity (item
CEQ) net income (item NI) closing price (item PRCC) and common shares outstanding (item
CSHO) from Compustat These data requirements yield 7914 bank-year observations (965 unique
banks) 671 firm-year observations in SIC 61 (104 unique firms) and 3111 firm-year observations
in the top five percent of the ratio of accounts receivable to total assets (812 unique firms) from
2000ndash2014 The internal control weakness sample includes 5581 bank-year observations 483
firm-year observations for the SIC 61 control sample and 2254 firm-year observations for the top
five percent of the ratio of accounts receivable to total assets control sample from 2004ndash2014
42 Descriptive Statistics
Table 1 reports means for each of the dependent variables (above the line) and each of the
independent variables (below the line) in equations (1)-(5) for the bank sample SIC 61 control
25
sample and highest 5 ratio of accounts receivable to assets control sample Significant
differences of the means for the bank sample versus the SIC 61 control sample and for the bank
sample versus the highest 5 ratio of accounts receivable to assets control sample are indicated in
the columns for the control samples
The differences of the means for the dependent variables are uniformly significant and
consistent with our hypotheses that banks exhibit fewer internal control and accounting problems
than do control sample firms as well as our expectations that banks engage in more of certain types
of earnings management than do control sample firms Consistent with Hypothesis 1 banks are
less likely than both control samples to disclose material internal control weaknesses
(INTERNAL_WEAKNESS) and to restate their financial statements (ACC_RESTATEMENT)
Consistent with Hypothesis 2 on average audit fees (FEE) are lower and audit report lags
(REPORT_LAG) are shorter for banks than for both control samples Consistent with our
expectations for earnings management banks are more likely to report small positive earnings
changes (SMALL_POS) and on overage report longer strings of positive earnings (STRING)
Most of the differences of the means for the independent variables are also significant For
most of these variables the means for banks are closer to those of the a priori more analogous SIC
61 control sample than to those of the highest 5 ratio of accounts receivable to assets control
sample Accordingly we discuss only the former mean differences Compared to the SIC 61
control sample on average banks are smaller (ASSETS) are more profitable (ROA) and have
fewer losses (LOSS) have fewer transitory earnings items (SPECIAL_ITEMS DISCONTINUED
and EXTRA_ITEMS) and lower absolute accruals (ABS_ACCRUALS) have higher financial
leverage (LEVERAGE) have lower non-financial assets (INVENTORY INTANGIBLES and
GOODWILL) despite engaging in more mergers and acquisitions (MampA) are less likely to have
26
negative equity (NEG_EQUITY) or foreign operations (FOREIGN) have insignificantly different
age (AGE) have lower expected growth (MTB) experience lower exogenous shocks (RETURN
and STD_RETURN) and receive fewer going-concern opinions (GOING_CONCERN)
Compared to the SIC 61 control sample on average banks exhibit one characteristic that
stress auditorsrsquo capabilities more frequent December fiscal year-ends (BUSY_MONTH)
However on average banks are less likely to be accelerated filers (ACCEL_FILER) are less likely
to be audited by a Big 4 auditor (BIG4) are less likely to have auditors with high relative industry
market share (ISPEC) and experience less auditor turnover (AUDITOR_TURNOVER)
5 Empirical Results
51 Frequencies of Internal Control and Accounting Problems
Hypothesis 1 predicts that due to bank regulation and supervision banks exhibit fewer
internal control and accounting problems than do similar unregulated firms To test this hypothesis
Tables 2 and 3 report logistic estimations of equation (1) with the dependent variables
INTERNAL_WEAKNESS and ACC_RESTATEMENT respectively18 We report the estimation of
each model for the combined bank sample and SIC 61 control sample in the left column of the
table and for the combined bank sample and highest 5 ratio of accounts receivable to assets
control sample in the right column of the table
We estimate each model in two different ways Panel A of each table reports the estimation
of the base model To better control for size differences between the bank and control samples
Panel B of each table reports estimations of the equations replacing LogASSETS with the client
18 In untabulated analyses we also examine adverse restatements that reduce ownersrsquo equity and auditor
resignations We find results consistent with those reported in the paper
27
size category indicators (B10_50 B50_100 B100_500 and B500) both separately and interacted
with BANK The coefficient on BANK captures the total effect for the smallest banks (assets less
than $10 billion) The coefficient on the interaction of BANK with a given size category indicator
captures the effect for the banks in that size category incremental to the effect for the smallest
banks The sum of the coefficients on BANK and on the interaction of BANK with a given size
category indicator captures the total effect for the banks in that size category
The model fits and the coefficients on the control variables generally are as expected based
on prior research For simplicity we primarily discuss the statistical and economic significance of
the coefficient β1 on BANK estimated on the combination of the bank sample and the more
analogous SIC 61 control sample reported in the left column of Panel A of the tables We point
out any notable differences of the results for the other models All of these differences pertain to
the coefficients on BANK and the interactions of BANK with the size category indicators in Panel
B which typically indicate that the effects we document are limited to certain size categories In
particular no notable differences arise from the use of different control samples in the estimations
reported in the left and right columns of the tables In discussing economic significance we focus
on eβ1 the differential frequency of internal control and accounting problems for banks versus non-
banks
Examining the estimation of equation (1) with dependent variable
INTERNAL_WEAKNESS reported in the left column of Panel A of Table 2 we find that the
coefficient on BANK is negative (-0781) and significant at the 1 level This coefficient implies
that banks disclose material internal control weaknesses with only 46 of the frequency of SIC
control sample firms controlling for other factors that prior research finds are associated with
28
internal control weaknesses These results are consistent with Hypothesis 1 that bank regulation
and supervision reduce the frequency of banksrsquo internal control problems
In left column of Panel B of Table 2 the coefficient on BANK is negative as expected but
insignificant Notice however that the coefficients on the interactions of BANK with all of the
size category indicators are also negative with these coefficients being significant at the 1 and
10 levels for the interactions of BANK with B10_50 and B50_100 respectively The sum of the
coefficients on BANK and BANKtimesB10_50 is significantly negative at the 1 level and the sum of
the coefficients on BANK and BANKtimesB50_100 is significantly negative at the 10 level These
results imply that banks with assets from $10 billion to $100 billion disclose significantly fewer
internal control weaknesses than do similarly sized control firms consistent with Hypothesis 1
whereas banks in other size categories disclose internal control weaknesses with insignificantly
different frequency
Examining the estimation of equation (1) with dependent variable ACC_RESTATEMENT
reported in the left column of Panel A of Table 3 we find that the coefficient on BANK is negative
(-1075) and significant at the 1 level This coefficient implies that banks report financial
statement restatements with only 34 of the frequency of SIC 61 control sample firms controlling
for other factors that prior research finds are associated with restatements These results are
consistent with Hypothesis 1 that bank regulation and supervision reduce the frequency of banksrsquo
accounting problems
In the left column of Panel B of Table 3 the coefficient on BANK is negative as expected
but insignificant Again notice however that the coefficients on the interactions of BANK with all
of the size category indicators are also negative with the coefficient on the interaction of BANK
with B10_50 significant at the 5 level The sum of the coefficients on BANK and its interaction
29
with B10_50 is significantly negative at the 1 level and the sum of the coefficients on BANK and
its interaction with B100_500 is significantly negative at the 10 level These results imply that
banks with assets from $10 billion to $50 billion and from $100 billion to $500 billion report
significantly fewer accounting restatements than similarly sized control firms consistent with
Hypothesis 1 whereas banks in other size categories report accounting restatements with
insignificantly different frequency
Collectively the results reported in Tables 2 and 3 for disclosed material internal control
weaknesses and accounting restatements are consistent with bank regulation and supervision
rendering engagements for audits banks less risky than for audits of control sample firms for some
size categories and insignificantly differently risky for other size categories
52 Audit Effort
Hypothesis 2 predicts that bank regulation and supervision lead bank auditors to expend
less effort We proxy for (lower) audit effort using (lower) audit fees and (shorter) audit report
lags To test this hypothesis Table 4 reports OLS estimations of equation (2) that explain the
natural logarithm of audit fees (LogFEE) while Table 5 reports OLS estimations of equation (3)
that explain the natural logarithm of the number of days between the fiscal year end and the audit
report signature date (LogREPORT_LAG) The structures of Tables 4 and 5 are the same as those
of Tables 2 and 3 The left columns of the tables report the estimations for the combined bank
sample and SIC 61 control sample The right columns of the tables report the estimations for the
combined bank sample and highest 5 ratio of accounts receivable to assets control sample Panel
A of the tables report the estimation of the base model and Panel B of the tables report the
estimation of the models that include the size category indicators both separately and interacted
with BANK As for the analyses of internal control and accounting problems discussed in Section
30
51 the model fits and the coefficients on the control variables generally are as expected based on
prior literature so we discuss only the statistical and economic significance of the coefficients β1
on BANK in Panel A and of the coefficients on BANK and the interactions of BANK with the size
category indicators in Panel B
Examining the estimation of equation (2) with dependent variable LogFEE reported in the
left column of Panel A of Table 4 we find that the coefficient on BANK is negative (-0705) and
significant at the 1 level This coefficient implies that on average audit fees for banks are only
49 of that for SIC 61 control sample firms controlling for other factors that prior research finds
are associated with audit fees These results are consistent with Hypothesis 2rsquos prediction that bank
regulation and supervision lead to reduced audit effort
In both columns of Panel B of Table 4 the coefficient on BANK is significantly negative
as expected However the coefficient on the interactions of BANK with the largest size category
B500 is significantly positive and of similar absolute magnitude as the coefficient on BANK As a
result the coefficient on the sum of BANK and its interaction with B500 is insignificantly different
from zero whereas the sum of the coefficients on BANK and its interactions with each of the other
size indicators is significantly negative These results imply that relative to similarly sized control
firms audit effort is lower for banks with assets up to $500 billion and audit effort is
insignificantly different for banks with assets exceeding $500 billion The latter result is consistent
with the (relatively few) banks in the largest (money center) size category experiencing elevated
audit fees compared to non-banks of the same size
Examining the estimation of equation (2) with dependent variable LogREPORT_LAG
reported in the left column of Panel A of Table 5 we find that the coefficient on BANK is negative
(-0101) and significant at the 1 level This coefficient implies that on average audit report lag
31
for banks is only 90 of that for SIC 61 control sample firms controlling for other factors that
prior research finds are associated with audit report lag These results are consistent with
Hypothesis 2rsquos prediction that bank regulation and supervision lead to reduced audit effort
In both columns of Panel B of Table 5 the coefficient on BANK is significantly negative
as expected However the coefficients on the interactions of BANK with all of the size categories
are positive often significantly so and of similar absolute magnitude as the coefficient on BANK
As a consequence none of the sums of the coefficients on BANK and its interactions with the size
category indicators is significant These results imply that relative to similarly sized control firms
audit report lag is shorter and thus audit effort is lower for banks with assets up to $10 billion and
audit report lag is insignificantly different for banks with assets exceeding $10 billion
Collectively the audit fee and audit report lag estimation results reported in Tables 4 and
5 provide evidence consistent with bank regulation and supervision leading auditors to expend
lower audit effort on audits of banks in certain size categories
53 Identification Tests for the Audit Fee Model
To provide support for bank regulation and supervision as causally explaining the reduced
audit effort in bank audits that we document in Tables 4 and 5 we estimate expansions of equation
(2) explaining the natural logarithm of audit fees and equation (3) explaining the natural logarithm
of log audit report lag that include time-series or cross-sectional proxies for the intensity of bank
regulation and we test whether audit effort is lower when regulatory intensity is higher As the
inferences generated are similar to conserve space we tabulate and discuss only the results for the
expanded audit fee model
Table 6 reports OLS estimations of equation (2) with LogFEE as the dependent variable
expanded to include one of two measures of time-series measures of bank regulation intensity The
32
sample is limited to 7914 bank-year observations (965 unique banks) from 2000 to 2014 so BANK
is dropped from the equation The first bank regulation intensity measure is based on RegData an
industry- and year-specific regulation index constructed by Al-Ubaydli and McLaughlin (2017)
from textual analysis of the number of constraints (the strings ldquoshallrdquo ldquomustrdquo ldquomay notrdquo
ldquoprohibitedrdquo and ldquorequiredrdquo) in the Code of Federal Regulations (CFR) The measure used is the
natural logarithm of the number of constraints in CFR Title 12 for the banking industry each year
(LogRESTRICTIONS) The second measure is the natural logarithm of the annual budget (in $
millions) of the ldquofinance and bankingrdquo subcategory (which includes the Comptroller of the
Currency Federal Deposit Insurance Corporation and Securities and Exchange Commission)
from Regulatory Reports available at httpswcwustleduregulatory_reports (LogBUDGET)
Figure 1 depicts the evolutions of LogRESTRICTIONS and LogBUDGET from 2000-2014 Panel
A of Table 6 reports descriptive statistics of the two measures of bank regulation intensity
The left (right) columns of Table 6 report the estimation of equation (2) adding
LogBUDGET (LogRESTRICTIONS) to the model The coefficients on LogBUDGET and
LogRESTRICTIONS are both significantly negative at the 1 level consistent with more intense
bank regulation leading to lower audit fees
Table 7 reports the OLS estimations of equation (2) with LogFEE as the dependent variable
expanded to include Agarwal et alrsquos (2014) measure of regulatory leniency (ie inverse intensity)
across state-chartered banks (STATE_REG) This measure is based on the ldquoalternating examination
programrdquo in which state-chartered banks are examined by (more stringent) federal supervisors (the
FDIC or Federal Reserve) and state supervisors in rotation Using a proprietary database Agarwal
et al (2014) estimate the differential examination stringency of federal supervisors versus 44 state
supervisors The left column reports the estimation of an expanded model that includes
33
STATE_REG linearly This model is estimated on 5679 state bankndashyear observations (738 unique
banks) from 2000 to 2014 The right column reports the estimation of an expanded model that
includes STATE_REG both linearly and interacted with an indicator for state-chartered banks
(STATE_BANK) obtained from the FDIC website
(httpswww5fdicgovidaspadvSearchLandingasp) This model is estimated on 7340 (federal
and state) bankndashyear observations (903 unique banks) from 2000 to 2014 The coefficient on
STATE_REG in the left column and the coefficient on STATE_REGtimesSTATE_BANK in the right
column of the table are both significant positive at the 5 level consistent with more lenient state
regulation yielding higher audit fees
Overall the expanded audit fee model estimation results reported Tables 6 and 7 provide
evidence consistent with (more intense) bank regulation and supervision causally explaining the
(more strongly) reduced audit effort in bank audits that we document in Tables 4 and 5
53 Types of Earnings Management of Minor Concern to Bank Regulators and Supervisors
If bank regulation and supervision leads to lower audit effort banks should have more
ability to exercise accounting discretion to manage accounting numbers in ways that do not
significantly concern bank regulators and supervisors Drawing on Beatty et al (2002) we
examine two types of earnings management the frequency of small positive earnings
(SMALL_POS) and the length of the longest string of consecutive earnings increases (STRING)19
We conjecture that these types of earnings management typically accumulate to relatively small
amounts of retained earnings If so these types have relatively minor effects on banksrsquo solvency
19 A side benefit of our use of these earnings management measures is that they are just as naturally applied
to banks as to non-banks In contrast the most commonly used measures of earnings management in the
literature (Jones 1991 Dechow and Dichev 2002) are not as naturally applied to banks
34
ratios and so should be of minor concern to bank regulators and supervisors primarily concerned
with banksrsquo safety and soundness While we are unaware of any supporting empirical evidence for
our conjecture it is consistent with the absence of any mention of these types of earnings
management in bank supervisory manuals including the portions devoted to the evaluation of
earnings quality (Comptroller of the Currency 2007 p 53 Board of Governors of the Federal
Reserve System 2017 sect40203) In contrast based on the large empirical literature documenting
such earnings management and its capital market consequences by public firms in general and by
public banks in particular (Burgstahler and Dichev 1997 Beatty et al 2002 Bartov et al 2002
Brown and Caylor 2005) we expect these types of earnings management to significantly influence
banksrsquo investors and contracting parties and to be of concern to auditors
To test for differences in SMALL_POS for banks versus the firms in the control samples
Table 8 reports the logistic estimation of equation (4) with SMALL_POS as the dependent variable
for the combined BANK sample and SIC 61 control sample (left column) and for the combined
BANK sample and highest 5 ratio of accounts receivable to assets control sample (right column)
A positive coefficient β1 on BANK implies that banks exhibit more frequent small positive earnings
changes than do control firms consistent with bank regulation and supervision leading to lower
bank audit effort In both columns the coefficient on BANK is significantly positive at the 1
level The coefficient in the left (right) column implies that banks report small positive earnings
44 (25) times as frequently as the corresponding control sample firms controlling for other
variables that prior research shows are associated with the frequency of small positive earnings
To test for differences in STRING for banks versus control firms Table 9 reports the
estimation of equation (3) using the Cox proportional hazard approach for the combined BANK
sample and SIC 61 control sample (left column) and for the combined BANK sample and highest
35
5 ratio of accounts receivable to assets control sample (right column) The Cox proportional
hazard approach accounts for the right-censoring of STRING arising from our sample ending in
2014 A positive coefficient β1 on BANK implies that banks exhibit earnings strings with
incrementally longer length than do control firms consistent with bank regulation and supervision
leading to lower bank audit effort In both columns the coefficient on BANK is significantly
positive at the 1 level The coefficient in the left (right) column implies that banks report strings
of positive earnings that are 47 (94) longer than the corresponding control sample firms
controlling for other variables that prior research shows are associated with the length of earnings
strings
Collectively the results from Tables 8 and 9 indicate that compared to control firms banks
are more likely to engage in types of earnings management of minor concern to bank regulators
and supervisors consistent with bank regulation and supervision leading to lower audit effort in
audits of banks
6 Conclusion
A central feature of banks is they are regulated and supervised under numerous banking
laws and regulations Moreover bank supervision involves periodic on-site examinations and off-
site monitoring activities that overlap considerably with auditing activities In this paper we
examine whether bank regulation and supervision displace bank auditing leading to lower audit
effort in audits of banks than in audits of two control samples of similar unregulated firms (1)
non-depository credit institutions (two-digit SIC code 61) and (2) all non-banks in the highest five
percent of the ratio of accounts receivable (which includes loan and lease receivables) to total
assets Our results are consistent with bank regulation and supervision substituting for auditing
36
ie with audit effort being significantly lower in audits of banks than in audits of control sample
firms
We first provide evidence that banking engagements pose less risk to auditors We show
that banks are significantly less likely than control sample firms to disclose material weaknesses
in internal controls and to restate their financial statements controlling for the variables that prior
research shows to be associated with material internal control weaknesses and restatements We
then provide evidence consistent with auditors exerting less effort on audits of banks than on audits
of control sample firms We show that banks exhibit statistically and economically lower audit
fees and shorter audit report lags than do control sample firms controlling for the variables that
prior research shows to be associated with audit fees and audit report lags
We acknowledge that the primary threat to inference in our study is the possibility that
factors other than bank regulation and supervision might explain why audits of banks pose less
audit risk than do audits of control firms Although we cannot rule out this possibility altogether
we conduct two sets of tests to provide support for the conclusion that the associations we
document are causal First we provide evidence that bank auditors expend less effort when bank
regulation and supervision are more intense We use two time-series measures based on the text
of banking regulations and the annual budget of federal regulators and one cross-sectional measure
based on Agarwal et al (2014) of the intensity of bank regulation and supervision Second we
provide evidence that banks are more likely to engage in two types of earnings management that
are of minor concern to bank regulators and supervisors but that prior research shows have capital
market consequences (Bartov et al 2002 Brown and Caylor 2005) We find that banks report more
frequent small positive earnings and longer strings of earnings increases than do similar firms
37
We contribute to the banking and auditing literatures by providing evidence consistent
with auditors expending less effort in auditing banks than in auditing control sample firms due
to the overlap of the activities of bank regulators and supervisors with those of auditors We
emphasize that our evidence does not suggest that the aggregate monitoring of banksrsquo financial
reporting by bank regulators supervisors and auditors differs from the monitoring of similar
firmsrsquo financial reporting by auditors alone it only suggests that the monitoring conducted by
bank auditors is less Because of the importance of banks to stability and overall macroeconomic
health a compelling question is what incremental costs arise when bank auditors as financial
reporting specialists expend less effort on bank audits due to the existence of bank regulation
and supervision We provide evidence that this reduced effort leads to types of earnings
management that likely have minor effects on banksrsquo solvency ratios but have capital market
consequences documented by prior research that may lead to reduced market discipline over
banks We expect these results to be of interest to bank and auditing policymakers
38
References
Acharya V and S Ryan 2016 Banksrsquo financial reporting and financial system stability Journal
of Accounting Research 54 277ndash340
Acharya V 2014 A transparency standard for derivatives Chapter 6 in Risk Topography
Systematic Risk and Macro Modeling edited by M Brunnermeier and A Krishnamurthy
National Bureau of Economic Research University of Chicago Press 2014
Agarwal S D Lucca A Seru and F Trebbi 2014 Inconsistent regulators Evidence from
banking Quarterly Journal of Economics 129 889ndash938
Altamuro J and A Beatty 2010 How does internal control regulation affect financial reporting
Journal of Accounting and Economics 49 58ndash74
Al-Ubaydli O and P McLaughlin 2017 RegData A numerical database on industry-specific
regulations for all United States industries and federal regulations 1997-2012 Regulation
amp Governance 11 109-123
Ashbaugh-Skaife H D Collins and W Kinney Jr 2007 The discovery and reporting of internal
control deficiencies prior to SOX-mandated audits Journal of Accounting and Economics
44 166ndash192
Ashton R J Willingham and R Elliot 1987 An empirical analysis of audit delay Journal of
Accounting Research 25 275ndash292
Avraham D P Selvaggi and J Vickrey 2012 A structural view of US bank holding companies
Federal Reserve Bank of New York Economic Policy Review 18 65ndash81
Badertscher B J Burks and P Easton 2016 The market reaction to bank regulatory filings
Working paper University of Notre Dame
Bamber E L Bamber and M Schoderbek 1993 Audit structure and other determinants of audit
report lag An empirical analysis Auditing A Journal of Practice and Theory 12 1ndash23
Barth J T Li and W Lu 2009 Bank regulation in the United States CESifo Economic Studies
10 2ndash29
Barth M and W Landsman 2010 How did financial reporting contribute to the financial crisis
European Accounting Review 19 399-433
Bartov E D Givoly and C Hayn 2002 The rewards to meeting or beating earnings expectation
Journal of Accounting and Economics 33 (2) 173-204
39
Beatty A B Ke and K Petroni 2002 Earnings management to avoid earnings declines across
publicly and privately held banks The Accounting Review 77 547ndash570
Beatty A and S Liao 2014 Financial accounting in the banking industry A review of the
empirical literature Journal of Accounting and Economics 58 339ndash383
Bedard J and K Johnstone 2004 Earnings manipulation risk corporate governance risk and
auditorsrsquo planning and pricing decisions The Accounting Review 79 277ndash304
Bell T W Landsman and D Shackelford 2001 Auditorsrsquo perceived business risk and audit
fees Analysis and evidence Journal of Accounting Research 39 35ndash43
Board of Governors of the Federal Reserve Board System 2017 Bank Holding Company
Supervision Manual Division of Banking Supervision and Regulation
httpswwwfederalreservegovpublicationssupervision_bhchtm
Bronson S C Hogan M Johnson and K Ramesh 2011 The unintended consequences of
PCAOB auditing standard nos 2 and 3 on the reliability of preliminary earnings releases
Journal of Accounting and Economics 51 95ndash114
Brown L and M Caylor 2005 A temporal analysis of quarterly earnings thresholds Propensities
and valuation consequences The Accounting Review 80 (2) 423-440
Burgstahler D and I Dichev 1997 Earnings management to avoid earnings decreases and losses
Journal of Accounting and Economics 24 99ndash126
Comptroller of the Currency 2007 (last updated 2017) Bank supervision process Comptrollerrsquos
handbook
Costello A J Granja and J Weber 2016 Do strict regulators increase the transparency of the
banking system Working paper Massachusetts Institute of Technology
Dang T G Gorton B Holmstroumlm and Ordontildeez G 2014 Banks as secret keepers PIER working
paper no 14-022
Dechow P and I Dichev 2002 The quality of accruals and earnings The role of accrual
estimation errors The Accounting Review 77 35ndash59
DeFond M and J Zhang 2014 A review of archival auditing research Journal of Accounting
and Economics 58 275ndash326
Diamond D 1984 Financial intermediation and delegated monitoring Review of Economic
Studies 51 393ndash414
40
Doyle J W Ge and S McVay 2007a Accruals quality and internal control over financial
reporting The Accounting Review 82 1141ndash1170
Doyle J W Ge and S McVay 2007b Determinants of weaknesses in internal control over
financial reporting Journal of Accounting and Economics 44 193ndash223
Flannery M S Kwan and M Nimalendran 2013 The 2007ndash2009 financial crisis and bank
opaqueness Journal of Financial Intermediation 22 55ndash84
Francis J E Maydew and H Sparks 1999 The role of big 6 auditors in the credible reporting
of accruals Auditing A Journal of Practice and Theory 18 17ndash34
Gallemore J 2016 Bank financial reporting opacity and regulatory intervention Working paper
University of Chicago
Ge W and S McVay 2005 The disclosure of material weaknesses in internal control after the
Sarbanes-Oxley Act Accounting Horizons 19 137ndash158
Ghosh A and C Tang 2015 Assessing financial reporting quality of family firms The auditorsrsquo
perspective Journal of Accounting and Economics 60 95ndash116
Graham J C Harvey and S Rajgopal 2005 The economic implications of corporate financial
reporting Journal of Accounting and Economics 40 3ndash73
Guay W D Samuels D Taylor 2016 Guiding through the fog Financial statement complexity
and voluntary disclosure Journal of Accounting and Economics 62 234ndash269
Hennes K A Leone and B Miller 2014 Determinants and market consequences of auditor
dismissals after accounting restatements The Accounting Review 89 1051ndash1082
Holmstroumlm B 2015 Understanding the role of debt in the financial system BIS working paper
no 479
Houston R M Peters and J Pratt 1999 The audit risk model business risk and audit‐planning
decisions The Accounting Review 74 281ndash298
Jensen M and W Meckling Theory of the firm Managerial behavior agency costs and
ownership structure Journal of Financial Economics 3 305ndash360
Jones J 1991 Earnings management during import relief investigations Journal of Accounting
Research 29 193ndash228
Keeley J 2017 The impact of regulatory enforcement on bank risk Working paper New York
University
41
Kinney W Palmrose Z and S Scholz 2004 Auditor independence non-audit services and
restatements Was the US government right Journal of Accounting Research 42 561ndash588
Krishnan J and J Krishnan 1997 Litigation risk and auditor resignations The Accounting
Review 72 539ndash560
Lee H V Mande and R Ortman 2004 The effect of audit committee and board of director
independence on auditor resignation Auditing A Journal of Practice and Theory 23 (2)
131ndash146
Morgan D 2002 Rating banks Risk and uncertainty in an opaque industry The American
Economic Review 92 874ndash888
Myers S 1977 Determinants of corporate borrowing Journal of Financial Economics 5 147-
175
Nicoletti A 2016 The effects of auditors and regulators on bank financial reporting Evidence
from loan loss provisions Doctoral dissertation Ohio State University
Nier E and U Baumann 2006 Market discipline disclosure and moral hazard in banking
Journal of Financial Intermediation 15 332ndash361
Palmrose Z and S Scholz 2004 The circumstances and legal consequences of non-GAAP
reporting Evidence from restatements Contemporary Accounting Research 21 139ndash180
Pettway R and J Sinkey 1980 Establishing on-site bank examination priorities An early-
warning system using accounting and market information Journal of Finance XXXV 137ndash
150
Public Company Accounting Oversight Board (PCAOB) Auditing Standard No 8 Audit Risk
Washington DC PCAOB
Public Company Accounting Oversight Board (PCAOB) Auditing Standard No 12 Identifying
and Assessing Risks of Material Misstatement Washington DC PCAOB
Public Company Accounting Oversight Board (PCAOB) Auditing Standard No 13 The
Auditorrsquos Responses to the Risks of Material Misstatement Washington DC PCAOB
Richardson M K Schoenholtz B Tuckman and L White eds 2017 Regulating Wall Street
CHOICE Act vs Dodd-Frank New York Center for Global Economy and Business NYU
Stern School of Business
Ryan S 2007 Financial Instruments and Institutions Accounting and Disclosure Rules Second
edition John Wiley and Sons Hoboken NJ
42
Ryan S 2011 Financial reporting for financial instruments Foundations and Trends in
Accounting 6 187ndash354
Schwartz K and B Soo 1995 An analysis of Form 8-K disclosures of auditor changes by firms
approaching bankruptcy Auditing A Journal of Practice and Theory 14 124ndash136
Shu S Auditor resignations Clientele effects and legal liability Journal of Accounting and
Economics 29 173-205
Simunic D 1980 The pricing of audit services Theory and evidence Journal of Accounting
Research 18 161ndash190
Simunic D and M Stein 1996 The impact of litigation risk on audit pricing A review of the
economics and the evidence Auditing A Journal of Practice and Theory 15 (Supplement)
119ndash134
Watts R L and J L Zimmerman 1986 Positive Accounting Theory Prentice-Hall Inc
43
Table 1 Variable means for banks versus control firms
CONTROL BANK SIC61 High RECAT Mean Mean Difference Mean Difference INTERNAL_WEAKNESS 0024 0051 0026 0066 0042 ACC_RESTATEMENT 0006 0022 0016 0020 0014 FEE ($ million) 1643 6199 4555 3119 1476 REPORT_LAG 59325 68854 9530 68110 8785 SMALL_POS 0174 0063 ndash0111 0063 ndash0110 STRING 5608 4500 ndash1108 3347 ndash2261 ASSETS ($ billion) 39135 102555 63420 30418 8717 ROA 0006 ndash0006 ndash0012 ndash0008 ndash0014 LOSS 0108 0249 0141 0274 0167 SPECIAL_ITEMS ndash0001 ndash0015 ndash0015 ndash0020 ndash0019 DISCONTINUED 0029 0162 0134 0105 0077 EXTRA_ITEMS 0011 0048 0036 0031 0019 ABS_ACCRUALS 0027 0092 0065 0107 0080 LEVERAGE 0902 0722 ndash0180 0610 ndash0292 INVENTORY 0013 0056 0043 0071 0058 INTANGIBLES 0012 0039 0026 0074 0061 GOODWILL 0010 0019 0010 0056 0047 MampA 0198 0152 ndash0046 0228 0030 NEG_EQUITY 0003 0025 0023 0038 0035 FOREIGN 0040 0121 0081 0193 0153 FIRM_AGE 14340 14735 0395 18011 3671 ACCEL_FILER 0626 0689 0063 0608 ndash0018 MTB 1437 1700 0263 2601 1164 RETURN 0106 0171 0065 0179 0073 STD_RETURN 0084 0144 0060 0154 0070 GOING_CONCERN 0006 0015 0009 0028 0022 BUSY_MONTH 0879 0790 ndash0089 0715 ndash0164 BIG4 0444 0668 0224 0630 0185 ISPEC 0115 0166 0051 0162 0046 AUDITOR_TURNOVER 0072 0079 0007 0093 0021
This table reports variable means for the BANK and two CONTROL samples as well as the differences of variable means across the BANK and each CONTROL sample over the period 2000ndash2014 Inclusion in the BANK sample is based on inclusion in the Compustat Bank file (7914 bank-year observations) The SIC61 sample includes non-depository credit institutions with two-digit standard industry classification (SIC) code 61 on the Compustat Annual North American file (671
44
firm-year observations) The High RECTA control sample includes non-bank firms with a ratio of accounts receivable to total assets in the top 5 of the Compustat Annual North American file (3110 firm-year observations) All variables are measured for a given firm-year unless indicated otherwise The dependent variables are reported above the line in the table and are defined as follows INTERNAL_WEAKNESS = 1 if the firm disclosed internal control deficiencies and 0 otherwise ACC_RESTATEMENT = 1 if the firm subsequently restated its 10-K filing for the fiscal year and 0 otherwise FEE = the sum of audit fees and audit-related fees in $ millions REPORT_LAG = the number of days between the fiscal year-end date and auditor signature date (the natural logarithm of this variable is used in the regression analyses) SMALL_POS = 1 if a small ROE increase (000lt∆R0Ele001) is reported STRING = the duration of the longest string of consecutive annual earnings increases for the firm The control variables are reported below the line in the table and are defined as follows ASSETS = total assets ROA = net income divided by total assets LOSS = 1 if the firm reports negative net income and 0 otherwise SPECIAL_ITEMS = special items divided by total assets DISCONTINUED = 1 if discontinued operations exceeds $1 million and 0 otherwise EXTRA_ITEMS = 1 if (absolute) extraordinary items exceeds $1 million and 0 otherwise ABS_ACCRUALS = absolute value of accruals divided by total assets LEVERAGE = total liabilities divided by total assets INVENTORY = inventory divided by total assets INTANGIBLES = intangibles assets divided by total assets GOODWILL = goodwill divided by total assets MampA = 1 if goodwill increases by more than $1 million and 0 otherwise NEG_EQUITY = 1 if common equity is negative and 0 otherwise FOREIGN = 1 if a company reports non-zero foreign exchange income and 0 otherwise FIRM_AGE = the number of years a company is listed in Compustat ACCEL_FILER = 1 if the company is an accelerated filer and 0 otherwise MTB = market value of equity divided by book value of equity RETURN = fiscal year stock return STD_RETURN = standard deviation of monthly stock returns GOING_CONCERN = 1 if the firm received a goingndashconcern modified opinion and 0 otherwise BUSY_MONTH = 1 if the fiscal year-end month is December and 0 otherwise BIG4 = 1 if the company is audited by one of the Big-Four auditors and 0 otherwise ISPEC = auditorrsquos relative market share of audit fees in the clientrsquos FamandashFrench 48 industry classification AUDITOR_TURNOVER = 1 if the firmrsquos auditor changed during the year and 0 otherwise and denote significantly different variable means for the BANK and each CONTROL sample at the 1 5 and 10 levels respectively
45
Table 2 Likelihood of material internal control weaknesses for banks versus control firms
Panel A Logistic estimation of likelihood of material internal control weaknesses CONTROL SIC61 High RECTA BANK ndash0781 (0002) ndash0556 (0001) LogASSETS 0053 (0301) 0014 (0681) ROA 1208 (0441) 0138 (0718) LOSS 1469 (0000) 1335 (0000) LEVERAGE 0663 (0435) ndash0816 (0017) GOODWILL 2950 (0215) 1048 (0206) MampA 0058 (0767) 0194 (0187) FOREIGN ndash0561 (0160) 0463 (0004) MTB 0030 (0536) ndash0041 (0091) GOING_CONCERN 2034 (0000) 1324 (0000) ACC_RESTATEMENT (Y_CONTROL) ndash0076 (0917) 0266 (0574) BUSY_MONTH ndash0020 (0929) 0187 (0203) BIG4 ndash1259 (0029) ndash0863 (0001) ISPEC 4431 (0036) 2211 (0008) Intercept ndash3940 (0001) ndash1463 (0002) Year fixed effects Yes Yes Observations 6064 7834 McFaddens R2 827 952 Panel B Incorporating bank size categories SIC61 High RECTA Intercept ndash4564 (0000) ndash1942 (0000) B10_50 1167 (0041) ndash0047 (0896) B50_100 0308 (0731) ndash0340 (0666) B100_500 ndash0729 (0527) ndash14727 (0983) B500 0032 (0969) ndash0465 (0444) BANK ndash0014 (0968) ndash0499 (0007) BANKB10_50 ndash1704 (0005) ndash0256 (0551) BANKB50_100 ndash2210 (0093) ndash1468 (0246) BANKB100_500 ndash1369 (0296) 12904 (0985) BANKB500 ndash15538 (0978) ndash13901 (0971) Control variables Yes Yes Year fixed effects Yes Yes Observations 6064 7834 McFaddens R2 984 1048
The table reports the logistic estimation of the likelihood of a firm reporting a material weakness in internal control over financial reporting The dependent variable INTERNAL_WEAKNESS = 1 if the firm disclosed a material internal control deficiency and 0 otherwise The main test variable BANK = 1 if the firm is on Bank Compustat and 0 otherwise We estimate the model on the combined BANK sample and one of two control samples of firms that are similar to banks but unregulated (1) The SIC61 control sample comprises non-depository credit institutions with two-digit standard industry classification (SIC) code 61 on Annual North American Compustat (2) the High RECTA control sample comprises non-banks with the top 5 of receivable to assets ratio on Annual North American Compustat The control variables are defined as follows LogASSETS = the natural logarithm of total assets ROA = net income divided by total assets LOSS = 1 if the firm reports negative net income and 0 otherwise LEVERAGE = total liabilities divided by total assets GOODWILL = goodwill divided by total assets MampA = 1 if the firmrsquos goodwill increases by more than $1 million and 0 otherwise FOREIGN = 1 if a firm reports non-zero foreign exchange income and 0 otherwise MTB = market value of equity divided by book value of equity GOING_CONCERN = 1 if a firm receives a going concern modified opinion and 0 otherwise ACC_RESTATEMENT = 1 if the firm subsequently restates its current period Form 10-K filing for the fiscal year BUSY_MONTH = 1 if the fiscal year-end is December and 0 otherwise BIG4 = 1 if the firm is audited by one of the Big-Four auditors and 0 otherwise ISPEC = auditorrsquos relative market share of
46
audit fees in the clientrsquos FamandashFrench 48 industry classification Panel A reports the base model estimation Panel B reports the estimation of an expanded model which includes firm size indicators and their interactions with BANK The firm size indicators are denoted Bj_k=1 if total assets are between j and k $ billion for j=10 50 or 100 and for k=50 100 or 500 and are denoted B500=1 if total assets exceed $500 billion p-values are reported in parentheses
47
Table 3 Likelihood of financial statement restatements for banks versus control firms
Panel A Logistic estimation of restatements CONTROL SIC61 High RECTA BANK ndash1075 (0005) ndash1520 (0000) LogASSETS 0006 (0947) 0082 (0134) ROA 0155 (0934) ndash0815 (0242) LOSS 0271 (0451) 0359 (0167) LEVERAGE ndash0755 (0518) 0890 (0157) GOODWILL ndash13070 (0151) ndash5891 (0014) MampA 0569 (0095) 0527 (0036) FOREIGN ndash0678 (0295) ndash0817 (0026) MTB ndash0050 (0748) 0049 (0084) GOING_CONCERN ndash13976 (0992) ndash14082 (0979) INTERNAL_WEAKNESS (Y_CONTROL) ndash0218 (0768) 0017 (0972) BUSY_MONTH ndash0023 (0952) ndash0439 (0058) BIG4 1087 (0100) 0635 (0111) ISPEC ndash2067 (0399) ndash1643 (0258) Intercept ndash4288 (0000) ndash5118 (0000) Year fixed effects Yes Yes Observations 8585 11024 McFaddens R2 765 902 Panel B Incorporating bank size into the analyses SIC61 High RECTA Intercept ndash5023 (0000) ndash5551 (0000) B10_50 0512 (0550) ndash0022 (0962) B50_100 ndash0080 (0950) ndash0728 (0510) B100_500 0568 (0609) ndash0476 (0584) B500 ndash14268 (0984) ndash1148 (0223) BANK ndash0552 (0294) ndash1349 (0000) BANKB10_50 ndash2798 (0029) ndash2119 (0053) BANKB50_100 ndash13314 (0978) ndash13363 (0986) BANKB100_500 ndash0962 (0359) 0307 (0743) BANKB500 ndash0169 (1000) ndash13623 (0985) Control variables Yes Yes Year fixed effects Yes Yes Observations 8585 11024 McFaddens R2 1029 1035
The table reports the logistic estimation of the likelihood of a firm reporting a financial statement restatement The dependent variable ACC_RESTATEMENT = 1 if the firm subsequently restated its 10-K filing for the fiscal year and zero otherwise The main test variable BANK = 1 if the firm is on Bank Compustat and 0 otherwise We estimate the model on the combined BANK sample and one of two control samples of firms that are similar to banks but unregulated (1) The SIC61 control sample comprises non-depository credit institutions with two-digit standard industry classification (SIC) code 61 on Annual North American Compustat (2) the High RECTA control sample comprises non-banks with the top 5 of receivable to assets ratio on Annual North American Compustat The control variables are defined as follows LogASSETS = the natural logarithm of total assets ROA = net income divided by total assets LOSS = 1 if the firm reports negative net income and 0 otherwise LEVERAGE = total liabilities divided by total assets GOODWILL = goodwill divided by total assets MampA = 1 if the firmrsquos goodwill increases by more than $1 million and 0 otherwise FOREIGN = 1 if a firm reports non-zero foreign exchange income and 0 otherwise MTB = market value of equity divided by book value of equity GOING_CONCERN = 1 if a firm receives a going concern modified opinion and 0 otherwise INTERNAL_WEAKNESS= 1 if the firm disclosed internal control deficiencies and 0 otherwise BUSY_MONTH = 1 if the fiscal year-end is December and 0 otherwise BIG4 = 1 if the firm is audited by one of the Big-Four auditors and 0 otherwise ISPEC = auditorrsquos relative market share of audit fees in the clientrsquos FamandashFrench
48
48 industry classification Panel A reports the base model estimation Panel B reports the estimation of an expanded model which includes firm size indicators and their interactions with BANK The firm size indicators are denoted Bj_k=1 if total assets are between j and k $ billion for j=10 50 or 100 and for k=50 100 or 500 and are denoted B500=1 if total assets exceed $500 billion p-values are reported in parentheses
49
Table 4 Audit fees for banks versus control firms
Panel A OLS estimation of audit fees CONTROL SIC61 High RECTA BANK ndash0705 (0000) ndash0954 (0000) LogASSETS 0601 (0000) 0552 (0000) ROA ndash0754 (0003) ndash0768 (0000) LOSS 0178 (0000) 0196 (0000) SPECIAL_ITEMS 0488 (0003) 0072 (0652) DISCONTINUED 0286 (0000) 0228 (0000) LEVERAGE ndash1496 (0000) ndash0627 (0000) INVENTORY 0291 (0177) 0729 (0000) INTANGIBLES 2637 (0002) 2404 (0000) GOODWILL ndash2665 (0046) ndash0609 (0297) MampA 0081 (0000) 0092 (0000) NEG_EQUITY 0222 (0094) 0466 (0000) FIRM_AGE 0004 (0084) 0007 (0000) ACCEL_FILER ndash0004 (0902) 0029 (0307) INTERNAL_WEAKNESS 0254 (0000) 0260 (0000) MTB ndash0008 (0598) 0021 (0004) RETURN ndash0035 (0048) ndash0001 (0936) STD_RETURN 0802 (0000) 0780 (0000) GOING_CONCERN 0048 (0602) 0055 (0473) BUSY_MONTH 0106 (0014) 0038 (0286) BIG4 0322 (0000) 0327 (0000) ISPEC 0087 (0712) 0240 (0141) Year fixed effects Yes Yes Observations 8585 11024 Adjusted R2 90 24 88 54 Panel B Incorporating firm size into the analyses SIC61 High RECTA B10_50 ndash0215 (0268) 0013 (0935) B50_100 0283 (0074) 0283 (0010) B100_500 0215 (0488) 0219 (0284) B500 0482 (0004) 0519 (0000) BANK ndash0766 (0000) ndash0980 (0000) BANKB10_50 0213 (0283) 0033 (0842) BANKB50_100 ndash0138 (0466) ndash0045 (0772) BANKB100_500 0201 (0523) 0315 (0129) BANKB500 0701 (0000) 0852 (0000) Control variables Yes Yes Year fixed effects Yes Yes Observations 8585 11024 Adjusted R2 90 92 89 32
The table reports the OLS estimation of a model with dependent variable LogFEE = the natural logarithm of the sum of audit fees and audit-related fees The main test variable BANK = 1 if the firm is on Bank Compustat and 0 otherwise We estimate the model on the combined BANK sample and one of two control samples of firms that are similar to banks but unregulated (1) The SIC61 control sample comprises non-depository credit institutions with two-digit standard industry classification (SIC) code 61 on Annual North American Compustat (2) the High RECTA control sample comprises non-banks with the top 5 of receivable to assets ratio on Annual North American Compustat The control variables are defined as follows LogASSETS = the natural logarithm of total assets ROA = net income divided by total assets LOSS = 1 if the firm reports negative net income and 0 otherwise SPECIAL_ITEMS = special items divided by total assets DISCONTINUED = 1 if a firmrsquos discontinued operations exceeds $1 million and
50
0 otherwise LEVERAGE = total liabilities divided by total assets INVENTORY = inventory divided by total assets INTANGIBLES = intangible assets divided by total assets GOODWILL = goodwill divided by total assets MampA = 1 if the firmrsquos goodwill increases by more than $1 million and 0 otherwise NEG_EQUITY = 1 if common equity is negative and 0 otherwise FIRM_AGE = the number of years the firm is listed in Compustat ACCEL_FILER = 1 if the firm is an accelerated filer and 0 otherwise INTERNAL_WEAKNESS = 1 if the firm disclosed a material internal control deficiency and 0 otherwise MTB = market value of equity divided by book value of equity RETURN = fiscal year stock return STD_RETURN = standard deviation of monthly stock returns GOING_CONCERN = 1 if a firm receives a going concern modified opinion and 0 otherwise BUSY_MONTH = 1 if the fiscal year-end is December and 0 otherwise BIG4 = 1 if the firm is audited by one of the Big-Four auditors and 0 otherwise ISPEC = auditorrsquos relative market share of audit fees in the clientrsquos FamandashFrench 48 industry classification Panel A reports the base model estimation Panel B reports the estimation of an expanded model which includes firm size indicators and their interactions with BANK The firm size indicators are denoted Bj_k=1 if total assets are between j and k $ billion for j=10 50 or 100 and for k=50 100 or 500 and are denoted B500=1 if total assets exceed $500 billion Standard errors are clustered at the firm level (two-tailed p-values are in parentheses)
51
Table 5 Audit report lag for banks versus control firms
Panel A OLS estimation of audit report lag CONTROL SIC61 High RECTA BANK ndash0101 (0015) ndash0101 (0000) LogASSETS ndash0014 (0057) ndash0021 (0000) ROA ndash0275 (0022) 0058 (0243) LOSS 0113 (0000) 0144 (0000) DISCONTINUED 0029 (0416) 0035 (0148) EXTRA_ITEMS 0098 (0058) 0137 (0001) ABS_ACCRUALS ndash0021 (0356) 0064 (0061) LEVERAGE 0093 (0397) 0084 (0093) INVENTORY 0408 (0001) 0255 (0005) FOREIGN 0199 (0002) 0067 (0045) FIRM_AGE ndash0007 (0000) ndash0005 (0000) INTERNAL_WEAKNESS 0186 (0000) 0151 (0000) AUDITOR_TURNOVER 0045 (0004) 0050 (0000) GOING_CONCERN 0240 (0001) 0172 (0000) BUSY_MONTH ndash0021 (0411) ndash0021 (0286) BIG4 0111 (0000) 0083 (0000) Year fixed effects Yes Yes Observations 8289 10660 Adjusted R2 51 28 45 53 Panel B Incorporating firm size into the analyses SIC61 High RECTA B10_50 ndash0252 (0000) ndash0124 (0000) B50_100 ndash0190 (0074) ndash0090 (0126) B100_500 ndash0184 (0017) 0091 (0037) B500 0079 (0608) 0161 (0004) BANK ndash0174 (0000) ndash0141 (0000) BANKB10_50 0246 (0001) 0180 (0000) BANKB50_100 0238 (0061) 0229 (0001) BANKB100_500 0290 (0002) 0136 (0008) BANKB500 0101 (0546) 0202 (0001) Control variables Yes Yes Year fixed effects Yes Yes Observations 8289 10660 Adjusted R2 51 67 46 51
The table reports the OLS estimation of a model with dependent variable LogARL = the natural logarithm of the number of days between the fiscal year-end date and auditor signature date The main test variable BANK = 1 if the firm is on Bank Compustat and 0 otherwise We estimate the model on the combined BANK sample and one of two control samples of firms that are similar to banks but unregulated (1) The SIC61 control sample comprises non-depository credit institutions with two-digit standard industry classification (SIC) code 61 on Annual North American Compustat (2) the High RECTA control sample comprises non-banks with the top 5 of receivable to assets ratio on Annual North American Compustat The control variables are defined as follows LogASSETS = the natural logarithm of total assets ROA = net income divided by total assets LOSS = 1 if the firm reports negative net income and 0 otherwise DISCONTINUED = 1 if a firmrsquos discontinued operations exceeds $1 million and 0 otherwise EXTRA_ITEMS = 1 if a firmrsquos (absolute) extraordinary items exceeds $1 million and 0 otherwise ABS_ACCRUALS = absolute value of accruals divided by total assets LEVERAGE = total liabilities divided by total assets INVENTORY = inventory divided by total assets FOREIGN = 1 if a firm reports non-zero foreign exchange income and 0 otherwise FIRM_AGE = the number of years a firm is listed in Compustat INTERNAL_WEAKNESS = 1 if the firm disclosed a material internal control deficiency and 0 otherwise AUDITOR_TURNOVER = 1 if the firmrsquos auditor changed during the year and 0 otherwise GOING_CONCERN = 1 if a firm receives a going concern modified opinion and 0 otherwise
52
BUSY_MONTH = 1 if the fiscal year-end is December and 0 otherwise BIG4 = 1 if the firm is audited by one of the Big-Four auditors and 0 otherwise Panel A reports the base model estimation Panel B reports the estimation of an expanded model which includes firm size indicators and their interactions with BANK The firm size indicators are denoted Bj_k=1 if total assets are between j and k $ billion for j=10 50 or 100 and for k=50 100 or 500 and are denoted B500=1 if total assets exceed $500 billion Standard errors are clustered at the firm level (two-tailed p-values are in parentheses)
53
Table 6 Identification tests for audit fee model using proxies for times-series variation
in the intensity of banking regulation
Panel A Descriptive statistics N Mean Std Q1 Median Q3 BUDGET (in millions $) 15 2757 908 2008 2506 3584 RESTRICTIONS (number of words) 15 29936 9313 24771 25536 30053 Panel B OLS estimation of audit fees
intensity LogBUDGET model LogRESTRICTIONS model LogBUDGET ndash1640 (0000) LogRESTRICTIONS ndash0677 (0000) LogASSETS 0454 (0000) 0467 (0000) ROA ndash1735 (0008) ndash1227 (0083) LOSS 0046 (0008) 0048 (0008) SPECIAL_ITEMS 2113 (0020) 1043 (0281) DISCONTINUED 0057 (0024) 0078 (0003) LEVERAGE ndash0896 (0000) ndash0732 (0000) INVENTORY 0274 (0086) 0228 (0170) INTANGIBLES 1962 (0090) 1632 (0207) GOODWILL ndash0059 (0960) 1379 (0286) MampA 0036 (0000) 0055 (0000) NEG_EQUITY 0099 (0300) 0113 (0244) FIRM_AGE 0177 (0000) 0101 (0000) ACCEL_FILER ndash6728 (0000) ndash3901 (0000) INTERNAL_WEAKNESS 0230 (0000) 0220 (0000) MTB 0005 (0352) 0037 (0002) RETURN ndash0052 (0000) ndash0059 (0000) STD_RETURN 0131 (0040) ndash0209 (0008) GOING_CONCERN 0039 (0441) 0057 (0294) BUSY_MONTH 0043 (0438) 0063 (0273) BIG4 0109 (0002) 0111 (0002) ISPEC 0516 (0000) 0554 (0000) Year fixed effects No No Firm fixed effects Yes Yes Observations 7914 7914 Adjusted R2 9590 9569
Panel A reports descriptive statistics for two measures of bank regulation intensity BUDGET and RESTRICTIONS BUDGET is the annual budget in $ millions of the ldquofinance and bankingrdquo subcategory (which includes the Comptroller of the Currency Federal Deposit Insurance Corporation and Securities and Exchange Commission) from Regulatory Reports available at httpswcwustleduregulatory_reports RESTRICTIONS is based on RegData an industry- and year-specific regulation index constructed by Al-Ubaydli and McLaughlin (2017) from textual analysis of the number of constraints (the strings ldquoshallrdquo ldquomustrdquo ldquomay notrdquo ldquoprohibitedrdquo and ldquorequiredrdquo) in the Code of Federal Regulations (CFR) Title 12 for the banking industry each year Panel B reports the OLS estimation for the BANK sample only of an expansion of the audit fee model with dependent variable LogFEE = the natural logarithm of the sum of audit fees and audit-related fees reported in Table 4 The expanded model includes the natural logarithm of BUDGET or RESTRICTIONS The control variables are defined as follows LogASSETS = the natural logarithm of total assets ROA = net income divided by total assets LOSS = 1 if the firm reports negative net income and 0 otherwise SPECIAL_ITEMS = special items divided by total assets DISCONTINUED = 1 if a firmrsquos discontinued operations exceeds $1 million and 0 otherwise LEVERAGE = total liabilities divided by total assets INVENTORY = inventory divided by total assets INTANGIBLES = intangible assets divided by total assets GOODWILL = goodwill divided by total assets MampA = 1 if the firmrsquos goodwill increases by more than $1 million and 0 otherwise NEG_EQUITY = 1 if common equity is negative and 0 otherwise FIRM_AGE = the number of years a firm is listed in Compustat ACCEL_FILER = 1 if the firm is an accelerated filer and 0 otherwise INTERNAL_WEAKNESS = 1 if the firm disclosed a material internal control
54
deficiency and 0 otherwise MTB = market value of equity divided by book value of equity RETURN = fiscal year stock return STD_RETURN = standard deviation of monthly stock returns GOING_CONCERN = 1 if a firm receives a going concern modified opinion and 0 otherwise BUSY_MONTH = 1 if the fiscal year-end is December and 0 otherwise BIG4 = 1 if the firm is audited by one of the Big-Four auditors and 0 otherwise ISPEC = auditorrsquos relative market share of audit fees in the clientrsquos FamandashFrench 48 industry classification Standard errors are Whites corrected standard errors (two-tailed p-values are in parentheses)
55
Table 7 Identification tests for audit fee model using proxy for cross sectional variation
in the intensity of banking regulation
STATE BANKS ALL BANKS STATE_REG 0664 (0016) ndash0670 (0196) STATE_BANK ndash0088 (0158) STATE_REG x STATE_BANK 1346 (0023) LogASSETS 0537 (0000) 0567 (0000) ROA ndash3904 (0010) ndash4337 (0003) LOSS 0093 (0009) 0116 (0001) SPECIAL_ITEMS 3148 (0057) 3943 (0012) DISCONTINUED 0296 (0001) 0273 (0000) LEVERAGE ndash1964 (0000) ndash1976 (0000) INVENTORY 0780 (0000) 0986 (0000) INTANGIBLES 7261 (0000) 6960 (0000) GOODWILL ndash5674 (0000) ndash5593 (0000) MampA 0091 (0000) 0066 (0000) NEG_EQUITY 0164 (0184) 0027 (0879) FIRM_AGE 0007 (0002) 0008 (0000) ACCEL_FILER 0076 (0014) 0023 (0440) INTERNAL_WEAKNESS 0250 (0000) 0248 (0000) MTB 0005 (0708) ndash0004 (0764) RETURN ndash0047 (0013) ndash0021 (0243) STD_RETURN 0669 (0001) 0637 (0000) GOING_CONCERN ndash0081 (0318) 0017 (0855) BUSY_MONTH 0068 (0055) 0068 (0062) BIG4 0360 (0000) 0331 (0000) ISPEC 0035 (0889) 0003 (0989) Intercept 9320 (0000) 9274 (0000) Year fixed effects Yes Yes Observations 5679 7340 Adjusted R2 8741 8859
The table reports the OLS estimation for the BANK sample only of two expansions of the audit fee model with dependent variable LogFEE = the natural logarithm of the sum of audit fees and audit-related fees in $ millions reported in Table 4 The both expanded models include Agarwal Lucca Seru and Trebbirsquos (2014) measure of regulatory leniency (inverse intensity) across state-chartered banks (STATE_REG) and The measure is based on the ldquoalternating examination programrdquo in which state-chartered banks are examined by (more stringent) federal supervisors (the FDIC or Federal Reserve) and state supervisors on an alternating basis Using a proprietary database Agarwal et al (2014) estimate the differential examination stringency of federal supervisors versus 44 state bank supervisors The expanded reported in right column as includes an indicator for whether bank is a state-chartered bank (STATE_BANK) based on information obtained from the FDIC website (httpswww5fdicgovidaspadvSearchLandingasp) as well as the interaction of STATE_REG with STATE_BANK The control variables are defined as follows LogASSETS = the natural logarithm of total assets ROA = net income divided by total assets LOSS = 1 if the firm reports negative net income and 0 otherwise SPECIAL_ITEMS = special items divided by total assets DISCONTINUED = 1 if a firmrsquos discontinued operations exceeds $1 million and 0 otherwise LEVERAGE = the total liabilities divided by total assets INVENTORY = inventory divided by total assets INTANGIBLES = intangible assets divided by total assets GOODWILL = goodwill divided by total assets MampA = 1 if the firmrsquos goodwill increases by more than $1 million and 0 otherwise NEG_EQUITY = 1 if common equity is negative and 0 otherwise FIRM_AGE = the number of years a firm is listed in Compustat ACCEL_FILER = 1 if the firm is an accelerated filer and 0 otherwise INTERNAL_WEAKNESS = 1 if the firm disclosed a material internal control deficiency and 0 otherwise MTB = market value of equity divided by book value of equity RETURN = fiscal year stock return STD_RETURN = standard deviation of monthly stock returns GOING_CONCERN = 1 if a firm receives a going concern modified opinion and 0 otherwise BUSY_MONTH = 1 if the fiscal year-end is December and 0 otherwise
56
BIG4 = 1 if the firm is audited by one of the Big-Four auditors and 0 otherwise ISPEC = auditorrsquos relative market share of audit fees in the clientrsquos FamandashFrench 48 industry classification Panel A reports the base model estimation Panel B reports the estimation of an expanded model which includes the interactions of firm size with BANK The bank size indicators are denoted Bj_k=1 if total assets are between j and k $ billion for j=10 50 or 100 and for k=50 100 or 500 and are denoted B500=1 if total assets exceed $500 billion Standard errors are clustered at the firm level (two-tailed p-values are in parentheses)
57
Table 8 Likelihood of small earnings increases for banks versus control firms
CONTROL SIC61 High RECTA BANK 1483 (0000) 0897 (0000) LogASSETS ndash0052 (0026) ndash0030 (0168) LEVERAGE ndash1351 (0006) ndash0022 (0952) MTB 0040 (0192) 0001 (0965) ACCEL_FILER 0222 (0003) 0176 (0019) BIG4 ndash0062 (0401) ndash0062 (0399) Intercept ndash1467 (0000) ndash2164 (0000) Year fixed effects Yes Yes Observations 8585 8928 McFaddens R2 312 328
The table reports the logistic estimation of the likelihood that a firm reports a small earnings increase SMALL_POS = 1 if 000 lt ∆ROE le 001 where ROE = net income divided by the book value of common equity and 0 otherwise The main test variable BANK = 1 if the firm is a bank and 0 otherwise We estimate the model on the combined BANK sample and one of two control samples of firms that are similar to banks but unregulated (1) The SIC61 control sample comprises non-depository credit institutions with two-digit standard industry classification (SIC) code 61 on Annual North American Compustat (2) the High RECTA control sample comprises non-banks with the top 5 of receivable to assets ratio on Annual North American Compustat The control variables are defined as follows LogASSETS = the natural logarithm of total assets LEVERAGE = total liabilities divided by total assets MTB = market value of equity divided by book value of equity ACCEL_FILER = 1 if the firm is an accelerated filer and 0 otherwise BIG4 = 1 if the firm is audited by one of the Big-Four auditors and 0 otherwise p-values are reported in parentheses
58
Table 9 Length of string of consecutive earnings increases for banks versus control firms
CONTROL SIC61 High RECTA BANK 0383 (0008) 0663 (0000) LogASSETS ndash0128 (0000) ndash0171 (0000) LEVERAGE ndash0469 (0377) 0516 (0000) MTB ndash0275 (0000) ndash0062 (0000) GOODWILL 1023 (04260 ndash0726 (0070) ACCEL_FILER ndash0446 (0000) ndash0246 (0000) INTERNAL_WEAKNESS ndash0170 (0467) 0041 (0763) BIG4 0101 (0215) 0111 (0058) Intercept Year fixed effects Yes Yes Number of observations 1069 1778 McFaddens R2 417 390
The table reports proportional hazard model estimation of a model with dependent variable STRING = the duration of the longest string of consecutive annual earnings increases The main test variable BANK = 1 if the firm is a bank and 0 otherwise We estimate the model on the combined BANK sample and one of two control samples of firms that are similar to banks but unregulated (1) The SIC61 control sample comprises non-depository credit institutions with two-digit standard industry classification (SIC) code 61 on Annual North American Compustat (2) the High RECTA control sample comprises non-banks with the top 5 of receivable to assets ratio on Annual North American Compustat The control variables are defined as follows LogASSETS = the natural logarithm of total assets LEVERAGE = total liabilities divided by total assets MTB = market value of equity divided by book value of equity ACCEL_FILER = 1 if the firm is an accelerated filer and 0 otherwise BIG4 = 1 if the firm is audited by one of the Big-Four auditors and 0 otherwise p-values are reported in parentheses
59
Figure 1
Plot of time-series measures of the intensity of banking regulation from 2000-2014
LogRestrictions is based on RegData an industry- and year-specific regulation index constructed by Al-Ubaydli and
McLaughlin (2017) from textual analysis of the number of constraints (the strings ldquoshallrdquo ldquomustrdquo ldquomay notrdquo
ldquoprohibitedrdquo and ldquorequiredrdquo) in the Code of Federal Regulations (CFR) This measure is the natural logarithm of the
number of constraints in CFR Title 12 for the banking industry each year LogBudget is the natural logarithm of the
annual budget (in $ millions) of the ldquofinance and bankingrdquo subcategory (which includes the Comptroller of the
Currency Federal Deposit Insurance Corporation and Securities and Exchange Commission) from Regulatory
Reports available at httpswcwustleduregulatory_reports
94
96
98
10
102
104
106
108
11
7
72
74
76
78
8
82
84
86
2000 2001 2002 2003 2004 2005 2006 2007 2008 2009 2010 2011 2012 2013 2014
logBudget logRestrictions

11
Individual banks may be owned by bank holding companies which may apply and qualify
to be financial holding companies Bank holding companies typically engage in lending deposit
acceptance and any other allowed activities through their individual bank subsidiaries Financial
holding companies may engage in activities not allowed in individual banks such as insurance
underwriting and merchant banking through non-bank subsidiaries (Ryan 2007 Avraham et al
2012) The Federal Reserve has supervisory authority over all bank holding companies regardless
of how their subsidiary banks are chartered and supervised
212 Bank Supervision
Bank supervision involves the periodic on-site examination and ongoing off-site
monitoring of banksrsquo financial condition and risks the adequacy of banksrsquo accounting internal
control and risk management systems and banksrsquo compliance with applicable laws and
regulations The main goal of supervision is to ensure the safety and soundness of individual banks
and especially of the banking system
Bank supervision shares many similarities with (bank) auditing For example much like
auditorsrsquo risk-based approach to auditing the Federal Reserve indicates that it employs a risk-
focused approach to supervision (Board of Governors of the Federal Reserve System 2017) Under
this approach the Federal Reserve first identifies the primary risks faced by a bank The Federal
Reserve then assesses the bankrsquos ability to measure monitor and control those risks given its (1)
board and senior management oversight (2) policies procedures and risk limits (3) risk
monitoring and management information systems and (4) internal controls
director and the director of the Consumer Financial Protection Bureau The FFIEC has developed uniform
examination principles and standards as well as uniform regulatory reporting forms and systems for
federally supervised banks
12
On-site examinations of individual banks and bank holding companies generally occur
every 12 to 18 months depending on the organizationrsquos size supervisory rating and extent of non-
banking assets as well as supervisory resource constraints For state banks the primary federal
supervisor coordinates its on-site examinations with the state supervisor with the two supervisors
generally conducting examinations in rotation under the ldquoalternating examination programrdquo
(Agarwal et al 2014) The results of an examination which include a confidential supervisory
rating of the bankrsquos overall condition are reported to the bankrsquos board of directors and
management The supervisory rating system is referred to as CAMELS an acroynm for its six
components (1) capital adequacy (2) asset quality (3) management and administration (4)
earnings (5) liquidity and (6) sensitivity to market risk The overall and component CAMELS
ratings efficiently communicate supervisorsrsquo overall assessments of banks as well as any specific
issues that raise concern or require attention
Between examinations bank supervisors use many sources of financial and other
information most importantly banksrsquo quarterly regulatory reports to monitor banks The primary
report for individual banks is the Consolidated Reports of Condition and Income (ldquoCall Reportsrdquo)
These reports provide the raw data for the Uniform Bank Performance Report which presents
ratios that can be compared across banks and time to detect unusual levels of or significant changes
in a banks financial condition The primary report for bank holding companies is the Consolidated
Financial Statements for Bank Holding Companies (FR Y-9C) The Federal Reserve indicates it
uses an automated system to estimate an organizationrsquos CAMELS rating based on its prior
examination results and subsequent quarterly Call Report or FR Y-9C filings (Board of Governors
of the Federal Reserve System 2017)
13
If a supervisor determines that a bank or bank holding company has problems that affect
its safety and soundness the supervisor may take a variety of formal or informal actions to ensure
that the organizationrsquos management and directors undertake measures to address the problems
(Keeley 2017) For example the supervisor may enter into a written agreement with issue a cease-
and-desist order or prompt-corrective-action directive to or levy a fine against the organization
22 Bank Complexity and Opacity
Although a debate exists as to whether stability is enhanced by bank transparency or bank
opacity the traditional and still dominant view is that transparency enhances stability (Morgan
2002 Nier and Baumann 2006 Acharya and Ryan 2016)9 Prior theoretical and empirical research
provides numerous bases for this view For example banksrsquo effectiveness as monitors provides
them with comparative advantages in lending to information-sensitive borrowers (Diamond 1984)
Banksrsquo high leverage multiplies their risk and exacerbates various agency problems such as asset
substitution (Jensen and Meckling 1976) and underinvestment when the benefits of investment
primarily accrue to debtholders (Myers 1977) Such agency problems are exacerbated further by
information asymmetries between banks and their debt and equity claimants as well as among
these claimants (Beatty and Liao 2014 Acharya and Ryan 2016)
Despite the perceived benefits of bank transparency banks are often viewed as opaque due
to their complex and interrelated on- and off-balance sheet exposures The individual and
collective values and risk of these exposures are inherently difficult for banks to convey to
outsiders and for outsiders to evaluate This difficulty likely enhances banksrsquo ability to manage or
obscure their accounting numbers
9 See Dang et al (2014) Holmstroumlm (2015) and Acharya and Ryan (2016) for discussion of the opposing
view that bank opacity enhances stability
14
Prior empirical research provides evidence that banks are more opaque than non-banks and
about the determinants of banksrsquo opacity Morgan (2002) shows that banks receive more split
credit ratings (ie different bond ratings from different rating agencies) than do non-banks a result
he attributes to banksrsquo greater opacity He further shows that banksrsquo opacity varies with their asset
composition increasing with their proportions of loans and trading assets Flannery et al (2013)
provide evidence that bank opacity increases during periods of financial system stress when the
valuations of financial assets become harder to determine and more strongly correlated
We expect that the difference in opacity between banks and non-banks has widened over
time as banks have shifted their activities from relatively understandable deposit-acceptance and
lending activities ie traditional financial intermediation to less easily understandable
nontraditional activities such as derivatives trading securitization and the provision of various
forms of contingent financing Banksrsquo economic exposures resulting from these activities often
exhibit concentrated or correlated risks or state-contingent liquidity requirements and these
exposures often are partly or wholly off-balance sheet (Barth et al 2009 Acharya 2014 Acharya
and Ryan 2016)10
Banksrsquo increasing economic complexity has been accompanied by increasing length and
complexity of their financial reports Accounting standard setters have written many complex and
lengthy standards for financial instruments and transactions to try to adequately portray their
10 In large part reflecting the income generated by these nontraditional activities the average bankrsquos
noninterest revenues as a percentage of net operating revenues increased from below 20 in the 1970s to
around 50 by 2009 (Barth et al 2009) A portion of this increase is attributable to generally declining
interest rates from 1981 to 2009 however
15
economics11 Despite banksrsquo provision of far more extensive financial report information in
compliance with the requirements of these standards (Guay et al 2016) we expect the individual
and collective values and risk of banksrsquo exposures to have become more difficult for banks to
convey to outsiders and for outsiders to evaluate
23 Hypotheses and Empirical Proxies
231 Engagement and Audit Risks
Auditorsrsquo decisions whether to bid for potential engagements the prices at which to bid
and the effort needed to provide the desired level of assurance depend on the risks the engagements
pose for them (Bedard and Johnstone 2004) Overall engagement risk has three interrelated
components (1) clientsrsquo business risk ie the possibility that clientsrsquo financial condition
deteriorates in the limit leading to firm failure (2) auditorsrsquo business risk ie the possibility of
litigation or reputational costs to auditors from their associations with clients and (3) audit risk
ie the possibility that auditors fail to detect material misstatements in financial statements due to
error or fraud In our investigation of whether bank regulation and supervision displace auditing
we focus on audit risk because it is the component of engagement risk that is most directly reduced
by audit effort
In the standard (textbook) model audit risk has three by construction distinct components
(1) inherent risk ie the likelihood that material misstatements of clientsrsquo financial statements
exist prior to the operation of their internal control systems (2) control risk ie the likelihood that
clientsrsquo internal control systems fail to prevent material misstatements and (3) detection risk ie
11 Notable examples of these standards include FAS 133 (1998) and FAS 161 (2009) for derivatives
(Accounting Standard Codification Section 815) and FAS 140 (2000) FIN 46(R) (2003) FAS 166 (2009)
and FAS 167 (2009) for securitizations (Accounting Standards Codification Sections 860 and 810)
16
the likelihood the auditor fails to detect material misstatements not prevented by clientsrsquo internal
control systems We expect bank regulation and supervision to reduce the inherent risk and control
risk components of audit risk and thus to reduce the incentive for auditors to expend effort on
audits of banks
232 Frequency of Internal Control and Accounting Problems
Bank supervisors monitor banksrsquo internal control and accounting systems through periodic
on-site examinations and ongoing off-site monitoring We expect this scrutiny to reduce the
inherent risk and control risk components of audit risk for audits of banks relative to audits of
control firms We formally state this hypothesis in the alternative as
Hypothesis 1 Banks exhibit fewer internal control and accounting problems than do
control firms
233 Audit Effort
It is theoretically unclear whether auditors should expend more or less effort on audits of
banks than on audits of control firms A primary reason why auditors would work more on audits
of banks is that banksrsquo greater complexity and opacity lead to their investors and contracting parties
more strongly benefiting from higher quality audits that increase the informativeness and
reliability of banksrsquo financial statements Due to this audit-demand effect higher quality audits
more strongly reduce the need for firmsrsquo investors and contracting parties to protect themselves
against uninformative or unreliable financial statement numbers by reducing the prices they are
willing to pay for firmsrsquo securities and by requiring contractual protections such as collateral
respectively To satisfy the demand for higher audit quality for audits of banks than for audits of
control firms auditors of banks must expend more effort by increasing the number of billed hours
17
andor by devoting more experienced andor specialized staff to engagements increasing the
average billed hourly fee
A primary reason why auditors would work less on audits of banks than on audits of control
firms is the overlap of the activities of bank regulators and supervisors particularly supervisorsrsquo
periodic examination and ongoing monitoring of banks with the activities of bank auditors Due
to this substitution effect auditors of banks need to perform less extensive audit planning and
substantive testing than do auditors of control firms to provide any given level of assurance We
expect the substitution effect to be more likely to dominate the audit-demand effect when bank
regulation and supervision are more intense for example when regulators and supervisors use
more sophisticated or sensitive approaches such as the Federal Reserversquos risk-focused approach
(Board of Governors of the Federal Reserve System 2017)
Although the two effects yield opposing predictions we expect that the substitution effect
generally dominates the audit demand effect because of substantial extent of the overlap of the
activities of bank regulators and particularly supervisors with those of auditors Relatedly many
aspects of bank regulation and supervision reduce the inherent and control risk components of
audit risk For example when bank supervisors determine that banks exhibit inadequate solvency
or other problems they convey the banksrsquo deficient CAMELS ratings to the banksrsquo management
and boards of directors who are responsible for resolving these problems This expectation yields
our second hypothesis stated in the alternative
Hypothesis 2 Auditors exert lower effort on audits of banks than on audits of control
firms
3 Empirical Models and Variables
31 Frequencies of Internal Control and Accounting Problems
18
We employ two dependent variables in our tests of Hypothesis 1 First we proxy for
problems in banksrsquo internal control using an indicator for material weaknesses in internal control
(Ashbaugh et al 2007) Naturally we can only observe such weaknesses if firms identify and
disclose them as FDICIA requires for banks and Sections 302 and 404 of SOX require for all
firms INTERNAL_WEAKNESS denotes firm-years with disclosed material internal control
weaknesses Second we proxy for problems in banksrsquo accounting using an indicator for financial
statement restatements which arise from GAAP violations and thus suggest audit failures
(Palmrose and Scholz 2004 Kinney et al 2004 Hennes et al 2014)12 ACC_RESTATEMENT
denotes firm-years with restatements of financial statements13 We denote
INTERNAL_WEAKNESS and ACC_RESTATEMENT collectively by Y
The main test variable in our tests of Hypothesis 1 is an indicator for banks denoted BANK
As discussed below we control for numerous client and auditor characteristics that prior research
finds are associated with internal control and accounting problems In addition when the
dependent variable Y is INTERNAL_WEAKNESS (ACC_RESTATEMENT) we control for
ACC_RESTATEMENT (INTERNAL_WEAKNESS) We denote the Y variable that is controlled for
in a given model by Y_CONTROL
12 In untabulated analysis we also proxy for both internal control and accounting problems using auditor
resignations (Krishnan and Krishnan 1997 Shu 2000 Hennes et al 2014) If banks exhibit fewer internal
control and accounting problems than do control firms bank auditors have fewer reasons to resign from
audit engagements However compared to the proxies for these problems in the tabulated analyses auditor
resignations are more likely to capture the components of engagement risk other than audit risk For
example prior research shows that auditors are more likely to resign when clients exhibit greater financial
distress (Schwartz and Soo 1995) more corporate governance problems (Lee et al 2004) and greater
litigation risk (Krishnan and Krishnan 1997 Simunic and Stein 1996)
13 All indicator variables in the paper take a value of one when a firm or firm-year exhibits the specified
condition and zero otherwise
19
Based on prior empirical research examining internal control weaknesses (Altamuro and
Beatty 2010)14 and financial statement restatements (Palmrose and Scholz 2004 Kinney et al
2004 Hennes et al 2008) we use the following logistic model to explain the probability that Y
equals one denoted Prob(Y = 1) in terms of BANK and control variables (collectively denoted
X)15
Prob(Y = 1) = eXβ (1 + eXβ) where
Xβ = β0 + β1BANK + β2LogASSETS + β3ROA + β4LOSS + β5LEVERAGE
+ β6GOODWILL + β7MampA + β8FOREIGN + β9MTB (1)
+ β10GOING_CONCERN + β11Y_CONTROL + β12BUSY_MONTH
+ β13BIG4 + β14ISPEC + year fixed effects
Because Prob(Y = 1) is not directly observable we estimate equation (1) with Y as the dependent
variable Hypothesis 1 predicts that the coefficient β1 on BANK is negative
Equation (1) controls for numerous client characteristics We selected these characteristics
based on prior research findings that firms that have less resources to invest in internal control
systems have undergone major organizational changes and are more complex or otherwise stress
auditorsrsquo capabilities exhibit more frequent internal control and accounting problems (eg Ge and
McVay 2005 Ashbaugh-Skaife et al 2007 Doyle et al 2007ab)
We control for the resources that clients have available to establish effective internal
control systems using the natural logarithm of total assets (LogASSETS) net income divided by
total assets (ROA) an indicator variable for negative net income (LOSS) and the ratio of total
14Altamuro and Beatty (2010) show how FDICIArsquos (1991) internal control requirements affected insured
depository institutions with assets of $500 million or above They do not compare the internal control
quality of banks and non-banks
15 Throughout the paper we omit firm and year subscripts for brevity
20
liabilities to total assets (LEVERAGE) We control for clientsrsquo organizational changes associated
with business acquisitions using the ratio of goodwill to total assets (GOODWILL) and an indicator
variable that equals one when goodwill increases by more than $1 million (MampA) We control for
other determinants of audit complexity using the proportion of foreign sales for control firms and
the proportion of foreign commercial loans for banks (FOREIGN) the ratio of market value of
equity to book value of equity (MTB) an indicator variable for the auditor rendering a going-
concern opinion (GOING_CONCERN) and Y_CONTROL
We control for three auditor characteristics an indicator for December fiscal year end
(BUSY_MONTH) an indicator variable for Big-Four auditor (BIG4) and the auditorrsquos market
share in the industry (ISPEC) Lastly we include fixed year effects to capture unobserved time-
related factors for both clients and auditors
Because the effects of client size may be nonlinear in tabulated specification analyses we
include indicator variables for client total assets in the following categories up to $10 billion (this
indicator is omitted as one must be) from above $10 to $50 billion (B10_50) from above $50 to
$100 billion (B50_100) from above $100 to $500 billion (B100_500) and above $500 billion
(B500) Moreover because the effects of size may vary for banks versus control firms we also
include the interactions of these size indicators with BANK
32 Audit Effort
We test Hypothesis 2 using two dependent variables that prior research indicates proxy for
auditor effort audit fees (Simunic and Stein 1996) and audit report lag (Ashton et al 1987 Bamber
et al 1993 and Ghosh and Tang 2015) Audit fees equal the number of hours worked times the
average fee per hour worked LogFEE denotes the natural logarithm of the sum of audit and audit-
related fees Auditors working more hours is positively associated with audit report lags (Bronson
21
et al 2011) LogREPORT_LAG denotes the natural logarithm of one plus the number of days
between the fiscal year end and the audit report signature date
Based on prior models for audit fees (Simunic 1980 Ghosh and Tang 2015) we use the
following model to explain LogFEE
LogFEE = β0 + β1BANK + β2LogASSETS + β3ROA + β4LOSS + β5SPECIAL_ITEMS
+ β6DISCONTINUED + β7LEVERAGE + β8INVENTORY + β9INTANGIBLES
+ β10GOODWILL + β11MampA + β12NEG_EQUITY + β13FIRM_AGE (2)
+ β14ACCEL_FILER + β15INTERNAL_WEAKNESS + β16MTB + β17RETURN
+ β18STD_RETURN + β19GOING_CONCERN + β20BUSY_MONTH
+ β21BIG4 + β22ISPEC + year fixed effects
Based on prior models for audit report lag (Ashton et al 1987 Bamber et al 1993 Bronson et al
2011 Ghosh and Tang 2015) we use the following model to explain LogREPORT_LAG
LogREPORT_LAG = β0 + β1BANK + β2LogASSETS + β3ROA + β4LOSS
+ β5DISCONTINUED + β6EXTRA_ITEMS + β7ABS_ACCRUALS
+ β8LEVERAGE + β9INVENTORY + β10FOREIGN + β11FIRM_AGE (3)
+ β12 INTERNAL_WEAKNESS + β13AUDITOR_TURNOVER
+ β14GOING_CONCERN + β15BUSY_MONTH + β16BIG4
+ year fixed effects
As in equation (1) the main test variable in equations (2) and (3) is BANK Hypothesis 2 predicts
that the coefficient β1 on BANK is negative in both equations
Equations (2) and (3) control for numerous client and auditor characteristics that prior
research finds are associated with audit fees or audit report lag respectively Many of the control
variables included in Equations (2) and (3) also appear in Equation (1) and are defined above
Equation (2) andor equation (3) include the following additional client characteristics16 Special
16 The sets of control variables in equations (2) and (3) are not identical consistent with the models
estimated in prior research
22
items divided by total assets (SPECIAL_ITEMS) an indicator for absolute value of discontinued
operations above $1 million (DISCONTINUED) and an indicator for absolute value of
extraordinary items above $1 million (EXTRA_ITEMS) capture transitory earnings items The
absolute value of accruals divided by total assets (ABS_ACCRUALS) captures other dimensions of
earnings quality The ratio of inventory to total assets (INVENTORY) and the ratio of intangible
assets to total assets (INTANGIBLES) capture balance sheet composition An indicator for negative
common equity (NEG_EQUITY) and the number of years the firm is listed on Compustat
(FIRM_AGE) capture early-stage or otherwise risky firms An indicator for accelerated filer
(ACCEL_FILER) and an indicator for auditor turnover during the year (AUDITOR_TURNOVER)
capture other auditing stresses Fiscal year stock return (RETURN) and the standard deviation of
monthly stock returns (STD_RETURN) capture the aggregate level and the volatility respectively
of exogenous shocks occuring during the fiscal year
As for equation (1) in tabulated specification analyses we include indicator variables for
client total assets in the various size categories and we also include the interactions of these size
indicators with BANK
33 Earnings Management of Minor Concern to Bank Regulators and Supervisors
As discussed in the introduction we expect bank regulators and supervisors to be relatively
unconcerned about types of earnings management that accumulate to relatively small amounts of
retained earnings Such earnings management has minor effects on banksrsquo solvency ratios and so
should not appreciably affect supervisorsrsquo evaluations of banksrsquo safety and soundness We expect
that if bank regulation and supervision leads to lower audit effort in audits of banks than in audits
of control firms as predicted in Hypothesis 2 banks engage more in these types of earnings
23
management than do control firms Motivated by Burgstahler and Dichev (1997) Beatty et al
(2002) and Graham et al (2005) we examine two proxies for such earnings management
First we examine the frequency of small (from 0 to 001) increases in return on equity
(SMALL_POS)17 Based on Beatty et al (2002) we use the following logistic model to explain
SMALL_POS
Prob(SMALL_POS= 1) = eXβ (1 + eXβ) where
Xβ = β0 + β1BANK + β2LogASSETS + β3LEVERAGE + β4MTB (4)
+ β5ACCEL_FILER + β6BIG4 + year fixed effects
We expect the coefficient β1 on BANK to be positive
Second we examine the length of the longest string of consecutive earnings increases for
each firm (STRING) Based on Beatty et al (2002) we use the following Cox proportional hazard
model to explain STRING
h(STRING|X)= h0(STRING) eXβ where
Xβ= β0 + β1BANK + β2LogASSETS + β3LEVERAGE +β4MTB + β5ACCEL_FILER (5)
+ β6INTERNAL_WEAKNESS + β7BIG4 + year fixed effects
h(STRING|X) denotes the hazard function and h0(STRING) denotes the baseline hazard function
We expect the coefficient β1 on BANK to be positive
17 Specifically we compute return on equity (ROE) as net income divided by common equity SMALL_POS takes a
value of one if the change in ROE is greater than zero but smaller than or equal to 001 and zero otherwise
24
4 Data and Sample Selection
41 Data
We obtain audit fee audit report signature date auditor change internal control weakness
and restatement data from Audit Analytics We obtain financial statement data from Compustatrsquos
annual Bank and North American files We obtain geographic and foreign segment data from
Compustatrsquos Segment file If a given firm-year is available in Compustatrsquos Bank file we classify
the firm-year observation as a bank
Our sample covers the fifteen-year period from 2000 to 2014 The sample period begins in
2000 because audit fees are unavailable prior to that year Because SOX-mandated internal control
weakness data become available in 2004 our analysis of internal control weaknesses is limited to
the eleven-year period from 2004 to 2014 We restrict the sample to firm-year observations with
complete data on audit fees auditor identification and audit report signature date from Audit
Analytics as well as on total assets (item AT) total liabilities (item LT) total common equity (item
CEQ) net income (item NI) closing price (item PRCC) and common shares outstanding (item
CSHO) from Compustat These data requirements yield 7914 bank-year observations (965 unique
banks) 671 firm-year observations in SIC 61 (104 unique firms) and 3111 firm-year observations
in the top five percent of the ratio of accounts receivable to total assets (812 unique firms) from
2000ndash2014 The internal control weakness sample includes 5581 bank-year observations 483
firm-year observations for the SIC 61 control sample and 2254 firm-year observations for the top
five percent of the ratio of accounts receivable to total assets control sample from 2004ndash2014
42 Descriptive Statistics
Table 1 reports means for each of the dependent variables (above the line) and each of the
independent variables (below the line) in equations (1)-(5) for the bank sample SIC 61 control
25
sample and highest 5 ratio of accounts receivable to assets control sample Significant
differences of the means for the bank sample versus the SIC 61 control sample and for the bank
sample versus the highest 5 ratio of accounts receivable to assets control sample are indicated in
the columns for the control samples
The differences of the means for the dependent variables are uniformly significant and
consistent with our hypotheses that banks exhibit fewer internal control and accounting problems
than do control sample firms as well as our expectations that banks engage in more of certain types
of earnings management than do control sample firms Consistent with Hypothesis 1 banks are
less likely than both control samples to disclose material internal control weaknesses
(INTERNAL_WEAKNESS) and to restate their financial statements (ACC_RESTATEMENT)
Consistent with Hypothesis 2 on average audit fees (FEE) are lower and audit report lags
(REPORT_LAG) are shorter for banks than for both control samples Consistent with our
expectations for earnings management banks are more likely to report small positive earnings
changes (SMALL_POS) and on overage report longer strings of positive earnings (STRING)
Most of the differences of the means for the independent variables are also significant For
most of these variables the means for banks are closer to those of the a priori more analogous SIC
61 control sample than to those of the highest 5 ratio of accounts receivable to assets control
sample Accordingly we discuss only the former mean differences Compared to the SIC 61
control sample on average banks are smaller (ASSETS) are more profitable (ROA) and have
fewer losses (LOSS) have fewer transitory earnings items (SPECIAL_ITEMS DISCONTINUED
and EXTRA_ITEMS) and lower absolute accruals (ABS_ACCRUALS) have higher financial
leverage (LEVERAGE) have lower non-financial assets (INVENTORY INTANGIBLES and
GOODWILL) despite engaging in more mergers and acquisitions (MampA) are less likely to have
26
negative equity (NEG_EQUITY) or foreign operations (FOREIGN) have insignificantly different
age (AGE) have lower expected growth (MTB) experience lower exogenous shocks (RETURN
and STD_RETURN) and receive fewer going-concern opinions (GOING_CONCERN)
Compared to the SIC 61 control sample on average banks exhibit one characteristic that
stress auditorsrsquo capabilities more frequent December fiscal year-ends (BUSY_MONTH)
However on average banks are less likely to be accelerated filers (ACCEL_FILER) are less likely
to be audited by a Big 4 auditor (BIG4) are less likely to have auditors with high relative industry
market share (ISPEC) and experience less auditor turnover (AUDITOR_TURNOVER)
5 Empirical Results
51 Frequencies of Internal Control and Accounting Problems
Hypothesis 1 predicts that due to bank regulation and supervision banks exhibit fewer
internal control and accounting problems than do similar unregulated firms To test this hypothesis
Tables 2 and 3 report logistic estimations of equation (1) with the dependent variables
INTERNAL_WEAKNESS and ACC_RESTATEMENT respectively18 We report the estimation of
each model for the combined bank sample and SIC 61 control sample in the left column of the
table and for the combined bank sample and highest 5 ratio of accounts receivable to assets
control sample in the right column of the table
We estimate each model in two different ways Panel A of each table reports the estimation
of the base model To better control for size differences between the bank and control samples
Panel B of each table reports estimations of the equations replacing LogASSETS with the client
18 In untabulated analyses we also examine adverse restatements that reduce ownersrsquo equity and auditor
resignations We find results consistent with those reported in the paper
27
size category indicators (B10_50 B50_100 B100_500 and B500) both separately and interacted
with BANK The coefficient on BANK captures the total effect for the smallest banks (assets less
than $10 billion) The coefficient on the interaction of BANK with a given size category indicator
captures the effect for the banks in that size category incremental to the effect for the smallest
banks The sum of the coefficients on BANK and on the interaction of BANK with a given size
category indicator captures the total effect for the banks in that size category
The model fits and the coefficients on the control variables generally are as expected based
on prior research For simplicity we primarily discuss the statistical and economic significance of
the coefficient β1 on BANK estimated on the combination of the bank sample and the more
analogous SIC 61 control sample reported in the left column of Panel A of the tables We point
out any notable differences of the results for the other models All of these differences pertain to
the coefficients on BANK and the interactions of BANK with the size category indicators in Panel
B which typically indicate that the effects we document are limited to certain size categories In
particular no notable differences arise from the use of different control samples in the estimations
reported in the left and right columns of the tables In discussing economic significance we focus
on eβ1 the differential frequency of internal control and accounting problems for banks versus non-
banks
Examining the estimation of equation (1) with dependent variable
INTERNAL_WEAKNESS reported in the left column of Panel A of Table 2 we find that the
coefficient on BANK is negative (-0781) and significant at the 1 level This coefficient implies
that banks disclose material internal control weaknesses with only 46 of the frequency of SIC
control sample firms controlling for other factors that prior research finds are associated with
28
internal control weaknesses These results are consistent with Hypothesis 1 that bank regulation
and supervision reduce the frequency of banksrsquo internal control problems
In left column of Panel B of Table 2 the coefficient on BANK is negative as expected but
insignificant Notice however that the coefficients on the interactions of BANK with all of the
size category indicators are also negative with these coefficients being significant at the 1 and
10 levels for the interactions of BANK with B10_50 and B50_100 respectively The sum of the
coefficients on BANK and BANKtimesB10_50 is significantly negative at the 1 level and the sum of
the coefficients on BANK and BANKtimesB50_100 is significantly negative at the 10 level These
results imply that banks with assets from $10 billion to $100 billion disclose significantly fewer
internal control weaknesses than do similarly sized control firms consistent with Hypothesis 1
whereas banks in other size categories disclose internal control weaknesses with insignificantly
different frequency
Examining the estimation of equation (1) with dependent variable ACC_RESTATEMENT
reported in the left column of Panel A of Table 3 we find that the coefficient on BANK is negative
(-1075) and significant at the 1 level This coefficient implies that banks report financial
statement restatements with only 34 of the frequency of SIC 61 control sample firms controlling
for other factors that prior research finds are associated with restatements These results are
consistent with Hypothesis 1 that bank regulation and supervision reduce the frequency of banksrsquo
accounting problems
In the left column of Panel B of Table 3 the coefficient on BANK is negative as expected
but insignificant Again notice however that the coefficients on the interactions of BANK with all
of the size category indicators are also negative with the coefficient on the interaction of BANK
with B10_50 significant at the 5 level The sum of the coefficients on BANK and its interaction
29
with B10_50 is significantly negative at the 1 level and the sum of the coefficients on BANK and
its interaction with B100_500 is significantly negative at the 10 level These results imply that
banks with assets from $10 billion to $50 billion and from $100 billion to $500 billion report
significantly fewer accounting restatements than similarly sized control firms consistent with
Hypothesis 1 whereas banks in other size categories report accounting restatements with
insignificantly different frequency
Collectively the results reported in Tables 2 and 3 for disclosed material internal control
weaknesses and accounting restatements are consistent with bank regulation and supervision
rendering engagements for audits banks less risky than for audits of control sample firms for some
size categories and insignificantly differently risky for other size categories
52 Audit Effort
Hypothesis 2 predicts that bank regulation and supervision lead bank auditors to expend
less effort We proxy for (lower) audit effort using (lower) audit fees and (shorter) audit report
lags To test this hypothesis Table 4 reports OLS estimations of equation (2) that explain the
natural logarithm of audit fees (LogFEE) while Table 5 reports OLS estimations of equation (3)
that explain the natural logarithm of the number of days between the fiscal year end and the audit
report signature date (LogREPORT_LAG) The structures of Tables 4 and 5 are the same as those
of Tables 2 and 3 The left columns of the tables report the estimations for the combined bank
sample and SIC 61 control sample The right columns of the tables report the estimations for the
combined bank sample and highest 5 ratio of accounts receivable to assets control sample Panel
A of the tables report the estimation of the base model and Panel B of the tables report the
estimation of the models that include the size category indicators both separately and interacted
with BANK As for the analyses of internal control and accounting problems discussed in Section
30
51 the model fits and the coefficients on the control variables generally are as expected based on
prior literature so we discuss only the statistical and economic significance of the coefficients β1
on BANK in Panel A and of the coefficients on BANK and the interactions of BANK with the size
category indicators in Panel B
Examining the estimation of equation (2) with dependent variable LogFEE reported in the
left column of Panel A of Table 4 we find that the coefficient on BANK is negative (-0705) and
significant at the 1 level This coefficient implies that on average audit fees for banks are only
49 of that for SIC 61 control sample firms controlling for other factors that prior research finds
are associated with audit fees These results are consistent with Hypothesis 2rsquos prediction that bank
regulation and supervision lead to reduced audit effort
In both columns of Panel B of Table 4 the coefficient on BANK is significantly negative
as expected However the coefficient on the interactions of BANK with the largest size category
B500 is significantly positive and of similar absolute magnitude as the coefficient on BANK As a
result the coefficient on the sum of BANK and its interaction with B500 is insignificantly different
from zero whereas the sum of the coefficients on BANK and its interactions with each of the other
size indicators is significantly negative These results imply that relative to similarly sized control
firms audit effort is lower for banks with assets up to $500 billion and audit effort is
insignificantly different for banks with assets exceeding $500 billion The latter result is consistent
with the (relatively few) banks in the largest (money center) size category experiencing elevated
audit fees compared to non-banks of the same size
Examining the estimation of equation (2) with dependent variable LogREPORT_LAG
reported in the left column of Panel A of Table 5 we find that the coefficient on BANK is negative
(-0101) and significant at the 1 level This coefficient implies that on average audit report lag
31
for banks is only 90 of that for SIC 61 control sample firms controlling for other factors that
prior research finds are associated with audit report lag These results are consistent with
Hypothesis 2rsquos prediction that bank regulation and supervision lead to reduced audit effort
In both columns of Panel B of Table 5 the coefficient on BANK is significantly negative
as expected However the coefficients on the interactions of BANK with all of the size categories
are positive often significantly so and of similar absolute magnitude as the coefficient on BANK
As a consequence none of the sums of the coefficients on BANK and its interactions with the size
category indicators is significant These results imply that relative to similarly sized control firms
audit report lag is shorter and thus audit effort is lower for banks with assets up to $10 billion and
audit report lag is insignificantly different for banks with assets exceeding $10 billion
Collectively the audit fee and audit report lag estimation results reported in Tables 4 and
5 provide evidence consistent with bank regulation and supervision leading auditors to expend
lower audit effort on audits of banks in certain size categories
53 Identification Tests for the Audit Fee Model
To provide support for bank regulation and supervision as causally explaining the reduced
audit effort in bank audits that we document in Tables 4 and 5 we estimate expansions of equation
(2) explaining the natural logarithm of audit fees and equation (3) explaining the natural logarithm
of log audit report lag that include time-series or cross-sectional proxies for the intensity of bank
regulation and we test whether audit effort is lower when regulatory intensity is higher As the
inferences generated are similar to conserve space we tabulate and discuss only the results for the
expanded audit fee model
Table 6 reports OLS estimations of equation (2) with LogFEE as the dependent variable
expanded to include one of two measures of time-series measures of bank regulation intensity The
32
sample is limited to 7914 bank-year observations (965 unique banks) from 2000 to 2014 so BANK
is dropped from the equation The first bank regulation intensity measure is based on RegData an
industry- and year-specific regulation index constructed by Al-Ubaydli and McLaughlin (2017)
from textual analysis of the number of constraints (the strings ldquoshallrdquo ldquomustrdquo ldquomay notrdquo
ldquoprohibitedrdquo and ldquorequiredrdquo) in the Code of Federal Regulations (CFR) The measure used is the
natural logarithm of the number of constraints in CFR Title 12 for the banking industry each year
(LogRESTRICTIONS) The second measure is the natural logarithm of the annual budget (in $
millions) of the ldquofinance and bankingrdquo subcategory (which includes the Comptroller of the
Currency Federal Deposit Insurance Corporation and Securities and Exchange Commission)
from Regulatory Reports available at httpswcwustleduregulatory_reports (LogBUDGET)
Figure 1 depicts the evolutions of LogRESTRICTIONS and LogBUDGET from 2000-2014 Panel
A of Table 6 reports descriptive statistics of the two measures of bank regulation intensity
The left (right) columns of Table 6 report the estimation of equation (2) adding
LogBUDGET (LogRESTRICTIONS) to the model The coefficients on LogBUDGET and
LogRESTRICTIONS are both significantly negative at the 1 level consistent with more intense
bank regulation leading to lower audit fees
Table 7 reports the OLS estimations of equation (2) with LogFEE as the dependent variable
expanded to include Agarwal et alrsquos (2014) measure of regulatory leniency (ie inverse intensity)
across state-chartered banks (STATE_REG) This measure is based on the ldquoalternating examination
programrdquo in which state-chartered banks are examined by (more stringent) federal supervisors (the
FDIC or Federal Reserve) and state supervisors in rotation Using a proprietary database Agarwal
et al (2014) estimate the differential examination stringency of federal supervisors versus 44 state
supervisors The left column reports the estimation of an expanded model that includes
33
STATE_REG linearly This model is estimated on 5679 state bankndashyear observations (738 unique
banks) from 2000 to 2014 The right column reports the estimation of an expanded model that
includes STATE_REG both linearly and interacted with an indicator for state-chartered banks
(STATE_BANK) obtained from the FDIC website
(httpswww5fdicgovidaspadvSearchLandingasp) This model is estimated on 7340 (federal
and state) bankndashyear observations (903 unique banks) from 2000 to 2014 The coefficient on
STATE_REG in the left column and the coefficient on STATE_REGtimesSTATE_BANK in the right
column of the table are both significant positive at the 5 level consistent with more lenient state
regulation yielding higher audit fees
Overall the expanded audit fee model estimation results reported Tables 6 and 7 provide
evidence consistent with (more intense) bank regulation and supervision causally explaining the
(more strongly) reduced audit effort in bank audits that we document in Tables 4 and 5
53 Types of Earnings Management of Minor Concern to Bank Regulators and Supervisors
If bank regulation and supervision leads to lower audit effort banks should have more
ability to exercise accounting discretion to manage accounting numbers in ways that do not
significantly concern bank regulators and supervisors Drawing on Beatty et al (2002) we
examine two types of earnings management the frequency of small positive earnings
(SMALL_POS) and the length of the longest string of consecutive earnings increases (STRING)19
We conjecture that these types of earnings management typically accumulate to relatively small
amounts of retained earnings If so these types have relatively minor effects on banksrsquo solvency
19 A side benefit of our use of these earnings management measures is that they are just as naturally applied
to banks as to non-banks In contrast the most commonly used measures of earnings management in the
literature (Jones 1991 Dechow and Dichev 2002) are not as naturally applied to banks
34
ratios and so should be of minor concern to bank regulators and supervisors primarily concerned
with banksrsquo safety and soundness While we are unaware of any supporting empirical evidence for
our conjecture it is consistent with the absence of any mention of these types of earnings
management in bank supervisory manuals including the portions devoted to the evaluation of
earnings quality (Comptroller of the Currency 2007 p 53 Board of Governors of the Federal
Reserve System 2017 sect40203) In contrast based on the large empirical literature documenting
such earnings management and its capital market consequences by public firms in general and by
public banks in particular (Burgstahler and Dichev 1997 Beatty et al 2002 Bartov et al 2002
Brown and Caylor 2005) we expect these types of earnings management to significantly influence
banksrsquo investors and contracting parties and to be of concern to auditors
To test for differences in SMALL_POS for banks versus the firms in the control samples
Table 8 reports the logistic estimation of equation (4) with SMALL_POS as the dependent variable
for the combined BANK sample and SIC 61 control sample (left column) and for the combined
BANK sample and highest 5 ratio of accounts receivable to assets control sample (right column)
A positive coefficient β1 on BANK implies that banks exhibit more frequent small positive earnings
changes than do control firms consistent with bank regulation and supervision leading to lower
bank audit effort In both columns the coefficient on BANK is significantly positive at the 1
level The coefficient in the left (right) column implies that banks report small positive earnings
44 (25) times as frequently as the corresponding control sample firms controlling for other
variables that prior research shows are associated with the frequency of small positive earnings
To test for differences in STRING for banks versus control firms Table 9 reports the
estimation of equation (3) using the Cox proportional hazard approach for the combined BANK
sample and SIC 61 control sample (left column) and for the combined BANK sample and highest
35
5 ratio of accounts receivable to assets control sample (right column) The Cox proportional
hazard approach accounts for the right-censoring of STRING arising from our sample ending in
2014 A positive coefficient β1 on BANK implies that banks exhibit earnings strings with
incrementally longer length than do control firms consistent with bank regulation and supervision
leading to lower bank audit effort In both columns the coefficient on BANK is significantly
positive at the 1 level The coefficient in the left (right) column implies that banks report strings
of positive earnings that are 47 (94) longer than the corresponding control sample firms
controlling for other variables that prior research shows are associated with the length of earnings
strings
Collectively the results from Tables 8 and 9 indicate that compared to control firms banks
are more likely to engage in types of earnings management of minor concern to bank regulators
and supervisors consistent with bank regulation and supervision leading to lower audit effort in
audits of banks
6 Conclusion
A central feature of banks is they are regulated and supervised under numerous banking
laws and regulations Moreover bank supervision involves periodic on-site examinations and off-
site monitoring activities that overlap considerably with auditing activities In this paper we
examine whether bank regulation and supervision displace bank auditing leading to lower audit
effort in audits of banks than in audits of two control samples of similar unregulated firms (1)
non-depository credit institutions (two-digit SIC code 61) and (2) all non-banks in the highest five
percent of the ratio of accounts receivable (which includes loan and lease receivables) to total
assets Our results are consistent with bank regulation and supervision substituting for auditing
36
ie with audit effort being significantly lower in audits of banks than in audits of control sample
firms
We first provide evidence that banking engagements pose less risk to auditors We show
that banks are significantly less likely than control sample firms to disclose material weaknesses
in internal controls and to restate their financial statements controlling for the variables that prior
research shows to be associated with material internal control weaknesses and restatements We
then provide evidence consistent with auditors exerting less effort on audits of banks than on audits
of control sample firms We show that banks exhibit statistically and economically lower audit
fees and shorter audit report lags than do control sample firms controlling for the variables that
prior research shows to be associated with audit fees and audit report lags
We acknowledge that the primary threat to inference in our study is the possibility that
factors other than bank regulation and supervision might explain why audits of banks pose less
audit risk than do audits of control firms Although we cannot rule out this possibility altogether
we conduct two sets of tests to provide support for the conclusion that the associations we
document are causal First we provide evidence that bank auditors expend less effort when bank
regulation and supervision are more intense We use two time-series measures based on the text
of banking regulations and the annual budget of federal regulators and one cross-sectional measure
based on Agarwal et al (2014) of the intensity of bank regulation and supervision Second we
provide evidence that banks are more likely to engage in two types of earnings management that
are of minor concern to bank regulators and supervisors but that prior research shows have capital
market consequences (Bartov et al 2002 Brown and Caylor 2005) We find that banks report more
frequent small positive earnings and longer strings of earnings increases than do similar firms
37
We contribute to the banking and auditing literatures by providing evidence consistent
with auditors expending less effort in auditing banks than in auditing control sample firms due
to the overlap of the activities of bank regulators and supervisors with those of auditors We
emphasize that our evidence does not suggest that the aggregate monitoring of banksrsquo financial
reporting by bank regulators supervisors and auditors differs from the monitoring of similar
firmsrsquo financial reporting by auditors alone it only suggests that the monitoring conducted by
bank auditors is less Because of the importance of banks to stability and overall macroeconomic
health a compelling question is what incremental costs arise when bank auditors as financial
reporting specialists expend less effort on bank audits due to the existence of bank regulation
and supervision We provide evidence that this reduced effort leads to types of earnings
management that likely have minor effects on banksrsquo solvency ratios but have capital market
consequences documented by prior research that may lead to reduced market discipline over
banks We expect these results to be of interest to bank and auditing policymakers
38
References
Acharya V and S Ryan 2016 Banksrsquo financial reporting and financial system stability Journal
of Accounting Research 54 277ndash340
Acharya V 2014 A transparency standard for derivatives Chapter 6 in Risk Topography
Systematic Risk and Macro Modeling edited by M Brunnermeier and A Krishnamurthy
National Bureau of Economic Research University of Chicago Press 2014
Agarwal S D Lucca A Seru and F Trebbi 2014 Inconsistent regulators Evidence from
banking Quarterly Journal of Economics 129 889ndash938
Altamuro J and A Beatty 2010 How does internal control regulation affect financial reporting
Journal of Accounting and Economics 49 58ndash74
Al-Ubaydli O and P McLaughlin 2017 RegData A numerical database on industry-specific
regulations for all United States industries and federal regulations 1997-2012 Regulation
amp Governance 11 109-123
Ashbaugh-Skaife H D Collins and W Kinney Jr 2007 The discovery and reporting of internal
control deficiencies prior to SOX-mandated audits Journal of Accounting and Economics
44 166ndash192
Ashton R J Willingham and R Elliot 1987 An empirical analysis of audit delay Journal of
Accounting Research 25 275ndash292
Avraham D P Selvaggi and J Vickrey 2012 A structural view of US bank holding companies
Federal Reserve Bank of New York Economic Policy Review 18 65ndash81
Badertscher B J Burks and P Easton 2016 The market reaction to bank regulatory filings
Working paper University of Notre Dame
Bamber E L Bamber and M Schoderbek 1993 Audit structure and other determinants of audit
report lag An empirical analysis Auditing A Journal of Practice and Theory 12 1ndash23
Barth J T Li and W Lu 2009 Bank regulation in the United States CESifo Economic Studies
10 2ndash29
Barth M and W Landsman 2010 How did financial reporting contribute to the financial crisis
European Accounting Review 19 399-433
Bartov E D Givoly and C Hayn 2002 The rewards to meeting or beating earnings expectation
Journal of Accounting and Economics 33 (2) 173-204
39
Beatty A B Ke and K Petroni 2002 Earnings management to avoid earnings declines across
publicly and privately held banks The Accounting Review 77 547ndash570
Beatty A and S Liao 2014 Financial accounting in the banking industry A review of the
empirical literature Journal of Accounting and Economics 58 339ndash383
Bedard J and K Johnstone 2004 Earnings manipulation risk corporate governance risk and
auditorsrsquo planning and pricing decisions The Accounting Review 79 277ndash304
Bell T W Landsman and D Shackelford 2001 Auditorsrsquo perceived business risk and audit
fees Analysis and evidence Journal of Accounting Research 39 35ndash43
Board of Governors of the Federal Reserve Board System 2017 Bank Holding Company
Supervision Manual Division of Banking Supervision and Regulation
httpswwwfederalreservegovpublicationssupervision_bhchtm
Bronson S C Hogan M Johnson and K Ramesh 2011 The unintended consequences of
PCAOB auditing standard nos 2 and 3 on the reliability of preliminary earnings releases
Journal of Accounting and Economics 51 95ndash114
Brown L and M Caylor 2005 A temporal analysis of quarterly earnings thresholds Propensities
and valuation consequences The Accounting Review 80 (2) 423-440
Burgstahler D and I Dichev 1997 Earnings management to avoid earnings decreases and losses
Journal of Accounting and Economics 24 99ndash126
Comptroller of the Currency 2007 (last updated 2017) Bank supervision process Comptrollerrsquos
handbook
Costello A J Granja and J Weber 2016 Do strict regulators increase the transparency of the
banking system Working paper Massachusetts Institute of Technology
Dang T G Gorton B Holmstroumlm and Ordontildeez G 2014 Banks as secret keepers PIER working
paper no 14-022
Dechow P and I Dichev 2002 The quality of accruals and earnings The role of accrual
estimation errors The Accounting Review 77 35ndash59
DeFond M and J Zhang 2014 A review of archival auditing research Journal of Accounting
and Economics 58 275ndash326
Diamond D 1984 Financial intermediation and delegated monitoring Review of Economic
Studies 51 393ndash414
40
Doyle J W Ge and S McVay 2007a Accruals quality and internal control over financial
reporting The Accounting Review 82 1141ndash1170
Doyle J W Ge and S McVay 2007b Determinants of weaknesses in internal control over
financial reporting Journal of Accounting and Economics 44 193ndash223
Flannery M S Kwan and M Nimalendran 2013 The 2007ndash2009 financial crisis and bank
opaqueness Journal of Financial Intermediation 22 55ndash84
Francis J E Maydew and H Sparks 1999 The role of big 6 auditors in the credible reporting
of accruals Auditing A Journal of Practice and Theory 18 17ndash34
Gallemore J 2016 Bank financial reporting opacity and regulatory intervention Working paper
University of Chicago
Ge W and S McVay 2005 The disclosure of material weaknesses in internal control after the
Sarbanes-Oxley Act Accounting Horizons 19 137ndash158
Ghosh A and C Tang 2015 Assessing financial reporting quality of family firms The auditorsrsquo
perspective Journal of Accounting and Economics 60 95ndash116
Graham J C Harvey and S Rajgopal 2005 The economic implications of corporate financial
reporting Journal of Accounting and Economics 40 3ndash73
Guay W D Samuels D Taylor 2016 Guiding through the fog Financial statement complexity
and voluntary disclosure Journal of Accounting and Economics 62 234ndash269
Hennes K A Leone and B Miller 2014 Determinants and market consequences of auditor
dismissals after accounting restatements The Accounting Review 89 1051ndash1082
Holmstroumlm B 2015 Understanding the role of debt in the financial system BIS working paper
no 479
Houston R M Peters and J Pratt 1999 The audit risk model business risk and audit‐planning
decisions The Accounting Review 74 281ndash298
Jensen M and W Meckling Theory of the firm Managerial behavior agency costs and
ownership structure Journal of Financial Economics 3 305ndash360
Jones J 1991 Earnings management during import relief investigations Journal of Accounting
Research 29 193ndash228
Keeley J 2017 The impact of regulatory enforcement on bank risk Working paper New York
University
41
Kinney W Palmrose Z and S Scholz 2004 Auditor independence non-audit services and
restatements Was the US government right Journal of Accounting Research 42 561ndash588
Krishnan J and J Krishnan 1997 Litigation risk and auditor resignations The Accounting
Review 72 539ndash560
Lee H V Mande and R Ortman 2004 The effect of audit committee and board of director
independence on auditor resignation Auditing A Journal of Practice and Theory 23 (2)
131ndash146
Morgan D 2002 Rating banks Risk and uncertainty in an opaque industry The American
Economic Review 92 874ndash888
Myers S 1977 Determinants of corporate borrowing Journal of Financial Economics 5 147-
175
Nicoletti A 2016 The effects of auditors and regulators on bank financial reporting Evidence
from loan loss provisions Doctoral dissertation Ohio State University
Nier E and U Baumann 2006 Market discipline disclosure and moral hazard in banking
Journal of Financial Intermediation 15 332ndash361
Palmrose Z and S Scholz 2004 The circumstances and legal consequences of non-GAAP
reporting Evidence from restatements Contemporary Accounting Research 21 139ndash180
Pettway R and J Sinkey 1980 Establishing on-site bank examination priorities An early-
warning system using accounting and market information Journal of Finance XXXV 137ndash
150
Public Company Accounting Oversight Board (PCAOB) Auditing Standard No 8 Audit Risk
Washington DC PCAOB
Public Company Accounting Oversight Board (PCAOB) Auditing Standard No 12 Identifying
and Assessing Risks of Material Misstatement Washington DC PCAOB
Public Company Accounting Oversight Board (PCAOB) Auditing Standard No 13 The
Auditorrsquos Responses to the Risks of Material Misstatement Washington DC PCAOB
Richardson M K Schoenholtz B Tuckman and L White eds 2017 Regulating Wall Street
CHOICE Act vs Dodd-Frank New York Center for Global Economy and Business NYU
Stern School of Business
Ryan S 2007 Financial Instruments and Institutions Accounting and Disclosure Rules Second
edition John Wiley and Sons Hoboken NJ
42
Ryan S 2011 Financial reporting for financial instruments Foundations and Trends in
Accounting 6 187ndash354
Schwartz K and B Soo 1995 An analysis of Form 8-K disclosures of auditor changes by firms
approaching bankruptcy Auditing A Journal of Practice and Theory 14 124ndash136
Shu S Auditor resignations Clientele effects and legal liability Journal of Accounting and
Economics 29 173-205
Simunic D 1980 The pricing of audit services Theory and evidence Journal of Accounting
Research 18 161ndash190
Simunic D and M Stein 1996 The impact of litigation risk on audit pricing A review of the
economics and the evidence Auditing A Journal of Practice and Theory 15 (Supplement)
119ndash134
Watts R L and J L Zimmerman 1986 Positive Accounting Theory Prentice-Hall Inc
43
Table 1 Variable means for banks versus control firms
CONTROL BANK SIC61 High RECAT Mean Mean Difference Mean Difference INTERNAL_WEAKNESS 0024 0051 0026 0066 0042 ACC_RESTATEMENT 0006 0022 0016 0020 0014 FEE ($ million) 1643 6199 4555 3119 1476 REPORT_LAG 59325 68854 9530 68110 8785 SMALL_POS 0174 0063 ndash0111 0063 ndash0110 STRING 5608 4500 ndash1108 3347 ndash2261 ASSETS ($ billion) 39135 102555 63420 30418 8717 ROA 0006 ndash0006 ndash0012 ndash0008 ndash0014 LOSS 0108 0249 0141 0274 0167 SPECIAL_ITEMS ndash0001 ndash0015 ndash0015 ndash0020 ndash0019 DISCONTINUED 0029 0162 0134 0105 0077 EXTRA_ITEMS 0011 0048 0036 0031 0019 ABS_ACCRUALS 0027 0092 0065 0107 0080 LEVERAGE 0902 0722 ndash0180 0610 ndash0292 INVENTORY 0013 0056 0043 0071 0058 INTANGIBLES 0012 0039 0026 0074 0061 GOODWILL 0010 0019 0010 0056 0047 MampA 0198 0152 ndash0046 0228 0030 NEG_EQUITY 0003 0025 0023 0038 0035 FOREIGN 0040 0121 0081 0193 0153 FIRM_AGE 14340 14735 0395 18011 3671 ACCEL_FILER 0626 0689 0063 0608 ndash0018 MTB 1437 1700 0263 2601 1164 RETURN 0106 0171 0065 0179 0073 STD_RETURN 0084 0144 0060 0154 0070 GOING_CONCERN 0006 0015 0009 0028 0022 BUSY_MONTH 0879 0790 ndash0089 0715 ndash0164 BIG4 0444 0668 0224 0630 0185 ISPEC 0115 0166 0051 0162 0046 AUDITOR_TURNOVER 0072 0079 0007 0093 0021
This table reports variable means for the BANK and two CONTROL samples as well as the differences of variable means across the BANK and each CONTROL sample over the period 2000ndash2014 Inclusion in the BANK sample is based on inclusion in the Compustat Bank file (7914 bank-year observations) The SIC61 sample includes non-depository credit institutions with two-digit standard industry classification (SIC) code 61 on the Compustat Annual North American file (671
44
firm-year observations) The High RECTA control sample includes non-bank firms with a ratio of accounts receivable to total assets in the top 5 of the Compustat Annual North American file (3110 firm-year observations) All variables are measured for a given firm-year unless indicated otherwise The dependent variables are reported above the line in the table and are defined as follows INTERNAL_WEAKNESS = 1 if the firm disclosed internal control deficiencies and 0 otherwise ACC_RESTATEMENT = 1 if the firm subsequently restated its 10-K filing for the fiscal year and 0 otherwise FEE = the sum of audit fees and audit-related fees in $ millions REPORT_LAG = the number of days between the fiscal year-end date and auditor signature date (the natural logarithm of this variable is used in the regression analyses) SMALL_POS = 1 if a small ROE increase (000lt∆R0Ele001) is reported STRING = the duration of the longest string of consecutive annual earnings increases for the firm The control variables are reported below the line in the table and are defined as follows ASSETS = total assets ROA = net income divided by total assets LOSS = 1 if the firm reports negative net income and 0 otherwise SPECIAL_ITEMS = special items divided by total assets DISCONTINUED = 1 if discontinued operations exceeds $1 million and 0 otherwise EXTRA_ITEMS = 1 if (absolute) extraordinary items exceeds $1 million and 0 otherwise ABS_ACCRUALS = absolute value of accruals divided by total assets LEVERAGE = total liabilities divided by total assets INVENTORY = inventory divided by total assets INTANGIBLES = intangibles assets divided by total assets GOODWILL = goodwill divided by total assets MampA = 1 if goodwill increases by more than $1 million and 0 otherwise NEG_EQUITY = 1 if common equity is negative and 0 otherwise FOREIGN = 1 if a company reports non-zero foreign exchange income and 0 otherwise FIRM_AGE = the number of years a company is listed in Compustat ACCEL_FILER = 1 if the company is an accelerated filer and 0 otherwise MTB = market value of equity divided by book value of equity RETURN = fiscal year stock return STD_RETURN = standard deviation of monthly stock returns GOING_CONCERN = 1 if the firm received a goingndashconcern modified opinion and 0 otherwise BUSY_MONTH = 1 if the fiscal year-end month is December and 0 otherwise BIG4 = 1 if the company is audited by one of the Big-Four auditors and 0 otherwise ISPEC = auditorrsquos relative market share of audit fees in the clientrsquos FamandashFrench 48 industry classification AUDITOR_TURNOVER = 1 if the firmrsquos auditor changed during the year and 0 otherwise and denote significantly different variable means for the BANK and each CONTROL sample at the 1 5 and 10 levels respectively
45
Table 2 Likelihood of material internal control weaknesses for banks versus control firms
Panel A Logistic estimation of likelihood of material internal control weaknesses CONTROL SIC61 High RECTA BANK ndash0781 (0002) ndash0556 (0001) LogASSETS 0053 (0301) 0014 (0681) ROA 1208 (0441) 0138 (0718) LOSS 1469 (0000) 1335 (0000) LEVERAGE 0663 (0435) ndash0816 (0017) GOODWILL 2950 (0215) 1048 (0206) MampA 0058 (0767) 0194 (0187) FOREIGN ndash0561 (0160) 0463 (0004) MTB 0030 (0536) ndash0041 (0091) GOING_CONCERN 2034 (0000) 1324 (0000) ACC_RESTATEMENT (Y_CONTROL) ndash0076 (0917) 0266 (0574) BUSY_MONTH ndash0020 (0929) 0187 (0203) BIG4 ndash1259 (0029) ndash0863 (0001) ISPEC 4431 (0036) 2211 (0008) Intercept ndash3940 (0001) ndash1463 (0002) Year fixed effects Yes Yes Observations 6064 7834 McFaddens R2 827 952 Panel B Incorporating bank size categories SIC61 High RECTA Intercept ndash4564 (0000) ndash1942 (0000) B10_50 1167 (0041) ndash0047 (0896) B50_100 0308 (0731) ndash0340 (0666) B100_500 ndash0729 (0527) ndash14727 (0983) B500 0032 (0969) ndash0465 (0444) BANK ndash0014 (0968) ndash0499 (0007) BANKB10_50 ndash1704 (0005) ndash0256 (0551) BANKB50_100 ndash2210 (0093) ndash1468 (0246) BANKB100_500 ndash1369 (0296) 12904 (0985) BANKB500 ndash15538 (0978) ndash13901 (0971) Control variables Yes Yes Year fixed effects Yes Yes Observations 6064 7834 McFaddens R2 984 1048
The table reports the logistic estimation of the likelihood of a firm reporting a material weakness in internal control over financial reporting The dependent variable INTERNAL_WEAKNESS = 1 if the firm disclosed a material internal control deficiency and 0 otherwise The main test variable BANK = 1 if the firm is on Bank Compustat and 0 otherwise We estimate the model on the combined BANK sample and one of two control samples of firms that are similar to banks but unregulated (1) The SIC61 control sample comprises non-depository credit institutions with two-digit standard industry classification (SIC) code 61 on Annual North American Compustat (2) the High RECTA control sample comprises non-banks with the top 5 of receivable to assets ratio on Annual North American Compustat The control variables are defined as follows LogASSETS = the natural logarithm of total assets ROA = net income divided by total assets LOSS = 1 if the firm reports negative net income and 0 otherwise LEVERAGE = total liabilities divided by total assets GOODWILL = goodwill divided by total assets MampA = 1 if the firmrsquos goodwill increases by more than $1 million and 0 otherwise FOREIGN = 1 if a firm reports non-zero foreign exchange income and 0 otherwise MTB = market value of equity divided by book value of equity GOING_CONCERN = 1 if a firm receives a going concern modified opinion and 0 otherwise ACC_RESTATEMENT = 1 if the firm subsequently restates its current period Form 10-K filing for the fiscal year BUSY_MONTH = 1 if the fiscal year-end is December and 0 otherwise BIG4 = 1 if the firm is audited by one of the Big-Four auditors and 0 otherwise ISPEC = auditorrsquos relative market share of
46
audit fees in the clientrsquos FamandashFrench 48 industry classification Panel A reports the base model estimation Panel B reports the estimation of an expanded model which includes firm size indicators and their interactions with BANK The firm size indicators are denoted Bj_k=1 if total assets are between j and k $ billion for j=10 50 or 100 and for k=50 100 or 500 and are denoted B500=1 if total assets exceed $500 billion p-values are reported in parentheses
47
Table 3 Likelihood of financial statement restatements for banks versus control firms
Panel A Logistic estimation of restatements CONTROL SIC61 High RECTA BANK ndash1075 (0005) ndash1520 (0000) LogASSETS 0006 (0947) 0082 (0134) ROA 0155 (0934) ndash0815 (0242) LOSS 0271 (0451) 0359 (0167) LEVERAGE ndash0755 (0518) 0890 (0157) GOODWILL ndash13070 (0151) ndash5891 (0014) MampA 0569 (0095) 0527 (0036) FOREIGN ndash0678 (0295) ndash0817 (0026) MTB ndash0050 (0748) 0049 (0084) GOING_CONCERN ndash13976 (0992) ndash14082 (0979) INTERNAL_WEAKNESS (Y_CONTROL) ndash0218 (0768) 0017 (0972) BUSY_MONTH ndash0023 (0952) ndash0439 (0058) BIG4 1087 (0100) 0635 (0111) ISPEC ndash2067 (0399) ndash1643 (0258) Intercept ndash4288 (0000) ndash5118 (0000) Year fixed effects Yes Yes Observations 8585 11024 McFaddens R2 765 902 Panel B Incorporating bank size into the analyses SIC61 High RECTA Intercept ndash5023 (0000) ndash5551 (0000) B10_50 0512 (0550) ndash0022 (0962) B50_100 ndash0080 (0950) ndash0728 (0510) B100_500 0568 (0609) ndash0476 (0584) B500 ndash14268 (0984) ndash1148 (0223) BANK ndash0552 (0294) ndash1349 (0000) BANKB10_50 ndash2798 (0029) ndash2119 (0053) BANKB50_100 ndash13314 (0978) ndash13363 (0986) BANKB100_500 ndash0962 (0359) 0307 (0743) BANKB500 ndash0169 (1000) ndash13623 (0985) Control variables Yes Yes Year fixed effects Yes Yes Observations 8585 11024 McFaddens R2 1029 1035
The table reports the logistic estimation of the likelihood of a firm reporting a financial statement restatement The dependent variable ACC_RESTATEMENT = 1 if the firm subsequently restated its 10-K filing for the fiscal year and zero otherwise The main test variable BANK = 1 if the firm is on Bank Compustat and 0 otherwise We estimate the model on the combined BANK sample and one of two control samples of firms that are similar to banks but unregulated (1) The SIC61 control sample comprises non-depository credit institutions with two-digit standard industry classification (SIC) code 61 on Annual North American Compustat (2) the High RECTA control sample comprises non-banks with the top 5 of receivable to assets ratio on Annual North American Compustat The control variables are defined as follows LogASSETS = the natural logarithm of total assets ROA = net income divided by total assets LOSS = 1 if the firm reports negative net income and 0 otherwise LEVERAGE = total liabilities divided by total assets GOODWILL = goodwill divided by total assets MampA = 1 if the firmrsquos goodwill increases by more than $1 million and 0 otherwise FOREIGN = 1 if a firm reports non-zero foreign exchange income and 0 otherwise MTB = market value of equity divided by book value of equity GOING_CONCERN = 1 if a firm receives a going concern modified opinion and 0 otherwise INTERNAL_WEAKNESS= 1 if the firm disclosed internal control deficiencies and 0 otherwise BUSY_MONTH = 1 if the fiscal year-end is December and 0 otherwise BIG4 = 1 if the firm is audited by one of the Big-Four auditors and 0 otherwise ISPEC = auditorrsquos relative market share of audit fees in the clientrsquos FamandashFrench
48
48 industry classification Panel A reports the base model estimation Panel B reports the estimation of an expanded model which includes firm size indicators and their interactions with BANK The firm size indicators are denoted Bj_k=1 if total assets are between j and k $ billion for j=10 50 or 100 and for k=50 100 or 500 and are denoted B500=1 if total assets exceed $500 billion p-values are reported in parentheses
49
Table 4 Audit fees for banks versus control firms
Panel A OLS estimation of audit fees CONTROL SIC61 High RECTA BANK ndash0705 (0000) ndash0954 (0000) LogASSETS 0601 (0000) 0552 (0000) ROA ndash0754 (0003) ndash0768 (0000) LOSS 0178 (0000) 0196 (0000) SPECIAL_ITEMS 0488 (0003) 0072 (0652) DISCONTINUED 0286 (0000) 0228 (0000) LEVERAGE ndash1496 (0000) ndash0627 (0000) INVENTORY 0291 (0177) 0729 (0000) INTANGIBLES 2637 (0002) 2404 (0000) GOODWILL ndash2665 (0046) ndash0609 (0297) MampA 0081 (0000) 0092 (0000) NEG_EQUITY 0222 (0094) 0466 (0000) FIRM_AGE 0004 (0084) 0007 (0000) ACCEL_FILER ndash0004 (0902) 0029 (0307) INTERNAL_WEAKNESS 0254 (0000) 0260 (0000) MTB ndash0008 (0598) 0021 (0004) RETURN ndash0035 (0048) ndash0001 (0936) STD_RETURN 0802 (0000) 0780 (0000) GOING_CONCERN 0048 (0602) 0055 (0473) BUSY_MONTH 0106 (0014) 0038 (0286) BIG4 0322 (0000) 0327 (0000) ISPEC 0087 (0712) 0240 (0141) Year fixed effects Yes Yes Observations 8585 11024 Adjusted R2 90 24 88 54 Panel B Incorporating firm size into the analyses SIC61 High RECTA B10_50 ndash0215 (0268) 0013 (0935) B50_100 0283 (0074) 0283 (0010) B100_500 0215 (0488) 0219 (0284) B500 0482 (0004) 0519 (0000) BANK ndash0766 (0000) ndash0980 (0000) BANKB10_50 0213 (0283) 0033 (0842) BANKB50_100 ndash0138 (0466) ndash0045 (0772) BANKB100_500 0201 (0523) 0315 (0129) BANKB500 0701 (0000) 0852 (0000) Control variables Yes Yes Year fixed effects Yes Yes Observations 8585 11024 Adjusted R2 90 92 89 32
The table reports the OLS estimation of a model with dependent variable LogFEE = the natural logarithm of the sum of audit fees and audit-related fees The main test variable BANK = 1 if the firm is on Bank Compustat and 0 otherwise We estimate the model on the combined BANK sample and one of two control samples of firms that are similar to banks but unregulated (1) The SIC61 control sample comprises non-depository credit institutions with two-digit standard industry classification (SIC) code 61 on Annual North American Compustat (2) the High RECTA control sample comprises non-banks with the top 5 of receivable to assets ratio on Annual North American Compustat The control variables are defined as follows LogASSETS = the natural logarithm of total assets ROA = net income divided by total assets LOSS = 1 if the firm reports negative net income and 0 otherwise SPECIAL_ITEMS = special items divided by total assets DISCONTINUED = 1 if a firmrsquos discontinued operations exceeds $1 million and
50
0 otherwise LEVERAGE = total liabilities divided by total assets INVENTORY = inventory divided by total assets INTANGIBLES = intangible assets divided by total assets GOODWILL = goodwill divided by total assets MampA = 1 if the firmrsquos goodwill increases by more than $1 million and 0 otherwise NEG_EQUITY = 1 if common equity is negative and 0 otherwise FIRM_AGE = the number of years the firm is listed in Compustat ACCEL_FILER = 1 if the firm is an accelerated filer and 0 otherwise INTERNAL_WEAKNESS = 1 if the firm disclosed a material internal control deficiency and 0 otherwise MTB = market value of equity divided by book value of equity RETURN = fiscal year stock return STD_RETURN = standard deviation of monthly stock returns GOING_CONCERN = 1 if a firm receives a going concern modified opinion and 0 otherwise BUSY_MONTH = 1 if the fiscal year-end is December and 0 otherwise BIG4 = 1 if the firm is audited by one of the Big-Four auditors and 0 otherwise ISPEC = auditorrsquos relative market share of audit fees in the clientrsquos FamandashFrench 48 industry classification Panel A reports the base model estimation Panel B reports the estimation of an expanded model which includes firm size indicators and their interactions with BANK The firm size indicators are denoted Bj_k=1 if total assets are between j and k $ billion for j=10 50 or 100 and for k=50 100 or 500 and are denoted B500=1 if total assets exceed $500 billion Standard errors are clustered at the firm level (two-tailed p-values are in parentheses)
51
Table 5 Audit report lag for banks versus control firms
Panel A OLS estimation of audit report lag CONTROL SIC61 High RECTA BANK ndash0101 (0015) ndash0101 (0000) LogASSETS ndash0014 (0057) ndash0021 (0000) ROA ndash0275 (0022) 0058 (0243) LOSS 0113 (0000) 0144 (0000) DISCONTINUED 0029 (0416) 0035 (0148) EXTRA_ITEMS 0098 (0058) 0137 (0001) ABS_ACCRUALS ndash0021 (0356) 0064 (0061) LEVERAGE 0093 (0397) 0084 (0093) INVENTORY 0408 (0001) 0255 (0005) FOREIGN 0199 (0002) 0067 (0045) FIRM_AGE ndash0007 (0000) ndash0005 (0000) INTERNAL_WEAKNESS 0186 (0000) 0151 (0000) AUDITOR_TURNOVER 0045 (0004) 0050 (0000) GOING_CONCERN 0240 (0001) 0172 (0000) BUSY_MONTH ndash0021 (0411) ndash0021 (0286) BIG4 0111 (0000) 0083 (0000) Year fixed effects Yes Yes Observations 8289 10660 Adjusted R2 51 28 45 53 Panel B Incorporating firm size into the analyses SIC61 High RECTA B10_50 ndash0252 (0000) ndash0124 (0000) B50_100 ndash0190 (0074) ndash0090 (0126) B100_500 ndash0184 (0017) 0091 (0037) B500 0079 (0608) 0161 (0004) BANK ndash0174 (0000) ndash0141 (0000) BANKB10_50 0246 (0001) 0180 (0000) BANKB50_100 0238 (0061) 0229 (0001) BANKB100_500 0290 (0002) 0136 (0008) BANKB500 0101 (0546) 0202 (0001) Control variables Yes Yes Year fixed effects Yes Yes Observations 8289 10660 Adjusted R2 51 67 46 51
The table reports the OLS estimation of a model with dependent variable LogARL = the natural logarithm of the number of days between the fiscal year-end date and auditor signature date The main test variable BANK = 1 if the firm is on Bank Compustat and 0 otherwise We estimate the model on the combined BANK sample and one of two control samples of firms that are similar to banks but unregulated (1) The SIC61 control sample comprises non-depository credit institutions with two-digit standard industry classification (SIC) code 61 on Annual North American Compustat (2) the High RECTA control sample comprises non-banks with the top 5 of receivable to assets ratio on Annual North American Compustat The control variables are defined as follows LogASSETS = the natural logarithm of total assets ROA = net income divided by total assets LOSS = 1 if the firm reports negative net income and 0 otherwise DISCONTINUED = 1 if a firmrsquos discontinued operations exceeds $1 million and 0 otherwise EXTRA_ITEMS = 1 if a firmrsquos (absolute) extraordinary items exceeds $1 million and 0 otherwise ABS_ACCRUALS = absolute value of accruals divided by total assets LEVERAGE = total liabilities divided by total assets INVENTORY = inventory divided by total assets FOREIGN = 1 if a firm reports non-zero foreign exchange income and 0 otherwise FIRM_AGE = the number of years a firm is listed in Compustat INTERNAL_WEAKNESS = 1 if the firm disclosed a material internal control deficiency and 0 otherwise AUDITOR_TURNOVER = 1 if the firmrsquos auditor changed during the year and 0 otherwise GOING_CONCERN = 1 if a firm receives a going concern modified opinion and 0 otherwise
52
BUSY_MONTH = 1 if the fiscal year-end is December and 0 otherwise BIG4 = 1 if the firm is audited by one of the Big-Four auditors and 0 otherwise Panel A reports the base model estimation Panel B reports the estimation of an expanded model which includes firm size indicators and their interactions with BANK The firm size indicators are denoted Bj_k=1 if total assets are between j and k $ billion for j=10 50 or 100 and for k=50 100 or 500 and are denoted B500=1 if total assets exceed $500 billion Standard errors are clustered at the firm level (two-tailed p-values are in parentheses)
53
Table 6 Identification tests for audit fee model using proxies for times-series variation
in the intensity of banking regulation
Panel A Descriptive statistics N Mean Std Q1 Median Q3 BUDGET (in millions $) 15 2757 908 2008 2506 3584 RESTRICTIONS (number of words) 15 29936 9313 24771 25536 30053 Panel B OLS estimation of audit fees
intensity LogBUDGET model LogRESTRICTIONS model LogBUDGET ndash1640 (0000) LogRESTRICTIONS ndash0677 (0000) LogASSETS 0454 (0000) 0467 (0000) ROA ndash1735 (0008) ndash1227 (0083) LOSS 0046 (0008) 0048 (0008) SPECIAL_ITEMS 2113 (0020) 1043 (0281) DISCONTINUED 0057 (0024) 0078 (0003) LEVERAGE ndash0896 (0000) ndash0732 (0000) INVENTORY 0274 (0086) 0228 (0170) INTANGIBLES 1962 (0090) 1632 (0207) GOODWILL ndash0059 (0960) 1379 (0286) MampA 0036 (0000) 0055 (0000) NEG_EQUITY 0099 (0300) 0113 (0244) FIRM_AGE 0177 (0000) 0101 (0000) ACCEL_FILER ndash6728 (0000) ndash3901 (0000) INTERNAL_WEAKNESS 0230 (0000) 0220 (0000) MTB 0005 (0352) 0037 (0002) RETURN ndash0052 (0000) ndash0059 (0000) STD_RETURN 0131 (0040) ndash0209 (0008) GOING_CONCERN 0039 (0441) 0057 (0294) BUSY_MONTH 0043 (0438) 0063 (0273) BIG4 0109 (0002) 0111 (0002) ISPEC 0516 (0000) 0554 (0000) Year fixed effects No No Firm fixed effects Yes Yes Observations 7914 7914 Adjusted R2 9590 9569
Panel A reports descriptive statistics for two measures of bank regulation intensity BUDGET and RESTRICTIONS BUDGET is the annual budget in $ millions of the ldquofinance and bankingrdquo subcategory (which includes the Comptroller of the Currency Federal Deposit Insurance Corporation and Securities and Exchange Commission) from Regulatory Reports available at httpswcwustleduregulatory_reports RESTRICTIONS is based on RegData an industry- and year-specific regulation index constructed by Al-Ubaydli and McLaughlin (2017) from textual analysis of the number of constraints (the strings ldquoshallrdquo ldquomustrdquo ldquomay notrdquo ldquoprohibitedrdquo and ldquorequiredrdquo) in the Code of Federal Regulations (CFR) Title 12 for the banking industry each year Panel B reports the OLS estimation for the BANK sample only of an expansion of the audit fee model with dependent variable LogFEE = the natural logarithm of the sum of audit fees and audit-related fees reported in Table 4 The expanded model includes the natural logarithm of BUDGET or RESTRICTIONS The control variables are defined as follows LogASSETS = the natural logarithm of total assets ROA = net income divided by total assets LOSS = 1 if the firm reports negative net income and 0 otherwise SPECIAL_ITEMS = special items divided by total assets DISCONTINUED = 1 if a firmrsquos discontinued operations exceeds $1 million and 0 otherwise LEVERAGE = total liabilities divided by total assets INVENTORY = inventory divided by total assets INTANGIBLES = intangible assets divided by total assets GOODWILL = goodwill divided by total assets MampA = 1 if the firmrsquos goodwill increases by more than $1 million and 0 otherwise NEG_EQUITY = 1 if common equity is negative and 0 otherwise FIRM_AGE = the number of years a firm is listed in Compustat ACCEL_FILER = 1 if the firm is an accelerated filer and 0 otherwise INTERNAL_WEAKNESS = 1 if the firm disclosed a material internal control
54
deficiency and 0 otherwise MTB = market value of equity divided by book value of equity RETURN = fiscal year stock return STD_RETURN = standard deviation of monthly stock returns GOING_CONCERN = 1 if a firm receives a going concern modified opinion and 0 otherwise BUSY_MONTH = 1 if the fiscal year-end is December and 0 otherwise BIG4 = 1 if the firm is audited by one of the Big-Four auditors and 0 otherwise ISPEC = auditorrsquos relative market share of audit fees in the clientrsquos FamandashFrench 48 industry classification Standard errors are Whites corrected standard errors (two-tailed p-values are in parentheses)
55
Table 7 Identification tests for audit fee model using proxy for cross sectional variation
in the intensity of banking regulation
STATE BANKS ALL BANKS STATE_REG 0664 (0016) ndash0670 (0196) STATE_BANK ndash0088 (0158) STATE_REG x STATE_BANK 1346 (0023) LogASSETS 0537 (0000) 0567 (0000) ROA ndash3904 (0010) ndash4337 (0003) LOSS 0093 (0009) 0116 (0001) SPECIAL_ITEMS 3148 (0057) 3943 (0012) DISCONTINUED 0296 (0001) 0273 (0000) LEVERAGE ndash1964 (0000) ndash1976 (0000) INVENTORY 0780 (0000) 0986 (0000) INTANGIBLES 7261 (0000) 6960 (0000) GOODWILL ndash5674 (0000) ndash5593 (0000) MampA 0091 (0000) 0066 (0000) NEG_EQUITY 0164 (0184) 0027 (0879) FIRM_AGE 0007 (0002) 0008 (0000) ACCEL_FILER 0076 (0014) 0023 (0440) INTERNAL_WEAKNESS 0250 (0000) 0248 (0000) MTB 0005 (0708) ndash0004 (0764) RETURN ndash0047 (0013) ndash0021 (0243) STD_RETURN 0669 (0001) 0637 (0000) GOING_CONCERN ndash0081 (0318) 0017 (0855) BUSY_MONTH 0068 (0055) 0068 (0062) BIG4 0360 (0000) 0331 (0000) ISPEC 0035 (0889) 0003 (0989) Intercept 9320 (0000) 9274 (0000) Year fixed effects Yes Yes Observations 5679 7340 Adjusted R2 8741 8859
The table reports the OLS estimation for the BANK sample only of two expansions of the audit fee model with dependent variable LogFEE = the natural logarithm of the sum of audit fees and audit-related fees in $ millions reported in Table 4 The both expanded models include Agarwal Lucca Seru and Trebbirsquos (2014) measure of regulatory leniency (inverse intensity) across state-chartered banks (STATE_REG) and The measure is based on the ldquoalternating examination programrdquo in which state-chartered banks are examined by (more stringent) federal supervisors (the FDIC or Federal Reserve) and state supervisors on an alternating basis Using a proprietary database Agarwal et al (2014) estimate the differential examination stringency of federal supervisors versus 44 state bank supervisors The expanded reported in right column as includes an indicator for whether bank is a state-chartered bank (STATE_BANK) based on information obtained from the FDIC website (httpswww5fdicgovidaspadvSearchLandingasp) as well as the interaction of STATE_REG with STATE_BANK The control variables are defined as follows LogASSETS = the natural logarithm of total assets ROA = net income divided by total assets LOSS = 1 if the firm reports negative net income and 0 otherwise SPECIAL_ITEMS = special items divided by total assets DISCONTINUED = 1 if a firmrsquos discontinued operations exceeds $1 million and 0 otherwise LEVERAGE = the total liabilities divided by total assets INVENTORY = inventory divided by total assets INTANGIBLES = intangible assets divided by total assets GOODWILL = goodwill divided by total assets MampA = 1 if the firmrsquos goodwill increases by more than $1 million and 0 otherwise NEG_EQUITY = 1 if common equity is negative and 0 otherwise FIRM_AGE = the number of years a firm is listed in Compustat ACCEL_FILER = 1 if the firm is an accelerated filer and 0 otherwise INTERNAL_WEAKNESS = 1 if the firm disclosed a material internal control deficiency and 0 otherwise MTB = market value of equity divided by book value of equity RETURN = fiscal year stock return STD_RETURN = standard deviation of monthly stock returns GOING_CONCERN = 1 if a firm receives a going concern modified opinion and 0 otherwise BUSY_MONTH = 1 if the fiscal year-end is December and 0 otherwise
56
BIG4 = 1 if the firm is audited by one of the Big-Four auditors and 0 otherwise ISPEC = auditorrsquos relative market share of audit fees in the clientrsquos FamandashFrench 48 industry classification Panel A reports the base model estimation Panel B reports the estimation of an expanded model which includes the interactions of firm size with BANK The bank size indicators are denoted Bj_k=1 if total assets are between j and k $ billion for j=10 50 or 100 and for k=50 100 or 500 and are denoted B500=1 if total assets exceed $500 billion Standard errors are clustered at the firm level (two-tailed p-values are in parentheses)
57
Table 8 Likelihood of small earnings increases for banks versus control firms
CONTROL SIC61 High RECTA BANK 1483 (0000) 0897 (0000) LogASSETS ndash0052 (0026) ndash0030 (0168) LEVERAGE ndash1351 (0006) ndash0022 (0952) MTB 0040 (0192) 0001 (0965) ACCEL_FILER 0222 (0003) 0176 (0019) BIG4 ndash0062 (0401) ndash0062 (0399) Intercept ndash1467 (0000) ndash2164 (0000) Year fixed effects Yes Yes Observations 8585 8928 McFaddens R2 312 328
The table reports the logistic estimation of the likelihood that a firm reports a small earnings increase SMALL_POS = 1 if 000 lt ∆ROE le 001 where ROE = net income divided by the book value of common equity and 0 otherwise The main test variable BANK = 1 if the firm is a bank and 0 otherwise We estimate the model on the combined BANK sample and one of two control samples of firms that are similar to banks but unregulated (1) The SIC61 control sample comprises non-depository credit institutions with two-digit standard industry classification (SIC) code 61 on Annual North American Compustat (2) the High RECTA control sample comprises non-banks with the top 5 of receivable to assets ratio on Annual North American Compustat The control variables are defined as follows LogASSETS = the natural logarithm of total assets LEVERAGE = total liabilities divided by total assets MTB = market value of equity divided by book value of equity ACCEL_FILER = 1 if the firm is an accelerated filer and 0 otherwise BIG4 = 1 if the firm is audited by one of the Big-Four auditors and 0 otherwise p-values are reported in parentheses
58
Table 9 Length of string of consecutive earnings increases for banks versus control firms
CONTROL SIC61 High RECTA BANK 0383 (0008) 0663 (0000) LogASSETS ndash0128 (0000) ndash0171 (0000) LEVERAGE ndash0469 (0377) 0516 (0000) MTB ndash0275 (0000) ndash0062 (0000) GOODWILL 1023 (04260 ndash0726 (0070) ACCEL_FILER ndash0446 (0000) ndash0246 (0000) INTERNAL_WEAKNESS ndash0170 (0467) 0041 (0763) BIG4 0101 (0215) 0111 (0058) Intercept Year fixed effects Yes Yes Number of observations 1069 1778 McFaddens R2 417 390
The table reports proportional hazard model estimation of a model with dependent variable STRING = the duration of the longest string of consecutive annual earnings increases The main test variable BANK = 1 if the firm is a bank and 0 otherwise We estimate the model on the combined BANK sample and one of two control samples of firms that are similar to banks but unregulated (1) The SIC61 control sample comprises non-depository credit institutions with two-digit standard industry classification (SIC) code 61 on Annual North American Compustat (2) the High RECTA control sample comprises non-banks with the top 5 of receivable to assets ratio on Annual North American Compustat The control variables are defined as follows LogASSETS = the natural logarithm of total assets LEVERAGE = total liabilities divided by total assets MTB = market value of equity divided by book value of equity ACCEL_FILER = 1 if the firm is an accelerated filer and 0 otherwise BIG4 = 1 if the firm is audited by one of the Big-Four auditors and 0 otherwise p-values are reported in parentheses
59
Figure 1
Plot of time-series measures of the intensity of banking regulation from 2000-2014
LogRestrictions is based on RegData an industry- and year-specific regulation index constructed by Al-Ubaydli and
McLaughlin (2017) from textual analysis of the number of constraints (the strings ldquoshallrdquo ldquomustrdquo ldquomay notrdquo
ldquoprohibitedrdquo and ldquorequiredrdquo) in the Code of Federal Regulations (CFR) This measure is the natural logarithm of the
number of constraints in CFR Title 12 for the banking industry each year LogBudget is the natural logarithm of the
annual budget (in $ millions) of the ldquofinance and bankingrdquo subcategory (which includes the Comptroller of the
Currency Federal Deposit Insurance Corporation and Securities and Exchange Commission) from Regulatory
Reports available at httpswcwustleduregulatory_reports
94
96
98
10
102
104
106
108
11
7
72
74
76
78
8
82
84
86
2000 2001 2002 2003 2004 2005 2006 2007 2008 2009 2010 2011 2012 2013 2014
logBudget logRestrictions
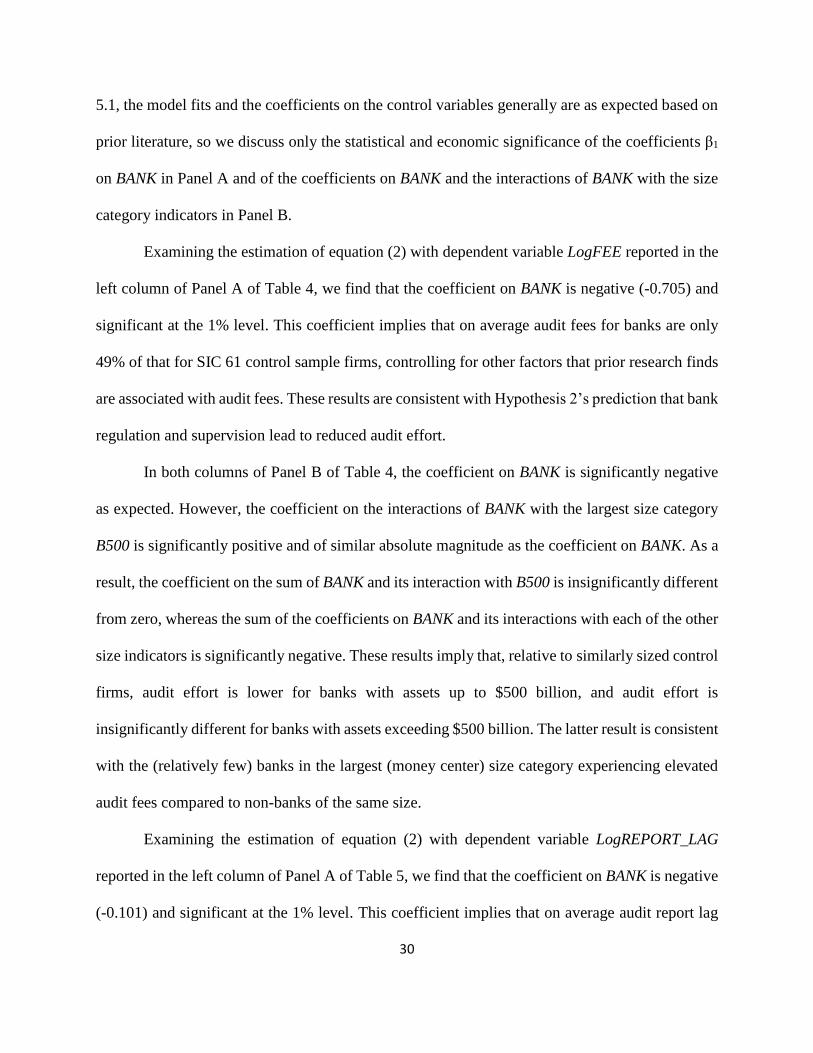
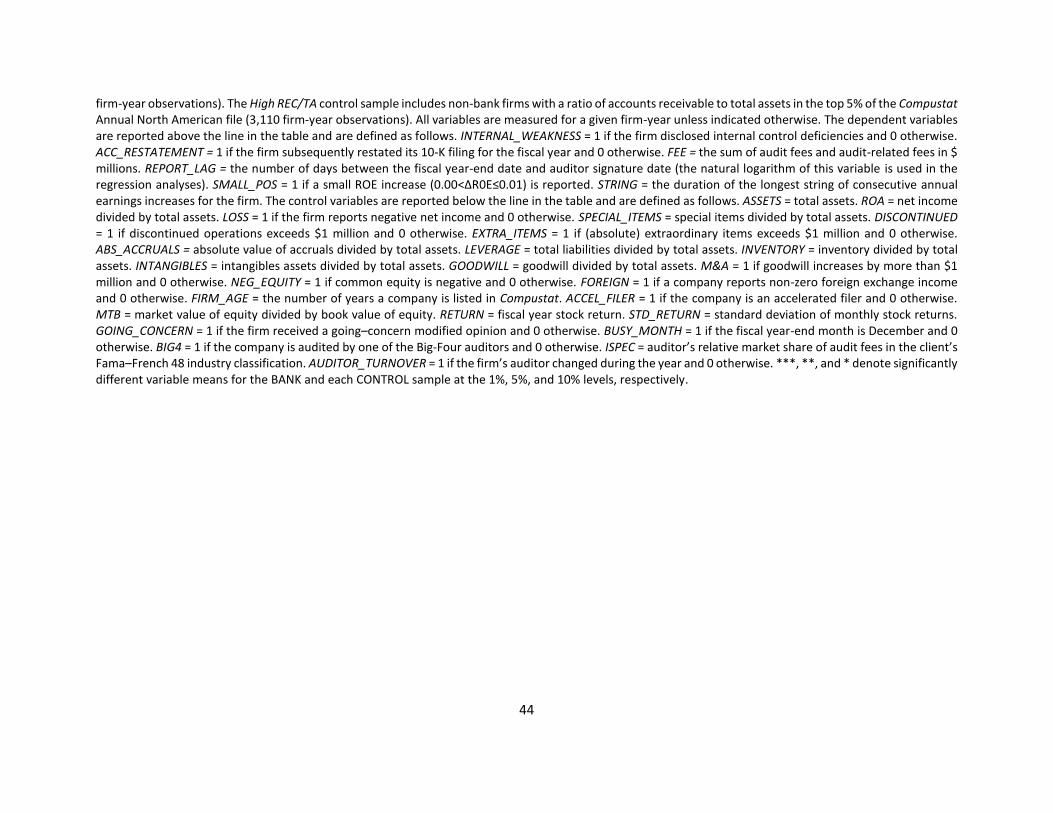
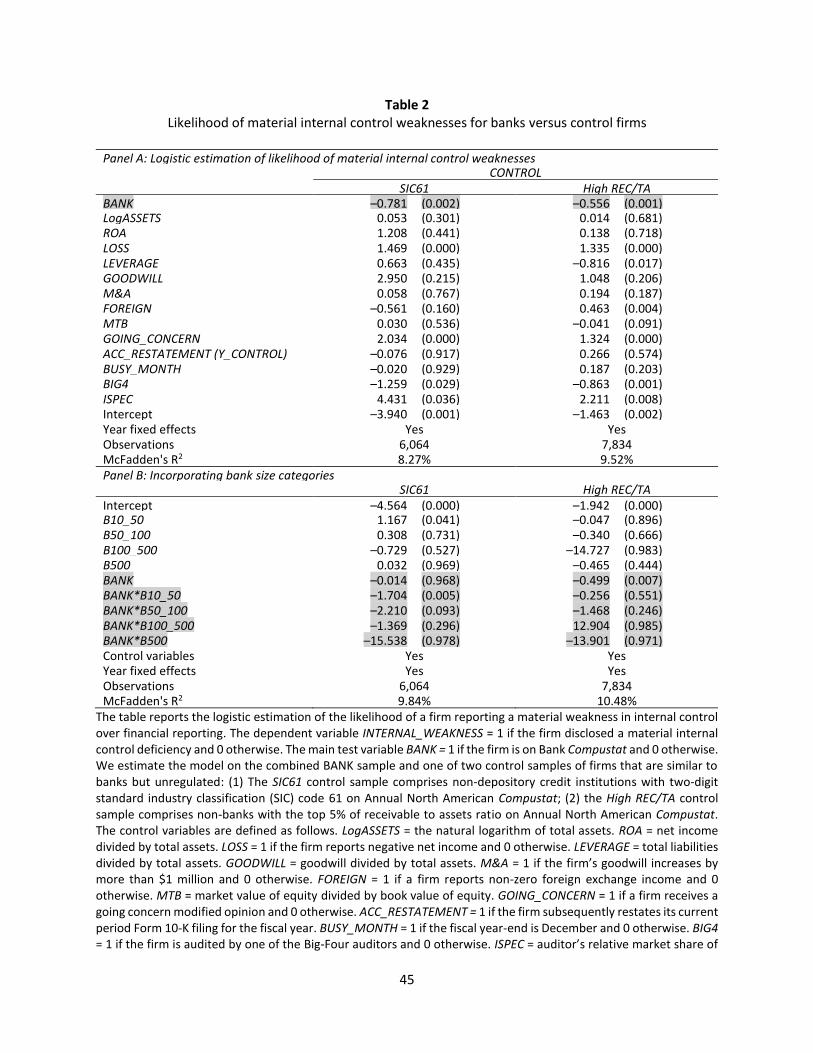
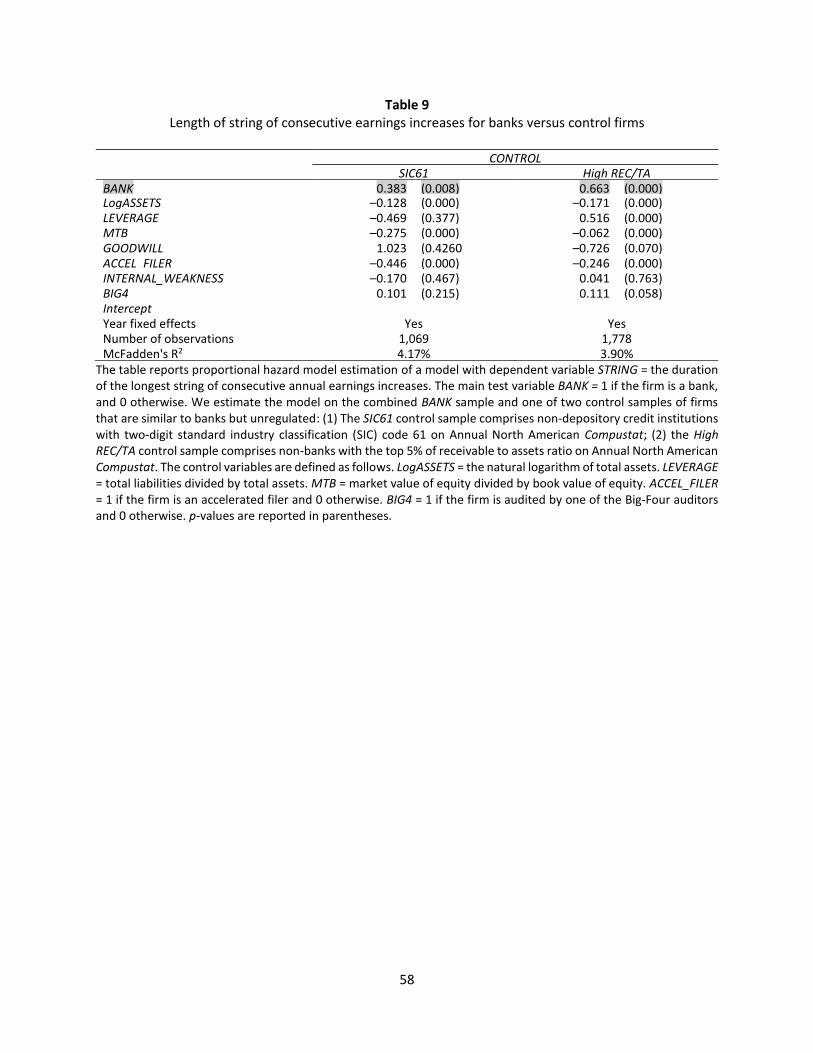