bank of canada banque du canada€¦ · bank of canada banque du canada working paper 2006-35 /...
TRANSCRIPT
Bank of Canada Banque du Canada
Working Paper 2006-35 / Document de travail 2006-35
Survey of Price-Setting Behaviour ofCanadian Companies
by
David Amirault, Carolyn Kwan, and Gordon Wilkinson

ISSN 1192-5434
Printed in Canada on recycled paper

Bank of Canada Working Paper 2006-35
September 2006
Survey of Price-Setting Behaviour ofCanadian Companies
by
David Amirault, Carolyn Kwan, and Gordon Wilkinson
Research DepartmentBank of Canada
Ottawa, Ontario, Canada K1A [email protected]
[email protected]@bankofcanada.ca
The views expressed in this paper are those of the authors.No responsibility for them should be attributed to the Bank of Canada.


iii
Contents
Acknowledgements. . . . . . . . . . . . . . . . . . . . . . . . . . . . . . . . . . . . . . . . . . . . . . . . . . . . . . . . . . . . ivAbstract/Résumé. . . . . . . . . . . . . . . . . . . . . . . . . . . . . . . . . . . . . . . . . . . . . . . . . . . . . . . . . . . . . . . v
1. Introduction . . . . . . . . . . . . . . . . . . . . . . . . . . . . . . . . . . . . . . . . . . . . . . . . . . . . . . . . . . . . . . 1
2. Research Motivation and Methodology. . . . . . . . . . . . . . . . . . . . . . . . . . . . . . . . . . . . . . . . . 1
2.1 The importance of price determination for monetary policy . . . . . . . . . . . . . . . . . . . . 1
2.2 A survey approach to studying price determination . . . . . . . . . . . . . . . . . . . . . . . . . . . 2
2.3 Sample and survey design. . . . . . . . . . . . . . . . . . . . . . . . . . . . . . . . . . . . . . . . . . . . . . . 3
3. Firm-Level Price-Setting Behaviour: Results . . . . . . . . . . . . . . . . . . . . . . . . . . . . . . . . . . . . 9
3.1 Estimating price flexibility in Canada . . . . . . . . . . . . . . . . . . . . . . . . . . . . . . . . . . . . . 9
3.2 Changes in price flexibility over time. . . . . . . . . . . . . . . . . . . . . . . . . . . . . . . . . . . . . 10
3.3 Factors influencing firm-level price flexibility. . . . . . . . . . . . . . . . . . . . . . . . . . . . . . 11
3.4 Factors that lead firms to adjust prices . . . . . . . . . . . . . . . . . . . . . . . . . . . . . . . . . . . . 14
3.5 Exchange rates and prices. . . . . . . . . . . . . . . . . . . . . . . . . . . . . . . . . . . . . . . . . . . . . . 17
4. Evaluating Theories of Price Stickiness: Results. . . . . . . . . . . . . . . . . . . . . . . . . . . . . . . . . 19
4.1 Summary of theories . . . . . . . . . . . . . . . . . . . . . . . . . . . . . . . . . . . . . . . . . . . . . . . . . . 19
4.2 Detailed results by theory . . . . . . . . . . . . . . . . . . . . . . . . . . . . . . . . . . . . . . . . . . . . . . 21
5. Conclusions . . . . . . . . . . . . . . . . . . . . . . . . . . . . . . . . . . . . . . . . . . . . . . . . . . . . . . . . . . . . . 35
5.1 Summary of key results . . . . . . . . . . . . . . . . . . . . . . . . . . . . . . . . . . . . . . . . . . . . . . . 35
5.2 Implications and areas for further research. . . . . . . . . . . . . . . . . . . . . . . . . . . . . . . . . 37
References. . . . . . . . . . . . . . . . . . . . . . . . . . . . . . . . . . . . . . . . . . . . . . . . . . . . . . . . . . . . . . . . . . . 39
Appendix A. . . . . . . . . . . . . . . . . . . . . . . . . . . . . . . . . . . . . . . . . . . . . . . . . . . . . . . . . . . . . . . . . . 41
Appendix B . . . . . . . . . . . . . . . . . . . . . . . . . . . . . . . . . . . . . . . . . . . . . . . . . . . . . . . . . . . . . . . . . . 48

iv
Acknowledgements
Efforts on the price-setting survey have spanned the better part of four years. Along the way,
many people have helped bring the project to fruition. Along with the authors, the task of face-to-
face interviews was shared with several colleagues, including: Hung-Hay Lau, Marie-Claude
Montplaisir, Todd Hirsch, Frédérick Demers, and Mark Illing. Jason Jacques and Chantal
Duspasquier were helpful partners on the project during its early stages, but have since left the
Bank. Excellent research assistance was provided by Jane Pinto, Clare Levin, Daniel de Munnik,
Tara Ainsworth, and Heather Scott-Smith. We also wish to thank Maura Brown and Glen
Keenleyside from Editorial Services for their assistance.
Along the way we received tremendous support for this project from the Bank of Canada’s senior
management. We therefore wish to acknowledge the contributions of the following: Bob Amano,
Brigid Brady, Agathe Côté, Allan Crawford, Pierre Duguay, Paul Fenton, Sharon Kozicki,
Oleksiy Kryvtsov, David Longworth, Tiff Macklem, John Murray, Brian O’Reilly, and
Nick Rowe.
The authors also wish to acknowledge helpful comments from participants at the 2004 Canadian
Economics Association annual meeting at Ryerson University, participants at the 2005 meeting of
the Network of America Central Bank Researchers in Lima, Peru, and our colleagues at several
Bank of Canada seminars.

v
Abstract
In many mainstream macroeconomic models, sticky prices play an important role in explaining
the effects of monetary policy on the economy. Various theories have been set forth to explain
why prices are sticky. This study takes a firm-level survey approach, in a spirit similar to Blinder
et al. (1998), to shed some light on the question of why prices are sticky. In particular, the Bank of
Canada’s regional offices surveyed 170 Canadian firms for their views on price dynamics. The
authors find that the most important motivators of price changes are price changes by competitors,
changes in domestic input costs, and changes in demand. Surprisingly, but consistent with the
results reported in Bils and Klenow (2002), the survey evidence suggests that more than 50 per
cent of firms change their prices more than four times a year. Moreover, the survey indicates that
prices change more frequently than they did ten years ago, because of more intense competition
and advances in information technology.
JEL classification: D40, E30, L11Bank classification: Inflation and prices; Transmission of monetary policy
Résumé
Nombreux sont les modèles macroéconomiques dans lesquels la rigidité des prix sert de clef à
l’interprétation des effets de la politique monétaire sur l’économie. Différentes théories ont été
mises en avant pour expliquer cette rigidité. Les auteurs abordent la question à la manière de
Blinder et coll. (1998), par la voie d’une enquête. Plus précisément, ils se fondent sur l’enquête
que les bureaux régionaux de la Banque du Canada ont menée auprès de 170 entreprises
canadiennes en vue de recueillir leurs points de vue sur la dynamique des prix. Les auteurs
constatent que les modifications de prix sont principalement motivées par celles qu’effectuent les
concurrents, par les variations du coût des intrants intérieurs et par les variations de la demande.
Fait étonnant, mais qui est conforme aux résultats de Bils et Klenow (2002), plus de la moitié des
entreprises rajusteraient leurs prix au moins quatre fois par an d’après les données de l’enquête.
En outre, l’intensification de la concurrence et les progrès des technologies de l’information
auraient amené les firmes à réviser leurs prix plus souvent qu’elles ne le faisaient il y a dix ans.
Classification JEL : D40, E30, L11Classification de la Banque : Inflation et prix; Transmission de la politique monétaire


1
1. Introduction
Setting prices correctly plays a critical role in determining the success of a product or service for
a firm. The process of choosing and setting the ‘right’ price is, however, costly in many ways. The
time and effort spent by senior staff to set prices and the cost of communicating the price changes
to clients are non-trivial. As well, if customers are unhappy with the new price, the firm may incur
negotiation costs, or may lose customers.
Firms’ attempts to minimize these costs by allowing market prices to remain unchanged, even
though market circumstances might dictate price changes, influence how monetary policy affects
the economy. The extent to which prices are unchanged is referred to as price stickiness, rigidity,
inertia, or inflexibility.
This paper examines the main results of a survey of the pricing behaviour of Canadian companies
and is organized as follows. Section 2 describes the motivation for surveying firms and the
methodology used in setting up the questionnaire and conducting the interviews. Section 3
presents results pertaining to the frequency with which firms adjust prices and what motivates
them to do so. Section 4 highlights our evaluation of ten sticky-price theories based on the survey
results. Section 5 provides a summary of the main findings and discusses some potential
implications for monetary policy. Appendix A contains a copy of the questionnaire used to
interview firms. Appendix B reviews how firm characteristics influence the selection of a
particular theory of price stickiness.
2. Research Motivation and Methodology
2.1 The importance of price determination for monetary policy
The way firms set prices is of major importance to the design and implementation of monetary
policy. Whether prices are sticky—that is, whether they respond slowly to changes in the
economic environment—or whether they respond asymmetrically to excess demand and excess
supply are key questions for central banks. The answers have implications for the conduct of
monetary policy, such as the speed with which the monetary authorities attempt to bring inflation
back to the target after a shock. They also shape the process by which changes in monetary policy
are transmitted to real activity and to inflation.
Views on the importance of price stickiness as a central question in macroeconomics have varied
over the years. In the 1960s and 1970s, economists generally accepted the presence of sticky
prices and their ability to generate real-side disturbances in the face of monetary policy shocks. In

2
the latter 1970s and the 1980s, much of the academic research focused on the real side of the
economy. The main economic paradigms at the time, the early rational expectations and real
business cycle models, argued against the presence of sticky prices and therefore against a role for
monetary policy in stimulating growth during periods of slack demand. This probably reflected
the lack of conclusive evidence on the extent and importance of sticky prices.
In contrast, the macroeconomic literature of the 1990s and 2000s has seen a general acceptance of
price stickiness and the important role monetary policy can play in an economy running below
potential. There have been a growing number of studies devoted to assessing the degree of price
stickiness. Many of the earlier studies found considerable rigidity in price setting. For example,
Cecchetti (1986) uses a sample of 38 U.S. magazines to show that even during periods of high
inflation, only 30 per cent of the sample, on average, changed prices within a given year. Carlton
(1986) examines changes in prices of intermediate products used in 11 different manufacturing
groups and calculates average price durations ranging from 6 to 19 months, depending on product
category. Kashyap (1995) analyzes the prices of 12 items in three U.S. mail-order catalogues and
estimates an average price duration of 15 months. However, Bils and Klenow (2002), using
disaggregated Bureau of Labor Statistics price data for the United States, find price adjustment to
be more flexible than in these earlier studies and compute a median price duration of four months.
2.2 A survey approach to studying price determination
An approach that has become increasingly popular in trying to shed light on these issues is to
survey firms directly on how they set prices. The use of surveys to analyze the price-setting
behaviour of firms was pioneered in the United States by Blinder (1991, 1994) and Blinder et al.
(1998). Subsequent price-setting surveys were conducted by researchers at the Bank of England
(Hall, Walsh, and Yates 1997), the Bank of Japan (Nakagawa, Hattori, and Takagawa 2000), and
the Bank of Sweden (Apel, Friberg, and Hallsten 2001); more recently, nine euro area central
banks have conducted price-setting surveys (Italy, Belgium, Germany, France, Spain,
Netherlands, Luxembourg, Portugal, and Austria) (Fabiani et al. 2005). This working paper
reports on the results of the first such survey for Canada.
There are several reasons why surveys of firms’ price-setting behaviour have been growing in
popularity among researchers. Most important is the recognition of the central role played by the
relative stickiness of prices in influencing how changes in monetary policy affect real economic
variables such as output and employment. As well, conventional approaches to investigating price
stickiness, based upon econometric analysis of aggregate time-series data, have not yet been able

3
to resolve many of the outstanding issues.1 Moreover, new theories for sluggish price adjustment
have appeared before older explanations have been satisfactorily rejected (Blinder et al. 1998, 7).
There is also growing recognition that price stickiness can be best understood by examining
pricing behaviours at the micro level, where pricing decisions are actually made. However, until
the release of firm-based survey studies in recent years, the scope of earlier micro-level studies
was too narrow—either focusing on a single firm, a single market, or a limited range of
products—to draw implications for price stickiness in the broader economy.
As indicated earlier, other researchers have already conducted well-diversified, firm-based
surveys of the price-setting process using the interview method pioneered by Blinder. However,
until now such a survey had not yet been done in Canada. Surveying price-setting behaviour at
Canadian firms was expected to be a useful contribution given that differences in the structure of
the Canadian economy, such as its export exposure, industrial mix, and institutional and market
arrangements, might yield results different from those in other countries.
In addition to assessing the relative flexibility of price adjustment in Canada, a firm-based survey
can be used to examine various explanations for slow price adjustment and the prevalence of these
explanations across firms. This information might be important for the conduct of monetary
policy in so far as different explanations of price rigidity may have different effects on the
responsiveness of prices to changing demand conditions. Macroeconomic modelling may also
benefit from more detailed information on firm price-setting behaviour.
2.3 Sample and survey design
The design and implementation of the firm survey for Canada drew upon the results and lessons
learned from previous price-setting studies carried out in other countries. This survey involved
structured interviews of 170 firms across the country. Firms selected for inclusion in the survey
had to meet very specific criteria. The first criterion was to include only private and for-profit
firms, because theories of price stickiness were developed to explain the behaviour of profit-
maximizing firms, not public sector or non-profit firms. The second criterion was that these firms
also had to be unregulated; that is, they had to be able to set their prices autonomously in response
to market conditions, rather than have their prices imposed by some regulatory body or offshore
parent. Finally, the firms’ main activity could not be the sale of primary commodities. Such firms
were excluded because they are typically price-takers and have no influence on commodity prices,
which move freely in response to demand and supply pressures in international markets. Thus, the
1. For a fuller discussion, see Blinder et al. (1998, 8–12).

4
sampled firms represented pricing behaviour in the private, for-profit, unregulated, non-primary
sector of the Canadian economy, which accounted for about 70 per cent of Canada’s output
in 2002.2
To ensure that the sample was representative of this portion of the Canadian economy, the
distribution of firms within the sample by industry sector and employment size was constructed to
match closely the proportions prevailing in the actual economy for these two categories (Table 1).
Industry classifications were based on Statistics Canada’s North American Industry Classification
System (NAICS) codes. The categories used for organizing firms by size were: (i) under
100 employees, (ii) 100 to 499 employees, and (iii) 500 employees and over. Although some
2. This calculation excludes one-half of the output in the real estate sector related to imputed rent.
Table 1: Comparing the Bank of Canada Survey with Three Previous Studies
U.S. study U.K. study Sweden studyBank of Canada
study
About the surveys
Timing April 1990-March1992 Sept. 1995 March-May 2000 July 2002-April
2003
Sample size 200 654 626 170
Representativeby industry? Yes
No, mainlymanufacturing firms(68%)
No, manufacturingand service sectorsonly
Yes
Industrydistribution
Manufacturing 35%Services 27%Construction/Mining 11%Trade/Other 27%
Manufacturing 68%Retailing 13%Construction 6%Other services 13%
Manufacturing 45%Services 55%
Construction 10%Manufacturing 26%Trade 14%All other services49%
Exclusions basedon firm size?
Firms with<$10 million insales excluded
Sample dominatedby large firms
Firms with fewerthan 5 employeesexcluded
Firms with fewerthan 20 employeesexcluded
Firm sizedistribution
$10 to $24.9 million23%$25 to 49.9 million14%$50 million or more64%
< or = 100employees 19%101 to 500employees 39%500+ employees42%
5 to 19 employees25%20 to 199employees 30%200+ employees45%
20 to 99 employees32%100 to 499employees 28%500+ employees40%
All regionssurveyed?
16 states in U.S.Northeast All regions All regions All regions
Random sample? Yes No Yes No, quote sample

5
attempt was made to make the regional distribution of firms in the sample match the regional
shares of Canadian real output, this strategy was of secondary importance given the low
likelihood that price setting for a given industry or firm size would vary across regions. However,
except for some oversampling in Atlantic Canada and some undersampling in Ontario, the
number of firms surveyed corresponded roughly to regional size (Table 2). The sample size was
limited to 170 firms in order to contain surveying costs, but, at the same time, to ensure a
minimum sample size for drawing statistical inferences at more disaggregated levels, such as by
industry or by firm size.
Drawing upon the experience of the Bank of Canada’s regional offices in conducting firm-based
surveys, a non-random form of sampling widely employed in business surveys and known as
“quota sampling”3 was used to generate a representative sample of firms. All surveys were
completed using face-to-face interviews rather than by telephone, mail, fax, or the Internet, in the
belief that survey responses would be more reliable.4 All interviewers were Bank of Canada staff
economists who had training in clarifying concepts, ensuring that all questions were answered,
and identifying and resolving any inconsistencies in responses. Company representatives who
participated in the survey held senior positions, suggesting that they would know how their firm’s
products or services were priced.5 Survey interviews were conducted from July 2002 to
March 2003. However, about two-thirds of the surveys were completed between January and
March 2003, a period when the Canadian dollar appreciated by about 7 per cent, and the rate of
inflation, as measured by the 12-month rate of increase in the consumer price index (CPI), rose to
an average of 4.4 per cent, from less than 3 per cent when surveying commenced in July 2002.6
3. See Martin (2004) for a description of the Bank of Canada’s regional offices’ survey experience. Thenon-random sampling used in the reghonal offices and in the price survey is called “quota sampling”because for a given subgroup in a target universe, a “quota” of respondents is selected which, whenaggregated, is intended to produce a sample that is representative of the target universe. Thus, ininstances where an initial company contact chooses not to participate in the survey, another firm withcomparable industry or firm-size characteristics is selected from commercial business directories toachieve sample targets. See also OECD (2003, 21–23).
4. Blinder et al. (1998) believe that personal interviews conducted by knowledgeable economicprofessionals will improve the quality of survey results. Our experience with missing responses anderrors in questionnaires sent in by fax suggests that Blinder et al.’s preference for personal interviewsis well founded.
5. The percentage distribution of company contacts is as follows: president, CEO, or owner, 22 per cent;vice-president, vice-president of finance, or CFO, 41 per cent; manager or director, 22 per cent;controller, 9 per cent.
6. The rise in total CPI inflation resulted mainly from energy and auto insurance price increases.Excluding these components, the year-over-year increase in consumer prices averaged 2.3 per centfrom January to March 2003.

6
The price-setting survey was based upon a structured questionnaire rather than a free-form
interview to allow for standard statistical analysis (see Appendix A for a copy of the survey). The
number, type, and phrasing of the questions as well as the layout of the survey were finalized in
consultation with Bank of Canada senior management and Research Department staff.
Consideration was given to striking a reasonable balance between gathering pertinent information
and not overburdening the respondents. Given that most firms sell a variety of products, firms
were requested to respond to the survey questions with reference to their main product. If product
offerings were too dispersed to easily identify one main product (e.g., department store),
respondents were asked to answer the questions with reference to some broad product category
where items are priced similarly (e.g., electronic equipment).
Table 2: Representativeness of the Survey Sample
Industry sectora
a. “Target” is the percentage of real GDP in the private, non-regulated, non-primary sector excluding one-half ofthe real estate sector for imputed rent. It constituted 68 per cent of total real GDP in 2002. “Actual” is thepercentage of firms in the price-survey sample.
Firm sizeb
b. “Target” is the percentage of employment in a particular firm-size category in 2002 as estimated by StatisticsCanada’s Survey of Employment, Payroll and Hours. “Actual” is the percentage of the number of firms in theprice-survey sample.
Regionc
c. “Target” is the percentage of real GDP in 2002. “Actual” is the percentage of the number of firms in the price-survey sample.
Target Actual Target Actual Target Actual
Construction 10 10
Manufacturing 25 26
Wholesale and retail trade 17 14
Transportation, information & culturalindustries 11 13
Financial services 19 16
Business and personalservices 18 20
Small 29 32
Medium 23 28
Large 48 40
Atlantic Canada 6 13
Quebec 21 22
Ontario 42 31
Prairies 18 18
British Columbia 12 16

7
The survey questionnaire consisted of three sections. The first section contained questions on firm
characteristics such as cost structure, industry, sales distribution by customer type and region,
share of sales under contract, customer concentration, and the number of direct competitors.
These questions were added to allow for a more detailed analysis of why price-setting behaviour
varies across firms. A comparison of key firm characteristics by industry is presented in Table 3.
These characteristics provide a useful profile of each industry sector and its unique features. For
example, our survey reveals that 95 per cent of construction firms surveyed depend on activity
generated in their home region, whereas manufacturing firms were most likely to be export-
oriented. Furthermore, the cost structure of construction firms tends to be skewed towards variable
costs (material and labour costs being the bulk of total costs).
Table 3: Selected Firm Characteristics by Industry Sector
Feature Total Cons. Mfg. TradeInfo &transa
a. Information and cultural industries, and transportation and warehousing
FIREb
b. Finance, insurance, and real estate
Servicesc
c. Business and personal services, food and accommodation services
Number of observations 170 17 45 25 22 27 34
Variable cost as portion of total cost 63% 79% 67% 76% 50% 50% 61%
Sales to home region (% of total sales)d
d. The difference between sales to the home region and exports is domestic sales outside their home region.
60% 95% 32% 68% 68% 73% 57%
Sales exported (% of total sales)d 19% 3% 45% 6% 10% 4% 21%
Sales to businesses (% of total sales) 60% 49% 74% 44% 80% 54% 51%
Sales under contract (% of total sales) 52% 78% 51% 20% 60% 77% 39%
Five largest buyers amount tomore than 50% of sales (% of firmssurveyed)
24% 41% 44% 8% 9% 19% 12%
Five largest buyers amount toless than 10% of sales (% of firmssurveyed)
46% 47% 16% 64% 41% 63% 62%
Firms indicating they are the priceleader(% of firms surveyed)
28% 24% 33% 28% 41% 15% 24%
Median number of competitors 6.5 20 5 8 6 7 10
8
In aggregate, 60 per cent of the ‘average’ firm’s sales were generated by sales to businesses.
Wholesalers and retailers had the lowest portion of sales generated from businesses at 44 per cent.
The nature of transactions for these wholesalers and retailers is also such that they have some
amount of their sales under contract and a low level of buyer concentration—the five most
important buyers account for less than 10 per cent of total sales. Similarly, low levels of buyer
concentration are also apparent in other service industries. Goods-producing industries, on the
other hand, have much higher rates of buyer concentration. Twenty-eight per cent of firms
identified themselves as price leaders in their industry and the median number of competitors for
our sample of firms was 6.5 competitors per firm. These firm characteristics are discussed further
later in the paper. In particular, section 3.3 discusses their implications for price-setting behaviour
and section 4.2 and Appendix B illustrate their roles in firms’ recognition rates for individual
theories of price stickiness.
The second section of the questionnaire included questions designed to improve the
understanding of the price-setting process. To examine the degree of price flexibility, companies
were asked questions on the frequency of price reviews and price changes. To better understand
the motivation behind a firm’s decision to alter prices, the survey probed the reasons why a
company would change prices. Given the strong export orientation of the Canadian economy,
movements in the Canadian-dollar exchange rate represent another potentially important
influence on prices. With the value of the Canadian dollar vis-à-vis the U.S. dollar declining
steadily and significantly for many years prior to and during the design and planning stages of the
survey, a series of questions on the effects of the exchange rate depreciation on profit margins and
price adjustment were incorporated into the second section.
The third section asked questions about the relevance of various theories or explanations for price
stickiness. The main part of this section asked companies to evaluate the importance of six
theories of price rigidity. These theories had been considered important in other price-survey
studies or in other empirical or theoretical research. Each theory was presented using a one-line
statement capturing its essential features in non-technical language. The respondent could grade
the relevance of each theory to price adjustments at their firm using a four-point scale: (i) not
applicable, (ii) yes, slightly important, (iii) yes, fairly important and (iv) yes, very important. If
the respondent recognized the theory as an explanation for slow price adjustment at their firm,
follow-up questions were asked on issues specific to that theory before moving on to the next
theory.

9
This section also included a single question on the relevance of five other explanations for delayed
price adjustment, but this was not followed by any supplementary questions, given the smaller
role played by these explanations in the economic literature. At the end of the survey, firms were
asked whether their responses applied to a broad range of their other products or services, and this
was generally found to be the case.7
3. Firm-Level Price-Setting Behaviour: Results
3.1 Estimating price flexibility in Canada
In order to generate estimates of price-setting frequencies,8 firms were asked: “In the last
12 months how many times have you actually adjusted prices?” The distribution of answers to this
question is surprisingly wide. The most commonly cited answer, held by 27 per cent of the
sample, was that prices are adjusted once a year and often at the same time every year. Another
8 per cent cited no price changes at all in the past year (see Figure 1). Taking these two results
together, prices for about one-third of the measured Canadian economy are quite sticky. For these
firms, the costs of changing prices are burdensome relative to the benefit.
Figure 1: In the last 12 months how many times have you actually adjusted prices?
7. More than three-quarters of the firms surveyed indicated that the responses were applicable to otherproducts or services, or that the question was irrelevant because they offered only one product orservice.
8. It should be noted that the number of price adjustments alone does not indicate price rigidity.Infrequent price adjustment at some firms may simply reflect stability in demand and cost conditionsover the 12-month period covered by the question.
5
10
15
20
25
30
8%
27%
8%
15% 15%
11%12%
6%
0 1 2 >2 to >4 to12 4
>12 to52
>52 to365
>365
%
10
For 38 per cent of the sample, prices change 2 to 12 times per year. At the other end of the
distribution, 29 per cent reported adjusting prices more than 12 times in the past year. At the
extreme end, 6 per cent reported changing prices more than 365 times in the past year. This
suggests that the classical paradigm of continuously market-clearing auction markets (continuous
costless repricing) applies to only a very small portion of Canadian product markets. This high
price flexibility is largely the result of many of these firms changing prices on a customer-by-
customer basis.
Our estimates show that one-half of firms in Canada change their prices at least once every three
months, which is equivalent to a price change of four or more times a year. This result suggests
that prices in Canada are reasonably flexible, particularly when compared with the results of
similar studies conducted recently in other countries. Survey results on price flexibility are,
however, consistent with the findings reported in Bils and Klenow (2002).
3.2 Changes in price flexibility over time
The Canadian economy has undergone considerable change over the past decade and a half. In
addition to lower, more stable, and predictable inflation, which, on the surface, may have reduced
the need for frequent price changes, firms have faced a steady stream of technological innovation,
new trade arrangements, improvements in public sector finances, and other developments that
may have altered their price-setting behaviour. To better understand the impact of these
influences, firms were asked “To the best of your knowledge, has the frequency of price
adjustments changed in the past decade?” The evidence suggests that prices in Canada have
become more flexible over the past decade. While slightly more than half of the sample had not
changed the frequency with which they adjust prices over the past decade, 45 per cent had
adjusted their price-setting frequency. Three-quarters of firms in this latter group now change
prices more often compared with a decade ago.
Firms with increased price flexibility were queried about why they had adjusted their pricing
behaviour. Three factors were noted (in order of importance): increased competition, increased
use of information technology, and increased volatility of input costs.
As many firms explained, more competition means their price in the market is wrong or ‘offside’
more often, and the costs of being ‘offside’ increase dramatically as competition increases.
Information technology acts as a tool to facilitate price reviews and adjustments in that it
enhances the information flow, thereby reducing costs and lags associated with the price-setting
process. The third factor, increased volatility in input costs, was related to raw material, foreign
exchange, and energy costs.

11
3.3 Factors influencing firm-level price flexibility
From once every few years to several times a day, firms that participated in our survey report an
astonishingly wide range of behaviour when queried about their price-adjustment frequencies.
How can something as basic to every firm’s operations—the price at which it sells its wares—vary
so much? Our analysis suggests that several firm characteristics and circumstances explain much
of the variation in behaviour. Several firm characteristics were found to be statistically significant
factors influencing the firm-level price-setting behaviour (see Table 4).
To the extent that characteristics, such as sectoral and firm-size breakdown, are found to be
significant, they highlight the importance of having a representative sample when drawing
conclusions about economy-wide behaviour. Beyond this, understanding the factors that drive
firms’ price-setting behaviour educates future theoretical discussions. If nothing else, this type of
analysis allows us to test our prior knowledge about price-setting behaviour.
Results presented in section 3.1 suggest a median number of four price changes per year overall
for the portion of the Canadian economy in the survey. However, this estimate is sensitive to the
firm’s specific situation.
On a sectoral basis, for example, price changes are most infrequent in the community, business,
and personal services sector, where they are generally reviewed and set annually. Many of these
service firms described the annual price change as synchronized to the annual wage settlement
with staff.9 Firms in retail and wholesale trade are at the other end of the distribution, with a
median of seven price changes per year. Other sectors are clustered near the centre, with three to
five price changes per year. These results are similar to those found in Hall, Walsh, and Yates
(1997). They show that services have the least flexible prices, and retail and construction the most
flexible prices.
Variation can also be seen on the basis of a firm’s size (as measured by the number of employees).
Large firms change prices about twice as often as medium firms, and five times more frequently
than small firms. Buckle and Carlson (2000) also find that small firms change prices less
frequently. Many respondents explained that senior staff at small firms have numerous tasks in
addition to reviewing and adjusting prices. The administrative and management costs associated
with the price-setting process are therefore particularly onerous for small firms.
9. These firms conform to standard staggered contract models such as those proposed by Taylor (1979,1980).

12
A firm’s market circumstances play a role in determining its price-setting behaviour. For example,
firms with fewer competitors tend to be better able to resist more frequent price changes. As
previously mentioned, firms themselves reported increased competition as a major source of
increased price flexibility.
Firms with a significant export sales base10 have a higher number of median price changes. This
suggests that exposure to international customers will tend to make firm-level pricing more
flexible. Firms focused on sales in their home region have fewer price changes. This may help to
explain why the Canadian economy, an economy very much open to trade, has flexible prices.
Firms generally review prices in one of two ways: time-dependent, using a fixed frequency
(e.g., quarterly, weekly, annually), or state-dependent, when they perceive a change in the ‘state’
of the market. The majority (about two-thirds) of firms surveyed exhibit time-dependent price-
reviewing behaviour. This figure conforms well to previous estimates: results presented in Blinder
et al. (1998) suggest 60 per cent for the U.S. economy; Hall, Walsh, and Yates (1997) suggest
79 per cent for the U.K. economy; and Apel, Friberg, and Hallsten (2001) suggest 59 per cent for
Sweden.
10. Firms were asked to respond to the question in the currency of their main business activity. Thisimplies that daily exchange rate fluctuations were not considered a source of price flexibility.

13
Firms with time-dependent price reviews have far stickier prices than do state-dependent price
reviewers. This supports the view that firms with costly adjustments set prices with a fixed
frequency to minimize these largely lump-sum costs—this creates rigidities. Many firms reporting
state-dependent price reviews price discriminate between customers. For them, the benefits of
frequent price changes outweigh the costs.
Table 4: Characteristics that Influence Variations in the Frequency ofa Firm’s Price Adjustment
Factors leading to variationsin price-adjustment frequencies a
a. A Kruskal-Wallis rank sum test of the equality of populations was conducted. For more information about theKruskal-Wallis rank sum test, see Kvanli, Guynes, and Pavur (1992).
* indicates the rejection of the null hypothesis at the 99 per cent confidence levels. ** indicates 90 per centconfidence level. *** indicates 80 per cent confidence level.
Number ofrespondents
(n)
Mediannumber of
priceadjustments
% of firms reporting:
= < 1 pricechange per
year
> 52 pricechanges per
year
Total sample 170 4 34 18
Sectors (using NAICS codes) **
Construction 18 5 22 6
Manufacturing 44 4 36 16
Retail and wholesale trade 25 7 4 28
Information, cultural industries, & transportation 22 3 45 27
Finance, insurance, & real estate 27 4 30 15
Community, business and personal services 34 1 50 15
Firm size (using no. of employees) *
Small (less than 101) 54 2 39 9
Medium (101 to 499) 48 4 42 15
Large (more than 499) 68 10 25 26
Geographic distribution of sales ***
Export sales less than 50% of total sales 137 3 36 16
Export sales at or more than 50% of total sales 33 9 27 24
Number of competitors ***
0 to 5 68 2 49 16
6 to 10 48 5 23 19
11 to 24 23 4 26 26
25+ 31 4 26 13
Price review type *
State-dependent 57 10 12 30
Time-dependent 113 2 44 12

14
3.4 Factors that lead firms to adjust prices
Firms were queried about the types of shocks that most often led to price adjustments—that
motivate a firm to adjust prices. Firms were asked to think about the importance of ten types of
demand and supply shocks as factors leading to price adjustments. A similar exercise was
undertaken by Apel, Friberg, and Hallsten (2001) in their survey of Swedish firms. Table 5
illustrates that competitive forces dwarfed other factors—price changes by competitors stood out
as the most important factor leading to a price adjustment. Changes in non-labour domestic input
costs and changes in demand for the product/service also ranked well and were statistically
indistinguishable. These rankings match results in Apel, Friberg, and Hallsten (2001) almost
perfectly.
Table 5: Rankings and Mean Score of Reasons for Price Adjustments
(1)Triggers / Causes a
a. Firms were also asked about directives from parent companies. The response scored last in all industries and wasinsignificant, so is excluded from this table.
Totalsample
Cons. Mfg.
Whole-sale
retailtrade
Info &transc FIREd Servicese
Meanscoreb
b. The mean score in column 2 is the weighted average of the firms’ responses to the importance of each trigger, where 4 is“very important” and 1 is “not important.” The numbers in columns 3 to 8 are rankings of the importance of each trigger for agiven industry. The asterisk indicates that a given mean score in column 2 is statistically different at the 5 per cent level ofsignificance from the mean score below it.
c. Information and cultural industries, and transportation and warehousingd. Finance, insurance, and real estatee. Business and personal services, food and accommodation services
Rankings based on mean score
Price changes by competitors 3.16* 1 4 1 1 2 1 1
Change in domestic inputs costs(non-labour) 2.90 2 1 2 2 5 3 5
Change in demand for product/service 2.89* 3 2 3 3 1 2 3
Change in wage costs 2.53* 4 3 5 7 3 6 2
We routinely change prices 2.18 5 7 7 4 4 8 4
Change in taxes, fees, and othercharges 2.09 6 6 6 8 8 5 6
Change in economic/inflationforecast 2.01 7 5 9 9 6 4 7
Change in exchange rates 1.87 8 9 4 5 9 9 8
Sales campaigns 1.84 9 8 8 6 7 7 9

15
Where results do diverge from Apel, Friberg, and Hallsten (2001) concerns the importance of
wage costs. Our study ranks wage costs relatively high, fourth of ten factors, whereas the study of
Swedish firms ranks it much lower. Factors ranked fifth to ninth are clustered together.
Differences between all five are statistically insignificant. Price-setting influences from parent
companies scored poorly as a price-adjustment motivator. This is a comforting result, since the
survey was explicitly designed to exclude firms that do not control the price-setting function for
their main product or service.
As expected, some factors are more or less compelling in different industries. Price changes by
competitors consistently ranked highest in all but two sectors. One of those, construction,11
ranked domestic input costs highest. Overall, input costs ranked high in goods-producing
industries and lower in services. Changes in demand for the product or service ranked well in
services and construction. Wages were most important in community, business, and personal
services. Economic and inflation forecasts were generally less relevant to most industries, with the
noted exceptions of the finance, insurance, and real estate sector, and construction. Exchange rates
were ranked eighth overall and were most relevant to manufacturers, wholesalers, and retailers.
Table 6 illustrates the extent to which these ‘factors’ that motivate firms to adjust prices are related
to the degree of flexibility in prices. For example, firms that identified ‘we routinely change
prices’ (time-dependent price setters) and ‘wage costs’ as very important factors leading to price
changes had stickier prices. The basic message is that firms that place some importance on having
routine-price adjustment frequencies, and that said that wage costs are important, set prices less
often. Contrastingly, firms for which ‘price changes by competitors’ and ‘changes in exchange
rates’ were very important triggers had significantly more flexibility in prices.
11. Recall the high variable cost structure of the construction sector in Table 3.

16
Table 6: Frequency of Price Adjustments, Influence of Motivators
Potential factors leading to variationsin price-adjustment frequencies
n=No. of priceadjustments
median
Total sample 170 4
Sample excluding firms citing ‘event’-specific pricechanges 134 2
Sample including only time-dependent pricing 113 2
Price-adjustment motivators (factors that lead to price changes)
We routinely change prices (very important factor) 43 2
We routinely change prices (otherwise) 127 4
Changes in wage costs (very important factor) 46 2
Changes in wage costs (otherwise) 124 4
Changes in other domestic input costs (very importantfactor) 75 4
Changes in other domestic input costs (otherwise) 95 3
Changes in taxes, fees, and other charges (very importantfactor) 20 3.5
Changes in taxes, fees, and other charges (otherwise) 150 4
Price changes by a competitor (very important factor) 83 6
Price changes by a competitor (otherwise) 87 2
Changes in exchange rates (very important factor) 29 7
Changes in exchange rates (otherwise) 141 3
Changes in demand for product/service (very importantfactor) 59 4
Changes in demand for product/service (otherwise) 111 3
Changes in economic/inflation forecasts (very importantfactor) 10 4
Changes in economic/inflation forecasts (otherwise) 160 4
Sales campaigns (very important factor) 19 12
Sales campaigns (otherwise) 151 3
Directives from parent company (very important factor) 5 1
Directives from parent company (otherwise) 165 4

17
3.5 Exchange rates and prices
From the mid-1990s to 2002, the Canadian dollar depreciated by about 30 per cent vis-à-vis the
U.S. dollar.12 Economic principles and models based upon historical relationships predict that a
depreciation of this magnitude and the resulting rise in the cost of imported goods would have had
a significant impact on consumer prices. The fact that it did not puzzled many researchers. In light
of this development, firms participating in the price-setting survey were asked about the
relationship between the exchange rate and their output prices over this period. This section
highlights some key results.
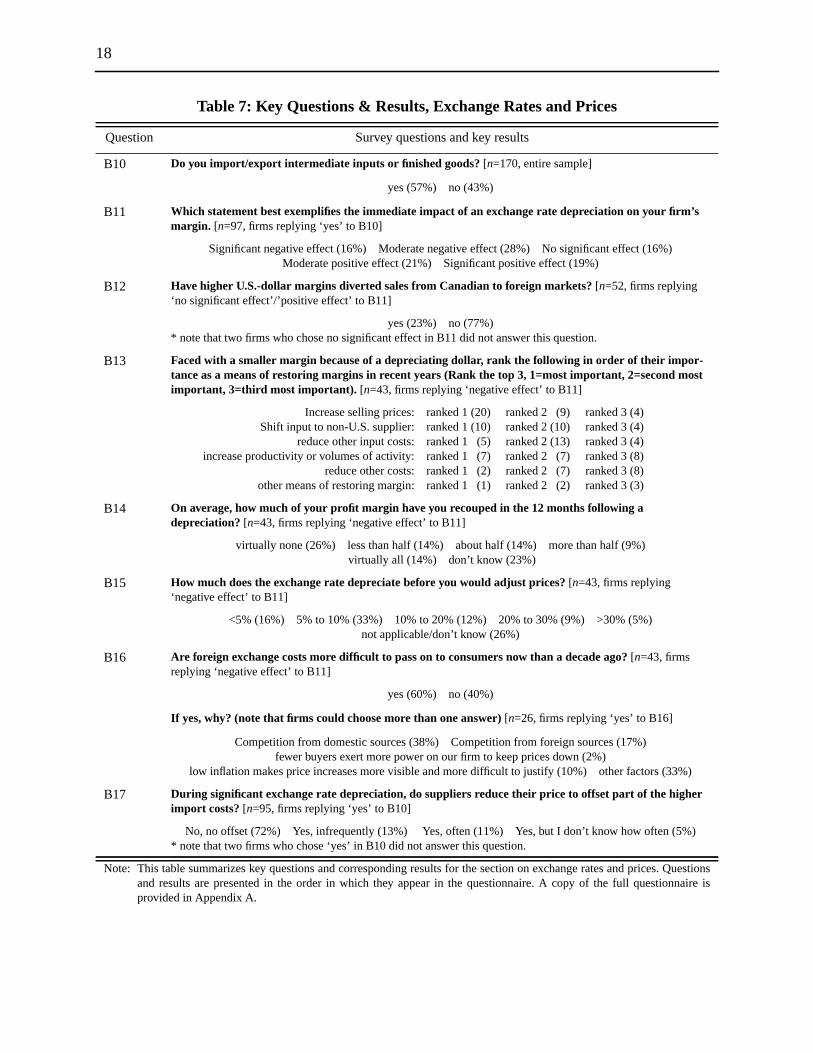
Ninety-seven firms, representing 57 per cent of the sample, exported or imported intermediate or
final goods (Table 7, Question B10). The firms most exposed to tradable goods were
manufacturers (89 per cent) and firms operating in wholesale and retail trade (76 per cent). The
finance, insurance, and real estate sector had the lowest share of such firms (11 per cent).13
Of these 97 firms with exposure to tradable goods, about 44 per cent indicated that they were
negatively affected by the depreciating currency, 39 per cent were positively affected, and 17 per
cent indicated no substantive effect on operations. Not surprisingly, manufacturers, having the
largest percentage of export sales (45 per cent on average), were the most likely to acknowledge
some benefit from the depreciation. Firms most adversely affected by the depreciation of the
Canadian dollar were net importers involved in construction, wholesale and retail trade,
transportation, and communications. Many of the follow-up questions focused on this group.
In order to better understand the limited pass-through of the exchange rate into prices, firms
adversely affected by the depreciation of the Canadian dollar were asked how they mitigated the
effect of higher import costs on their profit margins (Table 7, Question B13). Increasing selling
prices was the most important way of restoring margins for 47 per cent of affected firms.14
Another 23 per cent of firms cited shifting to non-U.S. sources of supply as their primary means
of offsetting the effects of rising import costs. For the remaining firms, the top-rated means of
adjustment were either increasing productivity or volumes of activity (14 per cent) or reducing
other input costs (12 per cent). Taken at face value, these findings seem at odds with the
12. The Canadian dollar began to appreciate during the final three months of the survey period, when two-thirds of the firms were being interviewed.
13. More recently, the regional offices of the Bank of Canada have reported on Canadian firms’ adjustmentto the appreciation of the Canadian dollar. Results from both surveys are consistent: exposure to theexchange rate is highest in export-intensive sectors (natural resources and manufacturing) and import-intensive sectors (wholesale and retail trade). For more information, see Bank of Canada (2005).
14. Beyond the 47 per cent of firms citing increased selling prices as the most important measure taken torestore margins, an additional 30 per cent cited increased selling prices as a secondary or tertiarymeasure. In total, 76 per cent of firms reported increasing selling prices.
18
Table 7: Key Questions & Results, Exchange Rates and Prices
Question Survey questions and key results
B10 Do you import/export intermediate inputs or finished goods? [n=170, entire sample]
yes (57%) no (43%)
B11 Which statement best exemplifies the immediate impact of an exchange rate depreciation on your firm’smargin. [n=97, firms replying ‘yes’ to B10]
Significant negative effect (16%) Moderate negative effect (28%) No significant effect (16%)Moderate positive effect (21%) Significant positive effect (19%)
B12 Have higher U.S.-dollar margins diverted sales from Canadian to foreign markets? [n=52, firms replying‘no significant effect’/’positive effect’ to B11]
yes (23%) no (77%)* note that two firms who chose no significant effect in B11 did not answer this question.
B13 Faced with a smaller margin because of a depreciating dollar, rank the following in order of their impor-tance as a means of restoring margins in recent years (Rank the top 3, 1=most important, 2=second mostimportant, 3=third most important). [n=43, firms replying ‘negative effect’ to B11]
Increase selling prices: ranked 1 (20) ranked 2 (9) ranked 3 (4)Shift input to non-U.S. supplier: ranked 1 (10) ranked 2 (10) ranked 3 (4)
reduce other input costs: ranked 1 (5) ranked 2 (13) ranked 3 (4)increase productivity or volumes of activity: ranked 1 (7) ranked 2 (7) ranked 3 (8)
reduce other costs: ranked 1 (2) ranked 2 (7) ranked 3 (8)other means of restoring margin: ranked 1 (1) ranked 2 (2) ranked 3 (3)
B14 On average, how much of your profit margin have you recouped in the 12 months following adepreciation? [n=43, firms replying ‘negative effect’ to B11]
virtually none (26%) less than half (14%) about half (14%) more than half (9%) virtually all (14%) don’t know (23%)
B15 How much does the exchange rate depreciate before you would adjust prices? [n=43, firms replying‘negative effect’ to B11]
<5% (16%) 5% to 10% (33%) 10% to 20% (12%) 20% to 30% (9%) >30% (5%)not applicable/don’t know (26%)
B16 Are foreign exchange costs more difficult to pass on to consumers now than a decade ago? [n=43, firmsreplying ‘negative effect’ to B11]
yes (60%) no (40%)
If yes, why? (note that firms could choose more than one answer) [n=26, firms replying ‘yes’ to B16]
Competition from domestic sources (38%) Competition from foreign sources (17%)fewer buyers exert more power on our firm to keep prices down (2%)
low inflation makes price increases more visible and more difficult to justify (10%) other factors (33%)
B17 During significant exchange rate depreciation, do suppliers reduce their price to offset part of the higherimport costs? [n=95, firms replying ‘yes’ to B10]
No, no offset (72%) Yes, infrequently (13%) Yes, often (11%) Yes, but I don’t know how often (5%)* note that two firms who chose ‘yes’ in B10 did not answer this question.
Note: This table summarizes key questions and corresponding results for the section on exchange rates and prices. Questionsand results are presented in the order in which they appear in the questionnaire. A copy of the full questionnaire isprovided in Appendix A.
19
macroeconomic evidence of limited pass-through into prices. While raising selling prices was the
key response reported by firms facing weaker margins, it seems this and other measures were only
partially successful at restoring margins. Results from the survey help unravel this puzzle (Table
7, Question B14). Twelve months following a reduction in profit margins owing to a depreciation,
about 70 per cent of firms indicated they recouped only about half or less of their initial profit
margin.15 Complete or near complete margin recovery was reported by only 18 per cent of firms.
Only 22 per cent of firms considered an exchange rate depreciation of less than 5 per cent as a
motivation for adjusting prices upwards.16 Another 44 per cent of firms indicated that the
depreciation would have to be at least 5 to 10 per cent for them to initiate a price change. The
remaining one-third of firms indicated threshold levels above 10 per cent. Survey responses
suggest that it would not be until the depreciation was as large as 10 per cent that as many as two-
thirds of firms would begin adjusting their selling prices in response to the depreciation.17
Finally, the survey explored whether firms believed passing through higher import costs had
become more difficult over the past decade. More than 60 per cent of the firms negatively affected
by the depreciation acknowledged more difficulties in shifting higher import costs to customers.
Nearly two-thirds of these firms attributed the difficulty to either competition from domestic
sources, competition from foreign sources, or both. A significant portion cited ‘other’ reasons.
Among these, increased price sensitivity by customers was the key factor reported. Inertia in
prices, and the factors that lead firms to delay price changes, are the topics of the next section of
this paper.
4. Evaluating Theories of Price Stickiness: Results
4.1 Summary of theories
In addition to gaining a better understanding of price-setting behaviour, our survey also assessed
ten theories of price inertia. These theories were proposed to firms as a series of short plain-
language statements and are contained in Table 8 along with the percentage of firms that
recognized the theory as a source of price rigidity.
15. The percentage calculation excludes 10 of the 43 firms facing negative effects from exchange ratedepreciation who cited that they did not know how much of their profit margin was recouped.
16. Eleven firms did not answer this question and so are excluded from the percentage calculation.17. Unfortunately, the question was not asked in terms of in what time frame the specified amount of
depreciation would have to occur before a price response was initiated.

20
Each theory attributes sticky-price behaviour to specific causes. For example, sticky information
describes firms as making the best decision with the available information at the time. However,
that information is subject to lags and available infrequently. Other theories give institutional
arrangements such as contracts, both those that are written and unwritten, an important role in
creating price rigidities. These agreements between parties, whether they be explicit or implicit,
often fix prices as a means of protecting one or both parties, but also reduce the opportunities to
adjust prices. Cost-based pricing suggests that prices of final goods adjust to costs with a lag.
This lag depends upon how quickly individual firms revise prices in response to changes in costs,
and on the length of the multi-stage production process for a final good. Given the firm-specific
focus of the survey, questions on costs centred on the firm-level responses to costs, not the chain-
of-production process among firms. Coordination failure attributes price stickiness to the fact
that firms would rather hold back on a price change and wait for other firms to go first. If all firms
behave this way, a price change may not go ahead for some time.
Menu and customer-relations costs suggest there are fixed costs associated with adjusting prices
and that these costs force firms to reduce the number of adjustments they undertake. Non-price
competition proposes that firms sometimes change the characteristics of their product or service
instead of changing prices. It may also be that low inflation makes it difficult for firms to adjust
prices because price changes are immediately viewed as real price changes as opposed to nominal
price changes. Finally, we included a category based on results from pre-testing which suggests
that factors influencing prices do not change often enough to warrant changing prices more
often. The remainder of this section discusses key findings related to each theory.
The results indicate that cost-based pricing, customer relations, non-price competition, and
explicit contracts were the theories most recognized by respondents. Sticky information and menu
costs were the least recognized (Table 8). It should also be noted that theory recognition by firms
is not mutually exclusive. For example, firms might indicate that they hold back on a price
increase (i.e., coordination failure) because they fear antagonizing customers (i.e., customer
relations).

21
4.2 Detailed results by theory18
4.2.1 Cost-based pricing
The idea that prices are largely a function of input costs is, perhaps, one of the simplest theories of
price determination. In and of itself, however, this hardly qualifies as a theory of price stickiness,
since the lags between cost shocks and price hikes are possibly very short. However, Gordon
(1981) and Blanchard (1983) show that even short lags, once multiplied by the sometimes
Table 8: Percentage of Firms that Recognized Each Theory as a Reason forInfrequent Price Changes
Theories Description given to respondentsPercentagerecognition
Cost-based pricingPrices depend mainly on the costs of labour and raw materials used inproducing goods and services. Therefore, prices don’t change until costschange.
67.1
Customer relations Prices could not change more often without disturbing customer rela-tions. 55.3
Explicit contractsFirms would like to adjust prices more often to reflect market conditions,but fixed-price contracts make it difficult to pass on price increases whena contract is active.
45.3
Non-pricecompetition
Firms are more likely to amend product characteristics (e.g., warranty,delivery lag) than prices. 44.1
Coordination failure- rising prices
Firms delay price increases because they do not want to be the first in theindustry to raise prices. 41.2
Low inflation Low inflation makes large price changes more noticeable. 33.5
Implicit contracts Firms delay price increases because they have an implied understandingwith customers that they will not raise prices in tight markets. 31.8
Coordination failure- falling prices
Firms delay price cuts because they do not want to be the first in theindustry to cut prices. 31.2
Factor stability Factors influencing prices do not change often enough to warrantchanges. 31.2
Menu costs It would be too costly to change prices more often (time, effort, out-of-pocket costs). 21.2
Sticky informationThe information used to review (and ultimately change) prices is availa-ble infrequently. Therefore, prices may be slow to adjust to new condi-tions.
13.5
18. Where follow-up questions related to specific theories were asked, this section provides a shortsummary table and discusses results. This section also draws on data presented in Appendix B, whichreviews how firm characteristics are related to the selection of a particular theory of price stickiness.

22
numerous steps in the chain of production, can lead to considerable inertia at the aggregate price
level. To the extent that firms wait until actual costs change to increase prices (i.e., firms do not
raise prices in anticipation of a cost increase), this theory provides a simple and compelling
argument for price stickiness.
Among the ten theories tested, cost-based pricing is the most widely recognized theory proposed
to our sample of Canadian firms—two of every three firms recognized this concept (Table 9,
Question C8). Of these firms, about half believed it was a “very important” factor. Blinder et al.
(1998) also find a strong acceptance for cost-based pricing—the concept ranks second overall on
acceptance (percentage of firms recognizing the theory) and on mean score (importance as a
source of price rigidity).
To better gauge firms’ behaviour when faced with a cost shock, firms responding positively to the
cost-based pricing theory were asked how they react when they foresee a future cost increase
(Table 9, Question C10). About 40 per cent of firms said they do indeed raise prices in
Table 9: Key Questions & Results, Cost-Based Pricing
Question Survey questions and key results
A7 Approximately what percentage of main product costs are variable. [n=170, entire sample]
0 to 20% (11%) 21 to 40% (11%) 41 to 60% (20%) 61 to 80% (33%) 81% to 100% (25%)
C8 “Prices depend mainly on the costs of labour and raw materials used in producing goods andservices. Therefore, prices don’t change until costs change.” Does the statement apply to yourfirm? [n=170, entire sample]
No (33%) Yes, slightly important (14%) Yes, fairly important (19%) Yes, very important (34%)
C9 Are temporary cost increases more difficult to pass into prices than increases viewed as perma-nent? [n=114, firms replying ‘yes’ to C8]
yes (63%) no (37%)
C10 If you foresee an increase in your future costs (such as raw materials), do you (Choose any of thefollowing): [n=114, firms replying ‘yes’ to C8]
buy in advance and store (38%) hedge against cost increases (27%)raise own prices in anticipation (40%) take no action (33%)
C11 If you take no action, why? (Choose all applicable) [n=37, firms replying ‘take no action’ to C10]
it would antagonize our customers (32%) we are not confident in our forecasts or estimates (3%)we are reluctant to take the lead in raising prices (11%)we can easily raise prices when actually required (54%)
Note: This table summarizes key questions and corresponding results for a specific theory. Questions and resultsare presented in the order in which they appear in the questionnaire. A copy of the full questionnaire isprovided in Appendix A.
23
anticipation of higher future costs. The remainder do not raise prices in anticipation of a cost
shock and may introduce a lag between costs and price changes. Thirty-three per cent take no
action whatsoever, 38 per cent report buying in advance and storing inventory, and 27 per cent
report hedging against cost increases. These latter two measures are more typical in goods-
producing sectors, such as construction and manufacturing, which can more effectively hedge or
store their inputs. Recognition of the cost-based pricing theory itself is generally insensitive to
industry differences.19
Several other firm characteristics and circumstances are associated with cost-based pricing
behaviour. Specifically, firms with fewer competitors and fewer buyers have significantly higher
acceptance rates for cost-based pricing than firms with many competitors and many buyers
(see Tables B.2 and B.3 in Appendix B).20 This finding may reflect specialized markets that are
approaching natural monopolies. Since both parties (buyers and sellers) need each other, cost-
based pricing is the best way to set prices fairly. This is further supported by the finding that firms
selling to business, government, and institutional buyers have significantly higher acceptance
rates for cost-based pricing than those firms selling predominantly to households (Table B.4).
Firms with a high variable cost structure also have significantly higher acceptance rates than firms
with a fixed cost structure (see Table B.5). This is not surprising, since firms with a higher
proportion of variable costs are more exposed to cost shocks and therefore need to move prices in
response.
4.2.2 Explicit contracts
Explicit contracts fix nominal prices over a specified period of time and have long been
recognized as a source of price stickiness. Within Keynesian macroeconomic models, nominal
contracts, especially for wages, have been assigned a central role in explaining the influence of
monetary policy on real economic activity.21 About 75 per cent of firms surveyed utilized some
type of contract for a certain percentage of their sales. As in Blinder et al.’s (1998) study, the
distribution of contract use is bimodal, with peaks at the upper and lower ends (see Table 10,
Question A10).
19. The probability that there are no variations across industries is 13.5 per cent (see Table B.1 inAppendix B).
20. Firms with 0 to 5 competitors have a significantly higher acceptance rate for cost-based pricing than dofirms with more than five competitors. Furthermore, firms for which the five largest buyers account fora large portion of sales also accept cost-based pricing more often than firms where buyers areatomistic.
21. For further discussion on the role of nominal fixed-wage and fixed-price contracts in influencing howmonetary policy affects real economic variables, see Fischer (1977) and Phelps and Taylor (1977).

24
Despite the prevalence of contract use, only 45 per cent of firms (Table 10, Question C12)
recognized explicit contracts as inhibiting price increases.22 In other words, more than one-third
of firms with contract sales indicated that their prices are not constrained by contracts. For many
of these firms, contracts either did not include binding price arrangements or included price
escalation or de-escalation clauses, which allow prices to respond to changes in demand or costs.
22. The comparable recognition rate for Blinder et al. (1998) is 50.5 per cent. Blinder et al. actually report37 per cent in their “ranking of theories” table (Table 5.2, p. 110), because they exclude those firmsattaching only minor importance to explicit contracts as a source of price stickiness.
Table 10: Key Questions & Results, Explicit Contracts
Question Survey questions and key results
A10 Sales distribution (percentage of sales under contract) [n=170, entire sample]
no contract sales (25.3%) 1 to 24% (18.2%) 25 to 49% (4.7%)50 to 74% (4.7%) 75 to 99% (11.2%) 100% (35.9%)
A11 To the best of your knowledge, have the contract vs. non-contract proportions changed signifi-cantly compared with a decade ago? If so, which has gained importance in sales over the dec-ade? [n=170, entire sample]
no, roughly the same (81%) yes, contract sales have gained (14%)yes, non-contract sales have gained (5%)
C12 “Firms would like to adjust prices more often to reflect market conditions, but fixed-price con-tracts make it difficult to pass on price increases when a contract is active” Does the statementapply to your firm? [n=170, entire sample]
No (55%) Yes, slightly important (10%) Yes, fairly important (7%) Yes, very important (28%)
C13 Do contracts prevent prices from decreasing when demand or costs fall? [n=77, firms replying‘yes’ to C12]
yes (71%) no (29%)
C14 Do you offer discounts on posted prices? [n=77, firms replying ‘yes’ to C12]
yes (45%) no (55%)
C15 What is the average period of time over which prices are fixed in contracts (in months)? [n=77,firms replying ‘yes’ to C12]
0 to 11 months (18%) 12 months (44%) 13 to 24 months (16%)25 to 60 months (17%) more than 60 months (5%)
C16 Is this period generally longer, shorter, or the same, compared to 10 years ago? [n=77, firmsreplying ‘yes’ to C12]
longer (23%) shorter (19%) same (58%)
Note: This table summarizes key questions and corresponding results for a specific theory. Questions and results are presentedin the order in which they appear in the questionnaire. A copy of the full questionnaire is provided in Appendix A.

25
How widespread are explicit contracts? Slightly more than one-half of firms who use nominal
contracts do so for only a portion of their sales (Table 10, Question A10). Therefore, a more
accurate estimate of the potential impact of explicit contracts on prices would be to weight
average contract lengths by the estimated portion of sales covered by written contracts. Using this
approach, estimates suggest that prices for about 38 per cent of the sample may be inflexible for
some period of time owing to explicit contracts.
How long are prices fixed under explicit contracts? The most frequently cited contract length is
12 months (Table 10, Question C15), but due to the existence of long-lived contracts in the
finance, insurance, and real estate sector, the average contract length is 22 months. Contract
lengths are generally unchanged over the past 10 years despite low rates of inflation over this
period (Table 10, Question C16).
Question C13 in Table 10 offered an opportunity to test whether the effects of explicit contracts
on price stickiness were symmetric; that is, whether contracts can keep prices fixed as effectively
when demand or cost pressures are subsiding as when demand and cost pressures are intensifying.
According to some economists,23 the effect of explicit contracts on price stickiness is
asymmetrical, because falling prices would prompt customers locked into older contracts at
higher prices to demand equitable treatment with newer customers. The survey shows that about
29 per cent of the firms that recognized explicit contracts as preventing prices from rising also
indicated that contracts do not prevent prices from falling when demand or cost pressures subside.
This percentage is virtually identical to that reported by Blinder et al. (1998) for the United
States.24 This result suggests that explicit contracts introduce somewhat more price inertia when
demand or cost pressures are intensifying than when they are subsiding.
4.2.3 Implicit contracts
Beyond explicit written contracts, firms may conduct business on the basis of an “invisible
handshake,” as Okun (1981) suggests—these ‘implied’ contracts force firms to stabilize prices.
This commitment to not raise prices in strong markets was recognized by 32 per cent of firms
surveyed (Table 11, Question C17). Overall, therefore, this theory ranked seventh. It received a
similar rank in both the U.S. and U.K. studies, suggesting it holds promise as a theory of price
stickiness, but faces some limitations.
23. Blinder et al. (1998, 143), suggest that Stigler and Kindahl (1970) were influential in fosteringacceptance of asymmetrical effects.
24. In Blinder et al. (1998), 28 per cent of firms accepting the explicit contract theory indicated thatcontracts are a less important source of price stickiness during periods of falling demand and costs.
26
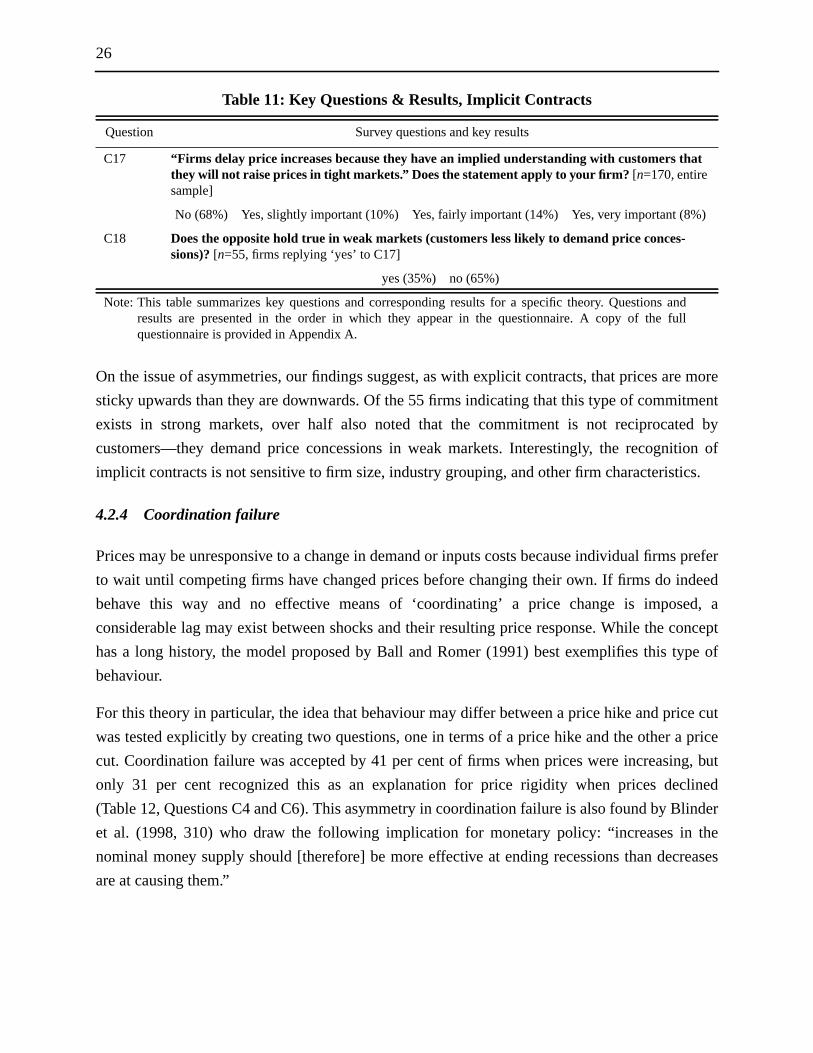
On the issue of asymmetries, our findings suggest, as with explicit contracts, that prices are more
sticky upwards than they are downwards. Of the 55 firms indicating that this type of commitment
exists in strong markets, over half also noted that the commitment is not reciprocated by
customers—they demand price concessions in weak markets. Interestingly, the recognition of
implicit contracts is not sensitive to firm size, industry grouping, and other firm characteristics.
4.2.4 Coordination failure
Prices may be unresponsive to a change in demand or inputs costs because individual firms prefer
to wait until competing firms have changed prices before changing their own. If firms do indeed
behave this way and no effective means of ‘coordinating’ a price change is imposed, a
considerable lag may exist between shocks and their resulting price response. While the concept
has a long history, the model proposed by Ball and Romer (1991) best exemplifies this type of
behaviour.
For this theory in particular, the idea that behaviour may differ between a price hike and price cut
was tested explicitly by creating two questions, one in terms of a price hike and the other a price
cut. Coordination failure was accepted by 41 per cent of firms when prices were increasing, but
only 31 per cent recognized this as an explanation for price rigidity when prices declined
(Table 12, Questions C4 and C6). This asymmetry in coordination failure is also found by Blinder
et al. (1998, 310) who draw the following implication for monetary policy: “increases in the
nominal money supply should [therefore] be more effective at ending recessions than decreases
are at causing them.”
Table 11: Key Questions & Results, Implicit Contracts
Question Survey questions and key results
C17 “Firms delay price increases because they have an implied understanding with customers thatthey will not raise prices in tight markets.” Does the statement apply to your firm? [n=170, entiresample]
No (68%) Yes, slightly important (10%) Yes, fairly important (14%) Yes, very important (8%)
C18 Does the opposite hold true in weak markets (customers less likely to demand price conces-sions)? [n=55, firms replying ‘yes’ to C17]
yes (35%) no (65%)
Note: This table summarizes key questions and corresponding results for a specific theory. Questions andresults are presented in the order in which they appear in the questionnaire. A copy of the fullquestionnaire is provided in Appendix A.

27
On both questions (a price increase or decrease), firms were questioned about why they waited for
a competing firm to change prices first. The 71 firms that accepted coordination failure when
prices are rising focused on two reasons for waiting to raise prices (Table 12, Question C7).
Nearly half (48 per cent) cited concerns that they would lose too many customers and/or too much
market share. Twenty-seven per cent said that their customers were less upset at a price hike if a
competitor raised prices first. In both cases, negative outcomes with customers were a motivating
concern for not raising prices. Of the 53 firms recognizing coordination failure on a price decline,
most focused on two reasons for waiting to cut prices: firms worried about a price cut reducing
margins or triggering a price war (Table 12, Question C5).
Table 12: Key Questions & Results, Coordination Failure
Question Survey questions and key results
A16 Is there a price leader in your industry? [n=170, entire sample]
yes (51%) no (49%)
A17 If so, is your firm considered the price leader? [n=86, firms replying ‘yes’ to A16]
yes (55%) no (45%)
C4 “Firms delay price cuts because they don’t want to be the first in the industry to cut prices.”Does the statement apply to your firm? [n=170, entire sample]
No (69%) Yes, slightly important (7%) Yes, fairly important (13%) Yes, very important (11%)
C5 Why does the statement apply to your firm? (Choose all applicable) [n=53, firms replying‘yes’ to C4]
price cuts may trigger a price war (31%) lower prices hurt our margins (44%)if we cut prices first, new business would exceed our capacity (3%)
we worry that the need for a price cut may be temporary (12%) other (11%)
C6 “Firms delay raising prices because they don’t want to be the first in the industry to cut prices.”Does the statement apply to your firm? [n=170, entire sample]
No (59%) Yes, slightly important (15%) Yes, fairly important (15%) Yes, very important (11%)
C7 Why does the statement apply to your firm? (Choose all applicable) [n=71, firms replying‘yes’ to C6]
cannot sell anything above our competitors’ prices (14%)we would lose too many customers/market share (48%)
if a competitor raises prices first, customers are less upset (27%) other (12%)
Note: This table summarizes key questions and corresponding results for a specific theory. Questions andresults are presented in the order in which they appear in the questionnaire. A copy of the fullquestionnaire is provided in Appendix A.
28
A key assumption underpinning coordination failure as a viable theory of price stickiness is that
all firms behave in a similar fashion. A single firm showing price leadership could effectively
eliminate coordination failure as a source of price stickiness. Firms were therefore asked if there
exists a firm in their industry that fits the description of a price leader—a firm that is unconcerned
about moving prices when required and therefore leads others to quickly change prices (Table 12,
Questions A16 and A17).
The sample was almost exactly split into two groups: those recognizing a price leader in their
industry and those without price leaders. Those firms citing some type of price leadership in their
industry were asked if they themselves were considered the price leader in their respective
industries. Of that group, about half (i.e., a quarter of the entire sample) indicated that they were
the price leader in their industry.
Still, results show that even price leaders have an asymmetrical reaction to coordination failure.
Firms describing themselves as price leaders show little reluctance to initiate a price decrease.
However, on a price increase, these same firms are just as worried as other firms about the
negative consequences.25 These results suggest that price leadership may be an effective means of
breaking through coordination failure on a price cut, but that it is not as effective on a price hike.
4.2.5 Non-price competition
The idea that markets might clear by means other than price is perhaps best described by Carlton
(1989). Firms, for example, may choose to respond to changes in market conditions by altering
the features of the product or service (e.g., volume per unit, quality of inputs, client service levels,
credit requirements, the seniority of staff assigned to projects, and/or delivery times), rather than
its price.
In Canada, about 44 per cent of firms recognized non-price competition as a source of price
rigidity—ranked third overall. A firm’s willingness to modify product and service features instead
of prices was not found to be statistically different across industries and firm sizes, nor was it
influenced by cost structure, degree of buyer concentration, and the number of competitors faced
by the firm.
25. Thirty-six per cent of firms describing themselves as the price leader in their industry recognizecoordination failure when prices are rising—a proportion which is similar to the total sample (41 percent). However, when prices are falling, only 19 per cent of price leaders recognize coordinationfailure—a much smaller proportion than the total sample (31 per cent). This result is statisticallysignificant at the 95 per cent confidence level.

29
However, non-price competition did have significantly higher acceptance among firms selling to
households (see Table B.4) and firms for which domestic markets are the predominant sales area
(see Table B.6). Furthermore, firms identifying themselves as time-dependent price reviewers
(i.e., firms that review and set prices with a fixed periodicity) had a higher acceptance of this
theory that is weakly significant (see Table B.7).
4.2.6 Customer relations
Previous subsections have outlined key findings related to several of the most widely recognized
theories of price stickiness. While these are useful explanations of how sticky prices manifest
themselves, they say little about why firms would choose these behaviours. For example, why do
firms not change prices until costs have changed (cost-based pricing)? Why do firms not raise
prices until other firms have done so (coordination failure)? Why do firms change the non-price
characteristics of their product or service rather than change the price (non-price competition)?
Why do firms stick to a nominal price contract when conditions dictate a price change is in order
(explicit contracts)?
As alluded to previously, these behaviours are often the result of a firm’s concern that price
changes may antagonize customers. Fifty-five per cent of firms surveyed agreed that ‘prices could
not change more often without disturbing customer relations’—the second most accepted theory
overall after cost-based pricing.
Perhaps the most compelling evidence on customer relations comes from Table 13, which shows
the entire sample of firms divided into four groups based on the frequency with which the firms
adjust prices. Beyond being widely recognized overall, customer relations costs have a very high
level of acknowledgement among firms with the stickiest prices. Seventy-six per cent of firms
who change their prices only once or not at all during the year recognize this factor as a source of
price rigidity (see Table 13).
Our survey is not the first to point this out. While Blinder et al. (1998) did not directly ask firms
what impact a price change might have on customer relations, firms participating in the survey
volunteered this factor as a key motivator in several different circumstances. For example, in
response to an open-ended question, ‘Why don’t you change prices more frequently than you do?’
the most often-cited reason was that more frequent price adjustments would “antagonize” or
“cause difficulties for” customers. Overall, 121 of the 200 firms in his sample offered (without
being prompted) the view that customer relations costs were a key reason to keep price changes at
a minimum. The authors conclude that: “real world companies were practically standing up and
shouting that what they view as excessive price variability would ‘antagonize’ or ‘cause
difficulties for’ their customers” (Blinder et al. 1998, 308).

30
Historically, customer relations costs have received very little attention as a theoretical source of
price stickiness.26 Recently, however, Rotemberg (2002, 2003) has modelled price rigidity on the
basis of consumers’ judgment about the altruism shown to them by suppliers. His work shows that
Table 13: Percentage Recognition of Pricing Theory by Frequency of Price Adjustment
TheoryWholesample
Frequency of price adjustmentper year
F-testvaluesa
a. A single asterisk indicates rejection of the null hypothesis of equal means at the 10% level. A double asteriskindicates rejection at the 5% level.
Probabilityof no
variation
Statisticallysignificant
differences b
b. Two-sample t-test assuming unequal variances. Critical values corrected using a Bonferroni normalization.
0 to 1n=58
2 to 4n=39
5 to 52n=43
>52n=30
(1) (2) (3) (4)
Cost-basedpricing 67.1 69.0 74.4 62.8 60.0 0.7 0.565 None
Customerrelations 55.3 75.9 59.0 37.2 36.7 7.4** 0.000 1&3**,
1&4**
Non-pricecompetition 44.1 46.6 46.2 41.9 40.0 0.2 0.921 None
Explicit contracts 45.3 36.2 43.6 53.5 53.3 1.3 0.274 None
Coordinationfailure - risingprices
41.2 48.3 41.0 39.5 30.0 0.9 0.429 None
Low inflation 33.5 48.3 25.6 25.6 26.7 2.9** 0.034 1&2*, 1&3*
Implicit contracts 31.8 37.9 33.3 27.9 23.3 0.8 0.511 None
Coordinationfailure - fallingprices
31.2 29.3 30.8 37.2 26.7 0.4 0.779 None
Factors do notchange 31.2 48.3 30.8 20.9 13.3 5.1** 0.002 1&3**,
1&4**
Menu costs 21.2 37.9 20.5 11.6 3.3 6.5** 0.000 1&3**,1&4**, 2&4*
Stickyinformation 13.5 17.2 15.4 11.6 6.7 0.7 0.550 None
26. As a result of its peripheral role in mainstream theoretical work, we did not ask probing questions onthe topic. We would certainly recommend that future surveys of a similar nature query business aboutthis source of price stickiness.

31
‘fairness’ can be modelled to mimic much of the microeconomic evidence about price
adjustments, including: “the observation that prices are variable across customers and across
certain time intervals (namely when there are ‘specials’) while they are relatively stable in
response to other shocks” (Rotemberg 2003, 42).
Furthermore, other empirical evidence also supports the view that the customer relations costs of
price changes are a much more important source of price rigidities. Zbaracki et al. (2003) follow
closely the price-adjustment process at a large U.S. industrial manufacturer. Data generated from
this detailed analysis suggest managerial costs are more than 6 times, and customer costs more
than 20 times, larger than physical menu costs. Customer costs are split into two types: customer
communication costs and customer negotiation costs.
4.2.7 Menu costs
Firms were asked about the role that the physical menu costs of a price adjustment (time, effort,
and out-of-pocket costs such as reprinting and re-tagging) play in creating sticky prices. As
Wolman (2000) points out, the traditional menu costs theory is one of the best-developed theories
of sticky prices and the simplest—it gives firms some ability to set their own prices (some
monopoly power) and assumes that the costs of changing prices are mostly lump sum. While
Barro (1972) formalizes menu costs, the origins of this theory go back to the 1930s.
These traditional menu costs were recognized by only 21 per cent of respondents, and it is
therefore one of the least recognized theories. While few firms recognized these costs overall,
those with inflexible prices were much more likely to accept this theory. Thirty-eight per cent of
firms with fewer than two price changes per year found this to be a source of price rigidities (see
Table 13). Contrastingly, only 3 per cent of firms with more than 52 price changes per year
responded positively to this concept. In other words, firms with the stickiest prices are over ten
times more likely to identify menu costs as a source of price rigidity—for them, menu costs do
matter.
Physical menu costs scored equally poorly in previous surveys. Hall, Walsh, and Yates (1997)
report a 7 per cent recognition rate for this theory—the lowest in the survey of U.K. companies.
Apel, Friberg, and Hallsten (2001) report that Swedish firms ranked menu costs eleventh of
thirteen theories.27
27. Blinder et al.’s (1998) adjustment cost question included both physical menu costs and information-gathering costs, and is therefore not readily comparable. Still, ‘costly price adjustments’ ranked sixthof twelve theories.

32
4.2.8 Factor stability
During the pre-testing stage of this survey, several firms mentioned that prices did not change
more often because most of the reasons for price adjustments did not occur very often (demand or
costs), and so prices did not need to change more often. Blinder et al. (1998) faced a similar
sample of firms that seemed isolated from the churning one might expect in markets.28 In order to
capture this group in our survey, all firms were asked to evaluate this statement: ‘factors
influencing prices do not change often enough to warrant changes in prices.’
Overall, this theory was the third least popular of the ten theories tested, but was still recognized
by 31 per cent of the sample. Like menu costs, however, this theory has much more traction
among firms with fewer than two changes per year; 48 per cent recognize it (see Table 13).
Table B.1 in Appendix B reveals that, among industries, manufacturers are the least likely to
recognize this theory, while firms in information and cultural industries are the most likely to
recognize this concept. Small firms (Table B.8), firms with a domestic sales base (Table B.6), and
firms with a fixed cost structure (Table B.5) are also relatively more attracted to this idea.
4.2.9 Low inflation
A key benefit often attributed to low, stable, and predictable inflation (and the inflation targets that
support this environment) is that it clarifies the signalling function of the price system. As the
argument goes, if economic agents have well-anchored expectations of inflation, they will
recognize any price increase above the target as being a real price change, as opposed to a nominal
price change, and react accordingly. Firms were therefore asked: does low inflation make large
price changes more noticeable? Strictly speaking, this is not a theory of price stickiness, since the
concept allows for some movement in prices downwards and, furthermore, allows for price
increases at the rate of inflation.
Overall, 34 per cent of firms surveyed accepted this as a reason why prices might be more rigid
than desired. Firms offered interesting anecdotes about customers’ sensitivity to price changes
above the rate of inflation. Several mentioned that they preferred to ‘stay off the radar screen’ or
‘did not want to rock the boat with key customers’ and so they held price increases to 2 or 3 per
cent per year.
28. Blinder et al. (1998, 85, Table 4.2). When asked: “Why don’t you change prices more frequently thanthat?” 27 of 196 firms surveyed said their costs did not change more often.

33
As was the case for several previously mentioned theories, firms with fewer than two price
changes per year were significantly more sensitive to the concept that price changes beyond the
rate of inflation would attract the attention of customers and therefore lead to unwanted outcomes.
Of this group, 48 per cent accepted this as a reason for price stickiness (see Table 13). Firms with
a mainly domestic client base found this explanation of price inertia more appealing than did
firms with a largely export-based clientele (Table B.6). This is not surprising: domestic clients
should be more likely to have expectations conditioned by the central bank’s target and/or recent
inflation experience.
4.2.10 Sticky information
While much has been said of theories that hold some promise as useful explanations of price
stickiness, a practical goal of this approach is to highlight theories that may need to be
reconsidered. Some see the ongoing proliferation of new sticky-price theories as a major problem:
“there is not shortage of theories of sticky prices. Indeed, the problem is precisely the opposite:
we have an embarrassingly long list from which to choose” (Blinder et al. 1998, 17).
Of the ten theories tested, one in particular stands out for its low recognition among firms. Sticky
information is most closely associated with Mankiw and Ries (2001), who propose that
information about the state of the macroeconomy and a firm’s market diffuses slowly. While
prices are constantly changing in this model, the pricing decision made by firms is not always
based on current information, since only a fraction of firms update their information set in any
given period. Other firms continue to set prices based on an outdated set of information.
This explanation was accepted as a possible reason for price stickiness by only 13.5 per cent of
the sample of firms surveyed—the lowest acceptance rate (Table 14, Question C1). Of the firms
recognizing the theory, a single firm in the sample of 170 Canadian firms rated this factor as
‘very’ important and the majority rated it as only ‘slightly’ important. Results from Apel, Friberg,
and Hallsten (2001) support the view that information gathering costs are relatively small. Firms
in that survey of Swedish firms ranked ‘information-gathering costs’29 thirteenth out of thirteen
theories of price inertia.
29. The exact statement for the information-gathering costs theory presented to a sample of Swedish firmsis: ‘It is costly in terms of time and/or money to gather relevant information for pricing decisions.’
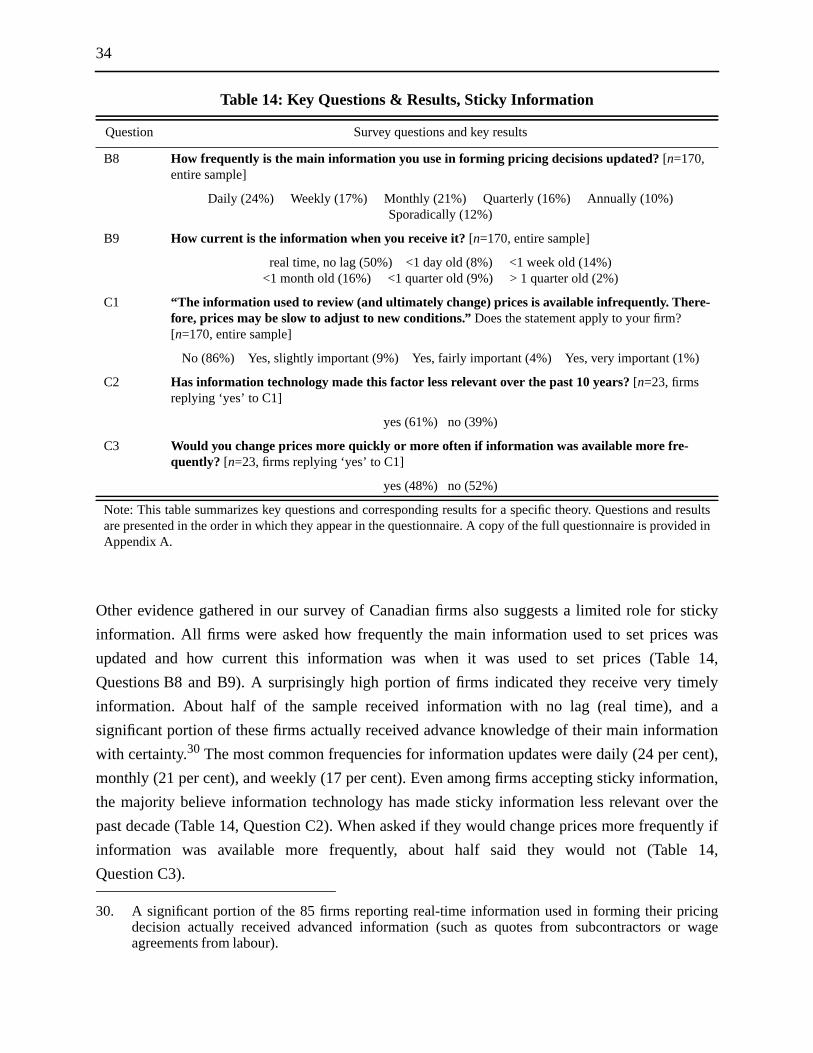
34
Other evidence gathered in our survey of Canadian firms also suggests a limited role for sticky
information. All firms were asked how frequently the main information used to set prices was
updated and how current this information was when it was used to set prices (Table 14,
Questions B8 and B9). A surprisingly high portion of firms indicated they receive very timely
information. About half of the sample received information with no lag (real time), and a
significant portion of these firms actually received advance knowledge of their main information
with certainty.30 The most common frequencies for information updates were daily (24 per cent),
monthly (21 per cent), and weekly (17 per cent). Even among firms accepting sticky information,
the majority believe information technology has made sticky information less relevant over the
past decade (Table 14, Question C2). When asked if they would change prices more frequently if
information was available more frequently, about half said they would not (Table 14,
Question C3).
Table 14: Key Questions & Results, Sticky Information
Question Survey questions and key results
B8 How frequently is the main information you use in forming pricing decisions updated? [n=170,entire sample]
Daily (24%) Weekly (17%) Monthly (21%) Quarterly (16%) Annually (10%)Sporadically (12%)
B9 How current is the information when you receive it? [n=170, entire sample]
real time, no lag (50%) <1 day old (8%) <1 week old (14%)<1 month old (16%) <1 quarter old (9%) > 1 quarter old (2%)
C1 “The information used to review (and ultimately change) prices is available infrequently. There-fore, prices may be slow to adjust to new conditions.” Does the statement apply to your firm?[n=170, entire sample]
No (86%) Yes, slightly important (9%) Yes, fairly important (4%) Yes, very important (1%)
C2 Has information technology made this factor less relevant over the past 10 years? [n=23, firmsreplying ‘yes’ to C1]
yes (61%) no (39%)
C3 Would you change prices more quickly or more often if information was available more fre-quently? [n=23, firms replying ‘yes’ to C1]
yes (48%) no (52%)
Note: This table summarizes key questions and corresponding results for a specific theory. Questions and resultsare presented in the order in which they appear in the questionnaire. A copy of the full questionnaire is provided inAppendix A.
30. A significant portion of the 85 firms reporting real-time information used in forming their pricingdecision actually received advanced information (such as quotes from subcontractors or wageagreements from labour).

35
Small firms have higher recognition rates for this theory (Table B.8) and are also more likely than
their large counterparts to receive infrequent updates of information used to set prices. It seems
clear that small firms face costs that limit their price-setting frequency, and that these costs are
related to the price review. Information-gathering costs and price re-optimization costs, such as
management time and effort, are particularly heavy for small firms because they cannot be spread
over many units of production. To the limited extent that it applies, sticky information makes the
most sense for small firms.
5. Conclusions
5.1 Summary of key results
5.1.1 Price flexibility
This survey of the price-setting behaviour of a representative sample of 170 Canadian firms has
several interesting findings. For one, firms show a wide variation in the frequency with which they
adjust prices. While one-third adjust prices once a year or less, a similar portion adjust prices
more than twelve times per year. Overall, results indicate that, for the portion of the economy we
surveyed,31 half of Canadian firms changed prices at least once every three months. Compared
with previous findings in surveys of a similar nature, our findings suggest more flexibility in
prices. Many previous surveys found a median of one or two price changes per year. Our results,
however, do conform closely to those found by Bils and Klenow (2002).
In addition to asking firms about the frequency with which prices are adjusted today, we probed
firms about changes in the price-setting frequency over time. On this issue, the survey has found
evidence of increased price flexibility among Canadian firms over the past decade. Much of the
increase in price flexibility is attributed to the intensification of competition over the past decade
and the greater use of information technologies, such as so-called yield-management techniques,
which reduce the lump-sum costs of reviewing prices.
Some of the wide variation in reported price-setting behaviour can be explained by the
characteristics and circumstances that firms reported to interviewers. For example, small firms set
prices far less frequently than do large firms. Firms in service sectors, with their heavy reliance on
wages as a key determinant of prices, were mostly likely to set prices annually—often
synchronized to annual wage settlements. On the other hand, wholesalers and retailers were most
31. The survey aimed to be representative of the private, for-profit, unregulated, and non-commodityproducing segment of the Canadian economy.

36
likely to have flexibility in prices—their median price change frequency is seven price changes
per year. Other factors were also found to be important. For example, firms with the majority of
their sales from international exports reported much more flexibility in their prices. Firms with
more than five competitors also reported significantly more flexibility in prices.
5.1.2 Reasons for price stickiness
Beyond understanding how firms set prices, this study was equally concerned with understanding
the reasons for price inertia. In particular, firms reacted favourably to the idea that prices do not
change until a firm has seen its costs change. This theory (cost-based pricing) also scored well as
a theory of price stickiness in other similar surveys (see Table 15). Firms were also concerned
about adjusting prices ahead of their competition. In addition, some firms using sales contracts
said they hold nominal prices fixed regardless of market conditions that would otherwise call for a
change in price.
These theories as to why profit-maximizing firms may keep prices unchanged despite pressures to
adjust them seem to have a common genesis: the firms’ fears of antagonizing customers or
disturbing the goodwill or reputation developed with customers. The theory of customer relations
was the second most popular choice overall, and was accepted by three-quarters of firms with the
stickiest prices (Table 13).
Given that customers are more likely to be antagonized by a price hike than a price cut, one would
expect fewer rigidities in cutting prices than raising prices. Firms were queried about these
possible asymmetries. Evidence suggests that firms may face more price inertia when
experiencing upward price pressures than when experiencing downward price pressures.

37
On the issue of price-setting asymmetries specifically, and other findings more generally,
however, the results must be treated with caution. The survey was gathered at a specific moment
in the economic cycle. One could imagine that asymmetries, and other findings, could be sensitive
to the cycle of the economy and prone to the timing of the survey.
5.2 Implications and areas for further research
Some implications of these results are worth considering despite the caveats cited above. If, as we
have found in this survey, prices in Canada are relatively flexible and have become more flexible
over time, inflation may be more responsive to interest rate changes. Thus, inflation targets could
be achieved with shorter lags and with less impact on activity in the real economy. Moreover,
greater flexibility not only reduces the effects of monetary policy on the real economy, but also
reduces the need for counter-cyclical policy.
The asymmetrical response of prices to changes in economic conditions (i.e., more flexibility
downward than upward) also has implications for the conduct of monetary policy. For one, this
result runs counter to recent concerns that prices, wages in particular, are more sticky downwards
Table 15: Comparing Results from the Bank of Canada Survey with Three Previous Studies
U.S. study U.K. study Sweden studyBank of Canada
study
Median frequencyof price changes peryear
1.4 2 1 4
Most frequentlycited price-changefrequency per year(i.e., mode)
1 1 1 1
Highest-rankedtheories of pricestickiness**
1. Coordinationfailure
2. Non-priceadjustment
3. Cost-basedpricing
4. Implicit contracts5. Explicit contracts
1. Cost-basedpricing
2. Implicit contracts3. Explicit contracts4. Procyclical
elasticities*5. Pricing
thresholds*
1. Implicit contracts2. Explicit contracts3. Cost-based
pricing4. Coordination
failure5. Counter-cyclical
cost of finance*
1. Cost-basedpricing
2. Customerrelations
3. Explicit contracts4. Non-price
adjustment5. Coordination
failure
* Not surveyed in the Bank of Canada study** Rankings for the United States, the United Kingdom, and Canadian studies are based upon the percentage of firms that
recognized a particular theory. In the Canadian study, mean scores could only be calculated for the six main theories, andthe rankings are identical to those based on percentage recognition.

38
than upwards. Similar asymmetries and implications are also found by Blinder et al. (1998, 310)—
these asymmetries suggest that expansionary monetary policy may be more effective at ending
recessions than contractionary policy is at causing them.
While these results are compelling, they require further validation. For one, these survey results
say nothing about wages directly, and this is where downward rigidities are thought to be most
important. In addition, concerns about response burden explicitly limited the survey’s
investigation of price asymmetries. Further research on wage-determination and price-
determination asymmetries would be quite valuable.

39
References
Apel, M., R. Friberg, and K. Hallsten. 2001. “Microeconomic Foundations of MacroeconomicPrice Adjustment: Survey Evidence from Swedish Firms.” Sveriges Riksbank WorkingPaper No. 128.
Ball, L. and D. Romer. 1991. “Sticky Prices as Coordination Failure.” American EconomicReview 81(3): 539–52.
Bank of Canada. 2005. “Adjusting to the Appreciation of the Canadian Dollar: Supplement to theWinter 2004–05 Business Outlook Survey.” Available at <http://www.bankofcanada.ca/en/bos/2005/winter/adj_e_0105.pdf>.
Barro, R.J. 1972. “A Theory of Monopolistic Price Adjustment.” Review of Economic Studies39(1): 17–26.
Bils, M. and P.J. Klenow. 2002. “Some Evidence on the Importance of Sticky Prices.” NBERWorking Paper No. 9069.
Blanchard, O.J. 1983. “Price Asynchronization and Price Level Inertia.” In Inflation, Debt, andIndexation, edited by R. Dornbusch and M. Simonsen, 3–24. Cambridge: MassachusettsInstitute of Technology Press.
Blinder, A.S. 1991. “Why Are Prices Sticky? Preliminary Results from an Interview Study.”American Economic Review 81: 89–96.
———. 1994. “On Sticky Prices: Academic Theories Meet the Real World.” In Monetary Policy,edited by G. Mankiw, 117–50. Chicago: University of Chicago Press.
Blinder, A.S., E.R.D. Canetti, D.E. Lebow, and J.B. Rudd. 1998. Asking About Prices—A NewApproach to Understanding Price Stickiness. New York: Russell Sage Foundation.
Buckle, R. and J. Carlson. 2000. “Menu Costs, Firm Size and Price Rigidity.” Economics Letters66: 59–63.
Carlton, D. 1986. “The Rigidity of Prices.” American Economic Review 76: 637–58.
———. 1989. “The Theory and the Facts About How Markets Clear: Is Industrial OrganizationValuable for Understanding Macroeconomics?” In Handbook of Industrial Organization,edited by R. Schmalensee and R. Willig, 1: 910–43. Amsterdam: North Holland.
Cecchetti, S. 1986. “The Frequency of Price Adjustment: A Study of the Newsstand Prices ofMagazines.” Journal of Econometrics 31: 255–74.
Fabiani, S., M. Druant, I. Hernando, C. Kwapil, B. Landau, C. Loupias, F. Martins, T.Y. Mathä, R.Sabbatini, H. Stahl, and Ad C.J. Stockman. 2005. “The Pricing Behaviour of Firms in theEuro Area: New Survey Evidence.” European Central Bank Working Paper No. 535.
Fischer, S. 1977. “Long-Term Contracts, Rational Expectations, and the Optimal Money SupplyRule.” Journal of Political Economy 85(1): 191–205.
Gordon, R. 1981. “Output Fluctuations and Gradual Price Adjustment.” Journal of EconomicLiterature 19: 493–530.

40
Hall, S., M. Walsh, and A. Yates. 1997. “How Do UK Companies Set Prices?” Bank of EnglandWorking Paper No. 67.
Kashyap, A. 1995. “Sticky Prices: New Evidence from Retail Catalogs.” Quarterly Journal ofEconomics 110: 245–74.
Kvanli, A.H., S. Guynes, and R.J. Pavur. 1992. Introduction to Business Statistics. St. Paul: WestPublishing Co., 892–94.
Mankiw, N.G. and R. Reis. 2001. “Sticky Information: A Model of Monetary Nonneutrality andStructural Slumps.” NBER Working Paper No. 8614.
Martin, M. 2004. “The Bank of Canada’s Business Outlook Survey.” Bank of Canada Review(Spring): 3–18.
Nakagawa, S., R. Hattori, and I. Takagawa. 2000. “Price-Setting Behavior of JapaneseCompanies.” Bank of Japan Working Paper.
Okun, A. 1981. Prices and Quantities: A Macroeconomic Analysis. Washington, D.C.: TheBrookings Institution.
Organisation for Economic Co-operation and Development (OECD). 2003. “Business TendencySurveys: A Handbook.” 21–23.
Phelps, E.D. and J. Taylor. 1977. “Stabilizing Powers of Monetary Policy Under RationalExpectations.” Journal of Political Economy 85(1): 163–90.
Rotemberg, J. 2002. “Customer Anger at Price Increases, Time Variation in the Frequency ofPrice Changes and Monetary Policy.” NBER Working Paper No. 9320.
———. 2003. “The Benevolence of the Baker: Fair Pricing under the Threat of Customer Anger.”Available at <http:www.econ.yale.edu/seminars/macro/mac03/rotemberg-031111.pdf>.
Stigler, G.J. and J.K. Kindahl. 1970. The Behavior of Industrial Prices. New York: ColumbiaUniversity Press.
Taylor, J. 1979. “Staggered Wage Setting in a Macro Model.” American Economic Review 69:108–13.
———. 1980. “Aggregate Dynamics and Staggered Contracts.” Journal of Political Economy88(1): 1–23.
Wolman, A.L. 2000. “The Frequency and Costs of Individual Price Adjustment.” Federal ReserveBank of Richmond Economic Quarterly 86(4): 1–22.
Zbaracki, M., M. Ritson, D. Levy, S. Dutta, and M. Bergen. 2003. “Managerial and CustomerCosts of Price Adjustment: Direct Evidence from Industrial Markets.” Bar-Ilan UniversityEconomics Working Paper No. 2003.

41
Appendix A
2002/03 Price-Setting Survey Questionnaire
The survey on the following pages is reproduced exactly how participants received it.

42
About the Survey
The Bank of Canada’s monetary policy aims to support solid economic growth by keeping inflation low, stable and pre-dictable. The purpose of this study is to help the Bank better understand the current pricing practices of Canadianfirms. Economists have many theories as to how firms decide to set prices. This study tests these theories in practiceand attempts to identify trends in how prices are set.
The survey is divided into three sections. Section A addresses basic questions about your firm and its main productsand services. We encourage you to review this section before you meet with our interviewer. Section B gathers infor-mation on pricing behaviour and factors influencing pricing decisions. Section C addresses factors that may lead todelays in price adjustments. You may wish to read these sections before the interview, but this is not necessary.
Finally, although the Bank of Canada is subject to the Access to Information Act, please be assured that no privateinformation will be released to the public. If you have any questions please contact your interviewer by phone or e-mailat the address listed below.
Your Interviewer: David Amirault, phone: 1-800-417-0144, email: [email protected]
EXPLANATION OF SOME IMPORTANT CONCEPTS
Representative Business LineSince your firm likely sells many different types of goods and services, it will be difficult to generalize questions basedon each. For this reason, we would like you to consider one of your main business lines when answering these ques-tions. Furthermore, if your firm has both domestic and international sales, please answer all questions with specificreference to Canadian markets.
Firm or CompanyIf your firm is a holding company for two or more different types of business, choose the business type that accountsfor the largest portion of revenues or for which you feel most comfortable answering questions.
PriceBy price we mean the actual transaction sales price, not the list price. Therefore, if discounts from the list price arecommon in your industry, refer to the after-discount price of your good or service. If you have different prices for differ-ent types of customers, base your answer on the most common type of customer.
Surveying Different Types of FirmsThe survey is designed to be answered by firms of many sizes in different sectors of the economy. If you are unable toanswer a question, please provide as much information as you can to the interviewer on the date of the survey. Ourstaff are trained to interpret these questions for specific firms and industries.
Services and Customized ProductsFinal transaction prices in certain industries offering customized products may be largely a function of the workinvolved. If this applies to your firm, refer to your hourly or daily charge out rate as the transaction price.
Fixed and Variable CostsFixed costs remain constant regardless of the volume of production, while variable costs fluctuate with production lev-els.

43
Date (Survey collected) _________________
Section A: About your firm and its main products
COMPANY INFORMATIONA1. Region [ ] Atlantic Canada [ ] Quebec [ ] Ontario [ ] Prairies [ ] British Columbia
A2. Company name _______________________________ Phone number _____________________
A3. Contact name _________________________________ Title _____________________________
A4. Product / Service / Business line _____________________________________ Please answer all questionsbased on this category
PRICE FLEXIBILITYA5. Do you face constraints on the prices you set?[ ] No constraint [ ] Legal/Regulatory [ ] Common International Price [ ] Parent Company Directive
EMPLOYMENT LEVELSA6. Number of Employees __________________
COST TRENDSA7. Approximately what percentage of main product costs are variable ______% versus fixed _______ %
SALES DISTRIBUTION (report approximate percentages in blank spaces)
A8. Home Region ________ % Other Can. _________ % U. S. ________ % Other Int. _________ %
A9. Households ________ % Businesses ________ % Other (Govt./Inst.) ________ %
A10. Contract Sales _________ % Non-contract sales ________ %
A11. To the best of your knowledge, have the contract vs. non-contract proportions changed significantly comparedwith a decade ago? If so, which has gained importance in total sales over the decade?
[ ] No, roughly the same percentages [ ] Yes, contract sales have gained [ ] Yes, non-contract sales have gained
A12. Approximate sale percentages to the five largest buyers of your main product today.[ ] <10% [ ] 11-25% [ ] 26-50% [ ] 50%<
A13. Approximate sale percentages to the five largest buyers of your main product a decade ago.[ ] <10% [ ] 11-25% [ ] 26-50% [ ] 50%<
A14. How many direct competitors do you face for this business line? _________
A15. Do you face [ ] more, [ ] fewer or the [ ] same number of direct competitors compared with a decade ago?
A16. Is there a price leader in your industry? [ ] Yes / [ ] No
A17. If so, is your firm considered the price leader? [ ] Yes / [ ] No

44
Section B: The pricing decisionFREQUENCY OF PRICE REVIEWS AND ADJUSTMENTSB1. For your main product, how frequently are pricing decisions reviewed?
[ ] Daily [ ] Weekly [ ] Monthly [ ] Quarterly [ ] Annually
[ ] Sporadically [ ] In response to specific event (specify) ___________________________________________
B2. If you answered “sporadically” or “in response to specific event”, howmany times have pricing decisions been reviewed in the last 12 months? __________________
B3. In the last 12 months how many times have you actually adjusted prices? __________________
B4. To the best of your knowledge, has the frequency of price adjustments changed in the past decade?
[ ] No, it has not changed [ ] Yes, we change prices more frequently [ ] Yes, we change prices less frequently
B5. If yes, why?____________________________________________________________________
REASONS FOR PRICE CHANGESB6. For your main product/service, how important is each of the following factors in motivating price adjustments(check the most appropriate box)?
B7. What other factor(s) not listed above motivate price adjustments?
_____________________________________________________________________________________
INFORMATION USED TO SET PRICESB8. How frequently is the main information you use in forming your pricing decisions updated?
[ ] Daily [ ] Weekly [ ] Monthly [ ] Quarterly [ ] Annually [ ] Sporadically
B9. How current is the information when you receive it?
[ ] real time (no lag) [ ] < 1 day old [ ] < 1 week old [ ] < 1 month old [ ] < 1 quarter old [ ] > 1 quarter old.
Reasons / Factors leading to price change veryimportant
fairlyimportant
slightlyimportant
notimportant
notapplicable
We routinely change prices at regular intervalsChanges in wage costsChanges in other domestic inputsChanges in taxes, fees and other chargesPrice changes by competitorsChanges in exchange ratesChanges in demand for product/serviceChanges in economic/inflation forecastSales campaignsDirectives from parent company

45
EXCHANGE RATES AND PRICES (the exchange rate means the Canada/U.S. exchange rate)
B10. Do you import/export intermediate inputs or finished goods? [ ] Yes/ [ ] No If no, skip to Section C
B11. Which statement best exemplifies the immediate impact of an exchange rate depreciation on your firm’s margin.
[ ] significant [ ] moderate [ ] no significant [ ] moderate [ ] significant negative effect negative effect effect positive effect positive effectIf “negative effect”, answer B 13 onward If “no significant/positive effect”, answer B12 & B17
B12. Have higher U.S. dollar margins diverted sales or investment from Canadian to foreign markets? [ ] Yes/ [ ] No
B13. Faced with a smaller margin because of a depreciating dollar, rank the following in order of their importance as ameans of restoring margins in recent years. (Rank Top 3, 1=Most important, 2=second most important, 3=third most important)
[ ] increase selling prices [ ] shift input to non-U.S. supplier [ ] reduce other input costs
[ ] increase productivity or volumes of activity [ ] reduce other costs __________________________________
[ ] other means of restoring margin ________________________________________________________________
B14. On average, how much of your profit margin have you recouped in the 12 months following a depreciation?
[ ] virtually none [ ] less than half [ ] about half [ ] more than half [ ] virtually all [ ] Don’t know
B15. How much does the exchange rate depreciate before you would adjust prices?
[ ] < 5% [ ] 5% to 10% [ ] 10% to 20% [ ] 20% to 30% [ ] >30% [ ] not applicable/don’t know
B16. Are foreign exchange costs more difficult to pass on to consumers now than a decade ago?[ ] Yes / [ ] No If yes, why? (Choose all applicable)
[ ] competition from domestic sources[ ] competition from foreign sources[ ] fewer buyers exert more power on our firm to keep prices down[ ] low inflation makes price increases more visible and more difficult to justify
[ ] other factors (specify)______________________________________________________________________
B17. During significant exchange rate depreciation, do suppliers reduce their price to offset part of the higher importcost?
[ ] No, no offset [ ] Yes, infrequently [ ] Yes, often [ ] Yes, but I don’t know how often.

46
Section C: Factors leading to delays in price adjustmentsThis section deals with potential theories as to why price adjustments may be delayed, although firms would want toincrease prices. Statements summarizing a factor that may slow price adjustments are written in italics. Each theory isfollowed by a series of questions.
Statement A: The information used to review (and ultimately change) prices is available infrequently. There-fore, prices may be slow to adjust to new conditions.
C1. Does this statement apply to your firm?[ ] No [ ] Yes, slightly [ ] Yes, fairly [ ] Yes, very(Skip to Statement B1) important important important
C2. Has information technology made this factor less relevant over the past 10 years? [ ] Yes / [ ] No
C3. Would you change prices more quickly or more often if information was available more frequently? [ ] Yes / [ ] No
Statement B1: Firms delay price cuts because they don’t want to be the first in the industry to cut prices.
C4. Does this statement apply to your firm?[ ] No [ ] Yes, slightly [ ] Yes, fairly [ ] Yes, very(Skip to Statement B2) important important important
C5. Why does this statement apply to your firm? (Choose all applicable) [ ] price cuts may trigger a price war [ ] if we cut prices first, new business would exceed our capacity [ ] lower prices hurt our margins [ ] we worry that the need for a price cut may be temporary
[ ] other _____________________________________________________
Statement B2: Firms delay raising prices because they don’t want to be the first in the industry to raise prices.
C6. Does this statement apply to your firm?[ ] No [ ] Yes, slightly [ ] Yes, fairly [ ] Yes, very(Skip to Statement C) important important important
C7. Why does the statement apply to your firm? (Choose all applicable) [ ] cannot sell anything above competitors’ prices [ ] we would lose too many customers/market share [ ] if a competitor raises prices first, customers are less upset [ ] other _____________________________________________________
Statement C: Prices depend mainly on the costs of labour and raw materials used in producing goods andservices. Therefore, prices don’t change until costs change.
C8. Does this statement apply to your firm?[ ] No [ ] Yes, slightly [ ] Yes, fairly [ ] Yes, very(Skip to Statement D) important important important
C9. Are temporary cost increases more difficult to pass into prices than increases viewed as permanent?[ ]Yes/ [ ] No

47
C10. If you foresee an increase in your future costs (such as raw materials), do you (Choose any of the following)[ ] buy in advance and store in inventory [ ] hedge against cost increases [ ] raise own prices in anticipation[ ] take no action
C11. If you take no action, why? (Choose all applicable) [ ] It would antagonize our customers. [ ] We are not confident in our forecasts or estimates. [ ] We are reluctant to take the lead in raising prices. [ ] We can easily raise prices when actually required.
Statement D: Firms would like to adjust prices more often to reflect market conditions, but fixed-price con-tracts make it difficult to pass on price increases when a contract is active.
C12. Does this statement apply to your firm?[ ] No [ ] Yes, slightly [ ] Yes, fairly [ ] Yes, very(Skip to Statement E) important important important
C13. Do contracts prevent prices from decreasing when demand or costs fall? [ ] Yes / [ ] No
C14. Do you offer discounts on posted contract prices? [ ] Yes / [ ] No
C15. What is the average period of time over which prices are fixed in contracts? ______________
C16. Is this period generally [ ] longer, [ ] shorter or [ ] the same, compared to 10 years ago?
Statement E: Firms delay price increases because they have an implied understanding with customers thatthey will not raise prices in tight markets.
C17. Does this statement apply to your firm?[ ] No [ ] Yes, slightly [ ] Yes, fairly [ ] Yes, very(Skip to Question C19) important important important
C18. Does the opposite hold true in weak markets (customers less likely to demand price concessions)? [ ] Yes / [ ] No
FINAL COMMENTSC19. Are there other compelling arguments as to why prices adjust slowly? (Choose all applicable)
[ ] It would be too costly to change prices more often (time, effort, out-of-pocket costs).[ ] Factors influencing prices do not change often enough to warrant changes.[ ] Prices could not change more often without disturbing customer relations.[ ] We are more likely to amend product characteristics (e.g. warranty, delivery lag) than prices.[ ] Low inflation makes large price changes more noticeable.
[ ] other _____________________________________________________________________________________
C20. Generally, are prices more difficult to adjust than they were a decade ago? [ ] Yes / [ ] No / [ ] I Don’t Know
If Yes, why? ___________________________________________________________________________________
C21. To what extent to your reponses regarding your main product also represent your other product lines?
[ ] Mostly representative [ ] Not representative [ ] Not applicable, company has only one product.

48
Appendix B
Recognition Rates of Price-Stickiness Theories by Firm Characteristic
This appendix reviews how firm characteristics, which were collected in Section A of the price-
setting survey questionnaire, influence the selection of a particular theory of price stickiness.
F-tests and t-tests were used to determine whether responses to a specific theory of price
stickiness were statistically different between groups of firms, each sharing a specific
characteristic.
Analysis was carried out across eight firm characteristics: industry sector, number of competitors,
buyer concentration, portion of sales to households, variable cost structure, export sales portion,
price reviewing behaviour, and size of firm. Thus, we tested, for example, whether the recognition
rates of smaller firms to a particular price theory were statistically different from those for larger
firms, or whether the response of firms with more competitors was different from those with fewer
competitors.
Of course, test results are sensitive to sample size and the number of groups. The larger the
number of groups, the smaller are the individual group sample sizes and the less successful are the
tests in identifying statistical differences between means that may appear to be quite large. It is
also important to realize that because this is a univariate analysis, there is always the possibility
that observed correlations may be due to a missing variable. Multivariate analysis will be used in
a subsequent paper to identify underlying causal relationships.

49
a.In
form
atio
nan
dcu
ltura
lind
ustr
ies,
and
tran
spor
tatio
nan
dw
areh
ousi
ngb.
Fina
nce,
insu
ranc
e,an
dre
ales
tate
c.B
usin
ess
and
pers
onal
serv
ices
,foo
dan
dac
com
mod
atio
nse
rvic
esd.
A tr
iple
ast
eris
k in
dica
tes
reje
ctio
n of
the
null
hypo
thes
is o
f eq
ual m
eans
at t
he 5
% le
vel.
A d
oubl
e as
teri
sk in
dica
tes
reje
ctio
n at
the
10%
leve
l.A
sin
gle
aste
risk
indi
cate
s re
ject
ion
at th
e 15
% le
vel.
e.Tw
o-sa
mpl
et-
test
ass
umin
g un
equa
l var
ianc
es. C
ritic
al v
alue
s co
rrec
ted
usin
g a
Bon
ferr
oni n
orm
aliz
atio
n.
Tabl
e B
.1:
Per
cent
age
Rec
ogni
tion
of
Pri
cing
The
ory
by I
ndus
try
The
ory
Who
lesa
mpl
e
Indu
stry
sec
tor
F-t
est
valu
e
Pro
babi
lity
of n
ova
riat
ion
Stat
isti
cally
sign
ifica
nt
diff
eren
cesd,
eC
ons.
n=17
Man
.n=
45T
rade
n=25
Info
.&
tran
sa
n=22
FIR
Eb
n=27
Serv
ices
c
n=34
(1)
(2)
(3)
(4)
(5)
(6)
Stic
ky in
form
atio
n13
.511
.822
.24.
00.
011
.120
.62.
00.
077
2&3*
**2&
4*4&
6*
Coo
rdin
atio
n fa
ilure
- f
allin
g pr
ices
31.2
23.5
28.9
36.0
31.8
40.7
26.5
0.5
0.80
6N
one
Coo
rdin
atio
n fa
ilure
- r
isin
g pr
ices
41.2
17.6
46.7
40.0
45.5
40.7
44.1
0.9
0.45
5N
one
Cos
t-ba
sed
pric
ing
67.1
76.5
75.6
68.0
68.2
44.4
67.6
1.7
0.13
52&
5**
Exp
licit
cont
ract
s45
.370
.642
.212
.063
.655
.541
.24.
40.
001
1&3*
**2&
3***
3&4*
**3&
5***
3&6*
*
Impl
icit
cont
ract
s31
.829
.440
.040
.013
.622
.235
.31.
40.
232
Non
e
Men
u co
sts
21.2
11.8
17.8
24.0
22.7
14.8
32.4
0.9
0.47
9N
one
Fact
ors
do n
ot c
hang
e31
.223
.515
.637
.050
.037
.038
.22.
20.
062
2&4*
**
Non
-pri
ce c
ompe
titio
n44
.147
.135
.640
.045
.559
.244
.10.
80.
544
Non
e
Cus
tom
er r
elat
ions
55.3
47.1
60.0
48.0
68.2
33.3
67.6
2.1
0.06
75&
6***
Low
infla
tion
33.5
23.5
31.1
40.0
54.5
22.2
32.4
1.5
0.20
3N
one
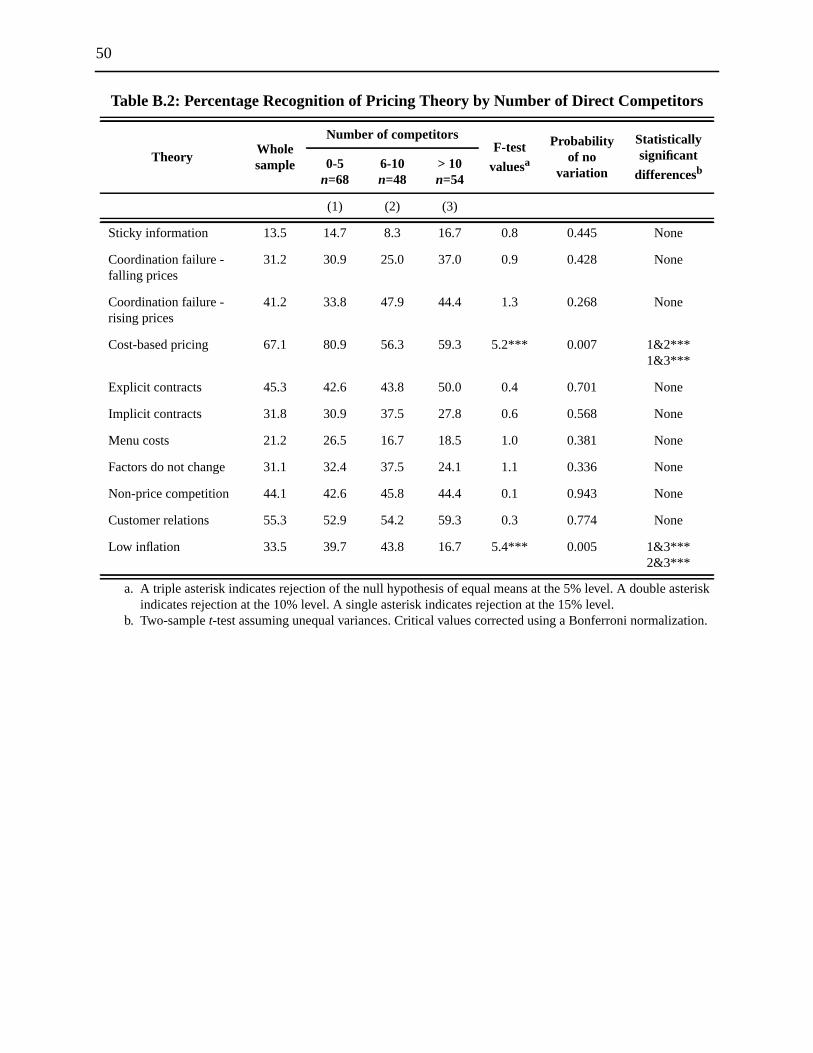
50
Table B.2: Percentage Recognition of Pricing Theory by Number of Direct Competitors
TheoryWholesample
Number of competitorsF-test
valuesa
a. A triple asterisk indicates rejection of the null hypothesis of equal means at the 5% level. A double asteriskindicates rejection at the 10% level. A single asterisk indicates rejection at the 15% level.
Probabilityof no
variation
Statisticallysignificant
differencesb
b. Two-sample t-test assuming unequal variances. Critical values corrected using a Bonferroni normalization.
0-5n=68
6-10n=48
> 10n=54
(1) (2) (3)
Sticky information 13.5 14.7 8.3 16.7 0.8 0.445 None
Coordination failure -falling prices
31.2 30.9 25.0 37.0 0.9 0.428 None
Coordination failure -rising prices
41.2 33.8 47.9 44.4 1.3 0.268 None
Cost-based pricing 67.1 80.9 56.3 59.3 5.2*** 0.007 1&2***1&3***
Explicit contracts 45.3 42.6 43.8 50.0 0.4 0.701 None
Implicit contracts 31.8 30.9 37.5 27.8 0.6 0.568 None
Menu costs 21.2 26.5 16.7 18.5 1.0 0.381 None
Factors do not change 31.1 32.4 37.5 24.1 1.1 0.336 None
Non-price competition 44.1 42.6 45.8 44.4 0.1 0.943 None
Customer relations 55.3 52.9 54.2 59.3 0.3 0.774 None
Low inflation 33.5 39.7 43.8 16.7 5.4*** 0.005 1&3***2&3***

51
Table B.3: Percentage Recognition of Pricing Theory by Buyer Concentration
TheoryWholesample
Share of sales accounted forby the 5 largest buyers
F-test
valuesa
a. A triple asterisk indicates rejection of the null hypothesis of equal means at the 5% level. A double asteriskindicates rejection at the 10% level. A single asterisk indicates rejection at the 15% level.
Probabilityof no
variation
Statisticallysignificant
differencesb
b. Two-sample t-test assuming unequal variances. Critical values corrected using a Bonferroni normalization.
> 50%n=40
10 -50%n=52
<10%n=78
(1) (2) (3)
Sticky information 13.5 12.5 15.4 12.8 0.1 0.896 None
Coordination failure -falling prices
31.2 37.5 34.6 25.6 1.1 0.346 None
Coordination failure -rising prices
41.2 37.5 44.2 41.0 0.2 0.812 None
Cost-based pricing 67.1 82.5 71.2 56.4 4.5*** 0.012 1&3***
Explicit contracts 45.3 70.0 48.1 30.8 9.07*** 0.000 1&2**2&3***
Implicit contracts 31.8 35.0 28.8 32.1 0.2 0.821 None
Menu costs 21.2 25.0 17.3 21.8 0.4 0.663 None
Factors do not change 31.1 30.0 26.9 34.6 0.4 0.644 None
Non-price competi-tion
44.1 35.0 40.4 51.3 2.1 0.130 None
Customer relations 55.3 55.0 59.6 52.6 0.3 0.734 None
Low inflation 33.5 27.5 38.5 33.3 0.4 0.688 None
Other 13.5 7.5 19.2 12.8 1.4 0.260 None
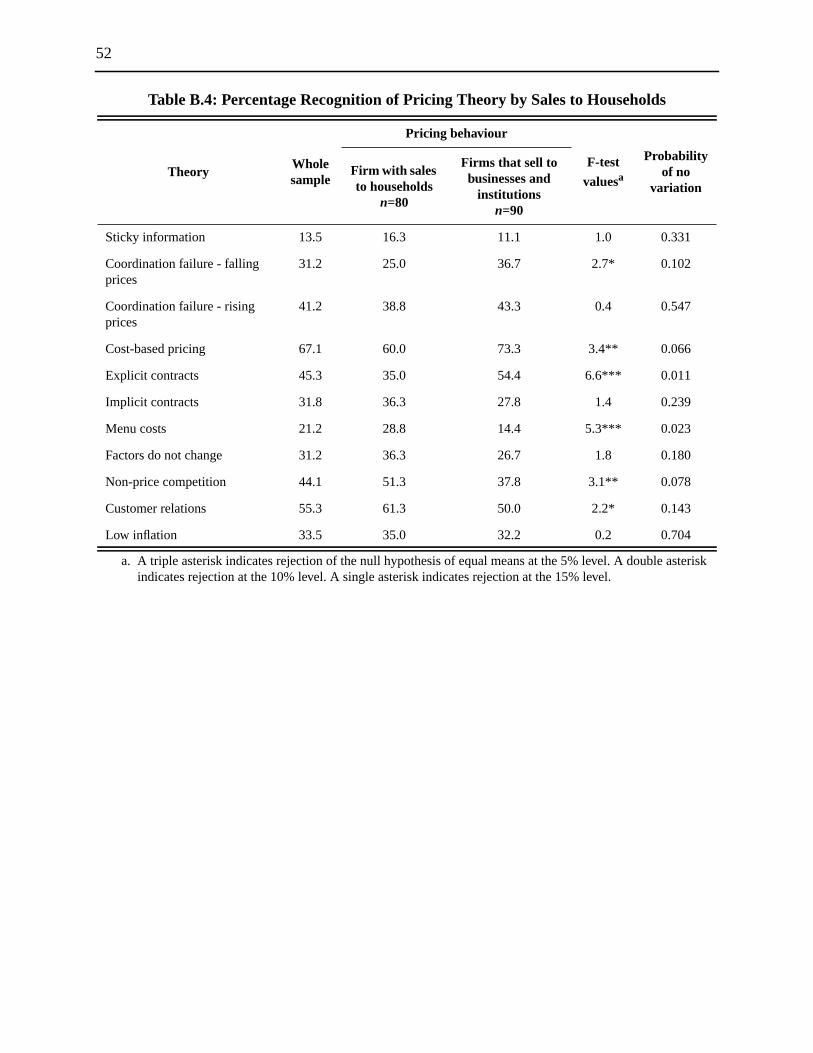
52
Table B.4: Percentage Recognition of Pricing Theory by Sales to Households
TheoryWholesample
Pricing behaviour
F-test
valuesa
a. A triple asterisk indicates rejection of the null hypothesis of equal means at the 5% level. A double asteriskindicates rejection at the 10% level. A single asterisk indicates rejection at the 15% level.
Probabilityof no
variationFirm with salesto households
n=80
Firms that sell tobusinesses and
institutionsn=90
Sticky information 13.5 16.3 11.1 1.0 0.331
Coordination failure - fallingprices
31.2 25.0 36.7 2.7* 0.102
Coordination failure - risingprices
41.2 38.8 43.3 0.4 0.547
Cost-based pricing 67.1 60.0 73.3 3.4** 0.066
Explicit contracts 45.3 35.0 54.4 6.6*** 0.011
Implicit contracts 31.8 36.3 27.8 1.4 0.239
Menu costs 21.2 28.8 14.4 5.3*** 0.023
Factors do not change 31.2 36.3 26.7 1.8 0.180
Non-price competition 44.1 51.3 37.8 3.1** 0.078
Customer relations 55.3 61.3 50.0 2.2* 0.143
Low inflation 33.5 35.0 32.2 0.2 0.704
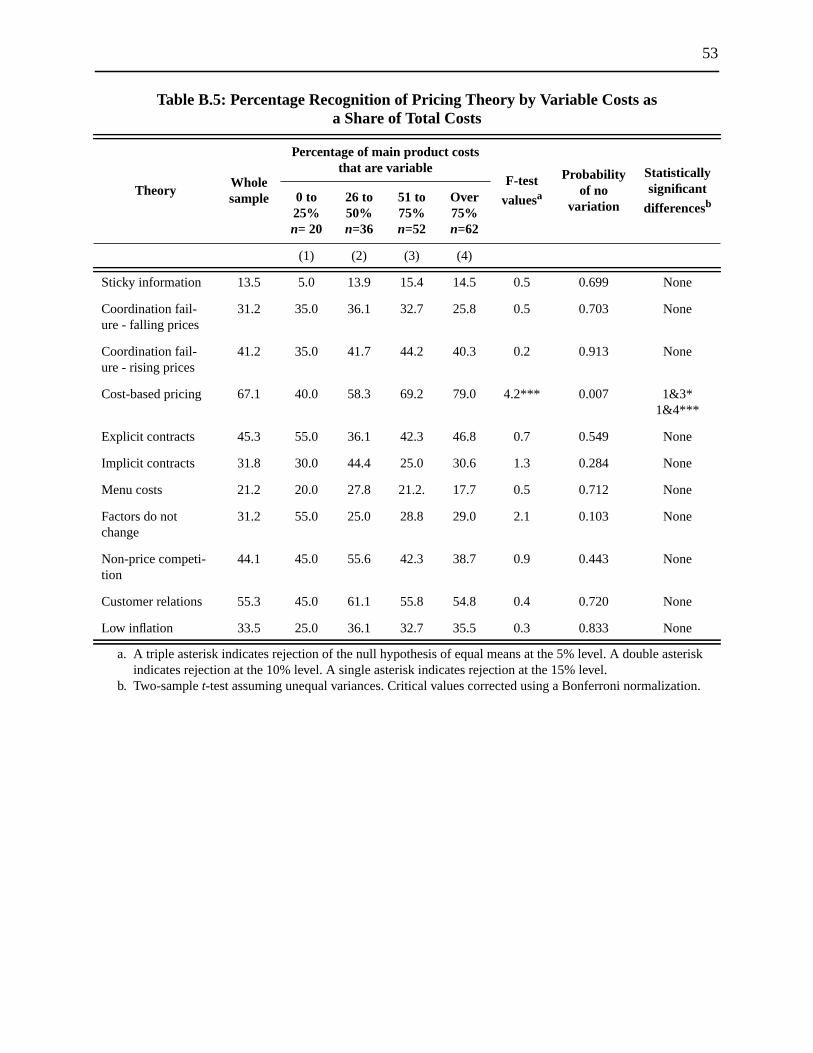
53
Table B.5: Percentage Recognition of Pricing Theory by Variable Costs asa Share of Total Costs
TheoryWholesample
Percentage of main product coststhat are variable
F-test
valuesa
a. A triple asterisk indicates rejection of the null hypothesis of equal means at the 5% level. A double asteriskindicates rejection at the 10% level. A single asterisk indicates rejection at the 15% level.
Probabilityof no
variation
Statisticallysignificant
differencesb
b. Two-sample t-test assuming unequal variances. Critical values corrected using a Bonferroni normalization.
0 to25%n= 20
26 to50%n=36
51 to75%n=52
Over75%n=62
(1) (2) (3) (4)
Sticky information 13.5 5.0 13.9 15.4 14.5 0.5 0.699 None
Coordination fail-ure - falling prices
31.2 35.0 36.1 32.7 25.8 0.5 0.703 None
Coordination fail-ure - rising prices
41.2 35.0 41.7 44.2 40.3 0.2 0.913 None
Cost-based pricing 67.1 40.0 58.3 69.2 79.0 4.2*** 0.007 1&3*1&4***
Explicit contracts 45.3 55.0 36.1 42.3 46.8 0.7 0.549 None
Implicit contracts 31.8 30.0 44.4 25.0 30.6 1.3 0.284 None
Menu costs 21.2 20.0 27.8 21.2. 17.7 0.5 0.712 None
Factors do notchange
31.2 55.0 25.0 28.8 29.0 2.1 0.103 None
Non-price competi-tion
44.1 45.0 55.6 42.3 38.7 0.9 0.443 None
Customer relations 55.3 45.0 61.1 55.8 54.8 0.4 0.720 None
Low inflation 33.5 25.0 36.1 32.7 35.5 0.3 0.833 None

54
Table B.6: Percentage Recognition of Pricing Theory by Export Sales
TheoryWholesample
Pricing behaviour
F-test
valuesa
a. A triple asterisk indicates rejection of the null hypothesis of equal means at the 5% level. A double asteriskindicates rejection at the 10% level. A single asterisk indicates rejection at the 15% level.
Probabilityof no
variation
Firms that exportless than 50% of
sales n=137
Firms that export50% or more of
salesn=33
Sticky information 13.5 12.4 18.2 0.8 0.387
Coordination failure -falling prices
31.2 32.8 24.2 0.9 0.341
Coordination failure -rising prices
41.2 43.8 30.3 2.0 0.159
Cost-based pricing 67.1 68.6 60.6 0.8 0.383
Explicit contracts 45.3 42.3 57.6 2.5* 0.11
Implicit contracts 31.8 30.7 36.4 0.4 0.530
Menu costs 21.2 23.4 12.1 2.0 0.158
Factors do not change 31.2 34.3 18.2 3.2** 0.073
Non-price competition 44.1 47.4 30.3 3.2** 0.076
Customer relations 55.3 56.2 51.5 0.2 0.629
Low inflation 33.5 36.5 21.2 2.8** 0.096

55
Table B.7: Percentage Recognition of Pricing Theory by Pricing Behaviour(State vs. Time Dependent)
TheoryWholesample
Pricing behaviour
F-test
valuesa
a. A triple asterisk indicates rejection of the null hypothesis of equal means at the 5% level. A doubleasterisk indicates rejection at the 10% level. A single asterisk indicates rejection at the 15% level.
Probabilityof no
variationState
dependentb
n=57
b. State-dependent firms are those that said they review pricing decisions either sporadically or inresponse to a specific event.
Time
dependentc
n=113
c. Time-dependent firms are those that said they review pricing decisions at regular time intervals(daily, weekly, monthly, quarterly, or annually).
Sticky information 13.5 17.5 11.5 1.2 0.280
Coordination failure - falling prices 31.2 31.6 31.0 0.0 0.936
Coordination failure - rising prices 41.2 42.1 40.7 0.0 0.862
Cost-based pricing 67.1 64.9 68.9 0.2 0.675
Explicit contracts 45.3 52.6 41.6 1.9 0.174
Implicit contracts 31.8 28.1 33.6 0.5 0.465
Menu costs 21.2 14.0 24.8 2.6* 0.107
Factors do not change 31.2 33.3 30.1 0.2 0.669
Non-price competition 44.1 36.8 47.8 1.8 0.177
Customer relations 55.3 45.6 60.2 3.3** 0.072
Low inflation 33.5 28.1 36.3 1.1 0.287

56
Table B.8: Percentage Recognition of Pricing Theory by Size of Firm
TheoryWholesample
Size of firmF-testvalues
Probabilityof no
variation
Statisticallysignificant
differencesa b
a. A triple asterisk indicates rejection of the null hypothesis of equal means at the 5% level. A double asteriskindicates rejection at the 10% level. A single asterisk indicates rejection at the 15% level.
b. Two-sample t-test assuming unequal variances. Critical values corrected using a Bonferroni normalization.
Smalln=54
Mediumn=48
Largen=68
(1) (2) (3)
Sticky information 13.5 20.4 6.3 13.2 2.2 0.115 1&2**
Coordination failure -falling prices
31.2 29.6 35.4 29.4 0.3 0.759 None
Coordination failure -rising prices
41.2 38.9 45.8 39.7 0.3 0.742 None
Cost-based pricing 67.1 74.1 66.7 61.8 1.0 0.360 None
Explicit contracts 45.3 35.2 58.3 44.1 2.8 0.062 1&2**
Implicit contracts 31.8 31.5 33.3 30.9 0.0 0.961 None
Menu costs 21.2 27.8 16.7 19.1 1.1 0.343 None
Factors do not change 31.1 38.9 20.8 32.4 2.0 0.142 1&2*
Non-price competi-tion
44.1 40.7 41.7 48.5 0.5 0.641 None
Customer relations 55.3 57.4 54.2 54.4 0.1 0.932 None
Low inflation 33.5 27.8 33.3 38.2 0.7 0.482 None

Bank of Canada Working PapersDocuments de travail de la Banque du Canada
Working papers are generally published in the language of the author, with an abstract in both officiallanguages, and are available on the Bank’s website (see bottom of page). Les documents de travail sontgénéralement publiés dans la langue utilisée par les auteurs; ils sont cependant précédés d’un résumé bilingue.On peut les consulter dans le site Web de la Banque du Canada, dont l’adresse est indiquée au bas de la page.
Copies and a complete list of working papers are available from:Pour obtenir des exemplaires et une liste complète des documents de travail, prière de s’adresser à :
Publications Distribution, Bank of Canada Diffusion des publications, Banque du Canada234 Wellington Street, Ottawa, Ontario K1A 0G9 234, rue Wellington, Ottawa (Ontario) K1A 0G9Telephone: 1 877 782-8248 Téléphone : 1 877 782-8248 (sans frais en (toll free in North America) Amérique du Nord)Email: [email protected] Adresse électronique : [email protected]: http://www.bankofcanada.ca Site Web : http://www.banqueducanada.ca
2006
2006-34 The Macroeconomic Effects of Non-Zero Trend Inflation R. Amano, S. Ambler, and N. Rebei
2006-33 Are Canadian Banks Efficient? A Canada–U.S. Comparison J. Allen, W. Engert, and Y. Liu
2006-32 Governance and the IMF: Does the Fund Follow Corporate Best Practice? E. Santor
2006-31 Assessing and Valuing the Non-Linear Structure ofHedge Fund Returns A. Diez de los Rios and R. Garcia
2006-30 Multinationals and Exchange Rate Pass-Through A. Lai and O. Secrieru
2006-29 The Turning Black Tide: Energy Prices andthe Canadian Dollar R. Issa, R. Lafrance, and J. Murray
2006-28 Estimation of the Default Risk of Publicly TradedCanadian Companies G. Dionne, S. Laajimi, S. Mejri, and M. Petrescu
2006-27 Can Affine Term Structure Models Help Us Predict Exchange Rates? A. Diez de los Rios
2006-26 Using Monthly Indicators to Predict Quarterly GDP I.Y. Zheng and J. Rossiter
2006-25 Linear and Threshold Forecasts of Output and Inflationwith Stock and Housing Prices G. Tkacz and C. Wilkins
2006-24 Are Average Growth Rate and Volatility Related? P. Chatterjee and M. Shukayev
2006-23 Convergence in a Stochastic Dynamic Heckscher-Ohlin Model P. Chatterjee and M. Shukayev
2006-22 Launching the NEUQ: The New European Union Quarterly Model,A Small Model of the Euro Area and the U.K. Economies A. Piretti and C. St-Arnaud
2006-21 The International Monetary Fund’s Balance-Sheet and Credit Risk R. Felushko and E. Santor
2006-20 Examining the Trade-Off between Settlement Delay and IntradayLiquidity in Canada’s LVTS: A Simulation Approach N. Arjani
2006-19 Institutional Quality, Trade, and the Changing Distributionof World Income B. Desroches and M. Francis
2006-18 Working Time over the 20th Century A. Ueberfeldt