balkans and regional energy market partnership program ... res report final... · balkans and...
TRANSCRIPT
Balkans and Regional Energy Market Partnership Program: Renewables Integration in the Black Sea Regional Transmission System Network Black Sea Regional Transmission Planning Project Phase III Cooperative Agreement EEE-A-02-00054-00
September 30, 2012 This report made possible by the support of the American people through the United States Agency for International Development (USAID). The contents are the responsibility of the United States Energy Association and do not necessarily reflect the views of USAID or the United States Government.

Balkans and Regional Energy Market Partnership Program
Renewables Integration to Transmission Network SUMMARY
Black Sea Regional Transmission Planning Project Phase III
Prepared for:
United States Agency for International Development and United States Energy Association
Cooperative Agreement EEE-A-02-00054-00
United States Energy Association 1300 Pennsylvania Avenue, NW
Suite 550, Mailbox 142 Washington, DC 20004 +1 202 312-1230 (USA)
This report is made possible by the support of the American people through the United States Agency for International Development (USAID). The contents are the responsibility of the United States Energy Association and do not necessarily reflect the views of USAID or the United States Government.

AABBBBRREEVVIIAATTIIOONNSS General TSO - Transmission System Operator TEN-E - Trans-European Energy Networks CIGRÉ – International Council on Large Electric Systems UCTE - Union for the Coordination of Transmission of Electricity ENTSO/E – European Network of Transmission System Operators for Electricity (former UCTE) ACER - Agency for the Cooperation of Energy Regulators NRA - National Regulatory Authority or Agency IEM - Internal Energy Market REM - Regional Energy Market LOLE - Loss of Load Expectation SAF - System Adequacy Forecast SoS - Security of Supply VOLL - Value of Lost Load ETS - Emission Trading System EWIS - European Wind Integration Study CENTREL - Association of TSOs of Czech Republic, Hungary, Poland and Slovakia SEE - South East Europe SECI - South East European Cooperation Initiative BSTP - Black Sea Transmission Project FIT - feed-in tariff LF - Load flow OPF - Optimal power flow FGC, UNEG – Federal Grid Company, Unified National Electric Grid IPS/UPS – Interregional Power System/Unified Power System Transmission AC - Alternating Current DC - Direct Current HV - High Voltage MV - Medium Voltage LV - Low Voltage HVAC - High Voltage AC HVDC - High Voltage DC EMF - Electromagnetic Field ED - Electricity Distribution SS – Substation OHL - Overhead Lines UC - underground cable SC - submarine cable TR - Transformer OLTC – On Load Tap Changer PST - Phase Shifting Transformer SCR – Short Circuit Ratio ESCR – Effective Short Circuit Ratio
3

CCT – Critical Clearing Time LCC - Line Commutated Converter FACTS - Flexible AC Transmission System VSC - Voltage Source Converter STATCOM – Static Synchronous Compensator NTC - Net Transfer Capacity TTC - Total Transfer Capacity TRM - Transmission Reliability Margin RC - Remaining Capacity RAC - Reliable Available Capacity Generation HPP – Hydro Power Plant PHPP – Pumping Hydro Power Plant TPP – Thermal Power Plant NPP - Nuclear Power Plant CCGT - Combined cycle gas turbine CCS - Carbon Capture and Storage CHP - Combined Heat and Power Generation RES - Renewable Energy Sources NGC - Net Generation Capacity VAR - Volt-Ampere-Reactive, reactive power BTU - British Thermal Unit = 1055J = 0.293Wh = 252cal, mBTU = 1000000BTU tcm - thousand cubic meter 1000m3
RGC – Regional Generation Company TGC - Territorial Generation Company WGC – Wholesale Generation Company Countries ISO Country Car Austria AT AUT A Albania AL ALB AL Bosnia and Herzegovina BA BIH BiH Bulgaria BG BUL BG Croatia HR CRO CRO Germany DE GER D Greece GR GRE GR Hungary HU HUN HU Italy IT ITA I FYR of Macedonia MK FYRM MAK Montenegro ME MNE MNE Romania RO ROM ROM Serbia RS SRB SRB Slovenia SI SLO SLO Switzerland CH SUI CH Turkey TR TUR TUR Ukraine UA UKR UKR
4

Armenia AM ARM ARM Georgia GE GEO GEO Moldova MD MLD MLD Russia RU RUS RUS Azerbaijan AZ AZB AZB Belorussia BY BLR BLR
5

1 INTRODUCTION The Black Sea Regional Transmission System Planning Project (BSTP) was established by the United States Agency for International Development, the United States Energy Association and the transmission system operators of the Black Sea region in 2004 to build institutional capacity to develop and analyze the region’s first common transmission planning model. Members of the project working group represent the transmission system operators (TSO) of Armenia, Bulgaria, Georgia, Moldova, Romania, Russia, Ukraine and Turkey. The Power System Simulator for Engineers (PSS/E) software was selected as the common planning software platform for the project. The project supplied each TSO with the software and has provided ongoing training in its use and application to build capacity in the region to construct national and regional models of the Black Sea high voltage electric power transmission network. The BSTP Working Group developed the first detailed national and regional load flow and dynamic models of the high voltage network for the 2010, 2015 and 2020 planning horizons. These models are used to identify bottlenecks to regional trade of electricity; model the impact of the transmission network on energy security initiatives; determine the potential to integrate renewable energy resources; and identify network investment requirements. BSTP system operators report they are expected to incorporate large quantities of renewable energy in the form of wind, hydroelectric and solar generators in the medium and long-term planning horizons. The addition of this capacity will change the planning and operational parameters of national and regional transmission networks. During this phase of the BSTP, the models have been updated to include a more accurate simulation of the renewable energy resources to be added to the network in 2015 and 2020. To develop the estimates on a country-by-country basis, each TSO completed a questionnaire on national renewable energy policies; regulations; renewable energy development plans, tariffs and other fiscal incentives for renewable energy; connection procedures; and critical issues effecting the integration of intermittent renewable energy resources. The detailed information for each country has been published in the Renewables Integration to Transmission System full report. The more accurate estimates of new renewable capacity added to the network in 2015 and 2020 gained from the surveys have been utilized by the newly created PSS/E Optimal Power Flow (OPF) regional model. The PSSE/OPF model, which takes into account generation capacity projections, national energy policy, tariffs and other incentives, provides the Working Group with the region’s first transmission constrained optimized dispatch models of the national and regional power systems. The optimized models test the security and reliability of the regional network using economically based scenarios for cross border trade of reserve capacity. This report complements the PSSE/OPF Regional Model Construction Report, also a product of this third phase of the project. These two reports are intended to provide policy makers, regulators, investors, and international financial institutions with a snapshot of the renewable energy policies, plans, incentive schemes, and interconnection issues within the systems of each of the Black Sea transmission system operators.
6

2 PSSE/OPF MODEL DEVELOPMENT The Optimum Power Flow (OPF) feature of the PSS/E software is a powerful tool that all TSOs in the region use for transmission planning and to facilitate market based analysis.. OPF solves optimization problems involving system operational costs, losses, system performance, system exchange opportunities and congestion management. It is important to understand that PSS/E and OPF are tools that study one snapshot hour at a time and that these study results are for a winter peak load hour and a summer peak load hour in 2015. The OPF regional model has been used in this project to calculate average generation costs in each country and to optimize those costs under various synchronous scenarios. OPF automatically adjusts the participating machines’ active power generation, within capability limits, to reduce the total variable cost. The first stage of model construction was to build national OPF models using generic cost curves. Each TSO tested their own national model and made adjustments so that modeling results corresponded to real system behavior. When all national models were tested and approved by the TSOs, a regional OPF model was constructed by integrating the national models into one regional model. This regional model was used to produce the study results presented in this report. Complete details regarding the development and utilization of OPF models for 2015 in the BSTP project are presented in the PSSE/OPF Regional Model Construction Report. 3 WIND INTEGRATION STUDY METHODOLOGY The objective of this study is to determine the impact on the regional transmission systems if a worse case simultaneous loss of wind occurred over a wide area of wind production. Proposed scenarios have been selected based on actual measured values of wind in the selected areas and the operational experience of the TSOs. It is understood that wind is normally dispersed over wide areas so that sudden loss of wind in that large area is not expected. However, the areas selected in the following scenarios could (and often do) share the same weather and wind conditions and represent large wind generation capacity and, in a worse case, could occur. The following loss of wind regional scenarios have been analyzed:
1. Romania and Bulgaria simultaneous loss of wind production in the region of Dobruja in the amount of 2,345 MW
2. Turkey simultaneous loss of wind production in the Cesme region in the amount of 460 MW 3. Ukraine simultaneous loss of wind production in the Crimea region in the amount of 1,150 MW
As Figure 3.1 below illustrates, two synchronous modes were investigated; (1) ENTSO-E and IPS/UPS systems split and (2) ENTSO-E and IPS/UPS systems operating in a parallel mode. The split option (1) is similar to the way the region operates today except that Armenia has been added to the IPS/UPS synchronous mode. The combined parallel mode option (2) is not considered a realistic mode for synchronous operation in the study year of 2015 but, is studied in this way to provide insights into where future interconnections could facilitate the trading of reserves and reduce costs.
7

uss a
Georgia
Azerbajan
Bulgaria
Greece
Romania
Turkey
Ukraine
Iraq
Syria
Black Sea
Moldova
Armenia
uss a
Georgia
Azerbajan
Bulgaria
Greece
Romania
Turkey
Ukraine
Iraq
Syria
Armenia
Black Sea
Moldova
(1) Split (2) parallel
Figure 3.1 – Black Sea region – synchronous operation modes for analyses These studies were performed in three steps as follows: Step I Simulation In this first simulation step, the levels of wind power plant production is increased to full capacity in the PSSE/OPF regional model for 2015 summer and winter maximum hour load conditions for each of the three wind loss regions. The assumption is made that this maximum wind production is forecasted in the generation plan the day before and so in order to maintain the balance for each area, production at traditional power plants is decreased according to a priority list provided by the TSO responsible for the region. This model then becomes the starting point for a sudden loss of wind from maximum wind power plant capacity to zero wind production. These new models were then analyzed from the security point of view using the n-1 security criterion. Then, the OPF feature of the PSS/E software is utilized to determine the total cost of production for this Step I Simulation in each region and these calculated production costs, based on TSO input without the benefit of the OPF models, become the base case for comparison in simulation steps II and III. Step II Simulation Using the new models created in Step I, the sudden loss of wind in each of the selected regions is implemented using the INLF option of PSS/E to calculate Inertial Power Flows and Governor Power Flows. Because steady-state solutions do not account for conditions in the power system immediately following a disturbance such as a system change that modifies the power balance (like a sudden loss of wind) that would be redistributed among all other generators, this analysis comprises two power flow solutions with inertia/governor re-dispatch to enable examination of system conditions and revision of generator dispatch for the conditions in which the machine inertia plays the major role in modifying generator output or in which governors play the major role.
8

Inertial Power Flow solution gives a quick approximation of system effects in the first 0.5 seconds following a disturbance, during which governor effects are minimal. Generator power is principally influenced by machine inertias. Inertial response is the inherent response of synchronized generators to changes in the system frequency. A generator or load can be considered to contribute to system inertia if a change in system frequency causes a change in its rotational speed and thus its kinetic energy. The power associated with this change in kinetic energy is fed to or taken from the power system and is known as the inertial response. Governor Response solution represents the system several seconds after an event when governors and exciters have brought the system back to steady-state. The new generator powers are determined by governor droop and load damping characteristics This step II simulation will quantify the needed reserve capacity on interconnection lines to cover this sudden loss of wind. Step III Simulation This third step will further utilize the PSSE/OPF models to analyze various tertiary reserve actions after optimizing production in each of the three regions in both the Split Synchronous Mode and the Parallel Synchronous Mode. In this step the study will determine if the lost wind generation can be provided from within the observed region or can be imported and where the imports would come from. These various generation patterns will then be compared from an economic point of view using PSSE/OPF. 4 LOSS OF WIND IN THE DOBRUJA REGION The installed power of WPPs in the Dobruja region as a whole, including the Bulgarian and Romanian portion of Dobruja, in 2015 is predicted to be 2,345 MW. The portion of this total that is in Bulgaria is 765 MW and the portion in Romania is 1,580 MW. The majority of WPPs are connected to 110 kV substations but the largest plants utilize 400/110 kV transformers to use the 400 kV transmission system and avoid congestion on the 110 kV network. In the Dobruja region study the wind power is increased to its maximum and the most expensive generators in Bulgaria and Romania reduce production in order to maintain the balance for the regimes of winter and summer maximum loads. According to the list of power plants in Bulgaria and their production cost in $/MWh, one 320 MW unit in TPP Galabovo has been switched off and another unit decreased its production. Production cost at the TPP Galabovo power plant is 83.9 $/MWh. In Romania, two units of the TPP Rovinari power plant (2 x 330 MW) and one unit of the TPP Turceni (1 x 330MW) have been switched off. Production cost for these power plants is 74.3 $/MWh. Winter Regime Figure 4.1 below shows total power flows on interconnection lines before and after the simulated disturbance. Since Bulgaria and Romania are exporting countries with each having a modeled excess of 1,000 MW, the power flows before the outage are exports to neighboring countries. A PSS/E analysis of these power flows before the sudden loss of wind confirms that no overloads occur in the Dobruja region under these conditions.
9

Figure 4.1– Total border power flows before and after wind outage – Dobruja Winter maximum 2015
After the 2,345 MW sudden loss of wind outage (0.5 second after the disturbance) in the Dobruja region, all synchronized generators in ENTSO-E interconnection will respond according to inertias and then, several seconds after the event, governors participating in primary reserve will bring the system back to steady-state. The Inertial power flow solution shows that this outage causes significant frequency drop in the first 500ms, indicating the severity of this incident. It can be concluded that this sudden loss of wind will activate primary reserves within ENTSO-E interconnection. Table 4.1 shows total balances for Romania, Bulgaria, Turkey and the rest of ENTSO-E before and after the outage (after inertial/governor redispatch) and the contribution for covering the balance disruption from each country or region. It can be concluded that contribution from Bulgaria and Romania is approximately 120 MW, 5.2% of total outage, while the contribution of Turkey is approximately 10% of lost power in Dobruja region. The rest of the lost power is being supplied from the rest of ENTSO. A PSS/E analysis of these power flows after the sudden loss of wind confirms that no overloads occur in the Dobruja region.
Table 4.1– Total balances before and after wind outage in Bulgaria and Romania
Balance before outage [MW]
Wind outage [MW]
Balance after inertial/governor redispatch
[MW]
Contribution for covering disbalance
[%]Bulgaria 1000 765 295 2.6%Romania 1000 1580 -518 2.6%Turkey -850 -622 9.7%rest of ENTSO-E -1150 845 85.1% From the values of total power flows on interconnectors after the observed outage (figure 4.1), it can be seen that power flows have significantly changed considering power quantities and direction. This is
10

particularly true on interconnectors between Romania and Hungary, Romania and Serbia and Romania and Ukraine as a consequence of primary reserve activation in rest of ENTSO-E. The imbalance of the power systems of Romania and Bulgaria must be covered with balancing reserve utilizing a combination of the following two approaches, depending on the market price value, available cross-border capacities and severity of disturbance (amount of lost power): Activation of balancing reserve which is kept inside of the country - fixed share of 50 % of the
total needed secondary and tertiary control reserve must be kept inside the control area according to the ENTSO-E Policy 1. The size of the total reserve must match the size of the largest possible generation incident (e.g. generation units or sets, HVDC-links, power infeed on single bus-bars).
Activation of balancing reserve which is kept outside of the observed countries on a regional balancing market, considering that sufficient transmission capacity must be allocated between Bulgaria or Romania and those TSOs supplying the reserves.
The following three balancing scenarios have been compared in order to analyze the advantages of interconnections and a potential decrease of balancing energy costs: Balancing scenario 1 - Balancing energy for wind outage is purchased in Bulgaria and
Romania. Balancing price is estimated based on average production costs of all units engaged for covering the imbalance, obtained from OPF calculations.
Balancing scenario 2 - Balancing energy from ENTSO-E (Split Synchronous Assumption). Wind outage is covered within the modeled ENTSO-E (Turkey, Bulgaria and Romania) based on the minimum production cost criteria. The balancing price is then calculated based on average production costs of all units engaged for covering the imbalance as an obtained solution from OPF.
Balancing scenario 3 - Balancing energy from interconnected Black Sea region (Parallel Synchronous Assumption). Wind outage is covered within synchronized Black Sea region based on the minimum production cost criteria. Price is estimated based on average production costs of all units engaged for covering the imbalance as a solution from OPF calculation
In the following Figure 4.2, the balancing energy price, estimated as an average production cost in an optimized power flow solution after the observed wind outage, has been compared for the three balancing scenarios.
Figure 4.1 – Comparison of balancing energy price for different balancing scenarios – Dobruja Winter maximum
2015 11

Scenario 1 assumes that balancing energy, after the wind outage, is purchased on the domestic market (Romania and Bulgaria), while scenario 2 assumes that a regional balancing market is established between Romania, Bulgaria and Turkey. Due to higher balancing energy prices in Turkey, as determined using an OPF analysis, no significant change of energy price occurs in scenario 2. In the third scenario, the balancing price has been decreased approximately 16% because of the engagement of lower cost production units in the Black Sea region to cover the observed wind outage. It must be emphasized that sufficient capacity must be allocated in order to activate balancing reserve on a regional level. This capacity is allocated for the TSO through the transmission reliability margin (TRM). According to the analyses performed by the SEE TSOs within the Regional Balancing Market (RBM BETSEE) project and as noted in the ETSO document 'SETSO Task Force, Sub Group Balance Management, Regional Balancing Mechanism BETSEE for South-East Europe, Examination Paper', on pages 9 and 10: The only feasible solution for providing the cross-border capacity to the RBM is to use the
unused capacity (not allocated one, and/or allocated but not nominated one) after the last auction round (day-ahead or intra-day)
This capacity would be provided to the balancing market users on the first-come-first-served principle (continuous trading)
Within the SEE process, it is considered that there would be no congestion pricing for such capacity.
Summer Regime Figure 4.3 shows power flows on interconnection lines before and after the simulated disturbance. Similar to the winter regime, about 85% of lost power in the Dobruja region is being compensated from the rest of ENTSO-E. In both cases of before and after the outage, there are no overloads in the network.
Figure 4.2 – Power flows in Dobruja region and on interconnectors before outage– Dobruja Summer maximum
2015
12
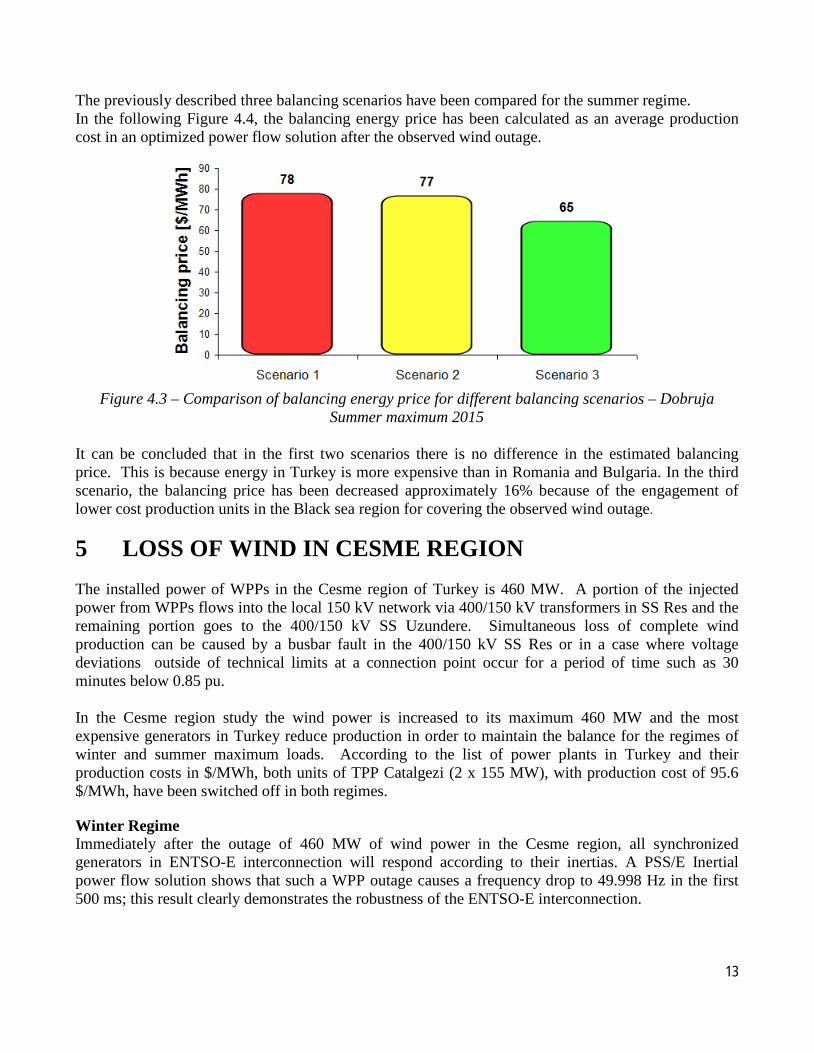
The previously described three balancing scenarios have been compared for the summer regime. In the following Figure 4.4, the balancing energy price has been calculated as an average production cost in an optimized power flow solution after the observed wind outage.
Figure 4.3 – Comparison of balancing energy price for different balancing scenarios – Dobruja
Summer maximum 2015 It can be concluded that in the first two scenarios there is no difference in the estimated balancing price. This is because energy in Turkey is more expensive than in Romania and Bulgaria. In the third scenario, the balancing price has been decreased approximately 16% because of the engagement of lower cost production units in the Black sea region for covering the observed wind outage.
5 LOSS OF WIND IN CESME REGION The installed power of WPPs in the Cesme region of Turkey is 460 MW. A portion of the injected power from WPPs flows into the local 150 kV network via 400/150 kV transformers in SS Res and the remaining portion goes to the 400/150 kV SS Uzundere. Simultaneous loss of complete wind production can be caused by a busbar fault in the 400/150 kV SS Res or in a case where voltage deviations outside of technical limits at a connection point occur for a period of time such as 30 minutes below 0.85 pu. In the Cesme region study the wind power is increased to its maximum 460 MW and the most expensive generators in Turkey reduce production in order to maintain the balance for the regimes of winter and summer maximum loads. According to the list of power plants in Turkey and their production costs in $/MWh, both units of TPP Catalgezi (2 x 155 MW), with production cost of 95.6 $/MWh, have been switched off in both regimes. Winter Regime Immediately after the outage of 460 MW of wind power in the Cesme region, all synchronized generators in ENTSO-E interconnection will respond according to their inertias. A PSS/E Inertial power flow solution shows that such a WPP outage causes a frequency drop to 49.998 Hz in the first 500 ms; this result clearly demonstrates the robustness of the ENTSO-E interconnection.
13

Table 5.1 below shows the total balances for Turkey, Bulgaria, Romania and the rest of ENTSO-E before and after the sudden loss of wind (after inertial/governor redispatch) and the contribution for covering the imbalance from each country or region. It can be concluded that approximately 90% of lost power in Turkey is being compensated from the rest of ENTSO. This information is important when determining the Transmission Reliability Margin (TRM) in the NTC calculation procedure pertaining to the borders of Bulgaria-Turkey and Greece-Turkey.
Table 5.1 – Total balances before and after wind outage in Turkey
Balance before outage [MW]
Wind outage [MW]
Balance after inertial/governor redispatch
[MW]
Contribution for covering disbalance
[%]Turkey -850 460 -1262 10.4%Bulgaria 1000 1002 0.4%Romania 1000 1030 6.5%rest of ENTSO-E -1150 -770 82.6% Figure 5.1 below shows power flows on three interconnection lines between the rest of ENTSO-E and Turkey before and after the simulated disturbance in the network as well as the total transfer flow on the Turkish border. Power flows are being compared to total transfer flows of 1600 MW, which is a maximum total transfer flow towards Turkey according to the calculated NTC values for winter maximum 2015.
Figure 5.1– Power flows on interconnection between Turkey and rest of ENTSO-E – Cesme Winter maximum
2015 The imbalance of the power systems of Turkey must be covered with balancing reserve utilizing a combination of the following two approaches, depending on the market price value, available cross-border capacities and severity of disturbance (amount of lost power): Activation of balancing reserve which is kept inside of Turkey - fixed share of 50 % of the total
needed secondary and tertiary control reserve must be kept inside the control area according to the ENTSO-E Policy 1. The size of the total reserve must match the size of the largest possible
14
generation incident (e.g. generation units or sets, HVDC-links, power infeed on single bus-bars).
Activation of balancing reserve which is kept outside of Turkey on a regional balancing market, considering that sufficient transmission capacity must be allocated between Turkey and those TSOs supplying the reserves.
Again, the following three scenarios have been compared in order to analyze the advantages of interconnections and a potential decrease of balancing energy prices: Balancing scenario 1 - Balancing energy for wind outage is purchased in Turkey.
Balancing price is estimated based on average production costs of all units engaged for covering the imbalance, obtained from OPF calculations.
Balancing scenario 2 - Balancing energy from ENTSO-E (Split Synchronous Assumption). The wind outage is covered within the modeled ENTSO-E (Turkey, Bulgaria and Romania) based on the minimum production cost criteria. The balancing price is then calculated based on average production costs of all units engaged for covering the imbalance as an obtained solution from OPF.
Balancing scenario 3 - Balancing energy from interconnected Black Sea region (Parallel Synchronous Assumption). The wind outage is covered within the synchronized Black Sea region based on the minimum production cost criteria. Price is estimated based on average production costs of all units engaged for covering the imbalance as a solution from OPF calculation
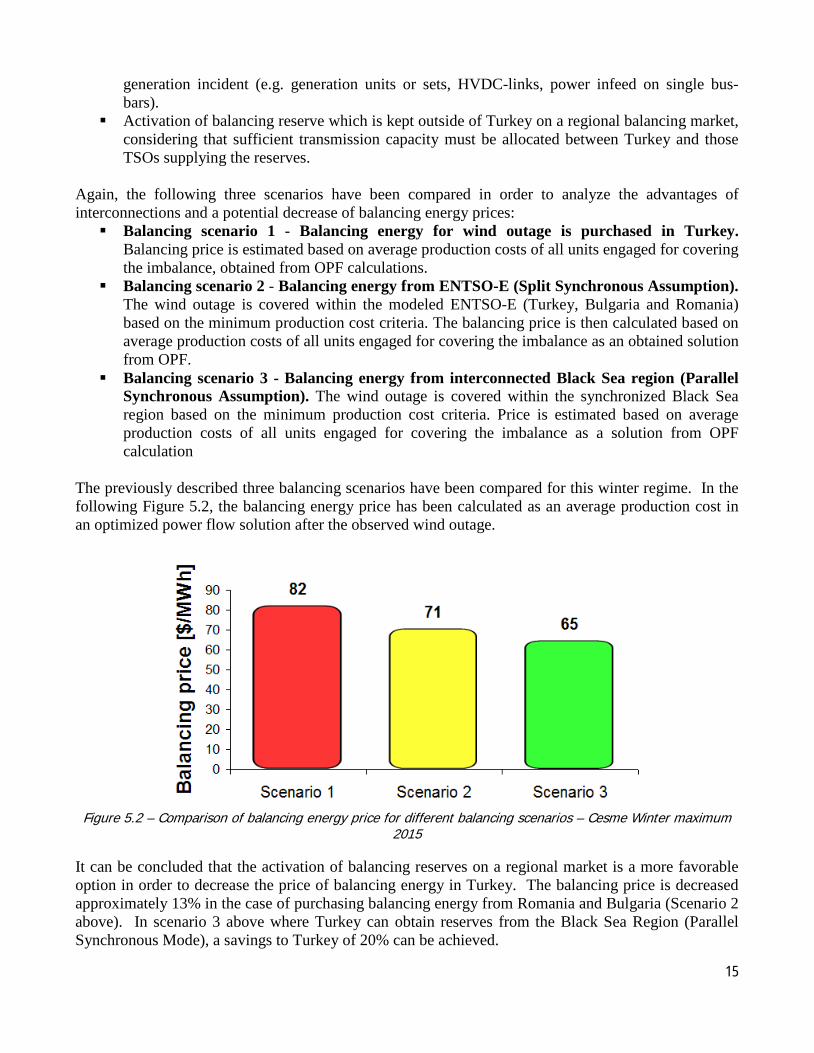
The previously described three balancing scenarios have been compared for this winter regime. In the following Figure 5.2, the balancing energy price has been calculated as an average production cost in an optimized power flow solution after the observed wind outage.
Figure 5.2 – Comparison of balancing energy price for different balancing scenarios – Cesme Winter maximum
2015 It can be concluded that the activation of balancing reserves on a regional market is a more favorable option in order to decrease the price of balancing energy in Turkey. The balancing price is decreased approximately 13% in the case of purchasing balancing energy from Romania and Bulgaria (Scenario 2 above). In scenario 3 above where Turkey can obtain reserves from the Black Sea Region (Parallel Synchronous Mode), a savings to Turkey of 20% can be achieved.
15

Summer Regime Figure 5.3 below shows power flows on three interconnection lines between ENTSO-E and Turkey before and after the simulated disturbance in the network. Much like in the winter regime, approximately 90% of the lost power in Turkey is being compensated from the rest of ENTSO-E.
Figure 5.3– Power flows on interconnection lines between Turkey and rest of ENTSO-E before and after outage-
Cesme Summer maximum 2015 The previously described three balancing scenarios have been compared for this summer regime. In the following Figure 5.4, the balancing energy price has been calculated as an average production cost in an optimized power flow solution after the observed wind outage.
Figure 5.4– Comparison of balancing energy price for different balancing scenarios – Cesme Summer maximum
2015 It can be concluded that the activation of balancing reserves on a regional market is a more favorable option in order to decrease the price of balancing energy in Turkey. The balancing price is decreased
16
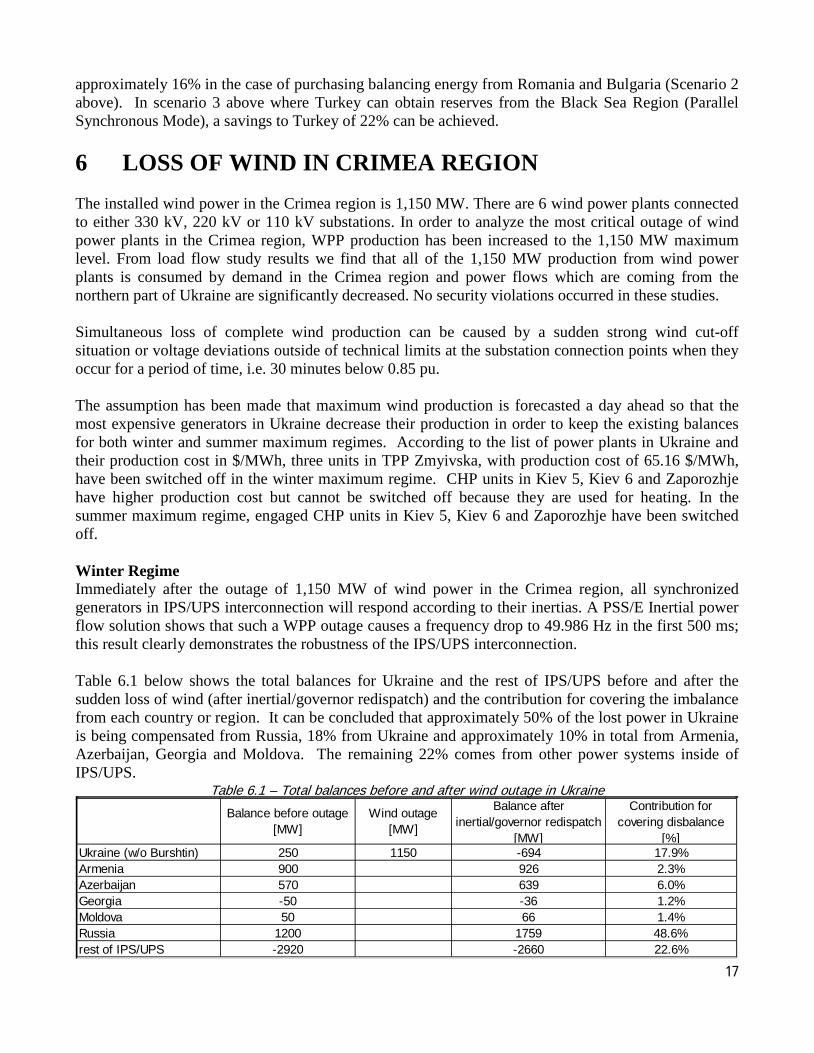
approximately 16% in the case of purchasing balancing energy from Romania and Bulgaria (Scenario 2 above). In scenario 3 above where Turkey can obtain reserves from the Black Sea Region (Parallel Synchronous Mode), a savings to Turkey of 22% can be achieved. 6 LOSS OF WIND IN CRIMEA REGION The installed wind power in the Crimea region is 1,150 MW. There are 6 wind power plants connected to either 330 kV, 220 kV or 110 kV substations. In order to analyze the most critical outage of wind power plants in the Crimea region, WPP production has been increased to the 1,150 MW maximum level. From load flow study results we find that all of the 1,150 MW production from wind power plants is consumed by demand in the Crimea region and power flows which are coming from the northern part of Ukraine are significantly decreased. No security violations occurred in these studies. Simultaneous loss of complete wind production can be caused by a sudden strong wind cut-off situation or voltage deviations outside of technical limits at the substation connection points when they occur for a period of time, i.e. 30 minutes below 0.85 pu. The assumption has been made that maximum wind production is forecasted a day ahead so that the most expensive generators in Ukraine decrease their production in order to keep the existing balances for both winter and summer maximum regimes. According to the list of power plants in Ukraine and their production cost in $/MWh, three units in TPP Zmyivska, with production cost of 65.16 $/MWh, have been switched off in the winter maximum regime. CHP units in Kiev 5, Kiev 6 and Zaporozhje have higher production cost but cannot be switched off because they are used for heating. In the summer maximum regime, engaged CHP units in Kiev 5, Kiev 6 and Zaporozhje have been switched off. Winter Regime Immediately after the outage of 1,150 MW of wind power in the Crimea region, all synchronized generators in IPS/UPS interconnection will respond according to their inertias. A PSS/E Inertial power flow solution shows that such a WPP outage causes a frequency drop to 49.986 Hz in the first 500 ms; this result clearly demonstrates the robustness of the IPS/UPS interconnection. Table 6.1 below shows the total balances for Ukraine and the rest of IPS/UPS before and after the sudden loss of wind (after inertial/governor redispatch) and the contribution for covering the imbalance from each country or region. It can be concluded that approximately 50% of the lost power in Ukraine is being compensated from Russia, 18% from Ukraine and approximately 10% in total from Armenia, Azerbaijan, Georgia and Moldova. The remaining 22% comes from other power systems inside of IPS/UPS.
Table 6.1 – Total balances before and after wind outage in Ukraine
Balance before outage [MW]
Wind outage [MW]
Balance after inertial/governor redispatch
[MW]
Contribution for covering disbalance
[%]Ukraine (w/o Burshtin) 250 1150 -694 17.9%Armenia 900 926 2.3%Azerbaijan 570 639 6.0%Georgia -50 -36 1.2%Moldova 50 66 1.4%Russia 1200 1759 48.6%rest of IPS/UPS -2920 -2660 22.6%
17

Figure 6.1 below shows loadings of OHLs between the rest of the Ukraine and Crimea region before and after the simulated disturbance when generators change their engagements according to the set governors droop. It can be seen that all OHLs towards Crimea have significantly changed their loadings, but without any overloading occurring. Also, there are no overloading on tie-lines between Ukraine and the rest of IPS/UPS.
Figure 6.1– Loadings of OHLs between rest of Ukraine and Crimea – Crimea Winter maximum 2015
As in the other cases studied, the imbalance of the power system of Ukraine must be covered with balancing reserve utilizing a combination of the following two approaches, depending on the market price value, available cross-border capacities and severity of disturbance (amount of lost power): Activation of balancing reserve which is kept inside of Ukraine Activation of balancing reserve which is kept outside of Ukraine, considering that sufficient
transmission capacity must be allocated between Ukraine and “reserve connecting” TSOs. Again the following three scenarios have been compared in order to analyze the advantages of interconnections and a potential decrease of balancing energy prices: Balancing scenario 1 - Balancing energy for wind outage is purchased in Ukraine.
Balancing price is estimated based on average production costs of all units engaged for covering the imbalance, obtained from OPF calculations.
Balancing scenario 2 - Balancing energy from IPS/UPS (Split Synchronous Assumption). The wind outage is covered within the modeled eastern part of the IPS/UPS based on the minimum production cost criteria. The balancing price is then calculated based on average production costs of all units engaged for covering the imbalance as an obtained solution from OPF.
Balancing scenario 3 - Balancing energy from interconnected Black Sea region (Parallel Synchronous Assumption). The wind outage is covered within synchronized Black Sea region based on the minimum production cost criteria. Price is estimated based on average production costs of all units engaged for covering the imbalance as a solution from OPF calculation.
18

The previously described three balancing scenarios have been compared for this winter regime. In the following Figure 6.2, the balancing energy price has been calculated as an average production cost in an optimized power flow solution after the observed wind outage.
Figure 6.2– Comparison of balancing energy price for different scenarios – Crimea Winter maximum 2015
It can be concluded that the activation of balancing reserves on a regional market is a more favorable option in order to decrease the price of balancing energy in Ukraine. The balancing price is decreased approximately 12% in the case of purchasing balancing energy from IPS/UPS (Scenario 2 above). In scenario 3 where Ukraine can obtain reserves from the Black Sea Region (Parallel Synchronous Mode), a savings to Ukraine of 14% can be achieved. Summer Regime Figure 6.3 below shows power flows on the system of interest that connects Crimea with rest of Ukraine before the simulated disturbance in the network and after generators have changed their engagements according to governor droop. It can be seen that, in the summer regime of low consumption before the outage, power flows from Crimea towards the rest of Ukraine. As expected, after the outage power flows in the opposite direction with no overloading on observed elements. Like in the winter regime, approximately 50% of lost power in Ukraine is being compensated from Russia, 18% from Ukraine and approximately 10% in total from Armenia, Azerbaijan, Georgia and Moldova. The remaining 22% comes from other power systems inside of IPS/UPS.
19

Figure 6.3– Power flows on interconnection lines between Crimea and rest of Ukraine before and after outage-
Crimea Summer maximum 2015 In the following Figure 6.4 the balancing energy price, estimated as an average production cost in an optimized power flow solution after observed wind outage, has been compared for each of the three balancing scenarios.
Figure 6.4– Comparison of balancing energy price for different scenarios – Crimea Summer maximum
2015 It can be concluded that the activation of balancing reserves on a regional market is a more favorable option in order to decrease the price of balancing energy in Ukraine. The balancing price is decreased approximately 12% in the case of purchasing balancing energy from IPS/UPS (Scenario 2 above). In scenario 3 above where Ukraine can obtain reserves from the Black Sea Region (Parallel Synchronous Mode), a savings to Ukraine is also 12% because the low cost reserves are in the IPS/UPS and not in Romania, Bulgaria and Turkey.
20

7 FINDINGS AND CONCLUSIONS Regional Renewable Energy Forecast Updates During this phase of the BSTP, the PSSE/OPF transmission planning models have been updated to include a more accurate simulation of the renewable energy resources to be added to the network in 2015 and 2020. To develop the estimates on a country-by-country basis, each TSO completed a questionnaire on national renewable energy policies; regulations; renewable energy development plans, tariffs and other fiscal incentives for renewable energy; connection procedures; and critical issues effecting the integration of intermittent renewable energy resources. The 2015 winter and summer maximum models are believed to be a best estimate of how the BSTP region will grow and what impact renewable energy sources (especially wind in this study) will have on the transmission systems of the Black Sea Region. Utilizing Newly Developed Optimum Power Flow Models The updated estimates of new renewable generation added to the network in 2015 and 2020 gained from the surveys and TSO updates has been utilized in this study by the newly created PSS/E Optimal Power Flow (OPF) regional model. The Optimum Power Flow (OPF) feature of the PSS/E software is a powerful tool that all TSOs in the region use for transmission planning and to facilitate market based analysis.. OPF solves optimization problems involving system operational costs, losses, system performance, system exchange opportunities and congestion management. In this study the PSSE/OPF software has utilized the Generation Cost Curves, developed in this stage of the project for each type of generator used in the BSTP region, to calculate average generation cost and optimize generation dispatch. The newly created OPF national and regional models provide the BSTP Working Group with the region’s first transmission constrained optimized dispatch models of the national and regional power systems and have proven invaluable in producing the technical and economic results in this study. Testing the Transmission System During a Sudden Loss of Wind WPPs in the BSTP load flow models are normally modeled using 30% of the Pmax value. However, in this sudden loss of wind study, the wind production in the area being studied was increased to 100% of the installed active power in advance of the sudden loss; this results in a loss of wind generation from 100% to zero. The amount of the sudden loss in each region is:
• Dobruja Region (Romania and Bulgaria) – 2,345 MW • Cesme Region (Turkey) – 460 MW • Crimea Region (Ukraine) – 1,150 MW
The PSS/E software was used to evaluate the capacity of the transmission systems in Romania, Bulgaria, Turkey and Ukraine to identify the load flows that result from this sudden loss of wind event with the following results:
• While increasing the wind generation to 100% of Pmax, no overloads occurred in the regions of Dobruja, Cesme or Crimea.
21

• When the sudden loss was implemented in each of these areas and the power flows dramatically changed, no overloads occurred on the transmission systems in these regions.
These results confirm that, even in the worst case scenario when a large sudden loss of wind occurs, the transmission systems in this region are robust and capable of dealing with such an event. Inertia/Primary Reserve Findings and Conclusions The BSTP regional PSS/E model was used to analyze the Inertial and Primary reserve requirements for a sudden loss of wind in each of the regions. Dobruja Region of Romania and Bulgaria: In the winter and summer regimes, the analyzed sudden loss of wind causes significant frequency reductions in the first 500ms, which indicates that this is a serious incident. This disturbance activates primary reserves on the ENTSO-E interconnections and, according to existing values of primary control reserve and the contribution coefficient Ci of each power system, that contribution is around 120 MW from Bulgaria and Romania (5.2% of the total outage) while the contribution from Turkey is approximately 10% of lost power in the Dobruja region. The remaining 84% of the lost power is being compensated from ENTSO-E. After the outage and activation of the primary reserve, power flows on interconnecting lines significantly change as illustrated in figures 4.1 and 4.3. This is particularly the case on the interconnections Romania- Hungary, Romania-Serbia and Romania-Ukraine where exports from Romania instantly become imports to cover the sudden loss. Cesme Region of Turkey: In the winter and summer regimes, analyzed sudden loss of wind caused only a very small frequency drop due to the robustness of the ENTSO-E interconnections to Turkey. This small disturbance will not activate primary reserves in ENTSO-E but is resolved solely based on inertial response. It can be concluded that approximately 90% of lost power in Turkey is being compensated from the rest of ENTSO-E, which is very important for determining the transmission reliability margin (TRM) in the NTC calculation procedure for the borders Bulgaria – Turkey and Greece - Turkey. Crimea Region of Ukraine: In the winter and summer regimes, the analyzed sudden loss of wind causes a frequency drop which will activate primary reserves on the IPS/UPS interconnections. Approximately 50% of lost power in Ukraine is being compensated from Russia, 18% from Ukraine and 10% in total from Armenia, Azerbaijan, Georgia and Moldova. The remaining 22% of lost power is being compensated from the other power systems of IPS/UPS. After the outage and activation of the primary reserve, power flows on interconnecting lines significantly change as illustrated in Table 6.1 and Figure 6.3. Tertiary/Balancing Reserve Findings and Conclusions The BSTP regional PSSE/OPF model was used to analyze the Tertiary and Balancing reserve requirements for a sudden loss of wind in each of the regions and for each of the three Balancing
22

Scenarios. As was reported in the PSSE/OPF Regional Model Construction Report, average generation costs are calculated to be higher in the ENTSO-E countries of Romania, Bulgaria and Turkey than in the IPS/UPS countries. Since these tertiary/balancing study results rely on the same OPF generation cost curves, these findings and conclusions also show that significant savings would be possible if tertiary and balancing power is imported from the low cost countries of the IPS/UPS. Dobruja Region of Romania and Bulgaria: The OPF analysis of the three balancing scenarios show that there is no difference in the estimated balancing price if the balancing power is provided from within Romania and Bulgaria (Balancing Scenario 1) or from within both of these countries with the addition of Turkey (Balancing Scenario 2). In balancing scenario 3, the assumption is that balancing power can be obtained from the entire Black Sea region and when this is possible the balancing price is decreased approximately 16% in Winter and Summer. These cost savings for Romania and Bulgaria occur because of the engagement of lower cost production units in the eastern part of the region (See Figures 4.2 and 4.4). Cesme Region of Turkey: When the sudden loss of wind occurs in the Cesme region of Turkey and the balancing power is supplied only by Turkey (balancing scenario 1), the price for this power is high. However, if the post incident tertiary/balancing reserves come from ENTSO-E (balancing scenario 2), Turkey would realize a 13%-16% savings and if the reserves come from the entire region (balancing scenario 3), Turkey would realize a 21%-22% savings (See Figures 5.2 and 5.4). Crimea Region of Ukraine: When providing the tertiary/balancing power for a sudden loss of wind in Crimea, this study shows that the price of this power is already low when supplied only by Ukraine (balancing scenario 1). However, a 12%-14% savings can be realized in Ukraine when the balancing power comes from the rest of IPS/UPS (balancing scenario 2) and would stay practically the same if assistance occurred also from Romania, Bulgaria and Turkey (balancing scenario 3). (See Figures 6.2 and 6.4).
23