balanced growth - yale · pdf fileendogenous and exogenous variables in the solow model the...
TRANSCRIPT

Balanced Growth
Balanced Growth
� A steady state without technological change is one in whichoutput and capital do not change.
Balanced Growth
� A steady state without technological change is one in whichoutput and capital do not change.
� What happens in a steady state with technological change?

Balanced Growth
� A steady state without technological change is one in whichoutput and capital do not change.
� What happens in a steady state with technological change?
� Answer: output and capital grow at a constant ratedetermined by the rate of technological change.

Endogenous and Exogenous Variables in the Solow Model
Endogenous and Exogenous Variables in the Solow Model
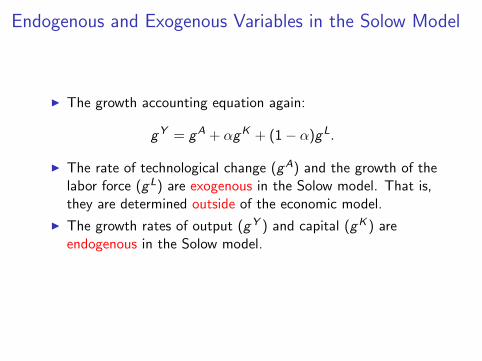
� The growth accounting equation again:
gY = gA + αgK + (1 − α)gL.

Endogenous and Exogenous Variables in the Solow Model
� The growth accounting equation again:
gY = gA + αgK + (1 − α)gL.
� The rate of technological change (gA) and the growth of thelabor force (gL) are exogenous in the Solow model.
Endogenous and Exogenous Variables in the Solow Model
� The growth accounting equation again:
gY = gA + αgK + (1 − α)gL.
� The rate of technological change (gA) and the growth of thelabor force (gL) are exogenous in the Solow model. That is,they are determined outside of the economic model.
Endogenous and Exogenous Variables in the Solow Model
� The growth accounting equation again:
gY = gA + αgK + (1 − α)gL.
� The rate of technological change (gA) and the growth of thelabor force (gL) are exogenous in the Solow model. That is,they are determined outside of the economic model.
� The growth rates of output (gY ) and capital (gK ) areendogenous in the Solow model.
Endogenous and Exogenous Variables in the Solow Model
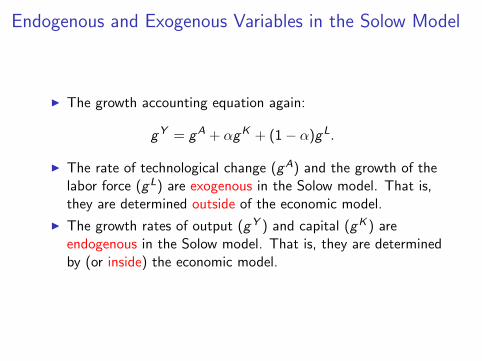
� The growth accounting equation again:
gY = gA + αgK + (1 − α)gL.
� The rate of technological change (gA) and the growth of thelabor force (gL) are exogenous in the Solow model. That is,they are determined outside of the economic model.
� The growth rates of output (gY ) and capital (gK ) areendogenous in the Solow model. That is, they are determinedby (or inside) the economic model.
Solving for the Growth Rate with Balanced Growth
Solving for the Growth Rate with Balanced Growth
� In a steady state, there is balanced growth.
Solving for the Growth Rate with Balanced Growth
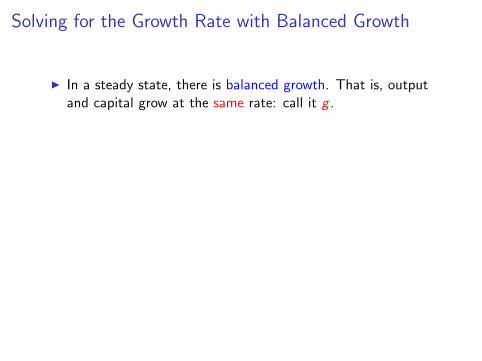
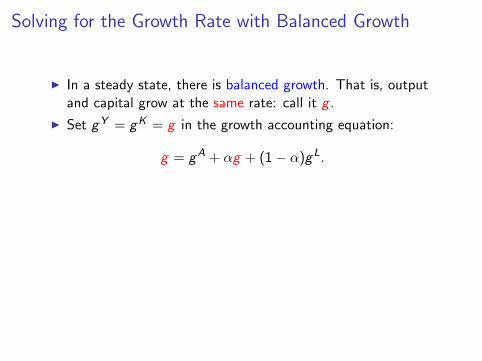
� In a steady state, there is balanced growth. That is, outputand capital grow at the same rate: call it g .

Solving for the Growth Rate with Balanced Growth
� In a steady state, there is balanced growth. That is, outputand capital grow at the same rate: call it g .
� Set gY = gK = g in the growth accounting equation:
Solving for the Growth Rate with Balanced Growth
� In a steady state, there is balanced growth. That is, outputand capital grow at the same rate: call it g .
� Set gY = gK = g in the growth accounting equation:
g = gA + αg + (1 − α)gL.
Solving for the Growth Rate with Balanced Growth
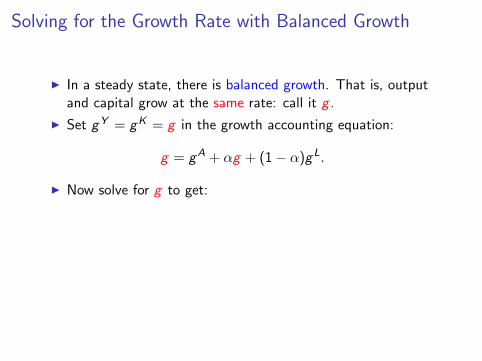
� In a steady state, there is balanced growth. That is, outputand capital grow at the same rate: call it g .
� Set gY = gK = g in the growth accounting equation:
g = gA + αg + (1 − α)gL.
� Now solve for g to get:
Solving for the Growth Rate with Balanced Growth
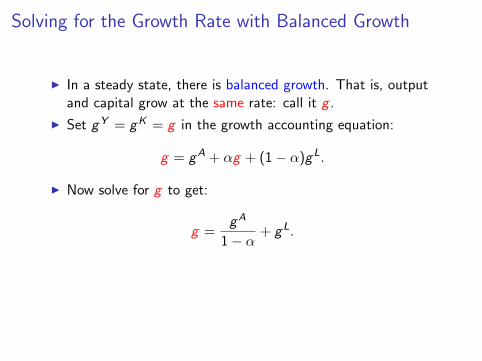
� In a steady state, there is balanced growth. That is, outputand capital grow at the same rate: call it g .
� Set gY = gK = g in the growth accounting equation:
g = gA + αg + (1 − α)gL.
� Now solve for g to get:
g =gA
1 − α+ gL.
Solving for the Growth Rate with Balanced Growth
� In a steady state, there is balanced growth. That is, outputand capital grow at the same rate: call it g .
� Set gY = gK = g in the growth accounting equation:
g = gA + αg + (1 − α)gL.
� Now solve for g to get:
g =gA
1 − α+ gL.
� If gA = gL = 0 (neither technology nor the labor force isgrowing), then g = 0.
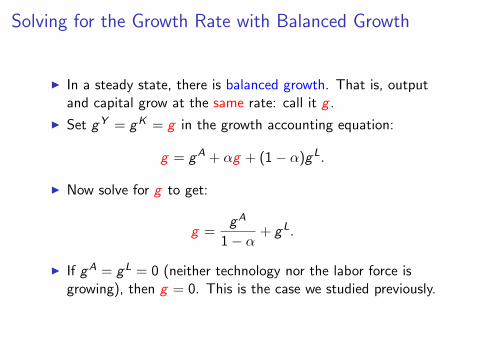
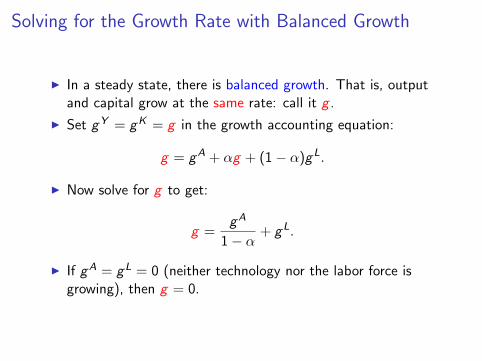
Solving for the Growth Rate with Balanced Growth
� In a steady state, there is balanced growth. That is, outputand capital grow at the same rate: call it g .
� Set gY = gK = g in the growth accounting equation:
g = gA + αg + (1 − α)gL.
� Now solve for g to get:
g =gA
1 − α+ gL.
� If gA = gL = 0 (neither technology nor the labor force isgrowing), then g = 0. This is the case we studied previously.
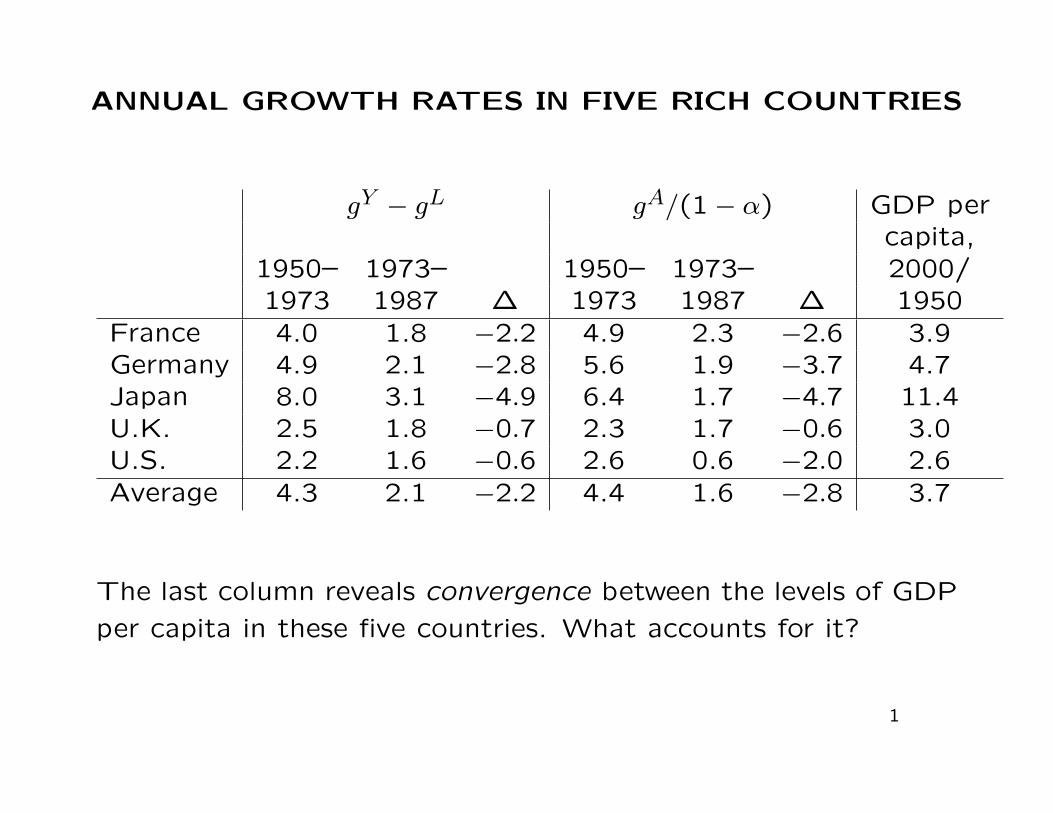
ANNUAL GROWTH RATES IN FIVE RICH COUNTRIES
gY − gL gA/(1 − α) GDP percapita,
1950– 1973– 1950– 1973– 2000/1973 1987 Δ 1973 1987 Δ 1950
France 4.0 1.8 −2.2 4.9 2.3 −2.6 3.9Germany 4.9 2.1 −2.8 5.6 1.9 −3.7 4.7Japan 8.0 3.1 −4.9 6.4 1.7 −4.7 11.4U.K. 2.5 1.8 −0.7 2.3 1.7 −0.6 3.0U.S. 2.2 1.6 −0.6 2.6 0.6 −2.0 2.6Average 4.3 2.1 −2.2 4.4 1.6 −2.8 3.7
The last column reveals convergence between the levels of GDP
per capita in these five countries. What accounts for it?
1
Understanding Growth in Five Rich Countries
Understanding Growth in Five Rich Countries
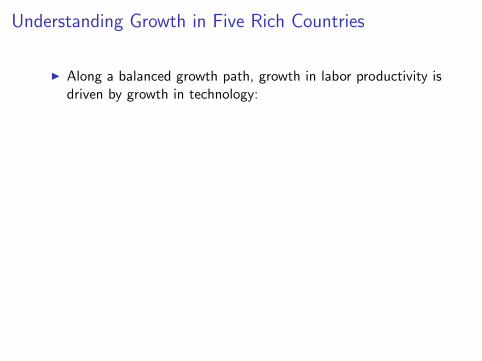
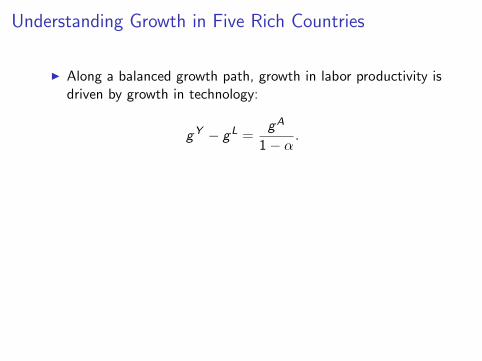
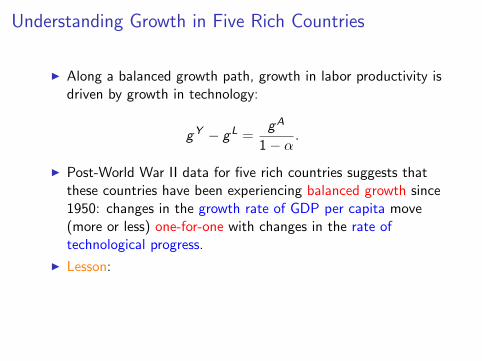
� Along a balanced growth path, growth in labor productivity isdriven by growth in technology:
Understanding Growth in Five Rich Countries
� Along a balanced growth path, growth in labor productivity isdriven by growth in technology:
gY − gL =gA
1 − α.
Understanding Growth in Five Rich Countries
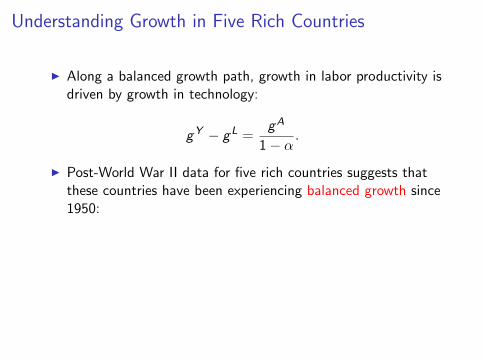
� Along a balanced growth path, growth in labor productivity isdriven by growth in technology:
gY − gL =gA
1 − α.
� Post-World War II data for five rich countries suggests thatthese countries have been experiencing balanced growth since1950:
Understanding Growth in Five Rich Countries
� Along a balanced growth path, growth in labor productivity isdriven by growth in technology:
gY − gL =gA
1 − α.
� Post-World War II data for five rich countries suggests thatthese countries have been experiencing balanced growth since1950: changes in the growth rate of GDP per capita move(more or less) one-for-one with changes in the rate oftechnological progress.
Understanding Growth in Five Rich Countries
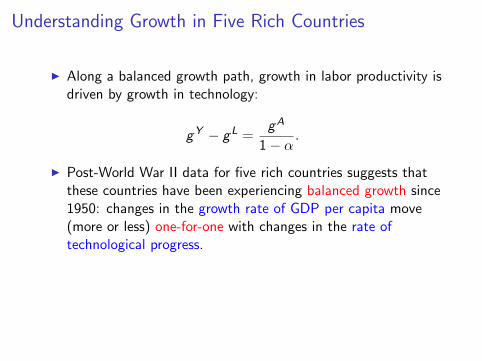
� Along a balanced growth path, growth in labor productivity isdriven by growth in technology:
gY − gL =gA
1 − α.
� Post-World War II data for five rich countries suggests thatthese countries have been experiencing balanced growth since1950: changes in the growth rate of GDP per capita move(more or less) one-for-one with changes in the rate oftechnological progress.
� Lesson:

Understanding Growth in Five Rich Countries
� Along a balanced growth path, growth in labor productivity isdriven by growth in technology:
gY − gL =gA
1 − α.
� Post-World War II data for five rich countries suggests thatthese countries have been experiencing balanced growth since1950: changes in the growth rate of GDP per capita move(more or less) one-for-one with changes in the rate oftechnological progress.
� Lesson: The gap between Japanese GDP per capita and U.S.GDP per capita has grown smaller since 1950 because therate of technological progress in Japan has been higher.

The Catch-Up Effect
The Catch-Up Effect
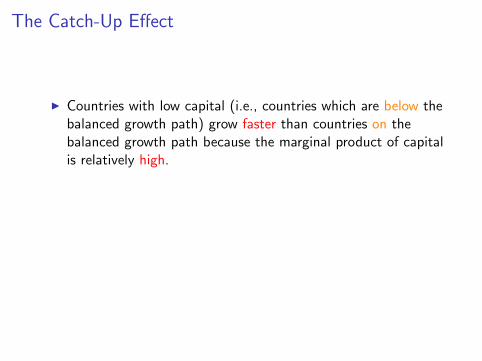
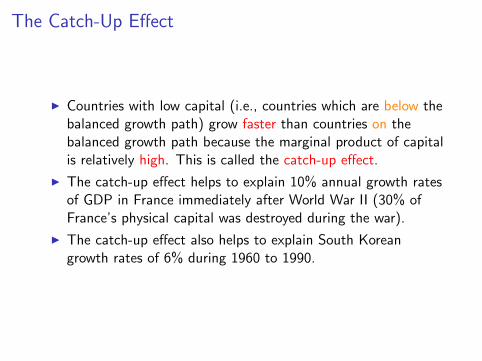
� Countries with low capital (i.e., countries which are below thebalanced growth path) grow faster than countries on thebalanced growth path because the marginal product of capitalis relatively high.
The Catch-Up Effect
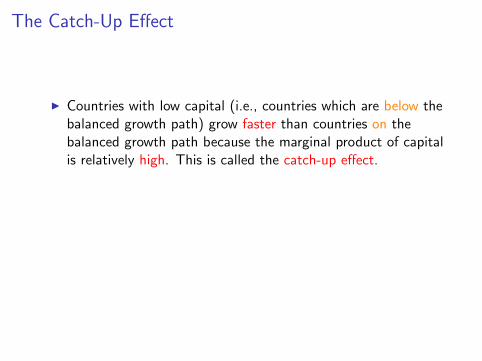
� Countries with low capital (i.e., countries which are below thebalanced growth path) grow faster than countries on thebalanced growth path because the marginal product of capitalis relatively high. This is called the catch-up effect.
The Catch-Up Effect
� Countries with low capital (i.e., countries which are below thebalanced growth path) grow faster than countries on thebalanced growth path because the marginal product of capitalis relatively high. This is called the catch-up effect.
� The catch-up effect helps to explain 10% annual growth ratesof GDP in France immediately after World War II (30% ofFrance’s physical capital was destroyed during the war).
The Catch-Up Effect
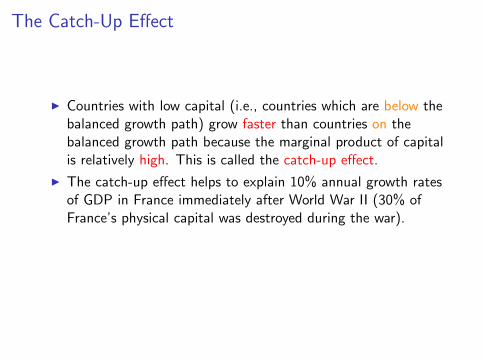
� Countries with low capital (i.e., countries which are below thebalanced growth path) grow faster than countries on thebalanced growth path because the marginal product of capitalis relatively high. This is called the catch-up effect.
� The catch-up effect helps to explain 10% annual growth ratesof GDP in France immediately after World War II (30% ofFrance’s physical capital was destroyed during the war).
� The catch-up effect also helps to explain South Koreangrowth rates of 6% during 1960 to 1990.

Productivity Gaps

Productivity Gaps
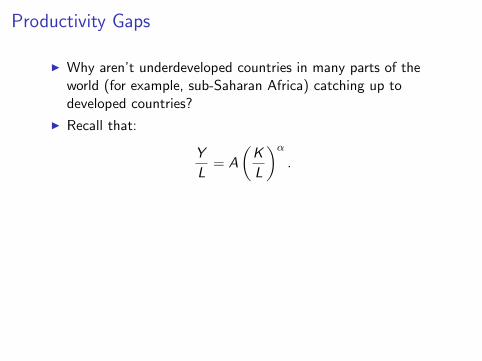
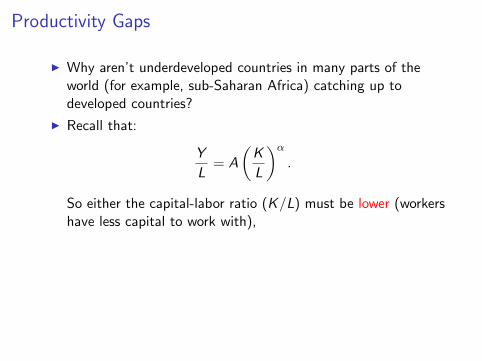
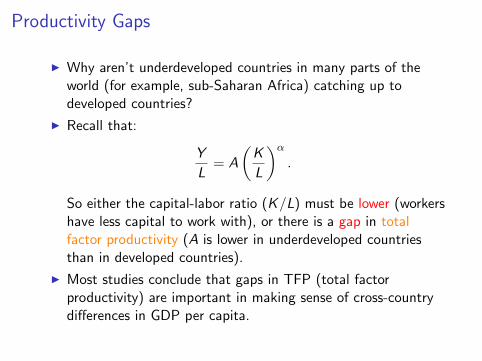
� Why aren’t underdeveloped countries in many parts of theworld (for example, sub-Saharan Africa) catching up todeveloped countries?
Productivity Gaps
� Why aren’t underdeveloped countries in many parts of theworld (for example, sub-Saharan Africa) catching up todeveloped countries?
� Recall that:
Y
L= A
(K
L
)α
.
Productivity Gaps
� Why aren’t underdeveloped countries in many parts of theworld (for example, sub-Saharan Africa) catching up todeveloped countries?
� Recall that:
Y
L= A
(K
L
)α
.
So either the capital-labor ratio (K/L) must be lower (workershave less capital to work with),

Productivity Gaps
� Why aren’t underdeveloped countries in many parts of theworld (for example, sub-Saharan Africa) catching up todeveloped countries?
� Recall that:
Y
L= A
(K
L
)α
.
So either the capital-labor ratio (K/L) must be lower (workershave less capital to work with), or there is a gap in totalfactor productivity (A is lower in underdeveloped countriesthan in developed countries).
� Most studies conclude that gaps in TFP (total factorproductivity) are important in making sense of cross-countrydifferences in GDP per capita.

Explanations for Differences in TFP
Explanations for Differences in TFP
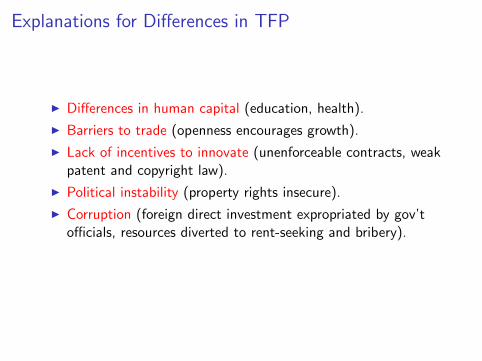
� Differences in human capital (education, health).

Explanations for Differences in TFP
� Differences in human capital (education, health).
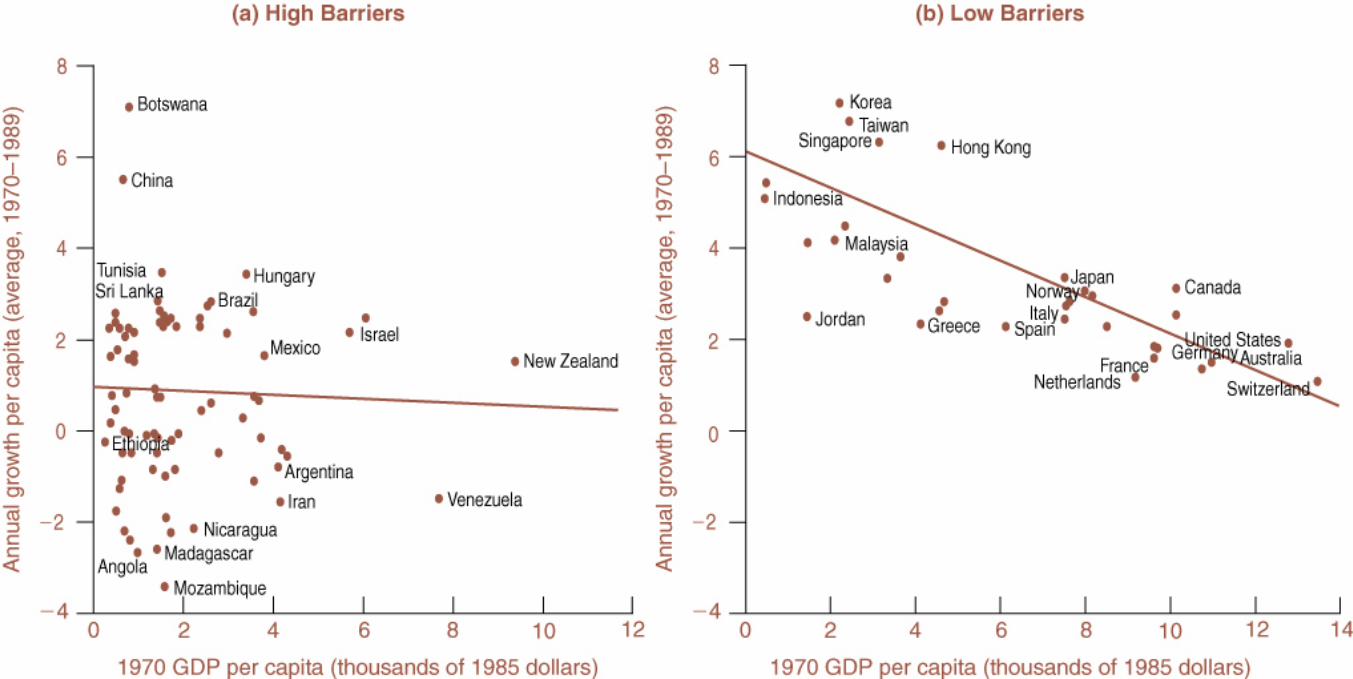
� Barriers to trade (openness encourages growth).
Explanations for Differences in TFP
� Differences in human capital (education, health).
� Barriers to trade (openness encourages growth).
� Lack of incentives to innovate (unenforceable contracts, weakpatent and copyright law).

Explanations for Differences in TFP
� Differences in human capital (education, health).
� Barriers to trade (openness encourages growth).
� Lack of incentives to innovate (unenforceable contracts, weakpatent and copyright law).
� Political instability (property rights insecure).
Explanations for Differences in TFP
� Differences in human capital (education, health).
� Barriers to trade (openness encourages growth).
� Lack of incentives to innovate (unenforceable contracts, weakpatent and copyright law).
� Political instability (property rights insecure).
� Corruption (foreign direct investment expropriated by gov’tofficials, resources diverted to rent-seeking and bribery).

Explanations for Differences in TFP
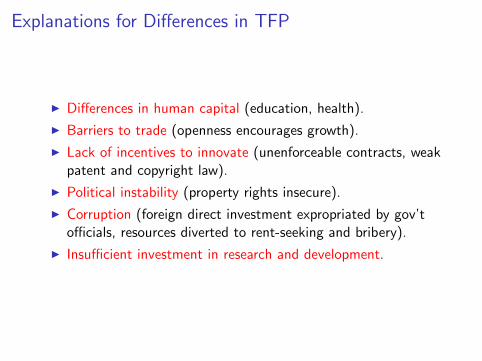
� Differences in human capital (education, health).
� Barriers to trade (openness encourages growth).
� Lack of incentives to innovate (unenforceable contracts, weakpatent and copyright law).
� Political instability (property rights insecure).
� Corruption (foreign direct investment expropriated by gov’tofficials, resources diverted to rent-seeking and bribery).
� Insufficient investment in research and development.
Explanations for Differences in TFP
� Differences in human capital (education, health).
� Barriers to trade (openness encourages growth).
� Lack of incentives to innovate (unenforceable contracts, weakpatent and copyright law).
� Political instability (property rights insecure).
� Corruption (foreign direct investment expropriated by gov’tofficials, resources diverted to rent-seeking and bribery).
� Insufficient investment in research and development.
Are There Limits to Growth?
Are There Limits to Growth?
� Malthus thought that the long-run fate of economies was“misery and vice:”
Are There Limits to Growth?
� Malthus thought that the long-run fate of economies was“misery and vice:” “The power of population is infinitelygreater than the power in the earth to produce subsistence forman.”

Are There Limits to Growth?
� Malthus thought that the long-run fate of economies was“misery and vice:” “The power of population is infinitelygreater than the power in the earth to produce subsistence forman.”
� But Malthus failed to account for the demographic transition(drops in fertility rates) and for immense technological changein agriculture.
� Fertility rates drop because the opportunity cost of bearingand raising children increases as economies develop.

Are There Limits to Growth?
� Malthus thought that the long-run fate of economies was“misery and vice:” “The power of population is infinitelygreater than the power in the earth to produce subsistence forman.”
� But Malthus failed to account for the demographic transition(drops in fertility rates) and for immense technological changein agriculture.
� Fertility rates drop because the opportunity cost of bearingand raising children increases as economies develop. Parentstrade off quantity of children for quality (education).
� The Club of Rome in 1970’s also made dire predictions for theworld economy, none of which came true.
Are There Limits to Growth?
� Malthus thought that the long-run fate of economies was“misery and vice:” “The power of population is infinitelygreater than the power in the earth to produce subsistence forman.”
� But Malthus failed to account for the demographic transition(drops in fertility rates) and for immense technological changein agriculture.
� Fertility rates drop because the opportunity cost of bearingand raising children increases as economies develop. Parentstrade off quantity of children for quality (education).
� The Club of Rome in 1970’s also made dire predictions for theworld economy, none of which came true. For example, pricesof natural resources actually fell between 1980 and 1990.
� Will technological change help to deal with the economiceffects of global warming?
