balance of payments
TRANSCRIPT

Eco 328 Balance of payments
• We now want to understand economic transactions between
countries, how they are undertaken, and what impact they
have on the economy.
• The first task of any macroeconomist is to measure economic
transactions.
• Our goals are now to:
o explain the international system of trade and payments
o discover how international trade in goods and services is
complemented and balanced by a parallel trade in assets
o see how these transactions relate to national income and
wealth
2
Some accounting

bea.gov
National Income and Product Accounts (NIPA)
Balance of Payments (BOP)
3

4
• At various points in the circular flow of payments, economic activity is measured and recorded in the national income and product accounts.
• In an open economy, however, such measurements are more complicated because we have to account for cross-border flows.
• These additional flows are recorded in a nation’s balance of payments accounts.

5
• Gross national expenditure (GNE) is the total expenditure on final goods and services by home entities in any given period.
• GNE is made up of three parts: personal consumption C, investment I, and government spending G.
GNE= (C + I + G)
• A country’s gross domestic product (GDP) is the value of all (intermediate and final) goods and services produced as output by firms, minus the value of all goods and services purchased as inputs by firms.
The Flow of Payments in a Closed Economy:
Introducing the National Income and Product Accounts

6
• GDP is a product measure, in contrast to GNE, which is an expenditure measure.
• In a closed economy, income is paid to domestic entities. It thus equals the total income resources of the economy, also known as gross national income (GNI).
The Flow of Payments in a Closed Economy:
Introducing the National Income and Product Accounts

Recall Intermediate Macro
Expenditure = Production = Income
In a closed economy, all the economic aggregate measures are equal: GNE equals GDP which equals GNI which equals GNE.
In a closed economy, expenditure is the same as product, which is the same as income.
7

The Closed Economy Measurements of national expenditure, product, and income are recorded in the national income and product accounts, with the major categories shown. The purple line shows the circular flow of all transactions in a closed economy.
8
What about NX?
We do not consume everything we produce.
Some things we sell to households, firms and governments in other countries.
Nor do we produce everything we consume and invest.
US households, firms and government buys some things produced in other countries.
9
10
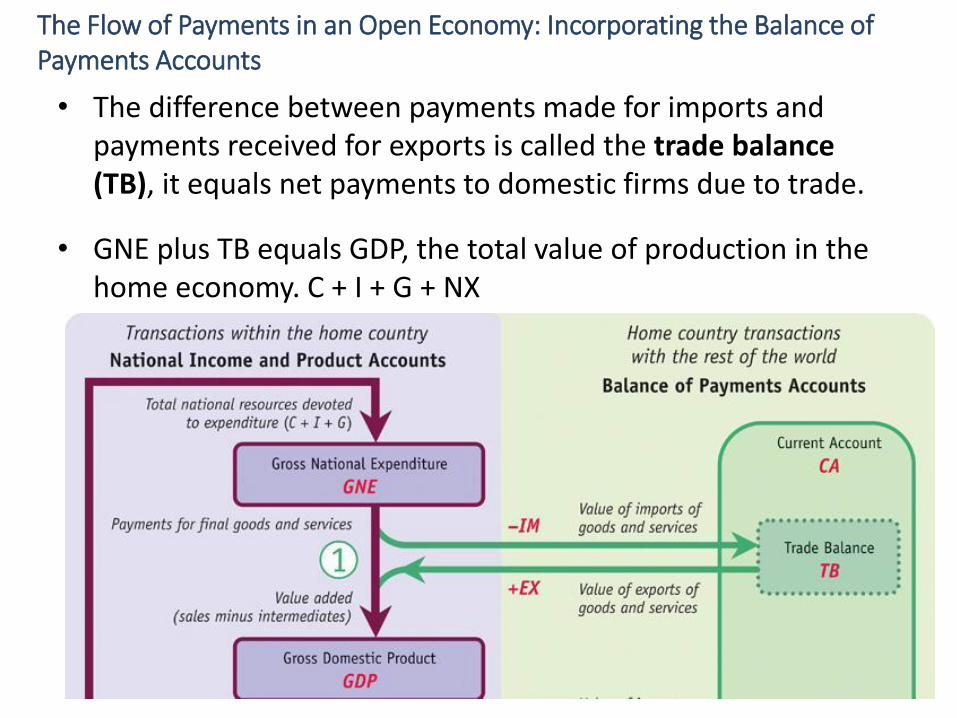
• The difference between payments made for imports and payments received for exports is called the trade balance (TB), it equals net payments to domestic firms due to trade.
• GNE plus TB equals GDP, the total value of production in the home economy. C + I + G + NX
The Flow of Payments in an Open Economy: Incorporating the Balance of Payments Accounts

Factor payments
Much of the proceeds from domestic production is used to pay US workers, investors and lenders – but not all of it. If Dell (a US computer company) locates customer support is in India, then some of Dell’s revenue must be sent to India to pay those workers. If Caterpillar (a US construction, mining and farming equipment producer) has a manufacturing plant in China, it has workers and probably credit lines in China. So some of US production revenues leaves the US to pay for ‘factors of production’ located overseas.
11

Factor Payments
Not all US workers work for US companies. Toyota, Kia and Hyundai have large operations in the US.
They have to pay their US work force out of their revenues. They, too, have local lines of credit, and make interest payments to local banks. Americans also own stock in foreign companies, meaning those companies must send some of their profits to the US in the form of dividends.
12
13
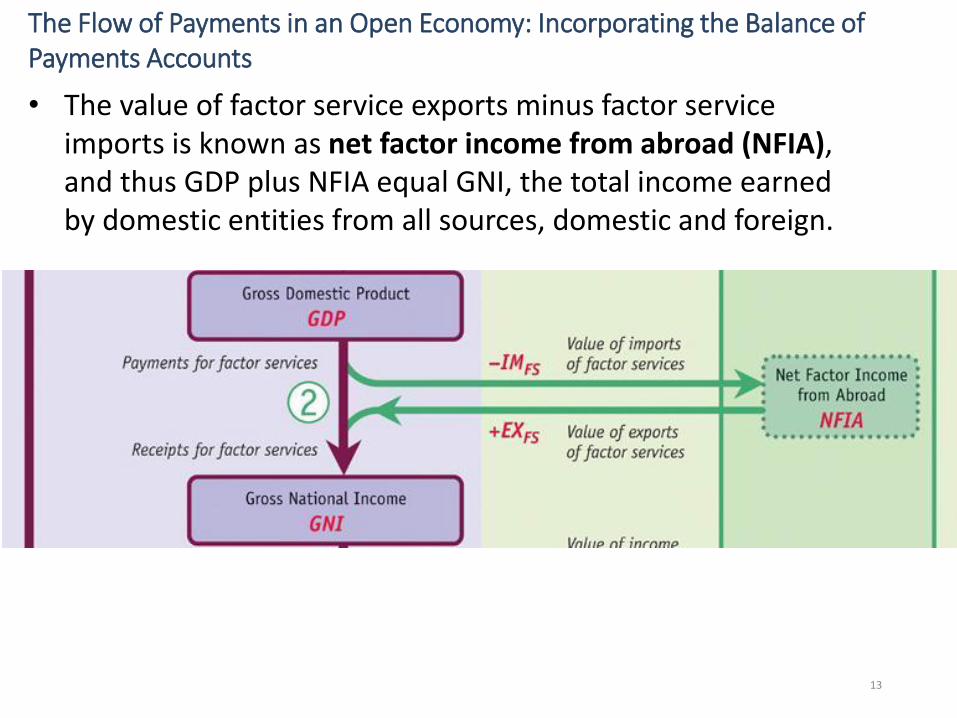
• The value of factor service exports minus factor service imports is known as net factor income from abroad (NFIA), and thus GDP plus NFIA equal GNI, the total income earned by domestic entities from all sources, domestic and foreign.
The Flow of Payments in an Open Economy: Incorporating the Balance of Payments Accounts

Transfers
Sometimes money and other resources shuffles from country to country, but not the result of a market transaction. An American consultant can be working overseas for extended periods of time, yet still their income ultimately ends up back here. Many workers for US construction and agriculture firms send much of their wages to families in Mexico and other Latin American countries. If a hurricane takes out New Orleans or mega tornadoes do great damage in the mid western states some of the relief funds could come from abroad. When an earthquake sinks much of Haiti’s infrastructure, Americans send money and other aid resources to help.
14

15
• Gifts may take the form of income transfers or “in kind” transfers of goods and services.
• They are considered nonmarket transactions, and are referred to as unilateral transfers.
• Net unilateral transfers (NUT) equals the value of unilateral transfers the country receives from the rest of the world minus those it gives to the rest of the world.
The Flow of Payments in an Open Economy: Incorporating the Balance of Payments Accounts

16
• These net transfers have to be added to GNI to calculate gross national disposable income (GNDI).
• Thus, GNI plus NUT equals GNDI, which represents the total income resources available to the home country.
The Flow of Payments in an Open Economy: Incorporating the Balance of Payments Accounts

17
The current account (CA) is a tally of all international transactions in goods, services, and income (occurring through market transactions or transfers).
The Flow of Payments in an Open Economy: Incorporating the Balance of Payments Accounts
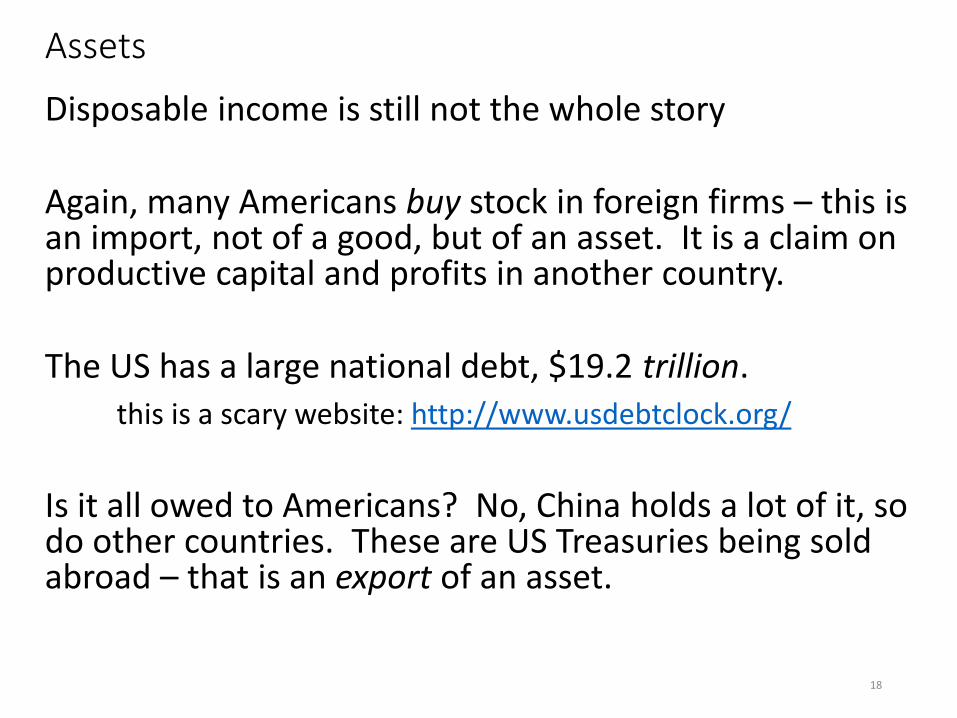
Assets
Disposable income is still not the whole story Again, many Americans buy stock in foreign firms – this is an import, not of a good, but of an asset. It is a claim on productive capital and profits in another country. The US has a large national debt, $19.2 trillion. this is a scary website: http://www.usdebtclock.org/
Is it all owed to Americans? No, China holds a lot of it, so do other countries. These are US Treasuries being sold abroad – that is an export of an asset.
18

19
• The value of asset exports minus asset imports is called the financial account (FA).
• These net asset exports are added to home GNDI when calculating the total resources available for expenditure in the home country.
The Flow of Payments in an Open Economy: Incorporating the Balance of Payments Accounts
20
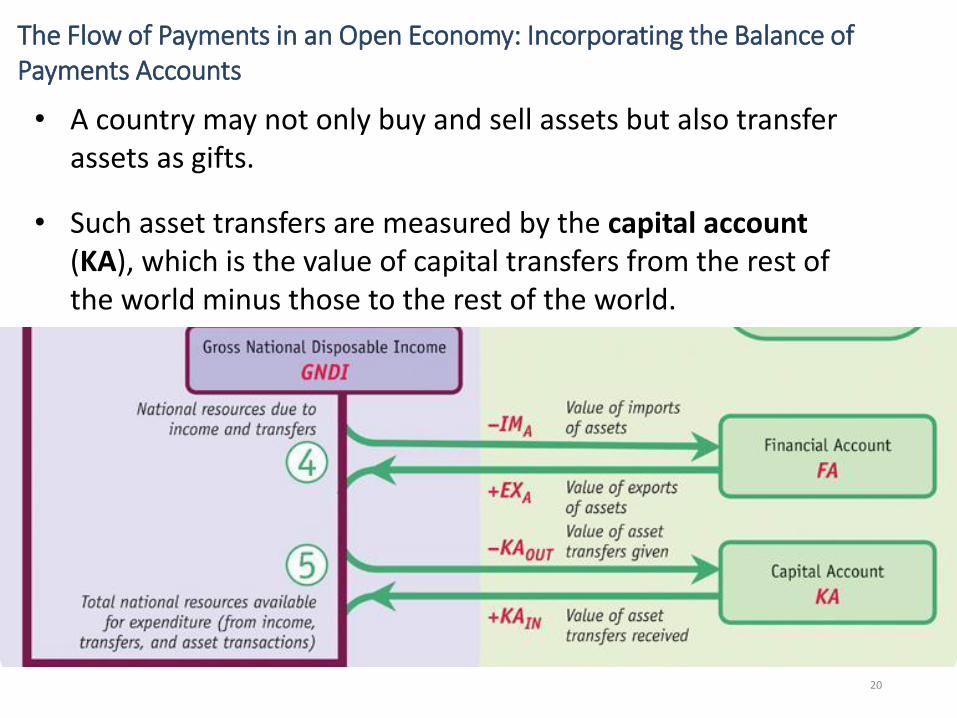
• A country may not only buy and sell assets but also transfer assets as gifts.
• Such asset transfers are measured by the capital account (KA), which is the value of capital transfers from the rest of the world minus those to the rest of the world.
The Flow of Payments in an Open Economy: Incorporating the Balance of Payments Accounts

The Open Economy Measurements of national expenditure, product, and income are recorded in the national income and product accounts, with the major categories shown on the left.
Measurements of international transactions are recorded in the balance of payments accounts, with the major categories shown on the right.
The purple line shows the flow of transactions within the home economy.
The green lines show all cross-border transactions.
21

22
Income, Product, and Expenditure
• The expenditure approach looks at the demand for stuff: it examines how much is spent on demand for final goods and services. The key measure is GNE.
• The product approach looks at the supply of stuff: it measures the value of all goods and services produced as output minus the value of goods used as inputs in production. The key measure is GDP.
• The income approach focuses on payments to owners of factors: it tracks the amount of income they receive. The key measures are gross national income (GNI) and gross national disposable income (GNDI) (which includes net transfers).
• In a closed economy the three approaches generate the same number: In a closed economy, GNE = GDP = GNI. In an open economy, however, this is not true.
Three Approaches to Measuring Economic Activity
23
• Personal consumption expenditures (usually called “consumption”) equal total spending by private households on final goods and services, including nondurable goods such as food, durable goods, and services.
• Gross private domestic investment (usually called “investment”) equals total spending by firms or households on final goods and services to make additions to the stock of capital. Investment includes construction of a new house or a new factory, the purchase of new equipment, and net increases in inventories of goods held by firms (i.e., unsold output).
From GNE to GDP: Accounting for Trade in Goods and Services

24
• Government consumption expenditures and gross investment (often called “government consumption”) equal spending by the public sector on final goods and services, including spending on public works, national defense, the police, and the civil service. It does not include any transfer payments or income redistributions, such as Social Security or unemployment insurance payments—these are not purchases of goods or services, just rearrangements of private spending power.
From GNE to GDP: Accounting for Trade in Goods and Services

25
This formula says gross domestic product is equal to gross national expenditure (GNE) plus the trade balance (TB).
The trade balance (TB), also referred to as net exports, may be positive or negative.
• If TB > 0, exports are greater than imports and we say a country has a trade surplus.
• If TB < 0, imports are greater than exports and we say a country has a trade deficit.
From GNE to GDP: Accounting for Trade in Goods and Services
TBGNE
IMEXGICGDP
balance Trade
teintermedia & finalimports, All
teintermedia & finalexports, All
eexpenditurnationalGross
productdomestic
Gross

26
Gross national income equals gross domestic product (GDP) plus net factor income from abroad (NFIA).
From GDP to GNI: Accounting for Trade in Factor Services
NFIAabroad from incomefactor Net
TBbalance Tradeeexpenditur national Gross
)()( FSFS
GDP
GNE
IMEXIMEXGICGNI

27
Celtic Tiger or Tortoise? A Paper Tiger? In the 1970s, Ireland was one of the poorer countries in Europe, but over the next three decades it experienced speedy economic growth with an accompanying investment boom now known as the Irish Miracle.

28
Celtic Tiger or Tortoise? A Paper Tiger? Comparisons with fast-growing Asian economies—the “Asian Tigers”—soon had people speaking of the “Celtic Tiger” when referring to Ireland. Did Irish citizens enjoy all of these gains?
No.

29
Celtic Tiger or Tortoise? A Paper Tiger? The chart shows trends in GDP, GNI, and NFIA in Ireland from 1980 to 2011. Irish GNI per capita grew more slowly than GDP per capita during the boom years of the 1980s and 1990s because an ever-larger share of GDP was sent abroad as net factor income to foreign investors.
Close to zero in 1980, this share had risen to around 15% of GDP by the year 2000 and has remained there.

30
If a country receives transfers worth UTIN and gives transfers worth UTOUT, then its net unilateral transfers (NUT), are
NUT = UTIN − UTOUT .
International nonmarket transfers of goods, services, and income include such things as foreign aid by governments in the form of official development assistance (ODA) and other help, private charitable gifts to foreign recipients, and income remittances sent to relatives or friends in other countries.
From GNI to GNDI: Accounting for Transfers of Income

31
Are Rich Countries “Stingy” with Foreign Aid?
The Asian tsunami on December 26, 2004, was one of the worst natural disasters of modern times. Hundreds of thousands of people were killed and billions of dollars of damage was done.
Jan Egeland, UN undersecretary general for humanitarian affairs and emergency relief, declared, “It is beyond me why we are so stingy.”
In the United States official aid fell short of the UN goal of 0.7% of GNI.
However, the United States gives in other ways, making judgments about stinginess far from straightforward.
An Indonesian soldier thanks two U.S. airmen after a U.S. Navy helicopter delivered fresh water to Indonesian tsunami victims. The normal operating costs of military assets used for humanitarian purposes are not fully counted as part of official development assistance.
AP
Ph
oto
/An
dy
Eam
es

32
NUT = UTIN − UTOUT .
Adding net unilateral transfers to gross national income, gives a full measure of national income in an open economy, known as gross national disposable income (GNDI), henceforth Y:
From GNI to GNDI: Accounting for Transfers of Income

33
From GNI to GNDI: Accounting for Transfers of Income Major Transfer Recipients The chart shows average figures for 2000 to 2010 for all countries in which net unilateral transfers exceeded 15% of GNI. Many of the countries shown were heavily reliant on foreign aid, including some of the poorest countries in the world, such as Liberia, Eritrea, Malawi, and Nepal. Some countries with higher incomes also have large transfers because of substantial migrant remittances from a large number of emigrant workers overseas (e.g., Tonga, El Salvador, Honduras, and Cape Verde).

34
On the left is our full income measure, GNDI.
The first term on the right is GNE, which measures payments by home entities.
The remaining terms measure net payments to the home country from all international transactions in goods, services, and income.
We group the three cross-border terms into an umbrella term that is called the current account (CA).
What the National Economic Aggregates Tell Us
35
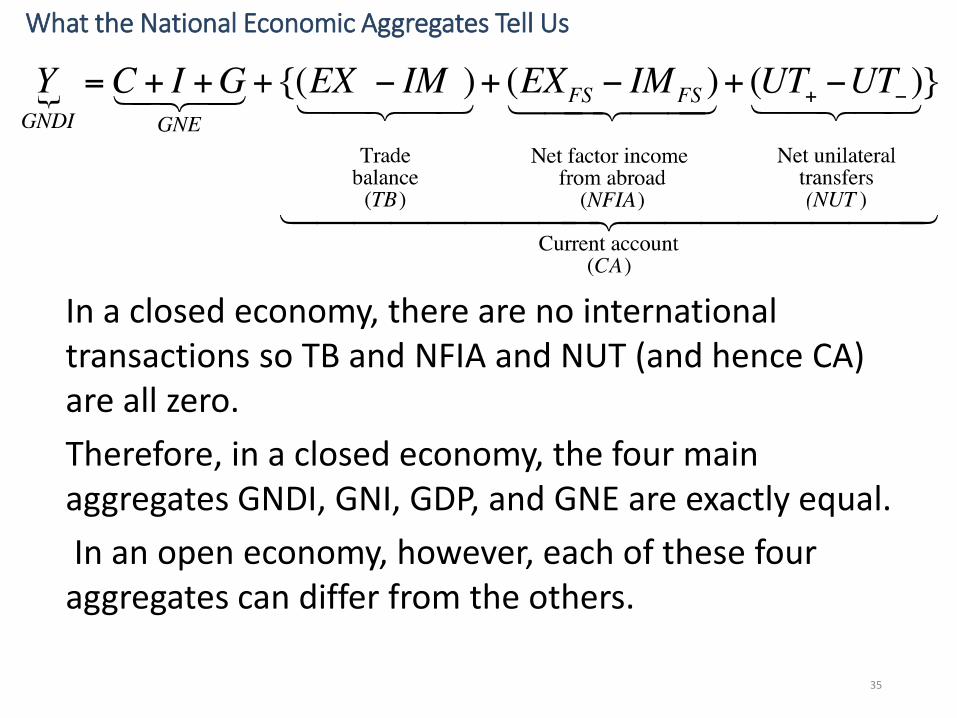
In a closed economy, there are no international transactions so TB and NFIA and NUT (and hence CA) are all zero.
Therefore, in a closed economy, the four main aggregates GNDI, GNI, GDP, and GNE are exactly equal.
In an open economy, however, each of these four aggregates can differ from the others.
What the National Economic Aggregates Tell Us

36
There is no reason why the value of what domestic firms sell to the world should equal what foreign firms sell to us.
There is no reason why what other countries pay us in wages and interest should equal what we pay other countries
There is no reason why the gifts we give to the world should be matched with equivalent gifts to us
Therefor expenditure, production and income do not equal each other
What the National Economic Aggregates Tell Us
37
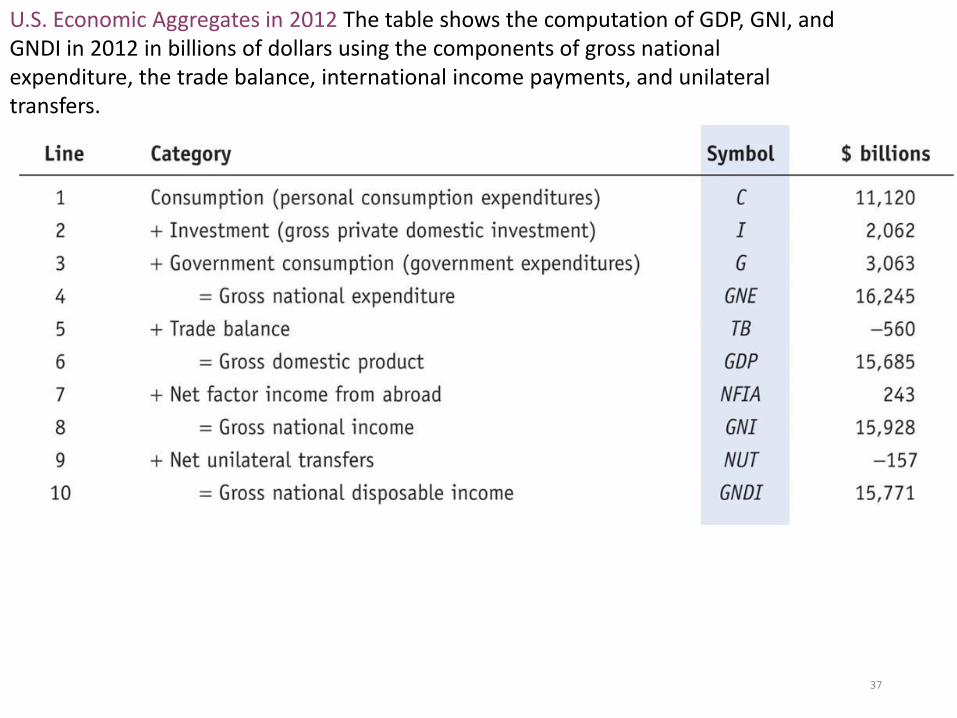
U.S. Economic Aggregates in 2012 The table shows the computation of GDP, GNI, and GNDI in 2012 in billions of dollars using the components of gross national expenditure, the trade balance, international income payments, and unilateral transfers.

38
Some Recent Trends
U.S. Gross National Expenditure and Its Components, 1990-2012 The figure shows consumption (C), investment (I), and government purchases (G) in billions of dollars.

39
• This equation is the open-economy national income identity. It tells us that the current account represents the difference between national income Y (or GNDI) and gross national expenditure GNE (or C + I + G). Hence:
• GNDI is greater than GNE if and only if CA is positive, or in surplus.
• GNDI is less than GNE if and only if CA is negative, or in deficit.
What the Current Account Tells Us
Y C I GCA

40
What is it for us? Positive or negative CA?
GNE = 16,245B CA = -560B + 243B – 157B = -474 So we’re in deficit -big time

41
Some Recent Trends
U.S. Current Accounts and Its Components, 1990-2012 The figure shows the trade balance (TB), net factor income from abroad (NFIA), and net unilateral transfers (NUT) in billions of dollars.
42
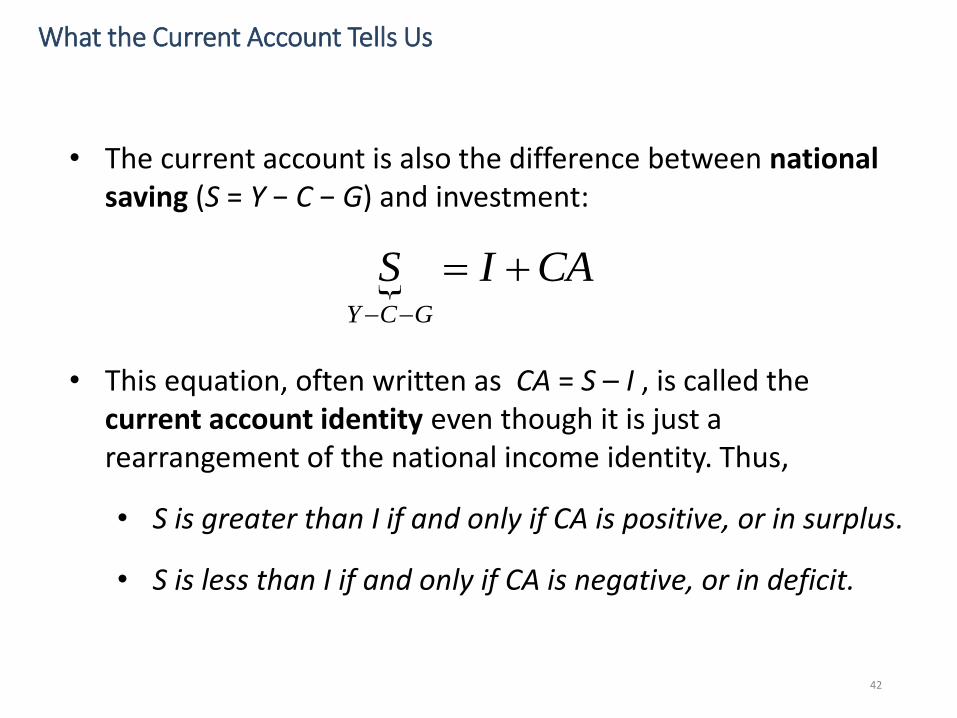
• The current account is also the difference between national saving (S = Y − C − G) and investment:
• This equation, often written as CA = S – I , is called the current account identity even though it is just a rearrangement of the national income identity. Thus,
• S is greater than I if and only if CA is positive, or in surplus.
• S is less than I if and only if CA is negative, or in deficit.
What the Current Account Tells Us
CAISGCY

43
• The current account is also the difference between national saving (S = Y − C − G) and investment:
• This equation, often written as CA = S – I , is called the current account identity even though it is just a rearrangement of the national income identity.
• A current account deficit measures how much a country spends in excess of its income
• or—equivalently—how it saves too little relative to its investment needs.
What the Current Account Tells Us
CAISGCY

44
Global Imbalances
The charts show saving, investment, and the current account as a percent of each subregion’s GDP for four groups of advanced countries.
The United States has seen both saving and investment fall since 1980, but saving has fallen further than investment, opening up a large current account deficit approaching 6% of GDP in recent years.
Japan’s experience is the opposite: investment fell further than saving, opening up a large current account surplus of about 3% to 5% of GDP.
Saving, Investment, and Current Account Trends: Industrial Countries

45
Global Imbalances
The Euro area has also seen saving and investment fall but has been closer to balance overall.
Other advanced countries (e.g., non-Euro area EU countries, Canada, Australia, etc.) have tended to run large current account deficits.
Saving, Investment, and Current Account Trends: Industrial Countries

46
In all regions, saving and investment have been on a marked downward trend for the past 30 years. Because saving fell faster than investment in the United States, the current account moved sharply into deficit, a trend that was only briefly arrested in the early 1990s.

47
Savings
• We define private saving (Sp) as that part of after-tax private sector disposable income Y that is not devoted to private consumption C.
• We define government saving (Sg) as the difference between tax revenue T received by the government and government purchases G.
• Private saving plus government saving equals total national saving, S
Sp Y T C
Sg T G
gp SSGTCTYGCYS saving Governmentsaving Private
)()(

Savings
Government saving is positive when tax revenue exceeds government consumption (T > G) and the government runs a budget surplus.
If the government runs a budget deficit, however, government consumption exceeds tax revenue (G >T ), and public saving is negative.
As you can see, the taxes cancel out when we put private and government saving together
48
gp SSGTCTYGCYS saving Governmentsaving Private
)()(

49
Private Saving Trends: Industrial Countries

50
Public saving is clearly more volatile than private saving. Japan ran massive surpluses in the late 1980s and early 1990s.
The United States briefly ran a government surplus in the late 1990s but has since racked up massive deficits
Public Saving Trends: Industrial Countries

51
Do government deficits cause current account deficits?
Often they go together - “twin deficits”. Foreigners finance our deficits.
They sell goods and services to us and then accumulate US assets rather than buying US goods and services. Many of these assets are treasury securities.
We can use the equation just given and the current account identity to write
The theory of Ricardian equivalence asserts that a fall in public saving is fully offset by a contemporaneous rise in private saving.
From the data, however, we see private saving does not fully offset government saving in practice.
The current account might move independently of saving (public or private) due to changes in the level of investment in the last equation.
CA Sp Sg I

52
The large weight of the U.S. economy means that in aggregate, the industrial countries have shifted into current account deficit over this period.
This trend has been offset by a shift toward surplus in the developing countries.
Global Imbalances

53
Global Imbalances In the 1990s, emerging markets moved into current account surplus and thus financed the overall trend toward current account deficit of the industrial countries.

54
Global Imbalances Here are savings, investment and the current account for the world. Where is the current account? The world has current account of zero. If one country spends more than its national income, then at least one country spends less. Borrowing must be financed by someone’s saving.