bahauddin zakariya university, multan, 60800, pakistan
TRANSCRIPT
i
Synthesis and characterization of some multiferroic
materials
By
Shafiq Anwar
A dissertation submitted in partial fulfillment of the requirement for the degree of
Doctor of Philosophy
In
Physics
DEPARTMENT OF PHYSICS
BAHAUDDIN ZAKARIYA UNIVERSITY,
MULTAN, 60800, PAKISTAN

ii

iii
This dissertation is dedicated to my
parents, teachers and family
iv
Declaration
I, Shafiq Anwar declare that any material in this thesis, which is not my own
work, has been identified and referred wherever due and that no material has
previously been submitted and approved for the award of a degree by this or
any other university.
Signature of Student
Date:_______________ ___________________________
Shafiq Anwar

v
Certificate
It is certified that Mr. Shafiq Anwar has carried out all the research work
related to this thesis under my supervision at the Department of Physics, Bahauddin
Zakariya University, Multan, Pakistan. In my opinion it is completely adequate in
scope and of good quality needed for the award of PhD degree in Physics.
Supervisor
Prof. Dr. Javed Ahmad
Department of Physics
B.Z.U., Multan.

vi
The Controller Examination,
Bahauddin Zakariya University,
Multan.
We, the supervisory committee, certify that the content and form of thesis title
“Synthesis and characterization of some multiferroic materials” submitted by Shafiq
Anwar has been found satisfactory and recommended that it may be accepted for the
award of PhD degree in Physics.
Supervisory Committee:
Internal Examiner: ________________________________________________
External Examiner: ________________________________________________

vii
ACKNOWLEDGEMENTS
All acclamation and appreciation are for Almighty “ALLAH” The
Magnificent and Merciful and His prophet Muhammad (peace be upon him) who is
forever a torch of guidance and knowledge for humanity.
I have the honour to express my deep sense of gratitude to my supervisor Prof.
Dr. Javed Ahmad whose guidance, cooperation and valuable suggestions helped me
in the completion of this work. In spite of his tough routine, he was ever ready to help
me in every difficult situation and in every type of discussion. His doors were always
open for worthy discussions. His name is sign of encouragement and satisfaction for
me while working at any place.
I am very grateful to all faculty members of Department of Physics for their
academic and experimental support. A humble and respectable thanks to all of my
teachers in my life whose sincere efforts made me able to reach at this stage. I am
also very thankful to HEC, Pakistan for their financial support provided through PhD
indigenous fellowship and IRSIP scholarship program.
I feel much pleasure in extending my sincere appreciation to Dr. Hideo
Kimura (National Institute for Materials Science, Tsukuba, Japan) for providing me
the research facilities. Who has in fact allowed me to work with his research group
and trained me and facilitated me during my stay at Tsukuba, Japan.
It was my fortunate to have many good friends and fellows here at Department
of Physics, BZU, Multan. I appreciate the cooperation and encouragement from all
my friends especially my group fellows Qadeer Awan, Dr. Malika Rani, Dr. Syed
Hammad Bukhari, Toufeeq Jamil, Syed Afaq Ali, Dr. G. Murtaza Khichi and Dr.
Ajmal Khan for their support, co-operation, guidance, wishes and prayers.

viii
Words are lacking to express my humble obligation to my loving mother for
her love and wish to see me successful in life. I would like to appreciate my family; my
wife, Zunaira, Saad, Talha and Hamna who always pray for my success. Last but
not least any acknowledgment could never adequately express my obligation to loving
sister and brothers, Parents in law and the other relatives (some of them are no more
there) who always supported me mentally and spiritually and their encouraging love
boosted my moral to accomplish my goal.
Shafiq Anwar

ix
Abstract
Two batches of polycrystalline materials; La1-xKxFeO3 and LaFe1-xCrxO3 were
prepared by co-precipitation and sol-gel methods respectively while third batch
Bi0.8La0.15Ho0.05Fe1-xMnxO3 (BLHFMO) was synthesized by solid state reaction
method. The structural studies have been carried out by employing X-Ray Diffraction
(XRD), scanning electron microscopy (SEM) and atomic force microscopy (AFM).
The dielectric, ferroelectric and magnetic properties have also been investigated by
employing relevant techniques.
In recent years search for magnetoelectric multiferroic compounds has
remained a subject of significant interest because they can be triggered by electric
and magnetic ferroic orders simultaneously. Recently after identification of
multiferroicity in LaFeO3 (LFO), now it is much focused to improve said properties in
the compound. Similarly BiFeO3 (BFO) is another compound of tremendous interest
for researchers for its multiferroic properties above room temperature. So an effort
has been made to improve the multiferroic properties of LFO, BFO and related
compounds.
In LFO, substituting Cr3+
for Fe improves its magnetic response while
dielectric studies above room temperature verified magnetic phase transition.
Transitions temperature was found to be decreasing with increasing Cr contents. DC
electrical resistivity was also found to be strongly Cr contents dependant; estimation
of activation energy suggested P-type semiconducting behaviour of the compound.
Similarly hole doping at La site by replacing it by K1+
increased the magnetic
property, further P-E loops reflects weak ferroelectric nature of the material.
For BLHFMO, with increase in Mn3+
concentration structural transition from
rhombohedral to orthorhombic phase was detected from XRD results. Further high

x
values of dielectric constant in the vicinity of Neel temperature are related to the
magnetic phase transition. Maximum magnetic response was observed for 10 %
manganese concentration.

xi
Contents
List of Abbreviations xiii
List of Figures xiv
List of Tables xvii
1 Introduction 2
1.1 Types of Multiferroics materials 4
1.1.1 Type-I ferroelectric multiferroics 4
1.1.2 Kinds of Type I multiferroics 4
1.1.3 Type-II magnetic multiferroics 5
1.1.3.1 Spiral magnets 6
1.1.3.2 Collinear magnets 6
1.2 Ferroelectricity 6
1.3 Magnetism 9
1.3.1 Diamagnetism 10
1.3.2 Paramagnetism 10
1.3.3 Ferromagnetism 10
1.3.4 Ferrimagnetism 11
1.3.5 Antiferromagnetism 11
1.3.6 Local environments 14
1.3.6.1 Crystal Fields 14
1.3.6.2 Jahn-teller distortion 15
1.3.7 Magnetic interactions 17
1.3.7.1 Direct Exchange 17
1.3.7.2 Superexchange 17
xii
1.3.7.3 Double Exchange 19
1.3.7.4 Dzyaloshinskii-Moriya interaction 19
1.4 Magnetoelectric effect 20
1.5 Perovskite structure 24
1.6 Applications of Multiferroics 24
1.7 Motivation of Work 25
1.8 Aims and objectives 26
1.9 Structure of thesis 26
References 28
2 Literature Review 31
2.1 Structure of LaFeO3 31
2.2 Multiferroicity in LaFeO3 31
2.3 Effect of A and B site doping in LaFeO3 33
2.4 Bismuth Ferrite BiFeO3 (BFO) 39
2.4.1 Structure of BFO 40
2.4.2 Ion substitution and doping strategy at A or/and B site 42
References 53
3 Experimental Techniques 57
3.1 Material fabrication 57
3.1.1 Synthesis of Bi0.8La0.15Ho0.05Fe1-xMnxO3 by solid state reaction 57
3.1.2 Synthesis of LaFe1−xCrxO3 and La1-xKxFeO3 58
3.2 X-Ray Diffraction (XRD) 61
3.3 Scanning Electron Microscopy (SEM) 65
3.4 Atomic Force Microscopy (AFM) 67
3.5 Dielectric measurement 68

xiii
3.6 Ferroelectric response measurement 70
3.7 D.C. resistivity measurement 72
3.8 Magnetic measurement 73
References 77
4 Effect of Cr on electric and magnetic properties of LaFe1-xCrxO3 79
4.1 Structural analysis 79
4.2 Dielectric properties 82
4.3 Ferroelectric properties 87
4.4 Magnetic properties 88
4.5 Electrical resistivity 96
4.6 Summary 97
References 99
5 Effect of K+1
substitution on electric and magnetic properties of La1-xKxFeO3
............................................................................................................................. 102
5.1 Structural analysis 102
5.2 Dielectric and ferroelectric properties 105
5.3 Magnetic properties 109
5.4 Summary 115
References 116
6 Effect on Mn3+
substitution on electrical and magnetic properties of
Bi0.8La0.15Ho0.05Fe1-xMnxO3 118
6.1 Structural analysis 119
6.2 Dielectric properties 120
6.3 Magnetic properties 125
xiv
6.4 Ferroelectric properties 130
6.5 Summary 131
References 132
7 General Conclusions and Future work 135
xv
List of Abbreviation
ME Magnetoelectric
MF Multiferroic
DM Dzyaloshinskii-Moriya
AFM Antiferromagnetic
FE Ferroelectric
FC Field cool
ZFC Zero field cool
P Polarization
M Magnetization
TC Ferroelectric Temperature
TN Neel Temperature
Tanδ Dielectric loss factor
ε Dielectric constant
FM Ferromagnetic

xvi
List of Figures
Figure 1.1 The Primary ferroic order parameters, ferromagnetism (M), ferroelectricity
or polarization (P) and Ferroelasticity (ε); their conjugates, magnetic field (H), electric
field (E) and stress field (ζ); cross coupling is shown by black, purple and red arrows.
.......................................................................................................................................2
Figure 1.2 Typical polarization vs electric field plots showing different hysteresis
behaviour of (a) linear dielectric, (b) paraelectric, (c) ferroelectric and (d) anti-
ferroelectric materials.....................................................................................................8
Figure 1.3 Typical χ vs T curve for antiferromagnetic materials .............................12
Figure 1.4 Graphic representation for arrangement of magnetic moments for (a) A-
type, (b) C-type, (c) G-type and (d) canted spin antiferromagnetism........................13
Figure 1.5 Crystal field splitting of the d orbital in an octahedral crystal environment
......................................................................................................................................15
Figure 1.6 Jahn-Teller effect for Mn3+
in octahedral arrangement ..........................16
Figure 1.7 Two magnetic atoms, M, separated by an oxygen atom, O. (a)
Superexchange favours antiferromagnetic arrangement of magnetic ions as in this
environment electrons can easily move to either magnetic atom as represented in (b)
and (c)...........................................................................................................................18
Figure 1.8 Double exchange mechanism gives ferromagnetic coupling between Mn3+
and Mn4+
ions participating in electron transfer, neighbouring ions are
ferromagnetically aligned.............................................................................................20
Figure 1.9 The effect of time and spatial inversion on (a) ferromagnets (b)
ferroelectrics and (c) multiferroics...............................................................................22
Figure 1.10 Basic perovskite structure with larger cation A (large black circles) at
corner with 12-fold coordination and smaller B (small red circle) cation at centre of
cube with 6-fold coordination. Blue circles show anion oxygen at the centre of cube
faces..............................................................................................................................23
Figure 2.1 ABO3 Orthorhombic distortion of crystal structure. .................................32
Figure 2.2 Variation of MC of LaFeO3 with the variation of external magnetic field
......................................................................................................................................33

xvii
Figure 2.3 M-H loop for LFO at room temperature…................................................34
Figure 2.4 Magnetization vs Field (M-H) loop for LFO.............................................35
Figure 2.5 M-H loops for LFO and YFeO3 at 5 K......................................................38
Figure 2.6 (a) M vs T graph for LFO at 500 Oe. Inset shows inverse susceptibility vs
T graph (b) M vs H loops at 5 K and 300 K ................................................................40
Figure 2.7 Schematic diagram of the BFO crystal structure and the ferroelectric
polarization (arrow) and antiferromagnetic plane (shaded planes)..............................41
Figure 2.8 Room temperature M-H loops for Bi1-xLaxFeO3.......................................43
Figure 2.9 Room temperature M-H loops for Bi1-xLaxFe0.95Mn0.05O3 .......................46
Figure 2.10 M-T magnetization loop for Bi1-xLaxFeO3 samples ...............................47
Figure 2.11 FC and ZFC magnetization curves for BiFe1-xCoxO3..............................48
Figure 2.12 The FC and ZFC magnetizations for Sr and Pb co-doped BFO
compounds in applied magnetic field of 1000 Oe.......................................................50
Figure 2.13 P-E hysteresis loops for Bi1-xHoxFeO3.....................................................51
Figure 2.14: Magnetic hysteresis loop for BFO material milled for different durations
and sintered at 650 oC ..................................................................................................52
Figure 3.1 A Schematic Diagram for Sol gel Process……………………………….60
Figure 3.2 A schematic ray diagram showing Bragg‟s diffraction of X-rays
interacting with two consecutive layers of atoms........................................................62
Figure 3.3 Diagram showing effects of Strain in XRD data.......................................63
Figure 3.4 Rigaku X-Ray diffractometer setup...........................................................65
Figure 3.5 Schematic diagram showing working of SEM ………………..………...66
Figure 3.6 Block diagram showing working principle for AFM ..............................67
Figure 3.7 Diagram showing parallel plate capacitor in which electrodes are separated
by (a) vacuum (b) dielectric material ........................................................................70
Figure 3.8 The experimental setup for the Ferroelectric Tester (Aix-ACCT TF-2000)
.....................................................................................................................................71
Figure 3.9 Keithley source meter 2400 ......................................................................72
xviii
Figure 3.10 Schematic diagram for two probe method ...........................................73
Figure 3.11 The pickup coils for SQUID magnetometer ...........................................74
Figure 3.12 The MPMS setup for magnetic measurements .......................................75
Figure 4.1 Powder XRD patterns for LaFe1−xCrxO3 (0.0 ≤ x ≤ 0.5)............................80
Figure 4.2 AFM images for LaFe1−xCrxO3 (0.0 ≤ x ≤ 0.5)..........................................81
Figure 4.3 Dielectric constant as function of frequency at room temperature for
LaFe1-xCrxO3. Inset shows the dielectric loss as a function of frequency...................83
Figure 4.4 Dielectric constant as a function of temperature at fixed frequencies for
LaFe1−xCrxO3................................................................................................................86
Figure 4.5 P-E hysteresis loops for LaFe1−xCrxO3 at 77 K..........................................87
Figure 4.6 Graph showing P(max) and 2Pr values for LaFe1-xCrxO3 at 77 K.................88
Figure 4.7 M-H curves for LaFe1−xCrxO3 at 5 K ........................................................89
Figure 4.8 Magnetic parameters Mr and Hc at 5 K for LaFe1-xCrxO3 (x = 0.0, 0.1, 0.3,
0.4, 0.5 and 0.8) ...........................................................................................................92
Figure 4.9 ZFC-FC plots for LaFe1−xCrxO3.................................................................95
Figure 4.10 Variation of Resistivity (ρ) with temperature for aFe1−xCrxO3...............96
Figure 5.1 Powder XRD patterns of La1-xKxFeO3 (x ≤ 0.5) ....................................103
Figure 5.2 AFM images for La1-xKxFeO3 for x=0, 0.1, 0.2, 0.3, 0.4 & 0.5..............104
Figure 5.3 Dielectric constant as function of temperature for different frequencies for
La1-xKxFeO3. Inset shows the dielectric loss as a function of temperature. (a) to (f) for
x = ≤ 0.5.....................................................................................................................107
Figure 5.4 P-E hysteresis loops for La1-xKxFeO3 (x=0, 0.1) at room temperature...108

xix
Figure 5.5 P-E hysteresis loops for La1-xKxFeO3at liquid helium temperature i.e. 77
K.................................................................................................................................109
Figure 5.6 M-H hysteresis loops for La1-xKxFeO3at 5 K..........................................110
Figure 5.7 M-T FC and ZFC loops for La1-xKxFeO3.................................................113
Figure 6.1 Powder XRD patterns for Bi0.8La0.15Ho0.05Fe1-xMnxO3 (0.0 ≤ x ≤ 0.3)....119
Figure 6.2 SEM image for Bi0.8La0.15Ho0.05Fe1-xMnxO3 (a) x = 0.0 (b) x = 0.1 (c) x =
0.3 ………………………………..…………………………………………………121
Figure 6.3 Dielectric constant as a function of temperature at different frequencies for
Bi0.8La0.15Ho0.05Fe1-xMnxO3 (0.0 ≤ x ≤ 0.3). Inset shows the tanδ.............................124
Figure 6.4 M-T hysteresis loops for Bi0.8La0.15Ho0.05Fe1-xMnxO3 (0.0 ≤ x ≤ 0.3)....127
Figure 6.5 Room temperature M-H hysteresis loops for Bi0.8La0.15Ho0.05Fe1-xMnxO3
(0.0 ≤ x ≤ 0.3) ............................................................................................................129
Figure 6.6 P-E hysteresis loops for Bi0.8La0.15Ho0.05Fe1-xMnxO3 (0.0 ≤ x ≤ 0.3) at 77
K.................................................................................................................................130

xx
List of Tables
Table 4.1 Grain size calculated from XRD graphs LaFe1−xCrxO3 samples................81
Table 4.2 Parameters calculated from M-H curves for LaFe1−xCrxO3 samples.........91
Table:4.3 Activation energy Vs Cr+3
concentration for LaFe1-xCrxO3 .....................97
Table 5.1 Grain size calculated from XRD graphs La1-xKxFeO3 samples. ...............103
Table 5.2 Parameters calculated from M-H curves for La1-xKxFeO3 samples.........114
Table 6.1 Grain size calculated from XRD graphs Bi0.8La0.15Ho0.05Fe1-xMnxO3
samples.....................................................................................................120
Table 6.2 Variation of magnetic moment with the concentration of Mn at 5 K .......128

1
Chapter No. 1
Introduction

2
1 INTRODUCTION
The thesis focuses on the preparation, analysis of various material properties,
and applications of multiferroics. The essential physics of multiferroics and
perovskite structure is mainly focused in present Chapter. It introduces the basic
knowledge about ferroelectricity and magnetism in materials.
σ
ε
H
M
P
E
Figure 1.1: The Primary ferroic order parameters, ferromagnetism (M),
ferroelectricity or polarization (P) and Ferroelasticity (ε); their conjugates,
magnetic field (H), electric field (E) and stress field (ζ); cross coupling is
shown by black, purple and red arrows.

3
Multiferroics, the term introduced by Schmid [1], exhibit two or more
primary ferroic properties at the same time in the same phase. The recognized primary
ferroics are ferromagnets, ferroelectrics and ferroelastics [2]. In Figure 1.1, Vertices
of the triangle show the basic ferroic phenomena whereas the ferromagnetic,
ferroelectric, and ferroelastic switching is indicated by green, red and blue arrows
correspondingly.
The most remarkable feature of multiferroics is the cross-coupling between the
order parameters which are represented by the sides of the triangle. Coupling between
polarization and deformation in ferroelectric ferroelastics results in piezoelectricity
which is well recognized and extensively exploited (e.g. in sonar detectors). Likewise,
piezomagnetism is obtained by strong coupling between magnetism and structure, this
material property is further used in magnetomechanical actuation or magnetic sensing.
The multiferroics that possess ferromagnetism and ferroelectricity simultaneously are
less common and are represented by the left edge of the triangle. These materials are
attractive as they produce magnetoelectric effect i.e. electric field can provoke the
magnetization and magnetic field can induce electric polarization.
Presence of coupling between these order parameters leads to new fascinating
field which results in the control of these order parameters in a coupled way. These
multiferroic materials possessing ferroelectric (FE) and ferromagnetic (FM) properties
offer prospective importance for functional devices. For practical use the presence of
FM and FE properties in single phase well above the room temperature is the
prerequisite [1]. Apart from its primary importance, the mutual control of FM and FE
properties is also very significant for use in functional materials as magnetic storage
media and spintronics [3]. Multifunctional materials are presently of considerable
importance in which many physical properties could be used all together. For the

4
prospective development and understanding of multifunctional materials, key concern
of researchers is to improve the mutual coupling between these properties so that
these can be used in applications.
1.1 Types of Multiferroics Materials
Single phase multiferroic materials can be classified into following two major
types.
1.1.1 Type -I ferroelectric multiferroics
If the multiferroic materials have independent sources for ferroelectricity and
magnetism then they are classified as Type-I multiferroics. In these materials, as
compared to magnetism, ferroelectricity appears at higher temperatures and normally
they possess large polarization values. These materials have different mechanisms and
energy scales for FM and FE orders which is evidenced from difference in their
transition temperatures. Due to different mechanism involved, magnetoelectric
coupling is weak in these materials. Type I materials can be classified in different
subgroups according to mechanisms involved in multiferroicity.
1.1.2 Kinds of Type I Multiferroics
(i) Charge ordered multiferroics
(ii) Geometrical frustrated multiferroic
(iii) Magnetically driven multiferroics
(iv) Lone pair multiferroics
Charge ordering can take place in compounds which contain mixed valency ions.
Delocalized electrons are arranged in ordered pattern and restricted at different cation
sites making material insulating. In case of polar pattern of electrons, this ordered

5
state becomes ferroelectric and if ions are magnetic then ferroelectric state shows
multiferroicity. A famous example is LuFe2O4 [4], where the ordering of Fe2+
and
Fe3+
provides ferroelectricity.
For geometrically frustrated multiferroics, nonlinear coupling among different
lattice distortion is considered as driving force for ferroelectricity as proposed by first
principle calculations [5]. One of the most prominent examples of these compounds is
RMnO3. In these compounds, ferroelectricity is produced due to coupling between
different phonon modes.
In magnetically driven multiferroics, non-centrosymmetric long range magnetic
order induces electric polarization at macroscopic level. Magnetic ordering results in
subsequent displacement of ions, so electronic orbital gets polarized and
ferroelectricity is induced. In few systems, spiral spin phase is accomplished by
Heisenberg spin-spin coupling which is ferromagnetic for nearest neighbour and
antiferromagnetic for next nearest neighbour [6]. Additionally in some systems, Ising
type spin-spin interaction can also induce lattice distortions. In this type, materials are
mostly oxides and electrically insulating.
In lone pair multiferroics, A-site cation is responsible for ferroelectric
displacement while partially filled d-shell at B-site induces magnetism. In few
perovskite materials, distortion at A-site produces ferroelectricity [7]. This distortion
is induced due to hybridization of 6p orbital of A-site and 2p orbital of O atoms due to
strain from surfaces. BiFeO3 is a well-known example of lone pair multiferroic
material.
1.1.3 Type-II magnetic multiferroics.
In this type of multiferroics, ferroelectricity is caused by magnetism and
strong coupling exists between them. TbMnO3 is well-known example of this type of

6
multiferroics. Electric polarization exhibits small values in these materials and
ferroelectricity appears at a lower temperature as compared to magnetic order. As
compared to type-I multiferroics, magnitude of polarization is much smaller in type-II
multiferroics. These can be divided into following two groups.
1.1.3.1 Spiral magnets
These are the materials which possess atomic spin rotated across the lattice in
definite plane. In this way, this will allow ferroelectricity after breaking the
symmetry. However spiral magnet show ferroelectric property when spins rotate in
the plane of transmission of the spiral spin structure. Ferroelectricity in this case is
developed according to Dzyaloshinsky-Moriya interaction in the plane of cycloid
which is perpendicular to the direction of transmission of cycloid [8, 9].
1.1.3.2 Collinear magnets
These materials have one dimensional series of up-up-down-down spins made
due to exchange striction. The distortion induced through up-up or up-down (and vice
versa) bonds is different which triggers the development of ordered electric dipoles.
Keeping in view the major properties of both types of multiferroics, now the
major focus of the research is to find a material with polarization magnitude of type-I
multiferroic materials and strong magnetoelectric coupling as like type-II
multiferroics.
1.2 Ferroelectricity
In a proper ferroelectric material, an electric dipole possesses spontaneous
polarization that can be controlled by applying electric field. This polarization arises
due to lack of inversion symmetry in crystal structure. For example, in standard
perovskite of the form ABO3, usually transition metal element occupying the central

7
B-site is surrounded by an octahedron of negatively charged oxygen ions. Now a
change in position of B-site ion would destroy the inversion symmetry and resultantly
ferroelectric order is established due to induction of dipole moment. This type of
changes can take place during structural phase transitions when a system moves from
high to low symmetry as from cubic to rhombohedral or tetragonal symmetry. BaTiO3
is a well known example for proper ferroelectrics [10, 11]. Mostly ferroelectric
perovskites have B-site atom with empty d electron shell, this results in covalent
bonding with oxygen atoms with full p orbitals. A-site atoms have lone pairs of
electrons on their outer shell which are extremely susceptible to polarization. So
ferroelectricity is observed due to these lone pairs e.g. in BiFeO3.
According to dipole orientations, materials can be divided into following
kinds.
Linear Dielectric Materials: Electric polarization depends linearly on the
applied electric field in most of the oxides. Permittivity in these materials does not
change even at high electric field. P-E plots for such materials show a straight line
passing through the origin as drawn in Figure 1.2 (a).
Paraelectric Materials: In such materials when electric field is applied,
electric dipoles are temporarily arranged in the direction of applied field and dipoles
become unarranged when electric field is removed. These materials, having non-linear
relation between electric polarization and electric field, are called paraelectric. Figure
1.2 (b) represents typical P-E plot for paraelectric materials.

8
Ferroelectric Materials: These materials exhibit spontaneous electric
polarization even in the absence of external electric field. Electric dipoles in these
materials are arranged in parallel to each other. By reversing the direction of applied
electric field, orientation of the electric dipoles can be reversed in these materials.
This hysteresis behaviour of ferroelectric materials is shown in Figure 1.2 (c).
c)
E
P P
E
P
E E
P
a) b)
d)
Figure 1.2: Typical polarization vs electric field plots showing different
hysteresis behaviour of (a) linear dielectric, (b) paraelectric, (c) ferroelectric
and (d) anti-ferroelectric materials.

9
Anti-Ferroelectric Materials: If electric dipoles in material are arranged in
such an anti-parallel pattern that net spontaneous polarization become zero at zero
electric field, the material is called anti-ferroelectric. Hysteresis behaviour splits into
two loops as shown in Figure 1.2 (d).
If in a material spontaneous polarization occurs due to some other reason
rather than polar displacement of ions, it is called improper ferroelectric.
Geometric Ferroelectric: In these materials dipole moment takes place as a
result of non-polar distortions e.g. due to electrostatic forces as compared to changes
in chemical bonding. YMnO3 is an example of improper geometric ferroelectric
materials, in this buckling of rigid MnO5 bipyramids results in reorientation of ions
and ferroelectric state [12].
Charge ordered ferroelectric: In these materials, electron correlation in
material results in spontaneous polarization [13]. LuFe2O4 is famous example of
charge ordered improper ferroelectric material [14].
1.3 Magnetism
An active space is produced around an electron when it is in spin motion, this
active space is called magnetic field. Other charges experience force of attraction or
repulsion while facing this active space and this behaviour to repel or attract is called
magnetism. Magnetic field can be generated in two directions depending upon the
clockwise or anti-clockwise spin of electron. This magnetic field is categorized into
two types according to spin of electrons, if spin of electrons is anti-clockwise then it is
called „spin up‟ and if spin of electron is clockwise then it is called „spin down‟ which
is in opposite direction to previous one. Spin motion of electrons majorly contributes
towards magnetism; however small magnetic field is produced due to small current

10
loops originating from orbital motion of electrons about the nucleus. Considering the
magnetic response, materials can be classified into different groups like diamagnetic,
paramagnetic, antiferromagnetic, ferromagnetic and ferrimagnetic. Properties of these
materials are briefly discussed below.
1.3.1. Diamagnetism
Diamagnetic materials have the property to oppose external magnetic field.
These materials show small negative susceptibility „χ‟ of the order of -10-5
which is
temperature independent. Orbital motion of the electrons about the nucleus causes
small localized magnetic field. In such materials magnetic field is produced in
directions where it opposes the applied magnetic field. So material experiences a
repulsive force in the presence of magnetic field.
1.3.2. Paramagnetism
In the absence of external magnetic field, paramagnetic materials have
magnetic dipoles arranged in different directions so that there is no net magnetic field.
Unpaired electrons present in these materials exhibit incomplete cancellation of
electron spins. As a result atomic dipoles are generated. In the absence of magnetic
field spontaneous magnetization exists while by applying field magnetic dipoles are
arranged in the direction of applied field.
1.3.3. Ferromagnetism
Ferromagnetism is the property of the materials in which they show
spontaneous magnetization in the absence of applied external magnetic field. Electron
spins are arranged in such a manner that due to incomplete cancellation, magnetic
dipoles are produced. In these materials, uncompensated spins of electrons are aligned

11
through process of exchange interaction present between different types of ions.
Ferromagnetic materials have the property of reversible spontaneous magnetization
i.e. the direction of magnetic moments is reversed accordingly by changing the
direction of applied magnetic field. Due to this property these functional materials
have very important potential use in the field of magnetic memory storage and
electromagnetism. Magnetic susceptibility of the order of 105 for these materials is
considered as very significant for their applied use.
1.3.4. Ferrimagnetism
In some materials superexchange interaction between unlike cations and
anions present in the materials results in development of magnetic sublattices with
unequal magnetic moments. These neighbouring sublattices with unequal magnetic
moments result in nonzero net magnetization. This property of materials is known as
ferrimagnetism. This response of material is like ferromagnetism, regarding
spontaneous polarization, Curie temperature (TC) and hysteresis response [15].
1.3.5. Antiferromagnetism
In several materials, neighbouring sublattices with equal magnetic moments
are arranged in opposite direction to result in zero net magnetization. This response of
materials is called antiferromagnetism. Antiferromagnetism disappears above a
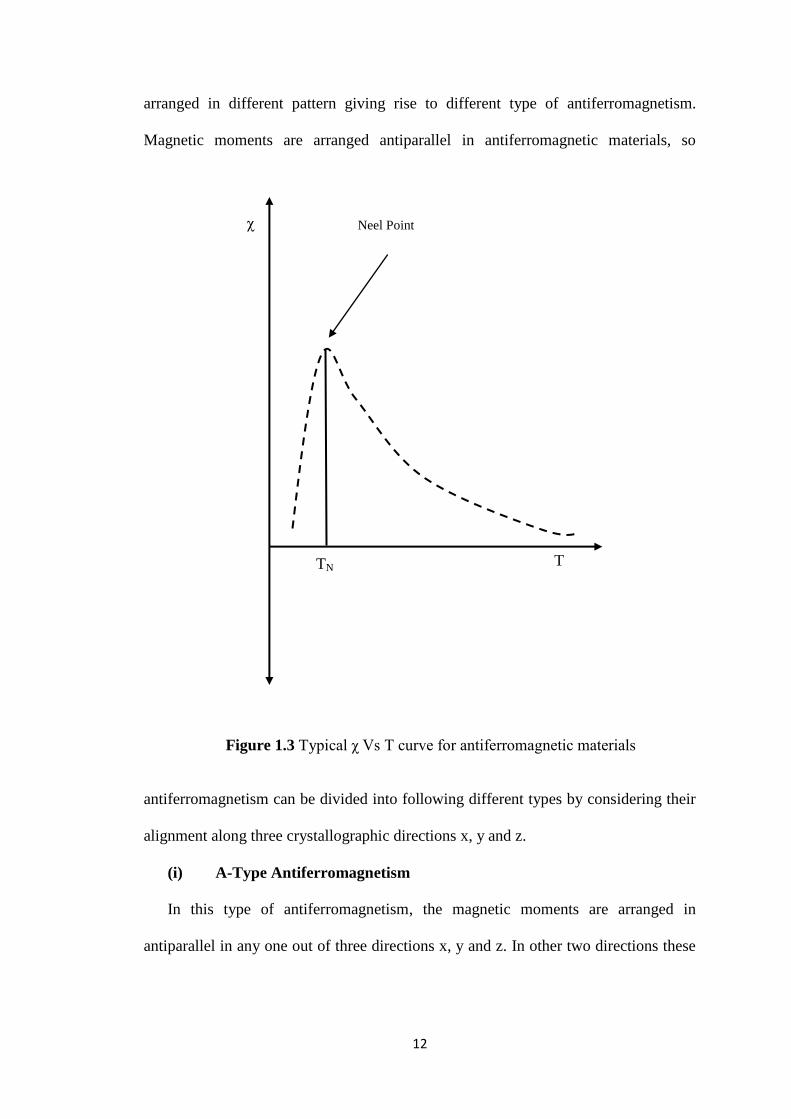
certain temperature called Neel temperature (TN) and material turns to paramagnet.
Typical response of magnetic susceptibility (χ) to the temperature (T) for
antiferromagnetic materials is presented in Figure 1.3.
In antiferromagnetic materials, superexchange and double exchange
interactions separately or collectively influence the magnetic behaviour of the system.
As a result of these interactions among cations and anions, magnetic moments are
12
arranged in different pattern giving rise to different type of antiferromagnetism.
Magnetic moments are arranged antiparallel in antiferromagnetic materials, so
antiferromagnetism can be divided into following different types by considering their
alignment along three crystallographic directions x, y and z.
(i) A-Type Antiferromagnetism
In this type of antiferromagnetism, the magnetic moments are arranged in
antiparallel in any one out of three directions x, y and z. In other two directions these
Neel Point χ
T TN
Figure 1.3 Typical χ Vs T curve for antiferromagnetic materials

13
are parallel to each other. It means ferromagnetically aligned planes are piled in
antiferromagnetic manner as shown in Figure 1.4 (a).
(ii) C-Type Antiferromagnetism
In this type of antiferromagnetism, magnetic moments are arranged antiparallel in
any two out of three x, y and z crystallographic directions as shown in Figure 1.4 (b).
In third direction moments are arranged in parallel. It means that
antiferromagnetically aligned planes are piled in parallel way.
(iii) G-Type Antiferromagnetism
In this type of antiferromagnetism, magnetic moments are arranged in antiparallel
in all three crystallographic directions x, y and z as represented in Figure 1.4 (c). It
(a) (b)
(c) (d)
Figure 1.4 Graphic representations for arrangement of magnetic
moments for (a) A-type, (b) C-type, (c) G-type and (d) canted
spin antiferromagnetism.

14
means that antiferromagnetically arranged planes are piled in inverse directions.
(iv) Spin Canted Antiferromagnetism
In this type of antiferromagnetism, magnetic moments are inclined to certain angle
instead of completely antiparallel to each other as represented in Figure 1.4 (d).
This inclined spin structure of magnetic moments results in net small
magnetization in specific direction. This response in the material is considered as
canted spin antiferromagnetism mostly known as weak ferromagnetism.
1.3.6 Local environments
1.3.6.1 Crystal Fields
Arrangement of anions and cations in a crystal influence the magnetic
properties of the material in significant way. In other words these neighbouring atoms
create an electric field called crystal field. Arrangement of atomic orbitals plays a
significant rule in producing crystal field effect. Generally in a crystal, the anions and
cations are arranged in a way to reduce the effects of electrostatic repulsion. A
common use of crystal field is in octahedral environment. Materials under study in
this research have perovskite structure where as Mn3+
and/or Fe3+
ions occupy central
place encircled by O2-
ions making an octahedron. Considering Mn/Fe ion at central
place, the electrostatic forces exist between d orbital of Mn/Fe cation and p orbitals of
O anion.
In this environment, the d orbitals can acquire five different energy levels
which can be divided in two groups; eg orbitals which point along x, y and z axis (dz2
pointing along z-axis while dx2-y
2 pointing along x and y axis and the t2g orbitals point
between the axis (dxy, dxz and dyz). The p orbital divided in three types px, py and pz
points along their respective axis. So in octahedral arrangement the eg orbitals will
have higher energy environment than t2g orbitals [16]. Subsequent splitting of energy

15
levels in d orbital in octahedral environment is shown in Figure 1.5. In the figure ∆
represents amount of splitting which depends on many factors such as structure of
octahedra, repulsion between ions and Jahn-Teller distortion effects.
1.3.6.2 Jahn-Teller distortion
In magnetic systems, crystal structure is sometimes distorted in order to lower
the overall energy. This happens because resultant energy saving as a result of
distortion balances the energy cost of increased elastic energy. This effect on crystal
structure is called Jahn-Teller effect. Mn3+
ion in octahedral environment with 4
Figure 1.5 Crystal field splitting of the d orbital in an octahedral
crystal environment [16]

16
electrons in partially filled 3d shell can be taken as the example of Jahn-Teller
distortion.
By using Hund‟s first rule, electron spins will align parallel in preferred spin
configuration giving three electrons to fill lower energy t2g levels and last electron in
eg level with higher energy. During this distortion eg and t2g energy levels are spilt into
further sub-energy levels due to stretch of octahedra along z-axis and shrinking along
Figure 1.6 Jahn-Teller effect for Mn3+
in octahedral arrangement [16]

17
x and y-axis. As a result of splitting of energy levels, single electron in eg state moves
to lower energy level as shown in Figure 1.6. Thus as result of this distortion, energy
of certain orbitals is increased with a subsequent decrease in others.
1.3.7 Magnetic Interactions
Some magnetic interactions important with reference to this study are
discussed below. The magnetic interactions are important as long range order in solids
depends upon the interaction of magnetic moments involving these phenomena.
1.3.7.1 Direct Exchange
In this type of magnetic interaction electrons on two neighbouring atoms
interact without the requirement of an intermediary ion, so known as direct exchange.
Apparently it looks that this is most preferred way for magnetic interactions between
ions but practically it is not an important means to control magnetic properties
because direct overlap among neighbouring orbitals is not sufficient.
1.3.7.2 Superexchange
If the magnetic interaction between two neighbouring magnetic ions with
same valence state occurs through an intermediate ion then interaction is known as
indirect exchange or superexchange. To understand the interaction, take a system with
two magnetic ions having single electron in d-orbital with oxygen atom as an
intermediate ion. Under ionic bonding conditions, the oxygen ion has two electrons
in the p-orbital which will overlap the d-orbitals of neighbouring magnetic atom as
shown in Figure 1.7. If the magnetic ions are arranged antiferromagnetically then
energy of the system will be lowered as electron can easily move from oxygen ion to
each magnetic ion. On the other hand, if magnetic ions are arranged ferromagnetically
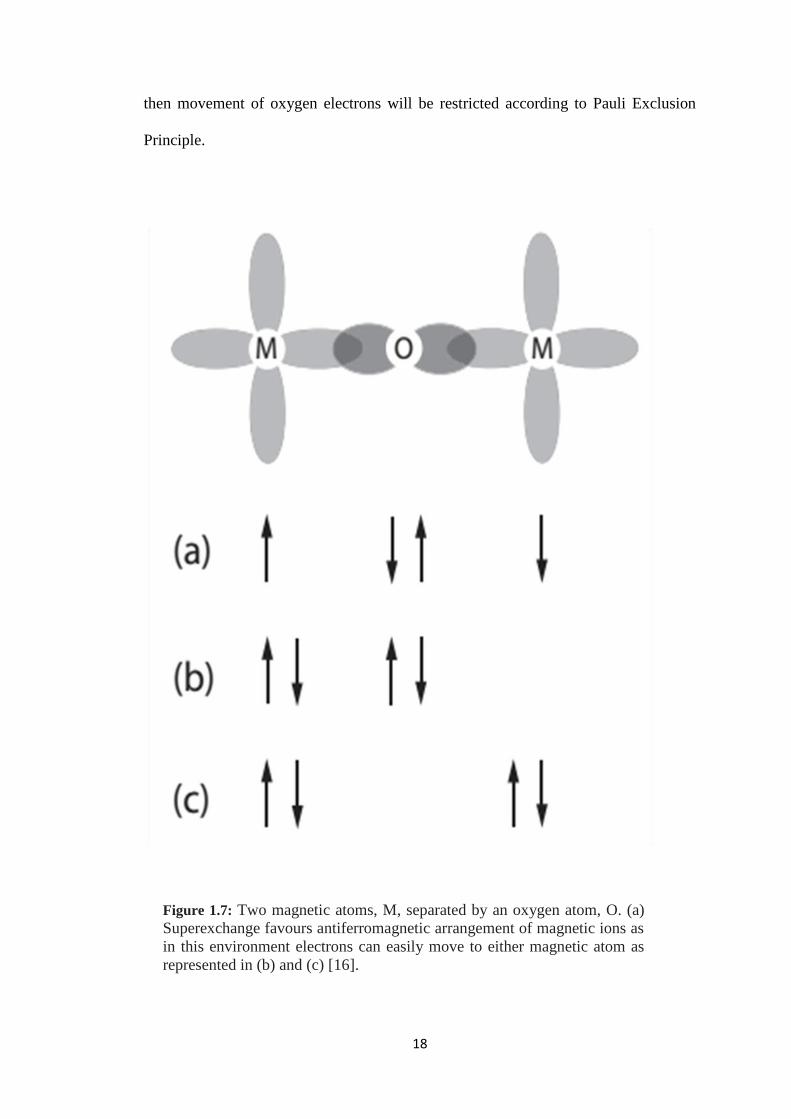
18
then movement of oxygen electrons will be restricted according to Pauli Exclusion
Principle.
Figure 1.7: Two magnetic atoms, M, separated by an oxygen atom, O. (a)
Superexchange favours antiferromagnetic arrangement of magnetic ions as
in this environment electrons can easily move to either magnetic atom as
represented in (b) and (c) [16].
19
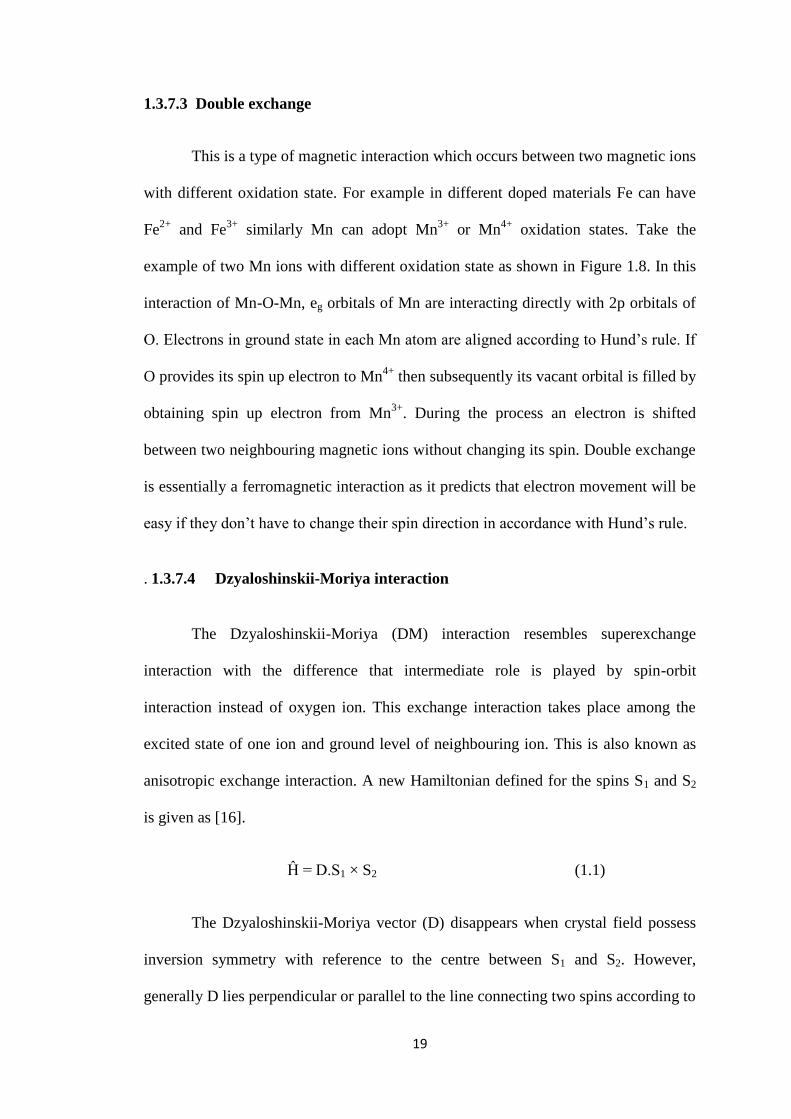
1.3.7.3 Double exchange
This is a type of magnetic interaction which occurs between two magnetic ions
with different oxidation state. For example in different doped materials Fe can have
Fe2+
and Fe3+
similarly Mn can adopt Mn3+
or Mn4+
oxidation states. Take the
example of two Mn ions with different oxidation state as shown in Figure 1.8. In this
interaction of Mn-O-Mn, eg orbitals of Mn are interacting directly with 2p orbitals of
O. Electrons in ground state in each Mn atom are aligned according to Hund‟s rule. If
O provides its spin up electron to Mn4+
then subsequently its vacant orbital is filled by
obtaining spin up electron from Mn3+
. During the process an electron is shifted
between two neighbouring magnetic ions without changing its spin. Double exchange
is essentially a ferromagnetic interaction as it predicts that electron movement will be
easy if they don‟t have to change their spin direction in accordance with Hund‟s rule.
. 1.3.7.4 Dzyaloshinskii-Moriya interaction
The Dzyaloshinskii-Moriya (DM) interaction resembles superexchange
interaction with the difference that intermediate role is played by spin-orbit
interaction instead of oxygen ion. This exchange interaction takes place among the
excited state of one ion and ground level of neighbouring ion. This is also known as
anisotropic exchange interaction. A new Hamiltonian defined for the spins S1 and S2
is given as [16].
Ĥ = D.S1 × S2 (1.1)
The Dzyaloshinskii-Moriya vector (D) disappears when crystal field possess
inversion symmetry with reference to the centre between S1 and S2. However,
generally D lies perpendicular or parallel to the line connecting two spins according to

20
the symmetry. In an antiferromagnetic structure, the DM interaction results in small
canting of the moments thus producing weak ferromagnetism. The DM interaction
also supports non-collinear spin ordering which greatly affects multiferroic properties.
1.4 Magnetoelectric effect
The magnetoelectric (ME) effect is the process of inducing electric (magnetic)
polarization by applying an external magnetic (electric) field. External field controls
the effects to be linear and/or non-linear. Generally this effect depends on temperature
and can be observed in composite materials with single phase.
eg
t2g
eg
t2g
Mn3+
(d4) Mn
4+ (d
3)
O 2p
Figure 1.8: Double exchange mechanism gives ferromagnetic coupling
between Mn3+
and Mn4+
ions participating in electron transfer,
neighbouring ions are ferromagnetically aligned.

21
Landau theory is generally used to describe the magnetoelectric effect in a
crystal by writing a relation for free energy F of the material in an applied electric and
magnetic field E and H respectively. Relation for F is written as [17],
F(E,H) = Fo – FiS
Ei – MiS
Hi – ½ εo εij Ei Ej – ½ μo μij Hi Hj – αij Ei Hj
– ½ βijk Ei Hj Hk – ½ γijk Hi Ej Ek – ........ (1.2)
Here ε represents permittivity, μ stands for permeability and α is a called
magnetoelectric susceptibility tensor. Superscript S represents spontaneous
components.
To find the magnetization M and electric polarization P of the material, equation
1.2 can be differentiated which results in following equations,
Pi(E,H) = – ∂F/∂Ei = PiS + εo εij Ej + αij Hj + ½ βijk Hj Hk + γijk Hi Ej (1.3)
Mi(E,H)= – ∂F/∂Hi =MiS + μo μij Hj + αij Ei + βijk Ei Hj + ½ γijk Ej Ek (1.4)
In above equations α is taken as linear magnetoelectric effect and it explains the
cross-coupling among magnetic field and electric polarization and electric field and
magnetization in last two equations respectively. This coupling represents
magnetoelectric effect. The constant terms β and γ show higher order coupling which
are omitted from discussion here.
Time and spatial inversion effects can be used explain the cross-coupling
between electric and magnetic properties of different materials as most of the
materials don‟t exhibit this cross-coupling. There is sign change in electric field and
electric polarization in spatial reversal whereas they have no change under time
inversion. On the other hand, magnetic field and magnetization have sign change on

22
time reversal whereas no change under spatial inversion. For a material having
inversion symmetry, the magnetoelectric susceptibility tensor remains invariant. If
spatial inversion is applied to the cross-coupling term for electric polarization then P
= αH gives –P = αH. This can be consistent with original condition only if α = 0. This
shows that magnetoelectric coupling is not possible in these materials as similar
results are obtained when spatial or time reversal operations are applied to
magnetization or polarization. So from above discussion it is clear that a material can
have non zero value of linear magnetoelectric effect (α) only it breaks both spatial and
time inversion symmetry as explained in Figure 1.9.
Cr2O3 is famous example of single phase magnetoelectric material [19].
Piezoelectric (electrostrictive) and ferromagnetic (magnetostrictive) materials
combine to form composite magnetoelectrics. Microscopic mechanism responsible for
the said phenomenon decides the size of the effect. Like few multiferroics, coupling
Figure 1.9: The effect of time and spatial inversion on (a) ferromagnets
(b) ferroelectrics and (c) multiferroics [18]
23
of electric and magnetic orders is responsible for the effect in single phase
magnetoelectrics. Interface coupling effects like strain create the above said effect in
composite materials. ME effect can be effectively used in tunable microwave filters,
sensitive detection of magnetic fields and advanced logic devices [19].
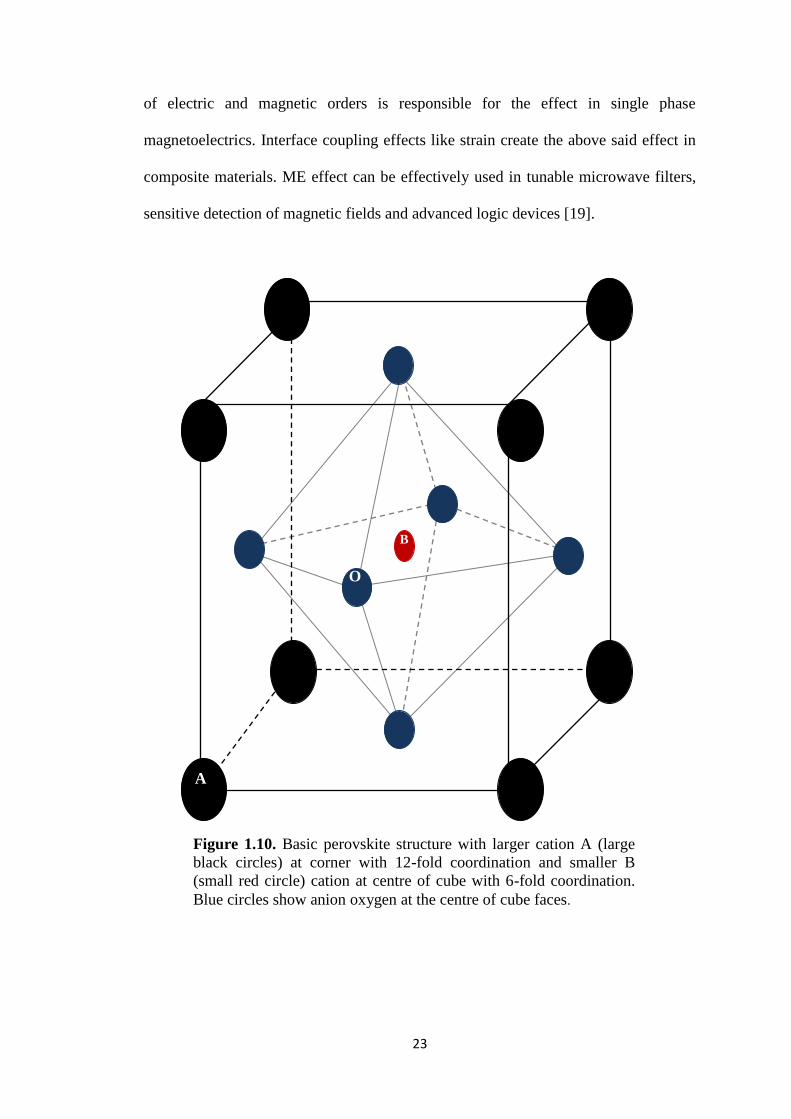
B
O
A
Figure 1.10. Basic perovskite structure with larger cation A (large
black circles) at corner with 12-fold coordination and smaller B
(small red circle) cation at centre of cube with 6-fold coordination.
Blue circles show anion oxygen at the centre of cube faces.

24
1.5 Perovskite Structure
The perovskite structure is one of the most promising structures to exist. It has
formula ABX3 and belongs to ternary class of crystalline structures. Its prototypical
structure is given in Figure 1.10. It has dense packing of X anions (preferably oxygen)
with two types of sites, one with coordination eight or twelve and other with
coordination six.
At octahedral sites small cations with one to six valence oxidation states can
be hosted whereas in eight or twelve coordination sites, mono, di or trivalent large
sized cation are accommodated. Twelve X anions in cubic-octahedral coordination
surround each A cation while six X anions surround each B cation in octahedral
coordination. Perovskite materials can crystallize in all possible symmetries i.e. from
cubic (high symmetry) to triclinic (very low symmetry).
1.6 Applications of Multiferroics
Multiferroic materials are called multifunctional materials as they connect
ferroelectric and ferromagnetic properties simultaneously in same phase, so they can
be used to develop non-volatile memory for computers, power control devices like
transformers, magnetic field sensors, gas sensors, filters, resonators etc. All these
properties are based on the concept that if ferroelectric and ferromagnetic properties
are possessed by a material then if magnetic field is applied to the material, an electric
dipole will be induced, conversely, magnetism will change by running current through
material.
There are many ideas to use multiferroic material practically in device
applications. One more popular idea is that multiferroic bits can be used to store
information in the polarization P and the magnetization M. This type of memory does

25
not need the coupling between magnetism and ferroelectricity; cross coupling may be
even devastating. If there is magneto-electric coupling, device applications could be
apprehend where information is stored in the electric polarization but written
magnetically leading to non-volatile memory. Furthermore, by using multiferroic bits,
decay time for magnetic storage can be increased by increasing magnetic anisotropy.
Multiferroics can also be used to tune the electronic circuits by magnetic field in
magnetically field-tuned capacitors, in multiferroic sensors where zero-field current
measurements are used to determine magnetic field etc.
1.7 Motivation of Work
For use as functional material, crystal structure and electronic configuration of
a material play a fundamental role. For increasing ferroelectricity non-
centrosymmetry provides additional privilege to cations for introducing polarization
by displacement from their position. This adjustment of cations may also enhance
ferromagnetism by reorientation of magnetic spins. Although BiFeO3 (BFO) being the
multiferroic material above room temperature, has excellent potential to be used in
high temperature devices, its use in practical devices is limited by large leakage
current, defects and oxygen vacancies preventing to obtain proper electrical properties
[20,21]. Similarly magnetic properties are restricted by the spiral spin structure of Fe
ions. Several attempts have been made to enhance these properties by substituting the
rare-earth elements like La, Ho, Er etc for Bi and transition elements like Mn, Co, Cr
etc for Fe [22-25].
Similarly when mono- or divalent ions as like K+, Ca
2+ etc are replaced in
LaFeO3, they affect the magnetic properties by creating different valence states of

26
Fe3+
and Fe4+
in order to maintain charge neutrality. Moreover, partial substitution of
Fe by Cr results in the decrease of Neel temperature.
In the light of above discussion, replacement of rare earth and transition metal
elements at A and B cationic sites of both BFO and LFO is an effective way to
modify electric and magnetic properties amending the geometrical and electronic
structure of the materials. So in current research, an attempt has been made to
synthesize new multiferroic materials by substitution at A and B sites in order to
improve deficiencies discussed earlier.
1.8 Aims and Objectives
In this work, various single-phase multiferroic compounds including La, Ho
and Mn doped BiFeO3, K doped LaFeO3 and Cr doped LaFeO3 have been studied.
The initial aim is to study the doping effects on the multiferroic properties in these
compounds. Different synthesis methods like sol-gel and solid-state reaction method
were used to prepare phase pure compounds. It is expected that multiferroic properties
can be enhanced by doping transition metal and/or rare earth dopants. This study is
expected to promote the development of multiferroic materials in their fundamental
understanding as well as potential applications.
1.9 Structure of thesis
After the introductory chapter which includes fundamental concepts used for
study in this thesis, chapter 2 provides a brief review of the literature about dielectric,
magnetic and ferroelectric development among the family of BiFeO3 and LaFeO3.
Chapter 3 provides the information about the experimental instruments used
throughout the thesis. Brief description of the main analysis techniques used are also
provided here. Chapter 4, 5 and 6 are the centerpiece of the thesis. Chapter 4 presents

27
the experimental analysis with a series of dielectric measurements on Cr doped
LaFeO3. Phase transitions are recognized through dielectric measurements and
characterized. Chapter 5 complements this work with dielectric and magnetic
measurements of poly crystal K doped LaFeO3. Chapter 6 consists of dielectric and
magnetic measurements of La, Ho and Mn doped BiFeO3. Chapter 7 concludes the
thesis highlighting the major findings. The proposals for future outlook for the
research covered here are also included.

28
References
[1] M. Fiebig et al., Nature (London), 419, 818 (2002).
[2] N.A. Spaldin, M. Fiebig, Science, 15, 5733 (2005).
[3] S.W Cheong, M. Mostovoy, Nature materials, 6, 13 (2007).
[4] N. Ikeda, Nature, 436, 1136 (2005).
[5] C. Fennie, Physical Review B, 72, 100103 (2005).
[6] M. Mostovoy, Physical Review Letter, 96, 067601 (2006).
[7] A.J. Hatt, European Physical Journal, B 71, 435 (2009).
[8] J.F. Li, S. Dong, J. Cheng, D. Viehland, Applied Physics Letters, 83, 4812
(2003).
[9] B.J. Levin, G. Srinivasan, E.T. Rasmussen, R. Hayes, Physical Review B
65, 134402 (2002),
[10] W.J. Merz, Physical Review, 76, 1221 (1949).
[11] W.J. Merz, Physical Review, 91, 513 (1953).
[12] B.B. Van Aken, T.T. Palstra, A. Filippetti, N.A. Spaldin, Nature Materials, 3,
164 (2004).
[13] T. Portengen, T. Ostreich, L.J. Sham, Physical Review B, 54, 17452 (1996).
[14] N. Ikeda, H. Ohsumi, K. Ohwada, K. Ishii, T. Inami, K. Kakurai et al. Nature,
436, 1136 (2005).
[15] D. William, J. Callister, Materials Science and Engineering An Introduction,
7th ed. (John Wiley & Sons, Inc., New York, 2007 ).
[16] S. Blundell, Magnetism in Condensed Matter. Oxford University Press,
(2001)
[17] M. Fiebig, Journal of Physics D: Applied Physics, R123, 38 (2005).
[18] W. Eerenstein, N. D. Mathur, J. F. Scott, Nature, 442, 759 (2006).

29
[19] C. W. Nan, Journal of Applied Physics, 103, 031101 (2008).
[20] A.K. Pradhan, K. Zhang, D. Hunter et al. Journal of Applied Physics, 97, 093903
(2005).
[21] Y.P. Wang, L. Zhou, M.F. Zhang, X.Y. Chen, J.M. Liu, Z.G. Liu, Applied
Physics Letters, 84 1731 (2004).
[22] G.L. Song, G.J. Ma, J. Su, T.X. Wang, H.Y. Yang, F.G. Chang, Ceramics
International, 40 3579 (2014).
[23] Q.R. Yao, J. Cai, H.Y. Zhou, G.H. Rao, Z.M. Wang, J.Q. Deng, Journal of
Alloys and Compounds, 633 170 (2015).
[24] R. Das, K. Mandal, Journal of Magnetism and Magnetic Materials, 324 1913
(2012).
[25] J. Ray, A.K. Biswal, S. Acharya, V. Ganesan, D.K. Pradhan, P.N. Vishwakarma,
Journal of Magnetism and Magnetic Materials, 324 4084 (2012).
30
Chapter No. 2
Literature Review
31
2 Literature Review
As quest for room temperature multiferroic functional materials has been topic
of hot research since last decades, resultantly there is enormous number of
investigations in this area. So in this chapter a brief review of research work is
provided on BiFeO3 and LaFeO3 based materials. Section 2.1 provides sketch of
crystal structure of LaFeO3 while section 2.2 outlines its physical properties
specifically with reference to A and B site replacement of cations. Similarly section
2.3 provides overview of structure of BiFeO3 and its physical properties are outlined
in section 2.4.
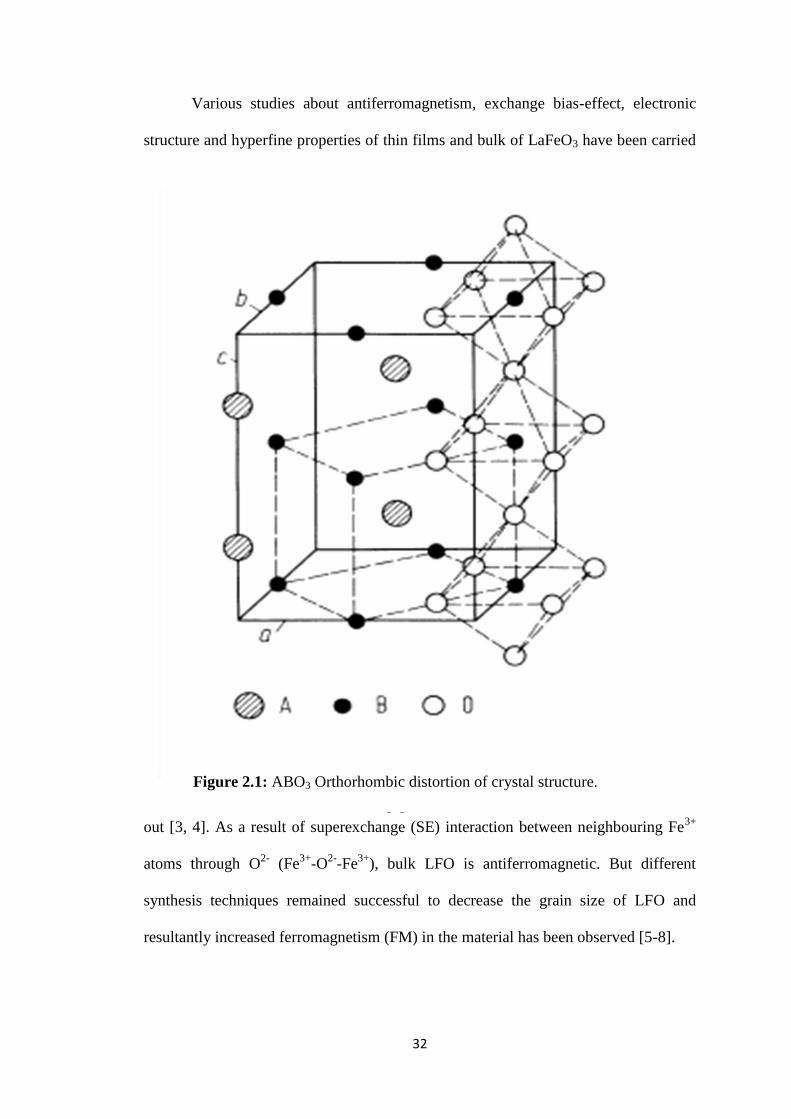
2.1 Structure of LaFeO3
LaFeO3 has perovskite structure with orthorhombic symmetry having space
group of (D2h-Pbnm). In this structure, central B site is occupied by Fe ions which
results in octahedral shape as shown earlier in figure 1.3. The cation A i.e La in this
case is coordinated by 12 oxygen anions and is placed in the interstitial area between
the octahedral structures [1].
A lanthanide orthoferrite has a pseudo cubic structure, where a≈b≈√2apc, and c
≈ 2apc. Here apc represents cell parameter of pseudo cubic structure. This kind of
distortion is usually observed in perovskites and remains stable when the Goldschmidt
tolerance factor, t = (rA + rO)/√2(rB + rO) is lesser than 0.975. Here Goldschmidt
factor (t) for the Lanthanum orthoferrite is 0.954.
2.2 Multiferroicity in LaFeO3
32
Various studies about antiferromagnetism, exchange bias-effect, electronic
structure and hyperfine properties of thin films and bulk of LaFeO3 have been carried
out [3, 4]. As a result of superexchange (SE) interaction between neighbouring Fe3+
atoms through O2-
(Fe3+
-O2-
-Fe3+
), bulk LFO is antiferromagnetic. But different
synthesis techniques remained successful to decrease the grain size of LFO and
resultantly increased ferromagnetism (FM) in the material has been observed [5-8].
Figure 2.1: ABO3 Orthorhombic distortion of crystal structure.
[2]
33
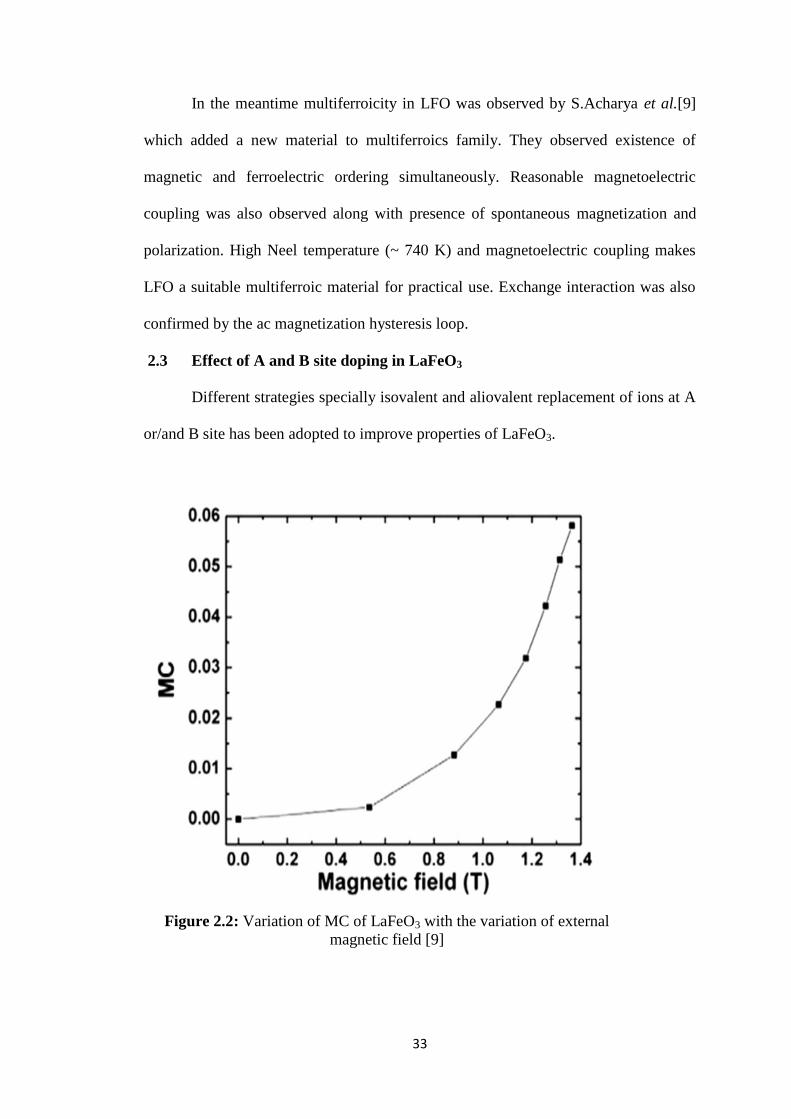
In the meantime multiferroicity in LFO was observed by S.Acharya et al.[9]
which added a new material to multiferroics family. They observed existence of
magnetic and ferroelectric ordering simultaneously. Reasonable magnetoelectric
coupling was also observed along with presence of spontaneous magnetization and
polarization. High Neel temperature (~ 740 K) and magnetoelectric coupling makes
LFO a suitable multiferroic material for practical use. Exchange interaction was also
confirmed by the ac magnetization hysteresis loop.
2.3 Effect of A and B site doping in LaFeO3
Different strategies specially isovalent and aliovalent replacement of ions at A
or/and B site has been adopted to improve properties of LaFeO3.
Figure 2.2: Variation of MC of LaFeO3 with the variation of external
magnetic field [9]

34
V.D. Nithya et al. [10] prepared LaCr0.5Fe0.5O3 sample using sol-gel synthesis
method. They studied structural, electric and magnetic properties of the material. X-
ray studies showed the orthorhombic structure of the sample. Size of the particle was
confirmed as 100 nm through transmission electron microscope (TEM) image. The
unsaturated magnetic hysteresis results observed by using SQUID magnetometer
showed ferromagnetic nature possessed by the material. Magnetization was increased
with a decrease of Neel temperature in Fe doped sample as compared to LaCrO3.
S. Phokha et al. [7] studied the optical, structural and magnetic properties of
LFO nanoparticles. They used polymerized complex method to synthesize the single
phase nanoparticles with a particle size equal to approx. 44.5 nm as derived from the
XRD and TEM results. Results showed that nanoparticles crystallized in
orthorhombic structure. XPS result showed that Fe ions were in both Fe3+
and Fe4+
Figure 2.3: M-H curves for LFO at 10 kOe at room temperature for materials
calcined at different temperatures [7].

35
valence states. Weak ferromagnetic response was observed for the nanoparticles,
which is shown in Figure 2.3. Uncompensated spins structure at the surface was the
assumed as the reason behind this phenomenon.
K. D. Chandrasekhar et al. [11] prepared polycrystalline La1-xPbxFeO3
(x=0.15, 0.25) samples by solid state reaction method. They used impedance
spectroscopy to conclude that multiple relaxations found in temperature range from
80 – 400 K are due to oxygen vacancies and polaronic relaxations in different
temperature ranges. Diffusion of ionized oxygen vacancies resulted in dielectric
relaxation at grain boundaries between 310 < T < 400 K. Ferromagnetic interactions
were enhanced upon substitution of Pb2+
ions. These results prove the significant
contribution of defects on magnetic and electrical properties of doped LaFeO3.
Y. Qiu et al. [6] prepared LFO material with different particle size. They
investigated the effect of grain size on magnetic and dielectric properties. It was
Figure 2.4: Magnetization vs Field (M-H) loop for LFO [6].
36
observed that grain size strongly affects the both magnetic as well as dielectric
properties. Figure 2.4 shows the grain size effects on magnetic properties of the
material.
Exchange biased (EB) and remnant magnetization was found to increase with
decrease in grain size. Core/shell model where AFM core interacts with FM shell
structure was used to explain the weak ferromagnetic behaviour of the material.
Maxwell-Wagner polarization was assumed to be responsible for high dielectric
constant values. So it was concluded that grain size has a strong influence on
magnetic and dielectric properties of the LFO.
A. P. B. Selvadurai et al. [12] measured different physical properties including
magnetic analysis to study influence of Cr substitution in LaFe1-xCrxO3 samples
prepared by sol-gel citrate method. XRD pattern and Raman signal at ~676 cm-1
confirmed the replacement of Fe with Cr. Substitution of Cr further reduced the grain
size due to difference in the ionic radii of Cr3+
(0.64 Å) and Fe3+
(0.67 Å). Surface
disorder and spin canting was considered as the reason for weak ferromagnetism
which further resulted in splitting of field cooled (FC) and zero field cooled (ZFC)
magnetic curves along with strong competition between FM and AFM interactions at
the interfaces. Cr replacement dominated Cr – O – Cr interactions and transitions for
LaFe0.7Cr0.3O3 and LaFe0.5Cr0.5O3 are observed about 117 K in FC-ZFC curves. They
concluded from DC activation energy that Cr substitution results in increase in
conductivity due to the polaronic hole carriers.
E. Cao et al. [13] synthesized La1-xNaxFeO3 (x=0, 0.1 and 0.2) ceramics by
citrate gel method. They observed orthorhombic perovskite structure from structural
analysis and further studied effect of Na substitution in LaFeO3 on its structural,
dielectric and magnetic properties. For x=0.2 powder enhanced magnetization of 2.11
37
emu/g at 10 kOe field was observed at room temperature which shows ferromagnetic
behaviour in the material in comparison to antiferromagnetic response in pure
LaFeO3. High dielectric response in dielectric constant (ε′) of the order of 105 at 100
Hz at room temperature was observed in conjunction with increase in loss factor.
Moreover this increase was assumed as extrinsic effect due to high capacitance at
grain boundaries. On substitution of Na, material showed colossal dielectric response
which was assumed due to larger grain size as confirmed by analysis of FE-SEM
(field emission scanning electron microscope) images. Na doping in LaFeO3 ceramics
results in non-stoichiometry in La1-xFeO3 and x/2 Na2O. This non-stoichiometric
Fe/La ratio resulted in distortion of lattice structure and canting angle which leads to
enhancement of magnetization. So it was concluded that by substituting La with Na,
dielectric and magnetic properties of LFO ceramics can be very effectively tuned.
A. Rai and A. K. Thakur [14] used codoping method to improve the physical
properties of LaFeO3. They synthesized single phase La1-xNaxFe1-yMnyO3 material by
modified Pechini route. Fe/Mn-O-Fe/Mn bond angles were changed which induced
strain but without disturbing the structure stability. Doping of Na resulted in creation
ions of Mn3+
and Mn4+
at Fe site in order to maintain the charge neutrality where
decrease in lattice volume was observed subsequently due to smaller radii of Mn ions.
Weak ferromagnetism was observed which was related to indirect exchange
interaction between Mn and Fe using oxygen as intervening ion as well as changes in
bond angles. So co-doping resulted in increased magnetic response. High dielectric
constant with value greater than 2000 in La0.85Na0.15Fe0.85Mn0.15O3 made the material
suitable for many practical applications in devices like magnetic storage, resonators,
multilayer capacitors etc. They observed maximum increase in dielectric properties
with 15 % co-substitution.

38
P.V. Coutinho et al. [15] prepared LaFeO3 and YFeO3 materials with distorted
orthorhombic structure by wet chemical combustion route. They studied the distortion
effect on structural and magnetic properties of these perovskite materials due to
exchange of elements with different ionic radii at A site of the material. Yttrium
(r=1.10 Å) has smaller ionic radii as compared to Lanthanum (r=1.36 Å). So replace
of La with Y exhibits prominent changes in properties. Lattice parameters were
decreased octahedral distortion in structure was increased by Y substitution. Spin-
phonon coupling was observed in the material. Structural distortion due to Y also
increased the canting of spin lattice resultantly an increase in ferromagnetic response
of the material was observed as shown in Figure 2.5. As these distortions are closely
linked with the DM interaction so can be used to improve the magnetoelectric
coupling and magnetic properties of the multiferroic materials.
T. L. Rao et al. [16] studied the physical properties of LFO nanoparticles.
Figure 2.5: M-H curves for the material at 5 K [15].

39
They used wet chemical route to synthesize the nano-sized samples with average
particle size of 45 nm. Distorted orthorhombic structure with Pbnm space group was
confirmed from XRD analysis. Bifurcation between FC and ZFC curves was obtained
at low temperature and low field this feature along with small hysteresis loop indicate
the weak ferromagnetic nature of the material well below Neel temperature. Further
inverse susceptibility vs temperature graph shows clear deviation from traditional
antiferromagnetic graph again indicating the canted antiferromagnetic or weak
ferromagnetic nature of the material as shown in inset of Figure 2.6.
2.4 Bismuth Ferrite BiFeO3 (BFO)
For the first time BFO sample was prepared in 1950‟s [17] and is famous for
possessing the multiferroic properties at room temperature including high ferroelectric
Curie temperature, TC (1100 K) and a high antiferromagnetic Neel temperature, TN
(673 K) [18]. This is the only single phase compound with perovskite structure having
Figure 2.6: (a) M vs T graph for LFO at 500 Oe. Inset shows inverse
susceptibility vs T graph (b) M vs H loops at 5 K and 300 K [16].
40
such properties and has the potential for its use in spintronics and next generation
memories [19, 20]. This co-existence of magnetic and ferroelectric polarization [21-
23] has opened a new window in the field of research. To enhance these properties for
practical use in devices has been area of active research since last two decades. So
before presenting recent research results, a brief overview about the structure and
properties of BFO system is presented in following paragraphs.
2.4.1 Structure of BFO
BiFeO3 is very important multiferroic material with perovskite structure. It has
rhombohedrally distorted structure in which larger Bi cation occupies the
dodecahedral A-site in unit cell surrounded by twelve (12) O2-
anions where smaller
Fe cation is placed at B-site to make FeO6 octahedron with 6 anions coordination.
BFO has rhombohedrally distorted perovskite structure. Tolerance Factor (t) isan
important parameter to explain possible reason for this distortion. Goldschmidt
defined tolerance factor (t) in 1926 in order to predict distortion in perovskite
structure. The relation to find the value of t is given as;
t = (rA + rO) / √2 (rB + rO) (2.1)
Where rA, rB and rO are ionic radii of A cation, B cation and O anion
respectively. For ideal cubic structure t has value equal to one and BO6 octahedron
has tilt angle equal to zero. If value of t decreases from 1, it results in tilt in BO6
octahedron so perovskite structure faces distortion towards lower symmetry i.e. from
ideal cubic to rhombohedral or orthorhombic etc.
If ionic radii of Bi3+
, Fe3+
and O2-
are taken as 1.17, 0.61 and 1.21 Å [24]
respectively then value of tolerance factor becomes equal to 0.925. This value can be
a possible reason for octahedral tilting of FeO6 octahedrons to develop a
41
rhombohedral distortion [25]. Also in Bi3+
lone pair electrons in 6s2 orbital hybridize
with 2s and 2p orbital of O2-
and make localized lobe. This lobe also creates structural
distortion by repelling neighbouring ions [26]. Oxygen concentration linked with
insufficiency of bismuth ion due to its volatile nature might by other reasons for
structural distortion.
BFO is an inorganic compound with multiferroic properties at room
temperature. It has antiferromagnetic transition at Neel temperature of TN=643K and
ferroelectric transition at Curie temperature of TC =1103 K. It is antiferromagnetic in
bulk form. A site Bi ion is considered to be responsible for ferroelectric properties
while B site Fe ion play role in antiferromagnetic properties.
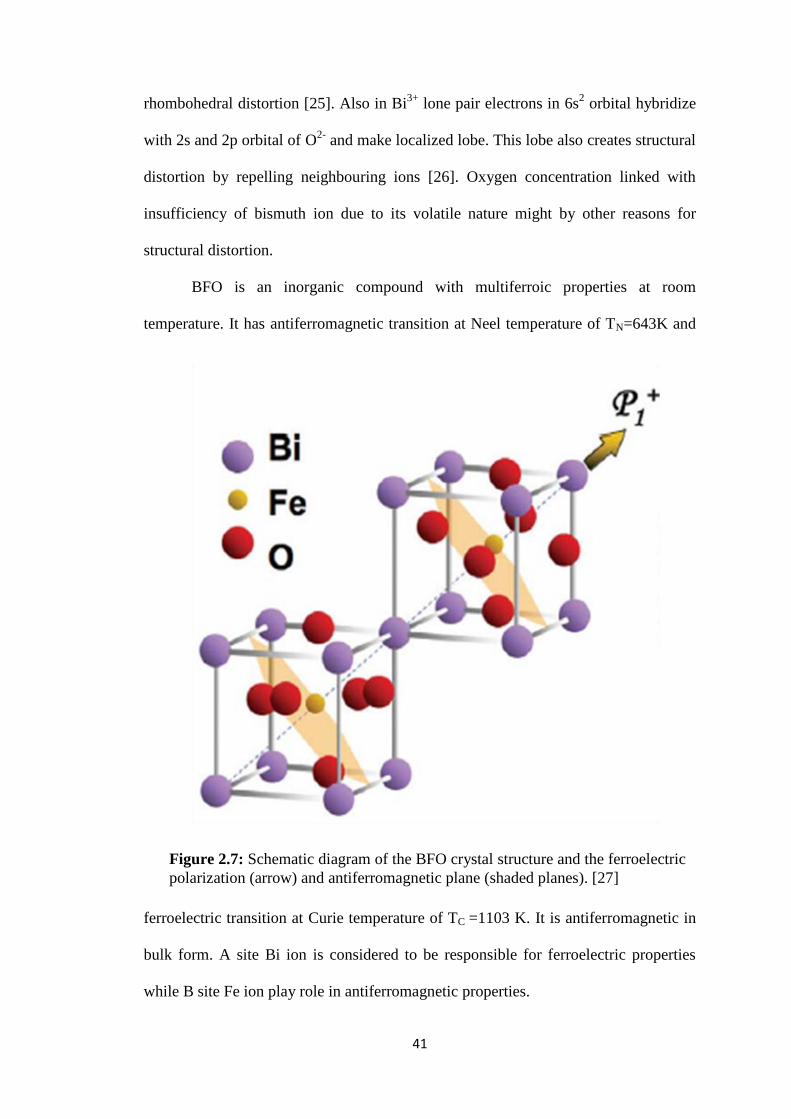
Figure 2.7: Schematic diagram of the BFO crystal structure and the ferroelectric
polarization (arrow) and antiferromagnetic plane (shaded planes). [27]
42
Bulk BFO possesses spontaneous electric polarization along [111] plane in
perovskite structure (Figure 2.7). Distortion in lattice structure produces ferroelastic
strain which is accompanied by ferroelectricity. These lattice distortions also reduce
symmetry from cubic to rhombohedral [27] as earlier discussed.
The antiferromagnetic ordering in BFO is G-type which means that nearest
neighbour Fe moments are directed antiparallel to each other in all three Cartesian
directions [28]. Also in bulk BFO, the directions of the antiferromagnetic vectors
make a long wavelength spiral.
2.4.2 Ion substitution and doping strategy at A or/and B sites
BFO is fit for applications in different devices due to its fascinating
multiferroic properties. However, there are some drawbacks with BiFeO3 for room
temperature applications, such as high leakage current, high dielectric loss and weak
antiferromagnetic character. In search for room temperature multiferroics, these are
now well established facts: (i) Empty d shell is required for good ferroelectric (FE)
properties while partially filled d shell is necessary for ferromagnetic (FM) properties.
For an ion to have a net magnetism, its electrons must have such arrangement that
their magnetic moments should not cancel each other. This fact rules out all
completely filled orbitals and partially filled d shell is favoured for magnetism. While
for ferroelectric state, transition-metal cations must have empty d orbitals. Stable
dative bonds are formed between oxygen ions and such d0 cations, where oxygen
electrons have small coulomb repulsion. This d0-ness is in direct contradiction with
partially filled d shells to favour magnetism. So FE and FM response is mutually
exclusive due to this property of B site element [29], (ii) substitution of B-site cations
with different ionic radii result in structural distortion to produce polar ground state

43
[30] and (iii) lone pair cations such as Bi3+
and Pb2+
play primary role to tune FE
properties [31].
BFO is already a lone pair multiferroic material, so ion substitution is a
common and remarkable effective method to modulate its basic properties. The
effects of different ion substitutions at both A and B sites are summarised below.
Nari Jeon et al. [32] prepared holmium (Ho) doped BFO samples by solid
state reaction method. They fabricated single phase Bi0.9Ho0.1FO3 bulk material with
rhombohedral R3c structure. Ho doping enhanced ferroelectricity and reduced the
leakage current. Magnetic properties were also improved as 2 Mr increased from 1.7 ×
10-4
to 5.6 × 10⁻⁴
emu/g.
Figure 2.8: Room temperature M-H loops for Bi1-xLaxFeO3 [33].

44
These results suggest Ho as suitable material to improve ferroelectric as well
as magnetic properties.
A. Chaudhuri and K. Mandal [33] used hydrothermal technique to prepare
lanthanum substituted BFO ceramics. La-doping decreased the diameter of cylindrical
particles and continually increased dielectric constant and magnetization. La doping
resulted in lattice distortion which produced spin canting and also thermal energy was
increased. As a consequence rapid increase in magnetization was observed about 400
oC. Electron spin resonance confirmed the destruction of spin cycloid structure which
may be another possible reason for enhancement of magnetization.
Sunil Chauhan et al. [34] used Sol-gel method to prepare Mn doped BFO
nano-sized ceramics and measured its physical properties. They observed structural
distortion in rhombohedral structure on 15 % Mn substitution. Manganese doping
destroyed the spin cycloid structure so increase in remnant magnetization (2Mr) from
0.08 emu/g for BFO to 0.51 emu/g for 15% Mn doped samples was observed.
Dielectric anomaly was observed in Mn doped samples near Neel temperature which
was attributed to magnetoelectric coupling. Improved multiferroic properties were
evidenced from improvement in magnetoelectric coupling by increasing Mn
concentration. Ferroelectric relaxor behaviour in 15 % Mn doped BFO sample was
observed from frequency dispersion near Neel temperature.
P. Uniyal and K.L. Yadav [35] prepared Bi0.95Ho0.05FeO3 compound by solid
sate reaction method. Magnetic, dielectric and ferroelectric properties were explored
at room temperature. Substitution of non-volatile Ho in place of volatile Bi modified
the dielectric properties of BFO. Along with increase in dielectric constant value two
anomalies were observed in high temperature dielectric results. High temperature
anomaly about 400 oC was attributed to AFM Neel temperature indicating

45
magnetoelectric coupling in the material. Ho substitution improved magnetic moment
where magnetization was enhanced to the value 0.736 emu/g. Saturated P-E loops
clearly indicated improvement in ferroelectric property of BFO by Ho substitution.
Magnetoelectric coupling and magnetodielectric response was observed in the
material at room temperature which indicates its importance.
P. Suresh and S. Srinath [36] synthesized LaxBi1-xFeO3 samples by sol-gel
method. La doping stabilized the formation of single phase BFO. For concentration of
La more than 20 %, structure transition from R3c to Pbnm was observed dually
confirmed from XRD results. Neel temperature and coercive field (Hc) was also
increased by La doping.
Bin Li et al. [37] prepared multiferroic Mn and La co-doped Bi1-xLaxFe1-
xMnxO3 (BLFMO) nano fibres by sol-gel method. Manganese doping increased
canting of AFM spins and also enhanced ferromagnetic ordering by mobile charge
carriers. As a result of exchange coupling between ferromagnetic and
antiferromagnetic surfaces, shift in magnetic hysteresis loop was observed. Leakage
current density was also improved by Mn ion substitution as its substitution was
helpful in reducing Fe2+
concentration.
Yongtao Li et al. [38] synthesized Bi1-xLaxFe0.95Mn0.05O3 samples via sol-gel
method. By increasing La substitution up to 15 %, magnetization increased while on
further doping it decreased as shown in Figure 2.9. They explained that change in
local structure of ions modifies Mn-O bond lengths which tune the magnetic
properties of the materials.

46
W. Mao et al. [39] synthesized Bi0.95Ln0.05Fe0.95Co0.05O3 (Ln = La and Pr)
single phase materials by sol-gel route. This co-doping removed the impurity phase
normally present in BFO compound. Gradual replacement of Bi with La and Pr
considerably increased the magnetic properties as compared to simple BFO and
BiFe0.95Co0.05O3 materials.
Higher value of saturation magnetization 0.535 emu/g was obtained for La
doped samples that may be the result of structural distortion caused by the La doping.
Leakage current was decreased with enhancement in ferroelectric properties by co-
doping of La and Co. Hence it was concluded that co-doping of La and Co is an
effective way to improve both magnetic and ferroelectric properties of BFO
compound.
Z. Jian et al. [40] prepared BFO multiferroic compound by replacing Bismuth
ferrite with Lanthanum at A site by solid state reaction technique. Influence of
replacement on structural, dielectric and magnetic response was studied. It was
Figure 2.9: Room temperature M-H loops for Bi1-xLaxFe0.95Mn0.05O3 (a)
x=0, (b) x=0.10, (c) x=0.15 and (d)=0.20. Inset shows loop for BFO [38]

47
derived from XRD studies that impurity phases have been removed by La doping
which results in preparation of single phase material. La doping gradually changed the
antiferromagnetic response of BFO towards ferromagnetic behaviour. Dielectric
constant exhibits two transition peaks at 500 K and 645 K. It was assumed that peak
at 645 K is antiferromagnetic transition peak which shifts to 690 K with La doping. A
clear bifurcation between FC and ZFC values of magnetization for temperature vs
field loops was observed at low temperatures. Anisotropy field was considered the
reason behind this bifurcation. Interestingly a new feature was observed due to
negative value of magnetization at low temperature for all doped samples. It is
considered at temperature induced magnetization reversal phenomenon. The
temperature at which magnetization values reaches to zero is known as compensation
temperature. This temperature was also found increasing with increase in La doping.
Figure 2.10: M-T magnetization loop for Bi1-xLaxFeO3 samples [40]

48
K. Chakrabarti et al. [41] prepared Cobalt (Co) doped nanoparticles by sol-gel
process. They investigated the dielectric and magnetic properties of the material. Due
to charge imbalance developed by substitution of Co2+
in place of Fe3+
, the structural
change from spherical to cubic was observed. Magnetization irreversibility was
observed in the material which is greatly influenced by the Co ions as shown in
Figure 2.11. The Co substitution disturbs the cycloidal spin structure in BFO and thus
enhances the ferromagnetic property. Change in structure i.e. shape anisotropy was
considered to be responsible for increase in saturation magnetization and coercivity.
High dielectric constant with low loss value was also observed.
Figure 2.11: FC and ZFC magnetization curves for BiFe1-xCoxO3 [41].
49
X. Zhang et al. [42] prepared Bi0.95La0.05Fe0.8M0.2O3 (M= Cr, Co, Al) materials
under high pressure environment. Rhombohedrally distorted perovskite structure was
identified by XRD analysis. Substitution at Fe site induced the structural distortion.
Substitution of Co at F site resulted in considerable structural change and reduced the
grain size significantly as compared to Cr and Al with minimum effect on
morphology of the material. They observed significant change in magnetic properties
of the doped materials and change in spin structure was considered the reason behind
the change. Al substituted compound showed typical AFM response due to change in
spin structure while spin-glass like behaviour was observed for Cr substituted
material. Cobalt substitution changed the cycloidal spin structure of the compound to
the collinear one.
X. Yuan et al. [43] used rapid solid state sintering method to prepare Sr and
Pb co-doped BiFeO3 compounds. Rhombohedral to cubic structural phase transition
with the increase in Sr/Pb contents was identified through XRD and Raman spectrum
analysis. Polarization vs electric field (P-E) hysteresis curves at room temperature
(RT) clearly confirmed the ferroelectric nature for all samples. Sr and Pb substitution
strongly suppressed the leakage current in BFO compounds.
Increase in value of dielectric constant clearly showed that dielectric
properties of the material were also improved by substitution. Double exchange
interaction between Fe2+
-O-Fe3+
and structural transition were assumed to be the
reason for improvement in ferromagnetic property. It was anticipated structural phase
transition also suppressed the cycloidal spin structure which is also another reason for
improvement in magnetic properties. Form these results co-doping of Sr and Pb at A
site was proved an effective way to improve multiferroic properties of BFO
compound.
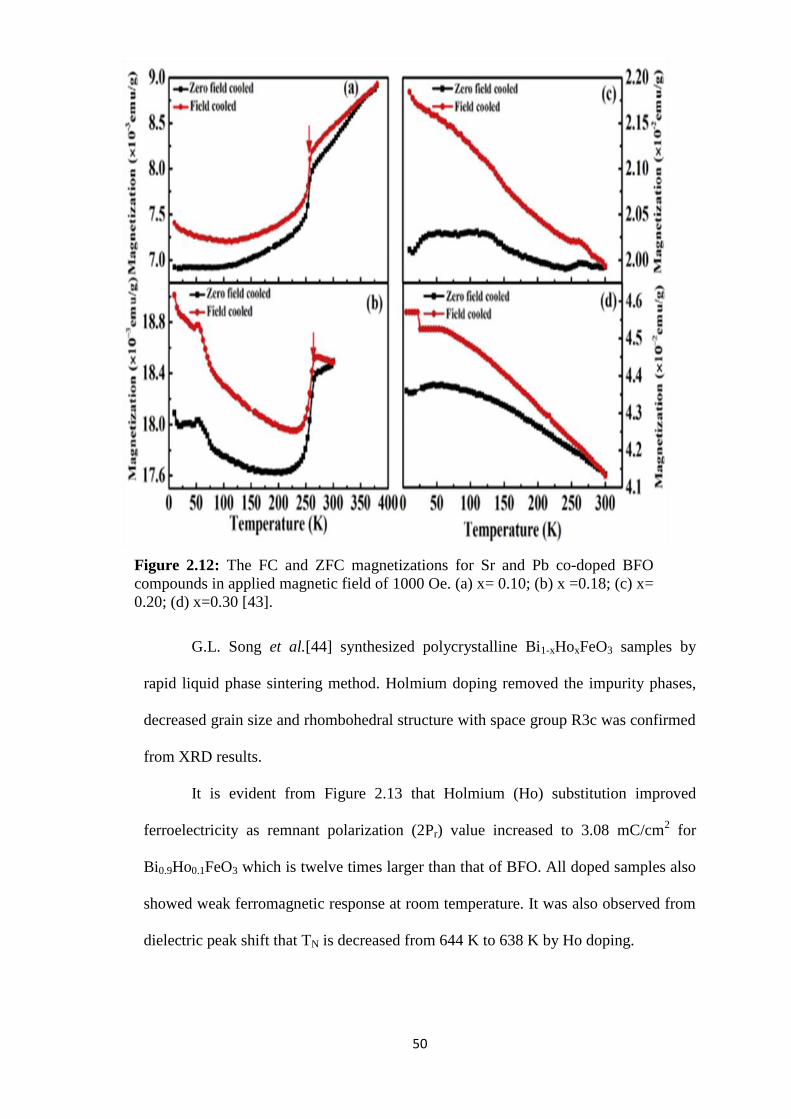
50
G.L. Song et al.[44] synthesized polycrystalline Bi1-xHoxFeO3 samples by
rapid liquid phase sintering method. Holmium doping removed the impurity phases,
decreased grain size and rhombohedral structure with space group R3c was confirmed
from XRD results.
It is evident from Figure 2.13 that Holmium (Ho) substitution improved
ferroelectricity as remnant polarization (2Pr) value increased to 3.08 mC/cm2 for
Bi0.9Ho0.1FeO3 which is twelve times larger than that of BFO. All doped samples also
showed weak ferromagnetic response at room temperature. It was also observed from
dielectric peak shift that TN is decreased from 644 K to 638 K by Ho doping.
Figure 2.12: The FC and ZFC magnetizations for Sr and Pb co-doped BFO
compounds in applied magnetic field of 1000 Oe. (a) x= 0.10; (b) x =0.18; (c) x=
0.20; (d) x=0.30 [43].

51
The change in TN mainly depends on the magnetic structure and Fe-O-Fe
super-exchange strength.
R. S. Ganesh et al. [45] synthesized BFO nanoparticles by sol-gel technique.
Spherical shaped particles with rhombohedral structure and space group R3c were
confirmed from microstructure analysis. It was deduced from analysis that shape and
size of BFO nanoparticles strongly depend upon the annealing temperature.
F. Pedro-García et al. [46] synthesized BFO multiferroics by using high
energy ball milling method. They used low temperature annealing with long intervals
from 0 to 13 hours and studied the effects of synthesis parameters on magnetic,
structural and electronic properties of the material.
Figure 2.13: P-E hysteresis loops for Bi1-xHoxFeO3 [44].
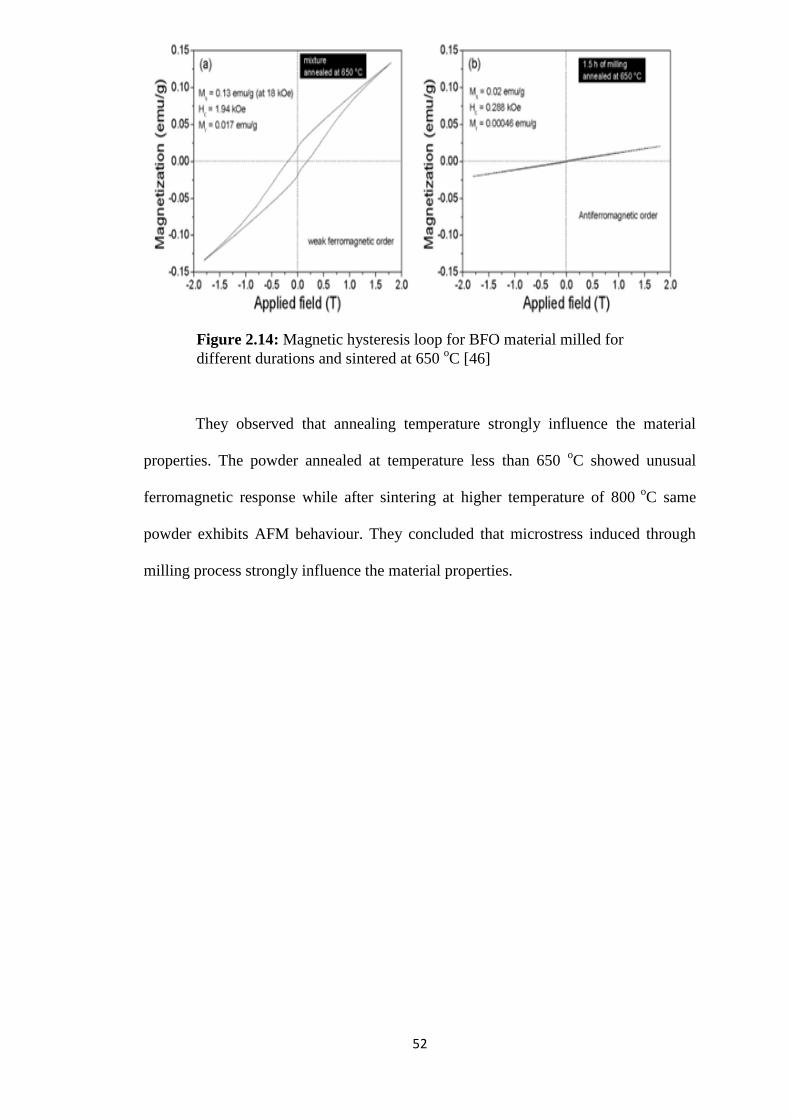
52
They observed that annealing temperature strongly influence the material
properties. The powder annealed at temperature less than 650 oC showed unusual
ferromagnetic response while after sintering at higher temperature of 800 o
C same
powder exhibits AFM behaviour. They concluded that microstress induced through
milling process strongly influence the material properties.
Figure 2.14: Magnetic hysteresis loop for BFO material milled for
different durations and sintered at 650 oC [46]

53
References
[1] M.A. Ahmed, M.S. Selim, Materials Chemistry and Physics, 129, 705 (2011).
[2] C. P Khattak, F. F. Wang, "Perovskites and Garnets" 3rd
edition p525
[3] J.W. Seo, E.E. Fullerton, F. Nolting, A. Scholl, J. Fompeyrine, J.P. Locquet,
Journal of Physics: Condensed Matter, 20, 264014 ( 2008).
[4] G.R. Hearne, M.P. Pasternak, Physical Review B, 51, 11495 (1995).
[5] N.T. Thuy, D.L. Minh, Advances in Materials Science and Engineering, 2012, 1
(2012).
[6] Y. Qiu, Y.S. Luo, Z.J. Zou, Z.M. Tian, S.L. Yuan, Y. Xi, L.Z. Huang, Journal of
Materials Science: Materials in Electronics, 25, 760 (2014).
[7] S. Phokha, S. Pinitsoontorn, S. Maensiri, S. Rujirawat, Journal of Sol-Gel
Science and Technology, 71, 333(2014).
[8] S. Phokha, S. Pinitsoontorn, S. Rujirawat, S. Maensiri, Physica B, 476, 55
(2015).
[9] S. Acharya, J. Mondal, S. Ghosh, S.K. Roy, P.K. Chakrabarti, Materials Letters,
64, 415 (2010).
[10] V. D. Nithya, R. J. Immanuel, S. T. Senthilkumar, C. Sanjeeviraja, I. Perelshtein,
D. Zitoun, R. K. Selvan, Materials Research Bulletin, 47, 1861 (2012).
[11] K. D. Chandrasekhar, S. Mallesh, J. K. Murthy, A.K. Das, A. Venimadhav,
Physica B, 448, 304 (2014).
[12] A. P. B. Selvadurai, V. Pazhanivelu, C. Jagadeeshwaran, R. Murugaraj, I. P.
Muthuselvam, F.C. Chou, Journal of Alloys and Compounds, 646, 924 (2015).
[13] E. Cao, Y. Qin, T. Cui, Li Sun, W. Hao, Y. Zhang, Ceramics International, 43,
7922 (2017).
[14] A. Rai, A. K. Thakur, Journal of Alloys and Compounds, 695, 3579 (2017).
54
[15] P.V. Coutinho, F. Cunha, P. Barrozo, Solid State Communications, 252, 59
(2017).
[16] T. L. Rao, M. K. Pradhan, S. Dash, AIP conference Proceedings, 1942, 050011
(2018).
[17] P. Royen, K. Swars, Angewandte Chemie, 69(24), 779 (1957).
[18] R. Seshadri et al., Chemistry of Materials, 13, 1892 (2001).
[19] G. Catalan, J.F. Scott, Advanced Materials, 21, 2463 (2009).
[20] J. Wang, J.B. Neaton, H. Zheng et al., Science, 299, 1719 (2003).
[21] J. Wang et al., Applied Physics Letters, 85, 2574 (2004).
[22] J. Li et al., Applied Physics Letters, 84, 5261 (2004).
[23] F. Zavaliche et al., Applied Physics Letters, 87 (2005) 182912
[24] R. D. Shannon, Acta Crystallography A32, 751 (1976).
[25] R. N. P. Choudhary, K. Perez, P. Bhattacharya, R. S. Katiyar, Materials
Chemistry and Physics, 105 (2), 286 (2007).
[26] P. Ravindran, R. Vidya, A. Kjekshus, H. Fjellvag, O. Eriksson, Physical Review
B, 74(22), 224412 (2006).
[27] T. Zhao, A. Scholl, F. Zavaliche, K. Lee, M. Barry, A. Doran, et al. Nature
Materials, 5, 823 (2006).
[28] P. Fischer, M. Polomska, I. Sosnowska, M. Szymanski, Journal of Physics C:
Solid State Physics, 13, 1931 (1980).
[29] N.A. Hill, Journal of Physical Chemistry B, 104 (2000) 6694;
[30] D.J. Singh, C.H. Park, Physical Review Letters, 100, 087601 (2008).
[31] W. Prellier, M.P. Singh, P. Murugavel, Journal of Physics: Condensed Matter,
17, R803 (2005).
[32] N.Jeon, D.Rout, I.W. Kim, S. L. Kang, Applied Physics Letters, 98, 072901 (2011)

55
[33] A. Chaudhuri, K. Mandal, Materials Research Bulletin, 47, 1057 (2012).
[34] S. Chauhan, M. Kumar, S. Chhoker, S.C. Katyal, H. Singh, M. Jewariya, K.L.
Yadav, Solid State Communications, 152, 525 (2012).
[35] P. Uniyal, K.L. Yadav, Journal of Alloys and Compounds, 511, 149 (2012).
[36] P. Suresh, S. Srinath, Journal Of Applied Physics, 113, 17D920 (2013).
[37] B. Li, C. Wang, W. Liu, M. Ye, N. Wang, Materials Letters, 90, 45 (2013).
[38] Y. Li, H. Zhang, H. Liu, X. Dong, Qi Li, W. Chen et al., Journal of Alloys and
Compounds, 592, 19 (2014).
[39] W. Mao, X. Wang, Y. Han, X. Li, Y. Li, Y. Wang et al., Journal of Alloys and
Compounds, 584, 520 (2014).
[40] Z. Jian, N. P. Kumar, M. Zhong, H. Yemin, P. V. Reddy, Journal of
Magnetism and Magnetic Materials, 386, 92 (2015).
[41] K. Chakrabarti, B. Sarkar, V. D. Ashok, S. S. Chaudhuri, S.K. De, Journal of
Magnetism and Magnetic Materials, 381, 271 (2015).
[42] X. Zhang, C. Zhang, R. Xie, B. Guo, H. Hu, G. Ma, Journal of Alloys and
Compounds, 701, 170 (2017).
[43] X. Yuan, L. Shi, J. Zhao, S. Zhou, Y. Li, C. Xie, J. Guo, Journal of Alloys and
Compounds, 708, 93 (2017).
[44] G.L. Song, Y.C. Song, J. Su, X.H. Song, N. Zhang, T.X. Wang, F.G. Chang,
Journal of Alloys and Compounds, 696, 503 (2017).
[45] R. S. Ganesh, S. K. Sharma, S. Sankar, B. Divyapriya, E. Durgadevi, P. Raji, S.
Ponnusamy, C. Muthamizhchelvan, Y. Hayakawa, D. Y. Kim, Current Applied
Physics, 17, 409 (2017).
[46] F. Pedro-García, F.Sanchez-De Jesús, C.A. Cortes-Escobedo, A.Barba-
Pingarron, A.M.Bolarín-Miro, Journal of Alloys and Compounds, 711, 77 (2017).

56
Chapter No. 3
Experimental Techniques
57
3 Experimental Techniques
This chapter describes in detail the synthesis process used for material
fabrication and characterization techniques used for study of different properties of
prepared samples. Dielectric, magnetic, X-Ray diffraction (XRD), ferroelectric,
scanning electron microscopy (SEM) and atomic force microscopy (AFM) techniques
were used for characterization of properties and structural analysis.
3.1 Material Fabrication
In current research different perovskite multiferroic materials with ABO3
formula were synthesized. Bi0.8La0.15Ho0.05Fe1-xMnxO3 (BLHFMO) series with co-
doping at A and B site was synthesized by solid state reaction method. Similarly A or
B site doped LaFeO3 (LFO) samples were fabricated by sol-gel method. Details of
synthesis procedure are explained below.
3.1.1 Synthesis of Bi0.8La0.15Ho0.05Fe1-xMnxO3 by Solid State Reaction
Solid state reaction is a chemical reaction method to synthesize polycrystalline
material in the absence of a solvent. Starting materials in this method are taken in
solid state. At normal time scales, solids don‟t react at room temperature so heat
treatment of the mixture at higher temperatures (1000 to 1500 °C) is required for
proper reaction between starting materials. There are many factors which affect the
rate and probability of solid state reaction which include surface area, structural
properties and reactivity of starting materials. Reaction conditions and
thermodynamic free energy related with the reaction also play very important role in
this mode of sample preparation. In this process, the reactants are first mixed in a
mortar and pressed into pellets at high pressure. After this, pellets are sintered in
furnace. Then, the products are crushed, ground, pressed into pellets and sintered
again several times.

58
To synthesize Bi0.8La0.15Ho0.05Fe1-xMnxO3 (x = 0, 0.05, 0.1, 0.2 and 0.3)
samples, rapid phase sintering solid state reaction method was used. Stoichiometric
amounts of oxides as Bi2O3, La2O3, Ho2O3, Fe2O3 and Mn2O3 were taken and mixed
thoroughly by using pestle and mortar for 30 min. The ground powder was pressed
into pellets and heat treated at temperatures of 870-880 ˚C for 1h.
3.1.2 Synthesis of LaFe1−xCrxO3 and La1-xKxFeO3
Combustion synthesis is one of the widely used methods to synthesize ABO3
materials. Glycine, urea and citric acid are used as fuel in this process. It is widely
adopted by the researchers due to its simplicity, use for vast range of materials and for
obtaining the product material with better control of its size and shape. It is simple
and cost effective method to obtain homogenous and nanoscale powder without
involvement of intermediate grinding and calcinations steps as compared to solid state
reaction and other methods. In this process such precursors are chosen which can
oxidize easily whereas fuel is used as reducing agent.
In this study sol-gel auto combustion method was used to prepare sample. The
sol-gel process may be illustrated as the formation of an oxide network by
polycondensation reactions of molecular precursors in a liquid. The theme involved in
sol-gel synthesis is to bring the compound back as a solid after dissolving it in a liquid
under controlled conditions. Sols of compounds with controlled stoichiometry can be
mixed to prepare multi component compounds where a sol is a stable dispersion of
colloidal particles in a solvent. The particles may be crystalline or amorphous.
Polycrystalline LaFe1−xCrxO3 (x = 0.0, 0.1, 0.2, 0.3, 0.4, 0.5) were prepared
by sol-gel auto combustion method. Analytical grade metal nitrates La(NO3)3.6H2O,
Fe(NO3)3.9H2O, C6H8O7.H2O and Cr(NO3)3.9H2O ≥ (99 %purity) were dissolved in
deionized water in stoichiometric ratio. Citric acid in 1:3 ratio with respect to metal
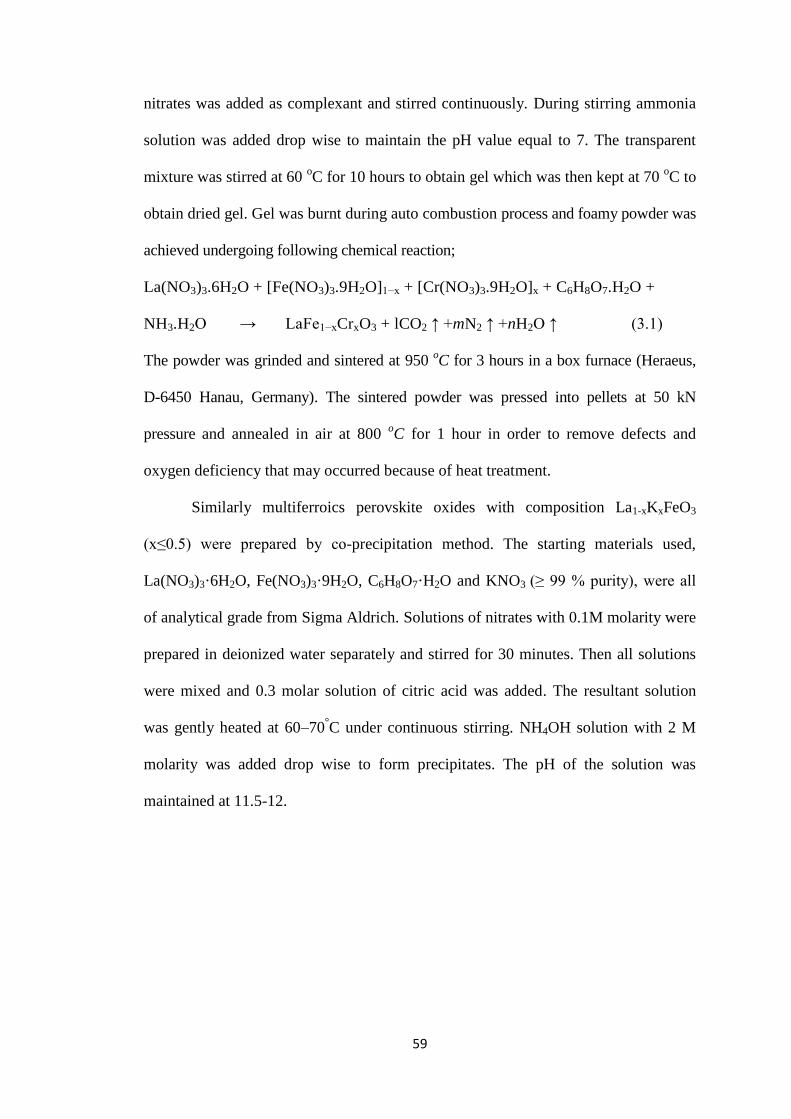
59
nitrates was added as complexant and stirred continuously. During stirring ammonia
solution was added drop wise to maintain the pH value equal to 7. The transparent
mixture was stirred at 60 oC for 10 hours to obtain gel which was then kept at 70
oC to
obtain dried gel. Gel was burnt during auto combustion process and foamy powder was
achieved undergoing following chemical reaction;
La(NO3)3.6H2O + [Fe(NO3)3.9H2O]1−x + [Cr(NO3)3.9H2O]x + C6H8O7.H2O +
NH3.H2O → LaFe1−xCrxO3 + lCO2 ↑ +mN2 ↑ +nH2O ↑ (3.1)
The powder was grinded and sintered at 950 oC for 3 hours in a box furnace (Heraeus,
D-6450 Hanau, Germany). The sintered powder was pressed into pellets at 50 kN
pressure and annealed in air at 800 oC for 1 hour in order to remove defects and
oxygen deficiency that may occurred because of heat treatment.
Similarly multiferroics perovskite oxides with composition La1-xKxFeO3
(x≤0.5) were prepared by co-precipitation method. The starting materials used,
La(NO3)3·6H2O, Fe(NO3)3·9H2O, C6H8O7·H2O and KNO3 (≥ 99 % purity), were all
of analytical grade from Sigma Aldrich. Solutions of nitrates with 0.1M molarity were
prepared in deionized water separately and stirred for 30 minutes. Then all solutions
were mixed and 0.3 molar solution of citric acid was added. The resultant solution
was gently heated at 60–70°C under continuous stirring. NH4OH solution with 2 M
molarity was added drop wise to form precipitates. The pH of the solution was
maintained at 11.5-12.
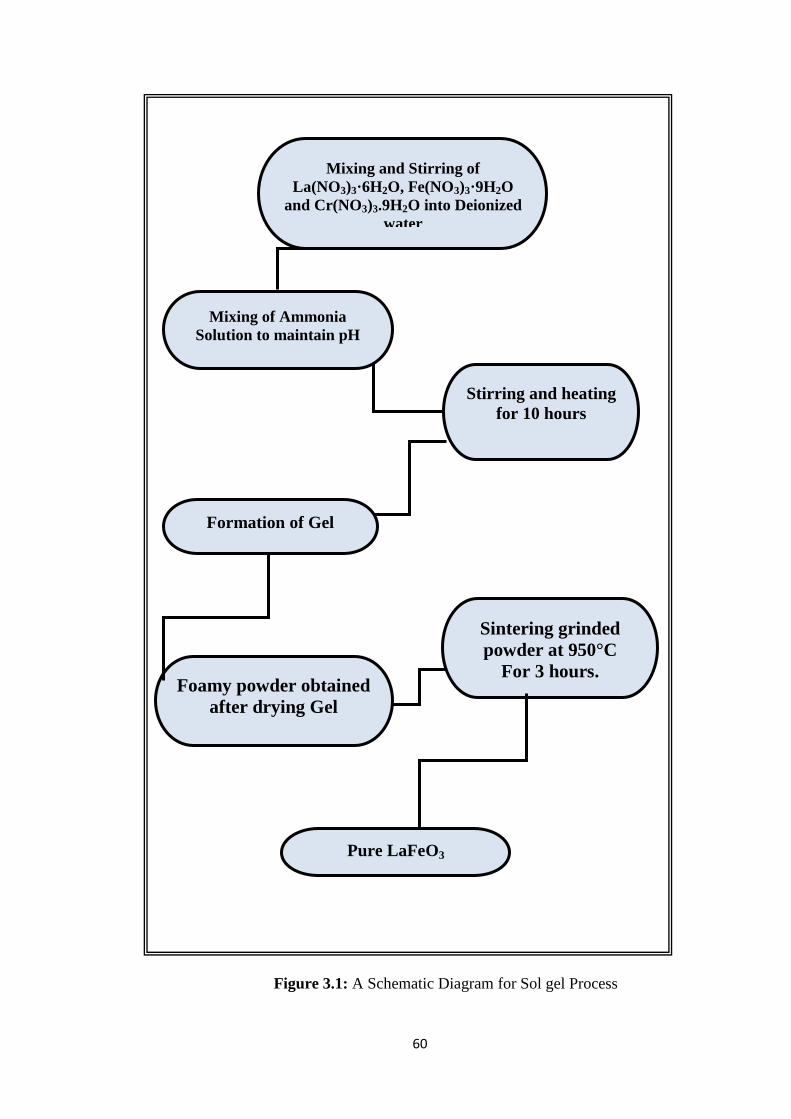
60
Figure 3.1: A Schematic Diagram for Sol gel Process
Sintering grinded
powder at 950°C
For 3 hours.
Pure LaFeO3
Foamy powder obtained
after drying Gel
Stirring and heating
for 10 hours
Formation of Gel
Mixing of Ammonia
Solution to maintain pH
Mixing and Stirring of
La(NO3)3·6H2O, Fe(NO3)3·9H2O
and Cr(NO3)3.9H2O into Deionized
water
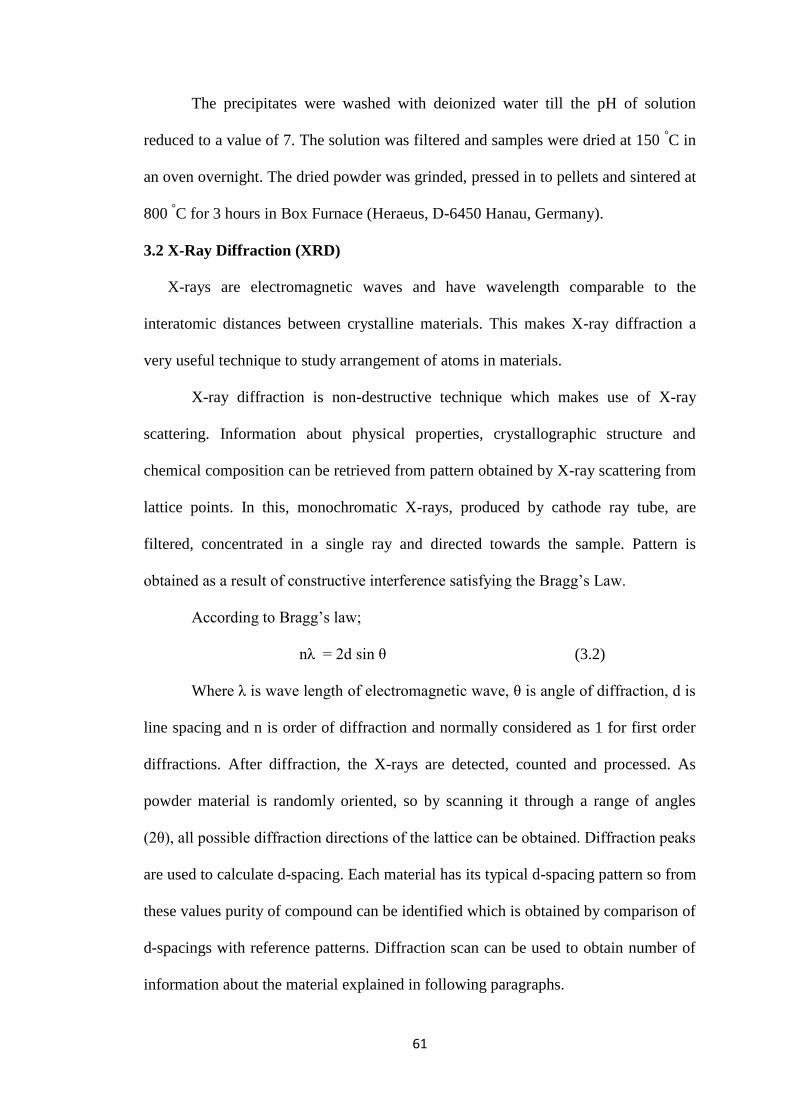
61
The precipitates were washed with deionized water till the pH of solution
reduced to a value of 7. The solution was filtered and samples were dried at 150 °C in
an oven overnight. The dried powder was grinded, pressed in to pellets and sintered at
800 °C for 3 hours in Box Furnace (Heraeus, D-6450 Hanau, Germany).
3.2 X-Ray Diffraction (XRD)
X-rays are electromagnetic waves and have wavelength comparable to the
interatomic distances between crystalline materials. This makes X-ray diffraction a
very useful technique to study arrangement of atoms in materials.
X-ray diffraction is non-destructive technique which makes use of X-ray
scattering. Information about physical properties, crystallographic structure and
chemical composition can be retrieved from pattern obtained by X-ray scattering from
lattice points. In this, monochromatic X-rays, produced by cathode ray tube, are
filtered, concentrated in a single ray and directed towards the sample. Pattern is
obtained as a result of constructive interference satisfying the Bragg‟s Law.
According to Bragg‟s law;
nλ = 2d sin θ (3.2)
Where λ is wave length of electromagnetic wave, θ is angle of diffraction, d is
line spacing and n is order of diffraction and normally considered as 1 for first order
diffractions. After diffraction, the X-rays are detected, counted and processed. As
powder material is randomly oriented, so by scanning it through a range of angles
(2θ), all possible diffraction directions of the lattice can be obtained. Diffraction peaks
are used to calculate d-spacing. Each material has its typical d-spacing pattern so from
these values purity of compound can be identified which is obtained by comparison of
d-spacings with reference patterns. Diffraction scan can be used to obtain number of
information about the material explained in following paragraphs.

62
Figure 3.2: A schematic ray diagram showing Bragg‟s diffraction of X-rays
interacting with two consecutive layers of atoms
.
From diffraction analysis, the values of cell angles α, β, γ and cell parameters
a, b and c can be obtained by using values of diffraction angle θhkl, linked with
diffraction peak and corresponding miller indices (hkl) for the respective planes. By
taking n = 1 for first order diffraction and rearranging, equation 3.2 changes to;
dhkl = λ / 2sinθhkl (3.3)
This implies that
1 / d2hkl = 4sin
2θhkl / λ
2 (3.4)
For rhombohedral structure
1/ d2hkl = ((h
2+k
2+l
2) sin
2α+2(hk+kl+hl)(cos
2α - cosα)) / (a
2(1-3cos
2α+2cos
3α)) (3.5)
For orthorhombic structure
1/ d2hkl = h
2/a
2 + k
2/b
2 + l
2/c
2 (3.6)
63
Similarly information for other crystallographic systems can be calculated by
using different equations.
Figure 3.3: Diagram showing effects of Strain in XRD data [1]
Moreover splitting of diffraction peaks in XRD pattern represents the
distortion in crystal structure of the material. Diminishing of peaks or evolution of
new peaks also suggest structural transformation to new phase. Also structural
transformation due to doping concentration or change in temperature can also be
analysed from diffraction pattern. By using characteristic peaks of different materials,
impurity phases present in the material can be distinguished and analysed. Shape of
do
d1
2θ
No Strain
Uniform Strain
Non-uniform Strain
Shift to lower angle
64
diffraction peaks provides valuable information such as crystallite size of the material
can be calculated by using Scherrer‟s equation;
D = Kλ / β cosθ (3.7)
Where D is average grain size, K is dimension less shape factor its characteristic
value is about 0.9, β is full width at half maximum (FWHM) value taken in radian
units and θ represents Bragg‟s angle for diffraction peak.
Diffraction peaks with very sharp line are observed for single crystals while
these peaks start broadening with decrease in grain size and no peaks are observed for
amorphous matter. Shift in diffraction peaks from their tangible position towards
lower or higher angle indicates increase or decrease in length of cell parameters
respectively. Strain can be a possible reason for this change in parameters. Strain in
structure also effects the position and shape of diffraction peaks which is illustrated in
Figure 3.3. It is evident from the figure that uniform strain results in shifting of the
peak position only while broadening of peak is observed in case of non-uniform
strain.
In this study XRD profiles were obtained by using Rigaku X-ray
diffractometer with CuKα radiations (wavelength (λ) = 0.15418 nm). Diffraction data
was obtained from 10o – 80
o in a step size of 0.02
o. For the phase identification of
samples, search and match option available in X‟Pert High Score program was used.

65
Figure 3.4: Rigaku X-Ray diffractometer setup
3.3 Scanning Electron Microscopy (SEM)
SEM is high resolution surface scanning technique which makes use of high
energy electron beams to make image of the surface of sample. Electron microscopes
were developed to see the small objects like nucleus of cell which were otherwise
impossible to be observed due to the limitations of the light microscopes.
It provides information about morphology, structure, grain size and defects in
the sample [2]. It comprised of an electron optical column, vacuum system and
system electronics. High energy beam of electron is produced by electron gun at the
top of the column, this beam is focused on the sample into a fine spot i.e. less than 4
nm in diameter. During scanning secondary electrons are produced on the sample
surface, these electrons are detected by proper detector. Amplitude of secondary

66
electron signal depends on the topography of the sample surface. So this signal
provides information about surface of the sample. In principle, size of beam diameter
on the surface of sample decides the resolution in SEM.
Figure 3.5: Schematic diagram showing working of SEM
However, different other parameters like sample preparation and properties of
sample also affect the resolution. Many other instrumental factors such as scanning

67
speed, sample distance from lens, angle of sample with reference to detector and
accelerating voltage also influence the resolution.
3.4 Atomic Force Microscopy (AFM)
AFM is a type of scanning probe microscopy. This is used to produce high
resolution image of the order of angstrom (Å) hence making it easy to measure and
observe topography of material at nanoscale. It consists of cantilever with a sharp tip
(both tip and cantilever are collectively called probe) at its end to scan the sample
surface.
Figure 3.6: Block diagram showing working principle for AFM
. The cantilever has two active sides. Its back side has reflecting surface to
reflect the laser beam focused on it. Cantilever has a sharp tip of few nanometer
Cantilever & tip
Laser
Photo diode
Sample Surface
Signal Detector Unit &
Feedback Electronics
68
radius at its front to scan the surface. Tip of the cantilever is supported by an electro
mechanical head controlled by piezoelectric components.
As compared to SEM, in AFM coating of surface is not necessary. During
scanning, close contact is maintained between probe and sample surface and probe
moves vertically according to the changes in surface structure. A laser beam is made
incident on cantilever to detect its movement over the surface. Cantilever moves away
or towards the surface according to surface topography making subsequent changes in
direction of reflected laser beam. A position sensitive photo diode (PSPD) is used to
sense these changes accordingly. Feedback electronics is used to control the
movement of cantilever tip over the surface which also changes the signal sensed by
photodiode into electric signal. This signal is then used to draw the image of surface
accordingly. Hence AFM can be used to draw the accurate topographic map of
required surface of material.
3.5 Dielectric measurement
A material is said to be dielectric if it is electrically polarized by applying an
electric field. This polarization takes place due to orientation of electric dipoles in
connection with applied electric field. As a response, an internal electric field is
generated within the dielectric in order to compensate the external field.
Response of applied electric field in a dielectric material can be well
demonstrated by taking example of parallel plate capacitor as shown in Figure 3.6.
When electric field is applied to two electrodes of area A, separated by distance d
(Figure 3.7 (a)), capacitance (C) is developed which is expressed by the following
relation,
C = 4π εo A / d (3.3)
Where εo is a constant and known as permittivity of free space.
69
If a dielectric material is placed between the electrodes (Figure 3.7 (b)), then
capacitance is increased due to decrease in electric field which is expressed by the
relation [3, 4].
C = 4π εo εr A / d (3.4)
Here εr is known as relative permittivity also known as dielectric constant.
From equation 3.4, to calculate dielectric constant following relation was
obtained.
ε = Cd / 4πεoA (3.5)
For an alternating electric field dielectric permittivity of the sample can be
represented in complex form i.e.
εr = ε′ - і ε
″ (3.6)
Here ε′
represents real part and ε″ represents imaginary part of relative
permittivity. As imaginary part of relative permittivity is associated to dielectric loss
and relation can be obtained for dielectric loss angle δ given as [5];
Tan δ = ε″
/ ε′ (3.7)
In dielectric materials the polarization lags behind the applied electric field
which results in dielectric loss or energy dissipation. Defects and impurities in crystal
lattice are also reason for dielectric loss.
Capacitance and loss tangent of the samples were measured using
a precision LCR meter Agilent 4984A. The dielectric response for all samples was
measured as a function of temperature (50 – 350 oC) and frequency (10-100 KHz).

70
3.6 Ferroelectric response measurement
Spontaneous polarization is characteristic feature in ferroelectric materials.
Polarization can be reversed by applying external electric field. So polarization versus
electric field (P-E) hysteresis loop is primary feature to check ferroelectricity in
ferroelectric materials. A P-E loop is a graph of polarization (P) developed in the
material when an electric field (E) is applied at some frequency.
Ferroelectric P-E response in this study was measured by using standard
ferroelectric tester (Aix-ACCT EASY CHECK 300) and Matsusada high voltage
amplifier at frequency of 1 Hz. For measurements, silver paste was used at both sides
of samples for making electrodes. After coating, samples were placed in oven at
temperature of 200 oC for 2 hours to dry silver paste. For measurements, electric field
of 5-70 kV/cm was applied keeping in view the coercive field of sample. Silicon oil
was used to immerse the pellets in order to avoid sample breakdown. Software
available at the equipment was used to analyse the measured data
Figure 3.7: Diagram showing parallel plate capacitor in which electrodes are
separated by (a) vacuum (b) dielectric material
A
+ + + + + + + + + +
+
- - - - - - - - - -
(a)
Dielectric
-
+
-
+
-
+ -
+
-
+ -
+
-
+
-
+ -
+
-
+
-
+
(b)
d

71
Figure 3.8: The experimental setup for the Ferroelectric Tester (Aix-ACCT TF-2000)
3.7 D.C resistivity measurement
The resistivity is a primary parameter in semiconductor technology. It can be
used for determination of carrier concentration in semiconductor
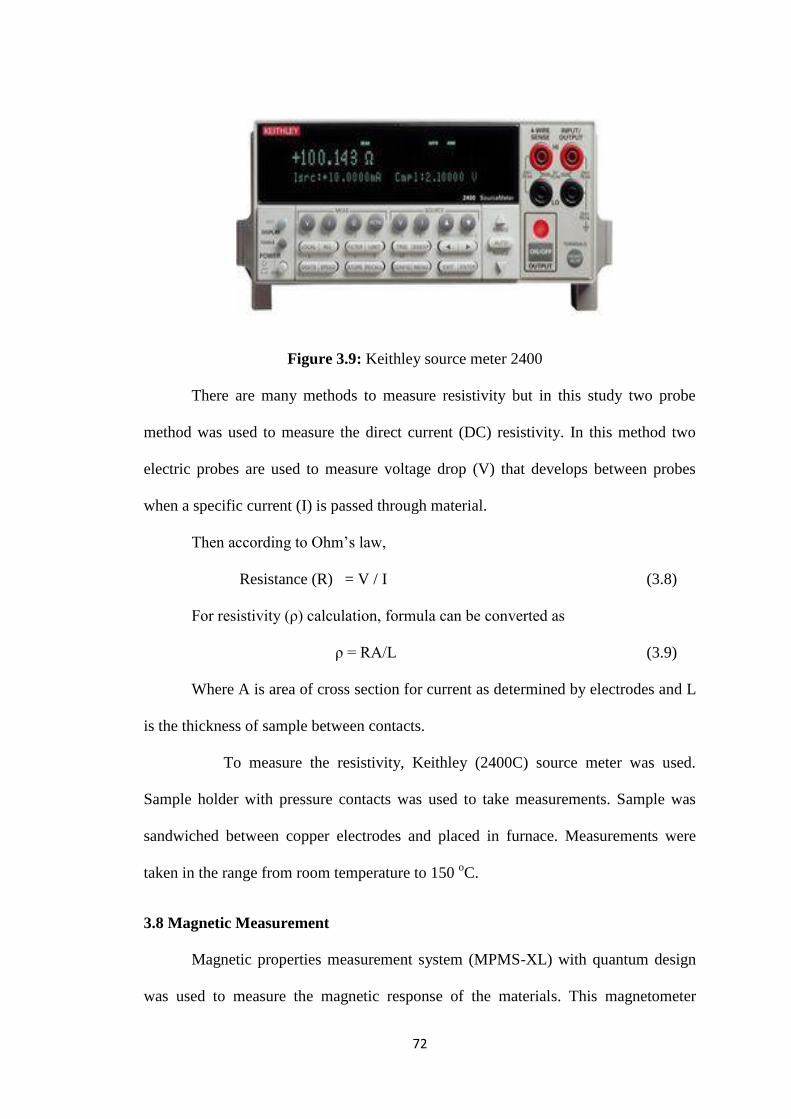
72
Figure 3.9: Keithley source meter 2400
There are many methods to measure resistivity but in this study two probe
method was used to measure the direct current (DC) resistivity. In this method two
electric probes are used to measure voltage drop (V) that develops between probes
when a specific current (I) is passed through material.
Then according to Ohm‟s law,
Resistance (R) = V / I (3.8)
For resistivity (ρ) calculation, formula can be converted as
ρ = RA/L (3.9)
Where A is area of cross section for current as determined by electrodes and L
is the thickness of sample between contacts.
To measure the resistivity, Keithley (2400C) source meter was used.
Sample holder with pressure contacts was used to take measurements. Sample was
sandwiched between copper electrodes and placed in furnace. Measurements were
taken in the range from room temperature to 150 oC.
3.8 Magnetic Measurement
Magnetic properties measurement system (MPMS-XL) with quantum design
was used to measure the magnetic response of the materials. This magnetometer

73
makes use of superconducting quantum interference device (SQUID) to measure
magnetic properties. Due to its sensitivity for magnetic fields, it is an ideal instrument
for measuring very small changes in the magnetic response of any material. It can
measure magnetic behaviour of the material at different temperatures, pressures and
magnetic fields.
Figure 3.10 Schematic diagram for two probe method
Plastic straw (diameter ~ 5 mm) having very small diamagnetic moment is
used to mount the sample with inside MPMS. To secure the sample, it is first placed
inside a plastic capsule, tightly packed with cotton, sealed with tape and then inserted
in straw.

74
Figure 3.11 The pickup coils for SQUID magnetometer
Figure 3.11 shows principle of operation of apparatus. As shown in the figure,
a non-magnetic plastic straw holding the sample is translated in vertical direction
between three superconducting coils. To cool the chamber and maintain the
temperature, liquid nitrogen and liquid helium are used. To measure the magnetic
response of the material, sample is slowly moved through the coils and magnetic field
is applied. A current is induced in coils according to sample magnetization. So small
change in magnetization is converted to small change in current and which is again

75
transformed into small changes in magnetic field and detected by the SQUID. The
SQUID is protected from the applied magnetic field so that it may measure the current
produced by the pickup coils only.
Figure 3.12: The MPMS setup for magnetic measurements
The MPMS-XL used for measurement in this study has high homogeneity magnetic
configurations with Helium flow environment and sample can be cooled to base
temperature of 2 K. Magnetic field is applied vertically by superconducting magnet
within range of 5 T. All parameters and measurements were computer controlled
through specifically designed software. The measurements were taken in both field
cooled (FC) and zero-field cooled (ZFC) environment. In ZFC conditions, sample is
76
cooled down to the minimum temperature in the absence of any magnetic field and
then measurements are taken by applying magnetic field and in FC conditions,
material is cooled down in the presence of small magnetic field and then
measurements are taken.

77
References:
1. B. D. Cullity, “Elements of X-ray Diffraction”, Addison-Wesley CA,
(1978).
2. E. Antolini, F. Cardellini, Journal of Alloys and Compounds, 315, 118
(2001).
3. A. R. West, “Basic solid state chemistry”, John Wiley & Sons, New York,
(1999).
4. E. Barsoukor, J. R. Macdonald, “Impedance spectroscopy theory,
Experimental and application”, Wiley-Interscience Hoboken, (2005).
5. Y. Xu, “Ferroelctric Materials and Their Applications”, North Holland,
Amsterdam, (1991).

78
Chapter No. 4
Effect of Cr on electric and magnetic properties of
LaFe1-xCrxO3

79
4 Effect of Cr on electric and magnetic properties of LaFe1-xCrxO3
In this chapter structural analysis, capacitance, dielectric loss, P-E hysteresis
loops, magnetic properties and resistivity for Cr3+
substituted LFO compounds at
various temperatures is discussed and analysed. Due to more promising use in fuel
cells and sensors technology, ferroelectric and dielectric properties of LaCrO3 and
LaFeO3 were explored less. But due to observation of large value of dielectric
constant ~ 105 in LaFeO3 in a vast temperature range from well below Tc to Curie
temperature by S. Acharya et al. [1] revived interest towards electric, magnetic and
multiferroic properties of the material. They also observed magneto-dielectric
response along with spontaneous polarization and magnetization which confirmed its
multiferroic nature.
In present study LaFe1-xCrxO3 [0≤ x≤ 0.8] polycrystalline materials were
prepared by sol-gel method whereas homogenous and small grain sized particles were
obtained as a product. The sol-gel being low temperature (≈950 oC) synthesis
technique as compared to solid state reaction one (≈ 1500 oC) is also helpful in
reducing leakage current and oxygen vacancies. Oxygen vacancies are otherwise
unavoidable due to volatile behaviour of CrO3.
4.1 Structural Analysis
Figure 4.1 shows the XRD pattern obtained at room temperature for
LaFe1−xCrxO3 (x = 0.0, 0.1, 0.2, 0.3, 0.4, 0.5 & 0.8). All peaks are indexed according to
JCPDS card no. 37-1493. The absence of un-indexed peak confirms the single phase of
the prepared samples. LaFe1−xCrxO3 crystallizes in orthorhombic structure with
space group Pbnm (62).

80
20 24 28 32 36 40 44 48 52 56 60
2, degree
x = 0.0
x = 0.1
x = 0.2
x = 0.3
x = 0.4
x = 0.5
24
0
31
1
14
1
23
020
2
22
0
21
0
12
1
11
1
In
ten
sity
Arb
itrary
Un
it
x = 0.8
10
1
Figure 4.1: Powder XRD patterns for LaFe1−xCrxO3 (0.0 ≤ x ≤ 0.8)
Peaks clearly shift towards higher 2θ degree with the increase in Cr doping;
for example, the (121) peak at 2θ = 32.14 for x = 0 shifts to 32.50 for x = 0.8, which
suggests decrease in cell size. It is in accordance to the previous reports [2] because
Cr3+
has smaller ionic radii (0.615 oA) as compared to Fe
3+ ion (0.645
oA) in high spin
state with a coordination number of 6 [3]. Values of Grain size calculated by Bragg‟s
formula by considering (121) characteristic peak from XRD pattern are given in Table
4.1. It is clear from values that grain size is gradually reduced from 159 nm for LaFeO3
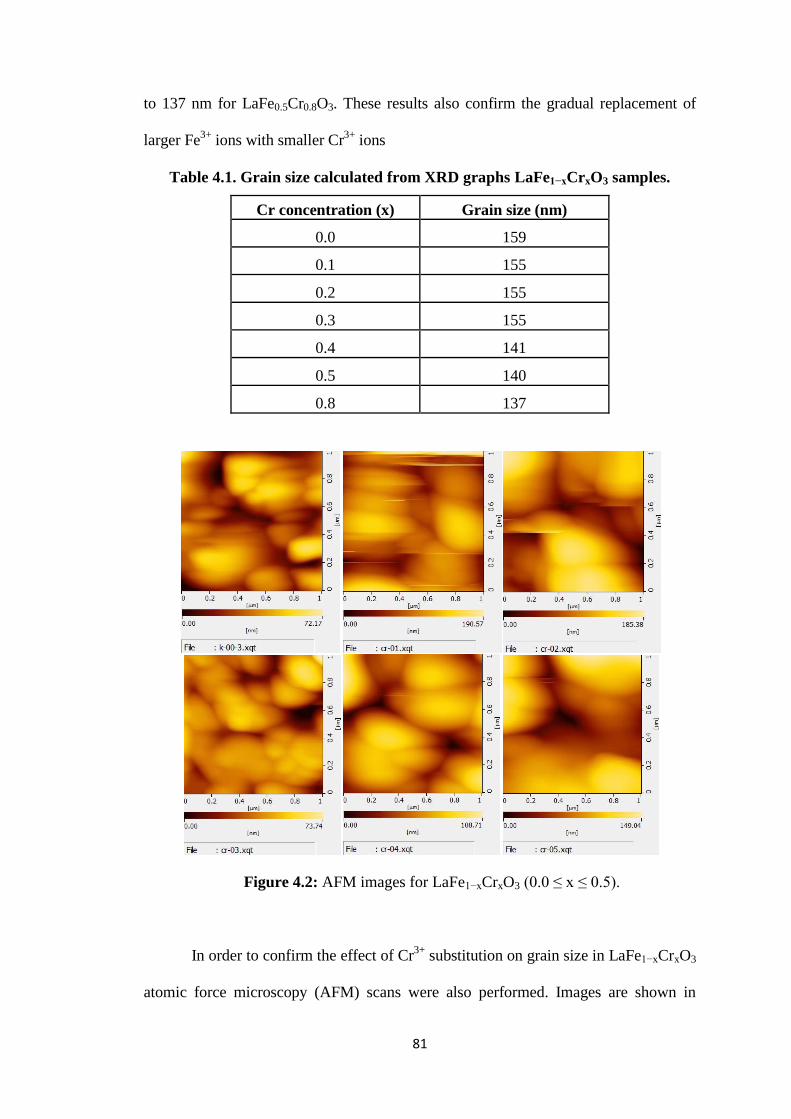
81
to 137 nm for LaFe0.5Cr0.8O3. These results also confirm the gradual replacement of
larger Fe3+
ions with smaller Cr3+
ions
Table 4.1. Grain size calculated from XRD graphs LaFe1−xCrxO3 samples.
Cr concentration (x) Grain size (nm)
0.0 159
0.1 155
0.2 155
0.3 155
0.4 141
0.5 140
0.8 137
Figure 4.2: AFM images for LaFe1−xCrxO3 (0.0 ≤ x ≤ 0.5).
In order to confirm the effect of Cr3+
substitution on grain size in LaFe1−xCrxO3
atomic force microscopy (AFM) scans were also performed. Images are shown in
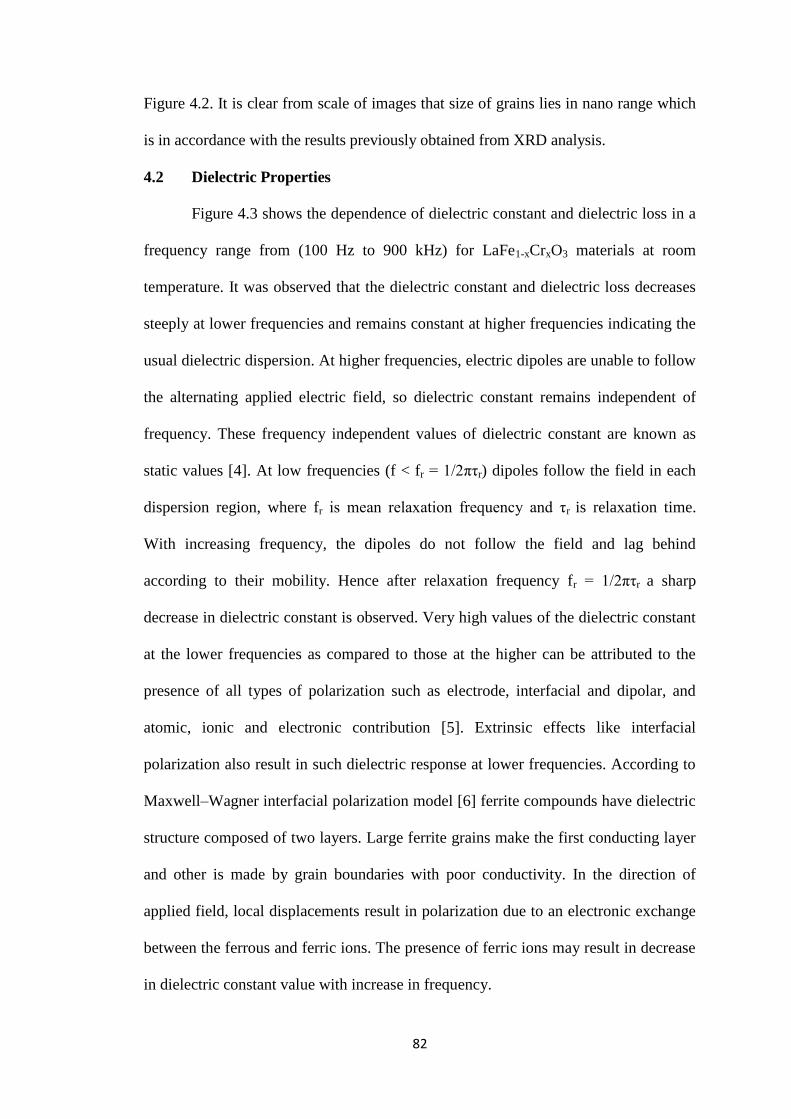
82
Figure 4.2. It is clear from scale of images that size of grains lies in nano range which
is in accordance with the results previously obtained from XRD analysis.
4.2 Dielectric Properties
Figure 4.3 shows the dependence of dielectric constant and dielectric loss in a
frequency range from (100 Hz to 900 kHz) for LaFe1-xCrxO3 materials at room
temperature. It was observed that the dielectric constant and dielectric loss decreases
steeply at lower frequencies and remains constant at higher frequencies indicating the
usual dielectric dispersion. At higher frequencies, electric dipoles are unable to follow
the alternating applied electric field, so dielectric constant remains independent of
frequency. These frequency independent values of dielectric constant are known as
static values [4]. At low frequencies (f < fr = 1/2πηr) dipoles follow the field in each
dispersion region, where fr is mean relaxation frequency and ηr is relaxation time.
With increasing frequency, the dipoles do not follow the field and lag behind
according to their mobility. Hence after relaxation frequency fr = 1/2πηr a sharp
decrease in dielectric constant is observed. Very high values of the dielectric constant
at the lower frequencies as compared to those at the higher can be attributed to the
presence of all types of polarization such as electrode, interfacial and dipolar, and
atomic, ionic and electronic contribution [5]. Extrinsic effects like interfacial
polarization also result in such dielectric response at lower frequencies. According to
Maxwell–Wagner interfacial polarization model [6] ferrite compounds have dielectric
structure composed of two layers. Large ferrite grains make the first conducting layer
and other is made by grain boundaries with poor conductivity. In the direction of
applied field, local displacements result in polarization due to an electronic exchange
between the ferrous and ferric ions. The presence of ferric ions may result in decrease
in dielectric constant value with increase in frequency.

83
Dielectric response as a function of temperature for different samples is shown
in Figure 4.4. On increasing Cr-content in LFO, two features clearly observed are;
one upward shift of dielectric constant (ϵr) which exhibits a peak centered at around
250 oC for x = 0 and second its shift to low temperature; i.e. around 60
oC for x =
0.4. The observed trend is found similar to the ones reported also for Mn3+
doped
transition metal oxide systems [7, 8].
2 3 4 5 6
0.0
5.0x10⁴
1.0x10⁵
1.5x10⁵
2.0x10⁵
2.5x10⁵
3.0x10⁵
3.5x10⁵
Die
lectr
ic c
onsta
nt
log f (Hz)
x=0.0
x=0.1
x=0.2
x=0.3
x=0.4
x=0.5
x=0.8
0 200 400 600 800 1000
0
200
400
600
800
1000
tan
Frequency kHz
Figure 4.3: Dielectric constant as function of frequency at room temperature for
LaFe1-xCrxO3. Inset shows the dielectric loss as a function of frequency
Monotonic increase in dielectric constant at 10 kHz is observed on increasing
temperature up to 230 oC, i.e. a temperature close to the Curie temperature (202
oC) for
LFO. On substitution of Cr3+
, considerable decrease in Neel temperature from 467
oC
(740 K) in LFO to 7 oC (280 K) in LaCrO3 has been reported [9]. So transition in
Cr3+
substituted samples can be ascribed due to antiferromagnetic to paramagnetic
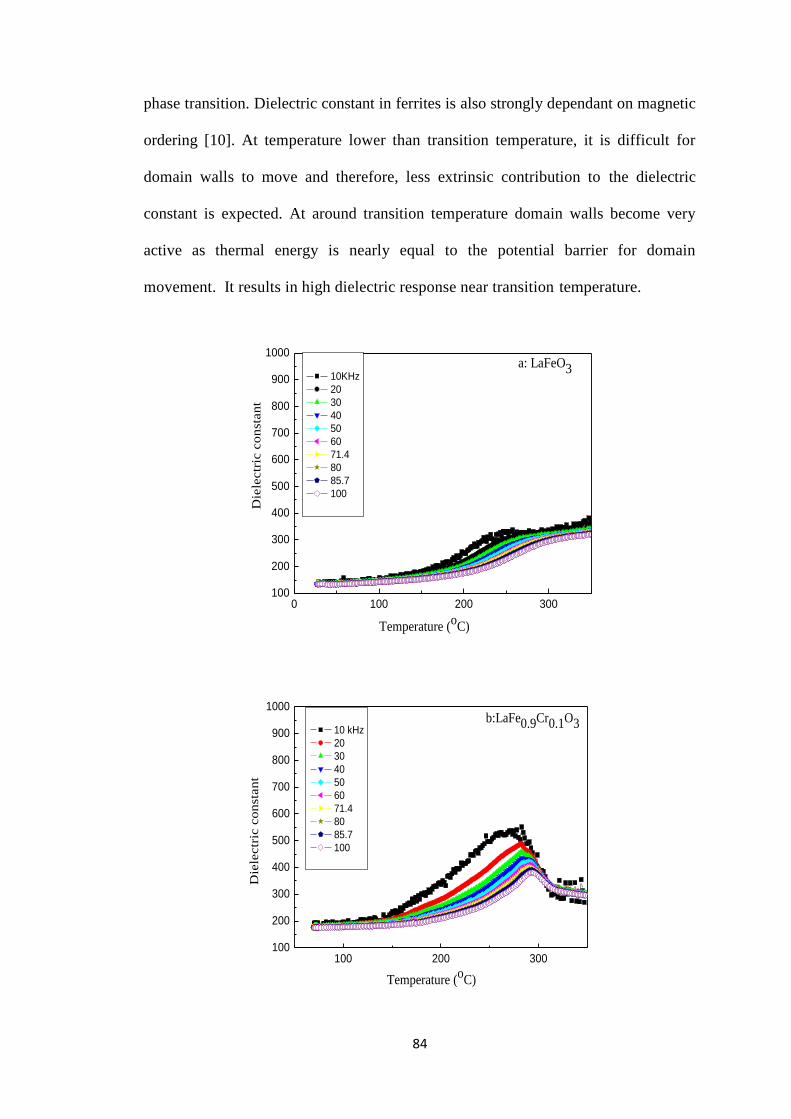
84
phase transition. Dielectric constant in ferrites is also strongly dependant on magnetic
ordering [10]. At temperature lower than transition temperature, it is difficult for
domain walls to move and therefore, less extrinsic contribution to the dielectric
constant is expected. At around transition temperature domain walls become very
active as thermal energy is nearly equal to the potential barrier for domain
movement. It results in high dielectric response near transition temperature.
0 100 200 300100
200
300
400
500
600
700
800
900
1000
Die
lectr
ic c
on
stan
t
a: LaFeO3
Temperature (o
C)
10KHz
20
30
40
50
60
71.4
80
85.7
100
100 200 300100
200
300
400
500
600
700
800
900
1000
10 kHz
20
30
40
50
60
71.4
80
85.7
100
Temperature (oC)
b:LaFe0.9Cr0.1O3
Die
lectr
ic c
on
stan
t
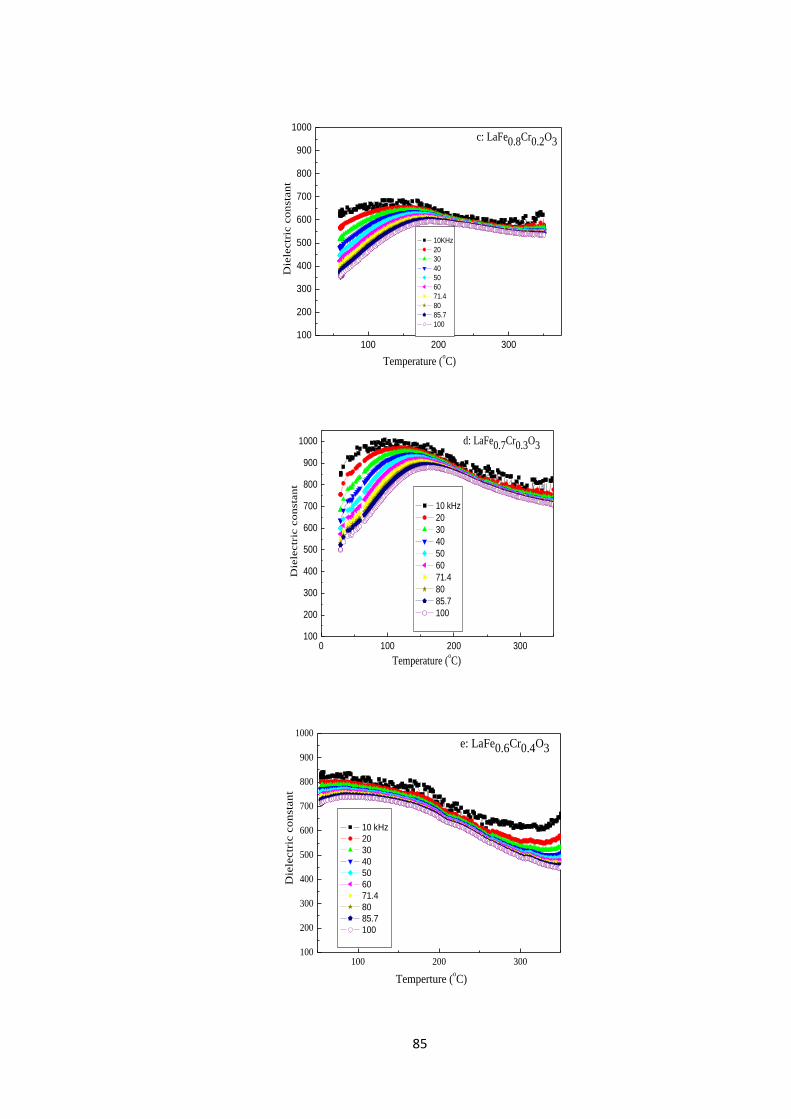
85
100 200 300100
200
300
400
500
600
700
800
900
1000c: LaFe0.8Cr0.2O3
D
iele
ctr
ic c
on
sta
nt
Temperature (oC)
10KHz
20
30
40
50
60
71.4
80
85.7
100
0 100 200 300100
200
300
400
500
600
700
800
900
1000
Die
lectr
ic c
on
sta
nt
d: LaFe0.7Cr0.3O3
Temperature (oC)
10 kHz
20
30
40
50
60
71.4
80
85.7
100
100 200 300100
200
300
400
500
600
700
800
900
1000
Die
lectr
ic c
on
stan
t
Temperture (oC)
e: LaFe0.6Cr0.4O3
10 kHz
20
30
40
50
60
71.4
80
85.7
100
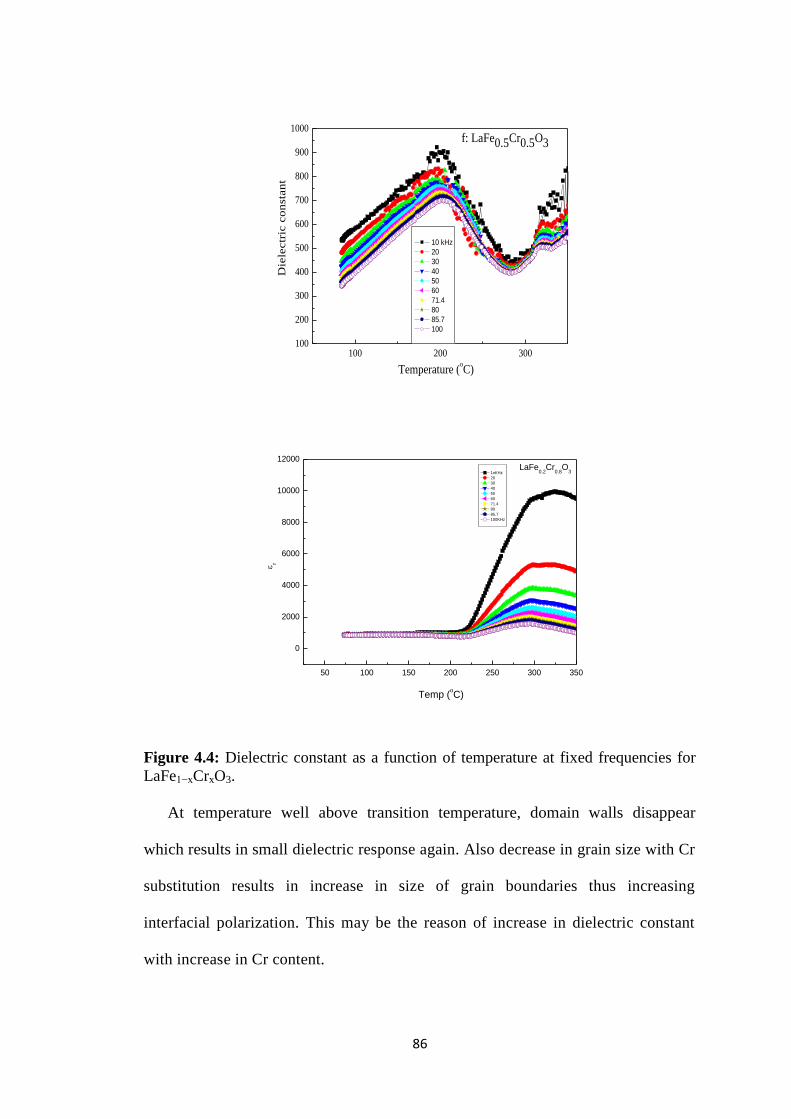
86
100 200 300100
200
300
400
500
600
700
800
900
1000
Temperature (oC)
Die
lectr
ic c
on
sta
nt
f: LaFe0.5Cr0.5O3
10 kHz
20
30
40
50
60
71.4
80
85.7
100
50 100 150 200 250 300 350
0
2000
4000
6000
8000
10000
12000
LaFe0.2
Cr0.8
O3
r
Temp (oC)
1oKHz
20
30
40
50
60
71.4
80
85.7
100KHz
Figure 4.4: Dielectric constant as a function of temperature at fixed frequencies for
LaFe1−xCrxO3.
At temperature well above transition temperature, domain walls disappear
which results in small dielectric response again. Also decrease in grain size with Cr
substitution results in increase in size of grain boundaries thus increasing
interfacial polarization. This may be the reason of increase in dielectric constant
with increase in Cr content.
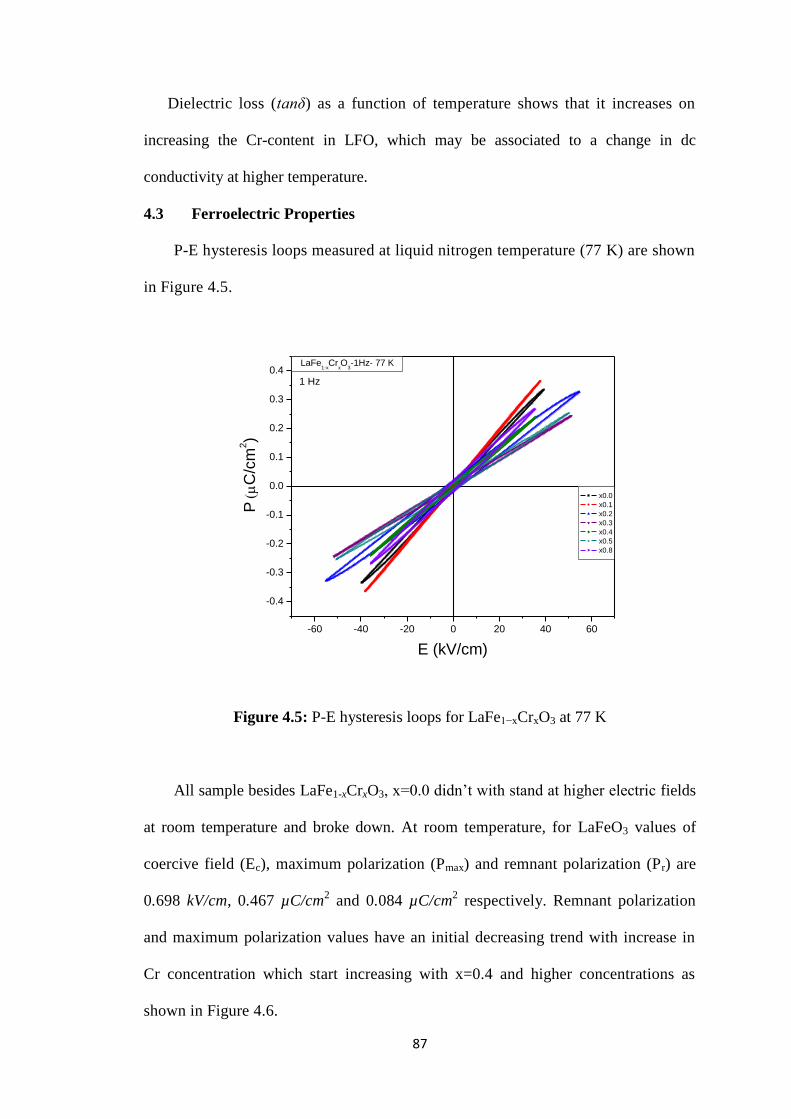
87
Dielectric loss (tanδ) as a function of temperature shows that it increases on
increasing the Cr-content in LFO, which may be associated to a change in dc
conductivity at higher temperature.
4.3 Ferroelectric Properties
P-E hysteresis loops measured at liquid nitrogen temperature (77 K) are shown
in Figure 4.5.
-60 -40 -20 0 20 40 60
-0.4
-0.3
-0.2
-0.1
0.0
0.1
0.2
0.3
0.41 Hz
LaFe1-x
CrxO
3-1Hz- 77 K
PC
/cm
2)
E (kV/cm)
x0.0
x0.1
x0.2
x0.3
x0.4
x0.5
x0.8
Figure 4.5: P-E hysteresis loops for LaFe1−xCrxO3 at 77 K
All sample besides LaFe1-xCrxO3, x=0.0 didn‟t with stand at higher electric fields
at room temperature and broke down. At room temperature, for LaFeO3 values of
coercive field (Ec), maximum polarization (Pmax) and remnant polarization (Pr) are
0.698 kV/cm, 0.467 µC/cm2 and 0.084 µC/cm
2 respectively. Remnant polarization
and maximum polarization values have an initial decreasing trend with increase in
Cr concentration which start increasing with x=0.4 and higher concentrations as
shown in Figure 4.6.
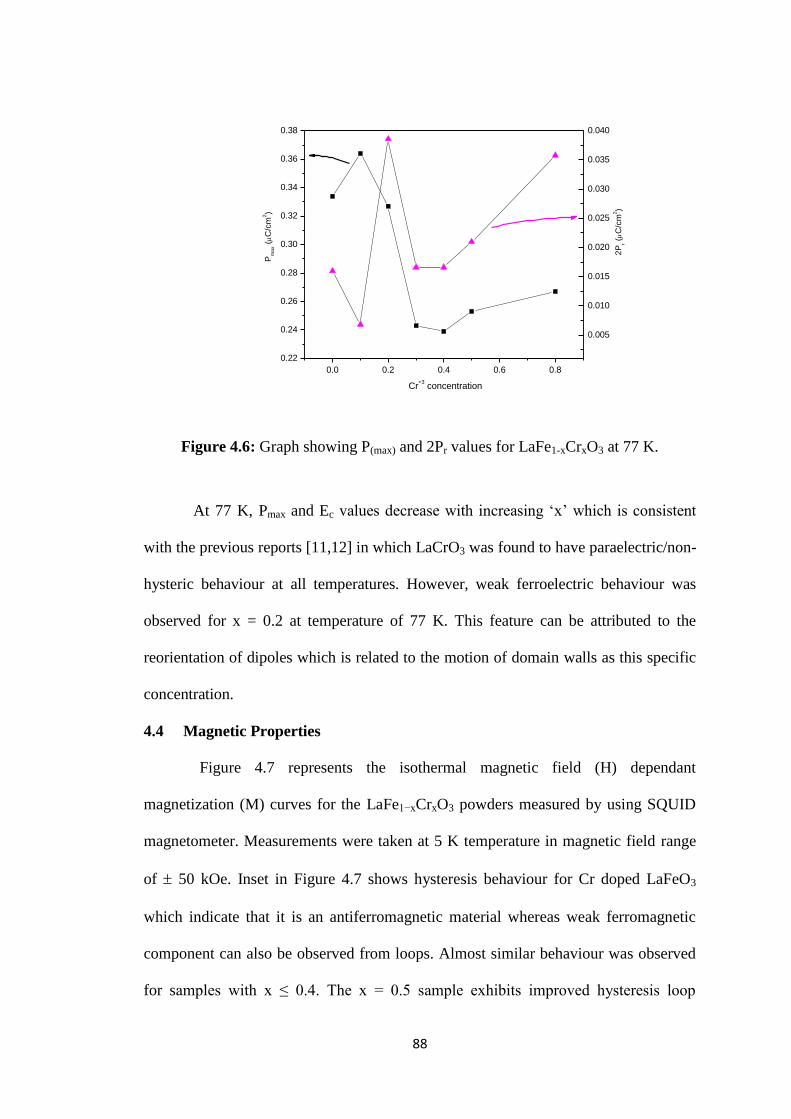
88
0.0 0.2 0.4 0.6 0.8
0.22
0.24
0.26
0.28
0.30
0.32
0.34
0.36
0.38
0.005
0.010
0.015
0.020
0.025
0.030
0.035
0.040
2P
r (C
/cm
2)
Cr+3
concentration
Pm
ax (C
/cm
2)
Figure 4.6: Graph showing P(max) and 2Pr values for LaFe1-xCrxO3 at 77 K.
At 77 K, Pmax and Ec values decrease with increasing „x‟ which is consistent
with the previous reports [11,12] in which LaCrO3 was found to have paraelectric/non-
hysteric behaviour at all temperatures. However, weak ferroelectric behaviour was
observed for x = 0.2 at temperature of 77 K. This feature can be attributed to the
reorientation of dipoles which is related to the motion of domain walls as this specific
concentration.
4.4 Magnetic Properties
Figure 4.7 represents the isothermal magnetic field (H) dependant
magnetization (M) curves for the LaFe1−xCrxO3 powders measured by using SQUID
magnetometer. Measurements were taken at 5 K temperature in magnetic field range
of 50 kOe. Inset in Figure 4.7 shows hysteresis behaviour for Cr doped LaFeO3
which indicate that it is an antiferromagnetic material whereas weak ferromagnetic
component can also be observed from loops. Almost similar behaviour was observed
for samples with x ≤ 0.4. The x = 0.5 sample exhibits improved hysteresis loop
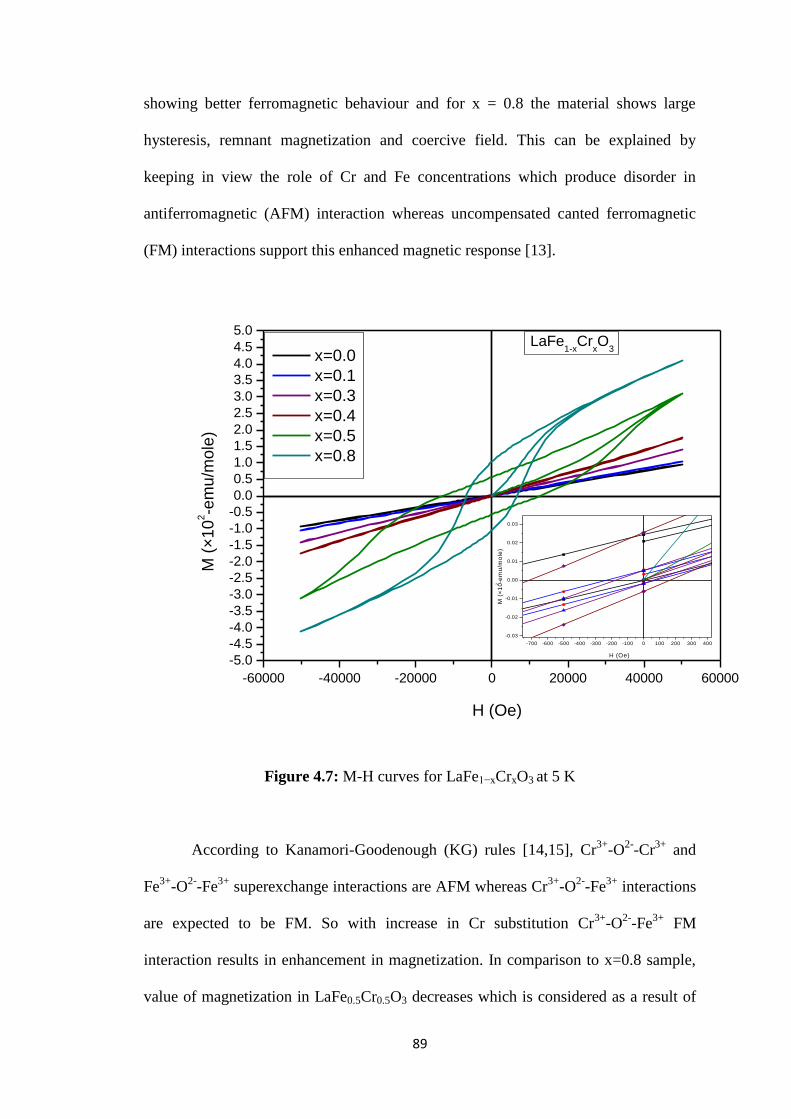
89
showing better ferromagnetic behaviour and for x = 0.8 the material shows large
hysteresis, remnant magnetization and coercive field. This can be explained by
keeping in view the role of Cr and Fe concentrations which produce disorder in
antiferromagnetic (AFM) interaction whereas uncompensated canted ferromagnetic
(FM) interactions support this enhanced magnetic response [13].
-60000 -40000 -20000 0 20000 40000 60000
-5.0
-4.5
-4.0
-3.5
-3.0
-2.5
-2.0
-1.5
-1.0
-0.5
0.0
0.5
1.0
1.5
2.0
2.5
3.0
3.5
4.0
4.5
5.0
-700 -600 -500 -400 -300 -200 -100 0 100 200 300 400
-0.03
-0.02
-0.01
0.00
0.01
0.02
0.03
M (
×1
02-e
mu
/mo
le)
H (Oe)
LaFe1-x
CrxO
3 x=0.0
x=0.1
x=0.3
x=0.4
x=0.5
x=0.8
M (
×1
02-e
mu
/mo
le)
H (Oe)
Figure 4.7: M-H curves for LaFe1−xCrxO3 at 5 K
According to Kanamori-Goodenough (KG) rules [14,15], Cr3+
-O2-
-Cr3+
and
Fe3+
-O2-
-Fe3+
superexchange interactions are AFM whereas Cr3+
-O2-
-Fe3+
interactions
are expected to be FM. So with increase in Cr substitution Cr3+
-O2-
-Fe3+
FM
interaction results in enhancement in magnetization. In comparison to x=0.8 sample,
value of magnetization in LaFe0.5Cr0.5O3 decreases which is considered as a result of
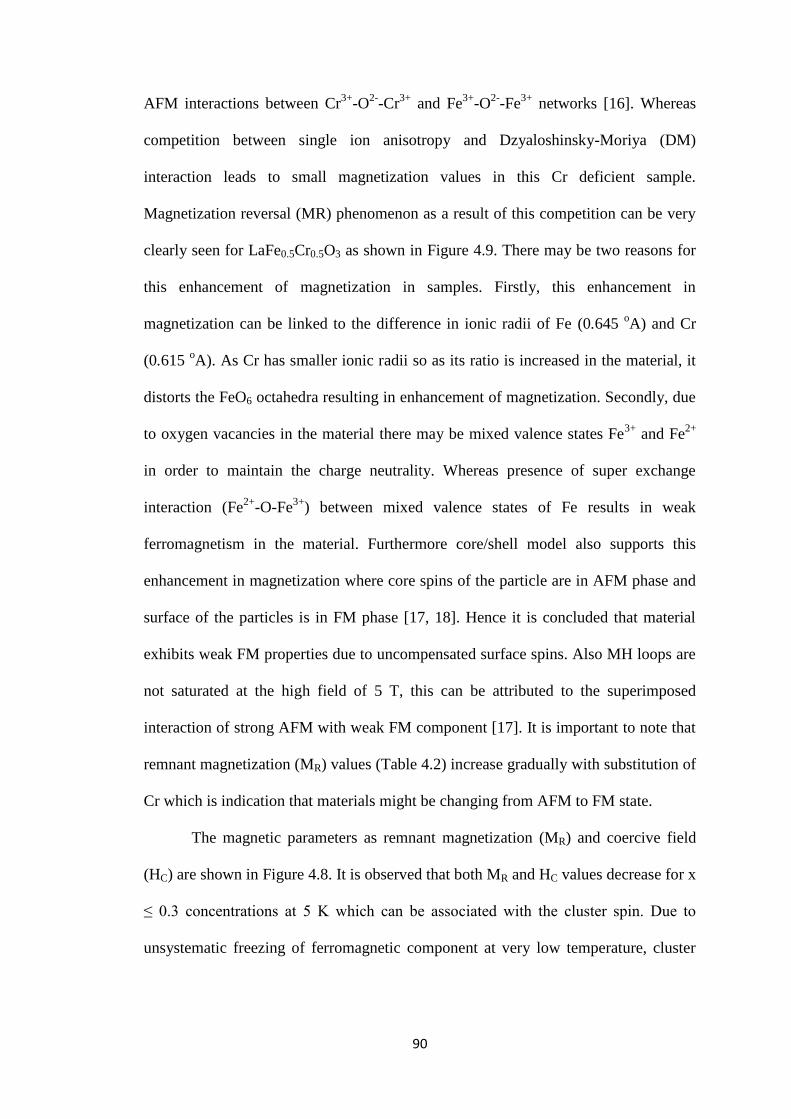
90
AFM interactions between Cr3+
-O2-
-Cr3+
and Fe3+
-O2-
-Fe3+
networks [16]. Whereas
competition between single ion anisotropy and Dzyaloshinsky-Moriya (DM)
interaction leads to small magnetization values in this Cr deficient sample.
Magnetization reversal (MR) phenomenon as a result of this competition can be very
clearly seen for LaFe0.5Cr0.5O3 as shown in Figure 4.9. There may be two reasons for
this enhancement of magnetization in samples. Firstly, this enhancement in
magnetization can be linked to the difference in ionic radii of Fe (0.645 oA) and Cr
(0.615 oA). As Cr has smaller ionic radii so as its ratio is increased in the material, it
distorts the FeO6 octahedra resulting in enhancement of magnetization. Secondly, due
to oxygen vacancies in the material there may be mixed valence states Fe3+
and Fe2+
in order to maintain the charge neutrality. Whereas presence of super exchange
interaction (Fe2+
-O-Fe3+
) between mixed valence states of Fe results in weak
ferromagnetism in the material. Furthermore core/shell model also supports this
enhancement in magnetization where core spins of the particle are in AFM phase and
surface of the particles is in FM phase [17, 18]. Hence it is concluded that material
exhibits weak FM properties due to uncompensated surface spins. Also MH loops are
not saturated at the high field of 5 T, this can be attributed to the superimposed
interaction of strong AFM with weak FM component [17]. It is important to note that
remnant magnetization (MR) values (Table 4.2) increase gradually with substitution of
Cr which is indication that materials might be changing from AFM to FM state.
The magnetic parameters as remnant magnetization (MR) and coercive field
(HC) are shown in Figure 4.8. It is observed that both MR and HC values decrease for x
≤ 0.3 concentrations at 5 K which can be associated with the cluster spin. Due to
unsystematic freezing of ferromagnetic component at very low temperature, cluster
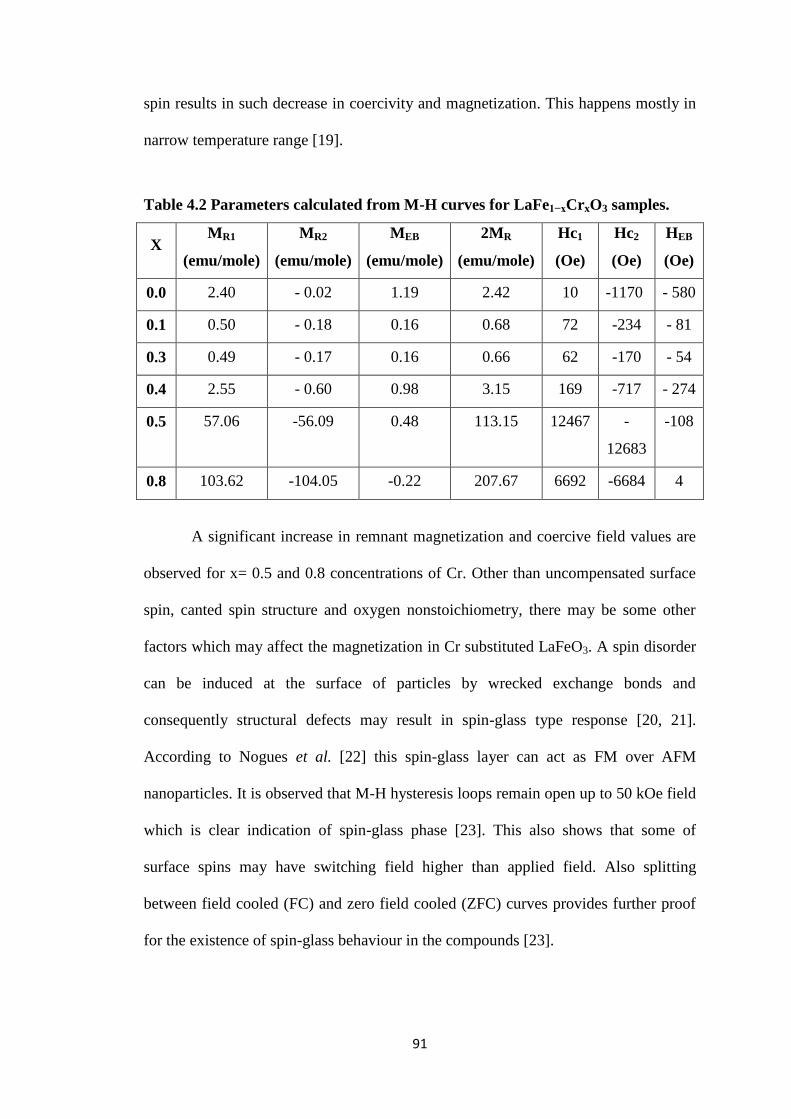
91
spin results in such decrease in coercivity and magnetization. This happens mostly in
narrow temperature range [19].
Table 4.2 Parameters calculated from M-H curves for LaFe1−xCrxO3 samples.
X MR1
(emu/mole)
MR2
(emu/mole)
MEB
(emu/mole)
2MR
(emu/mole)
Hc1
(Oe)
Hc2
(Oe)
HEB
(Oe)
0.0 2.40 - 0.02 1.19 2.42 10 -1170 - 580
0.1 0.50 - 0.18 0.16 0.68 72 -234 - 81
0.3 0.49 - 0.17 0.16 0.66 62 -170 - 54
0.4 2.55 - 0.60 0.98 3.15 169 -717 - 274
0.5 57.06 -56.09 0.48 113.15 12467 -
12683
-108
0.8 103.62 -104.05 -0.22 207.67 6692 -6684 4
A significant increase in remnant magnetization and coercive field values are
observed for x= 0.5 and 0.8 concentrations of Cr. Other than uncompensated surface
spin, canted spin structure and oxygen nonstoichiometry, there may be some other
factors which may affect the magnetization in Cr substituted LaFeO3. A spin disorder
can be induced at the surface of particles by wrecked exchange bonds and
consequently structural defects may result in spin-glass type response [20, 21].
According to Nogues et al. [22] this spin-glass layer can act as FM over AFM
nanoparticles. It is observed that M-H hysteresis loops remain open up to 50 kOe field
which is clear indication of spin-glass phase [23]. This also shows that some of
surface spins may have switching field higher than applied field. Also splitting
between field cooled (FC) and zero field cooled (ZFC) curves provides further proof
for the existence of spin-glass behaviour in the compounds [23].

92
Furthermore exchange biased (EB) effect was also observed in the system as
shown in inset of Figure 4.7. It is clear from hysteresis loop that samples exhibit shift
of HC in negative direction which in normally taken as signature of EB effect. Usually
the exchange field is defined as HEB = (HC1+HC2)/2 where HC1 and HC2 are the
positive and negative values of coercive fields. Similarly vertical shift is calculated as
MEB = (MR1+MR2)/2 where MR1 and MR2 are the values of magnetization at positive
and negative points of intersection where H=0 in the hysteresis loop. This limited EB
effect exhibits FM type shell and AFM core type magnetic structure of the materials.
So this effect can be related to the exchange interaction among FM shell and AFM
core at the material interfaces [24]
0.0 0.2 0.4 0.6 0.8
0
20
40
60
80
100
120
0
2000
4000
6000
8000
10000
12000
14000
Mr
Mr
(e
mu
/mo
le)
Cr Concentration
Hc
HC (
Oe
)
Figure 4.8: Magnetic parameters Mr and Hc at 5 K for LaFe1-xCrxO3 (x = 0.0, 0.1,
0.3, 0.4, 0.5 and 0.8)
Temperatures versus magnetization loops for LaFe1-xCrxO3 are given in Figure
4.9. The zero field cooled (ZFC) and field cooled (FC) measurements were made in
temperature range from 5 K to 300 K at a fixed magnetic field of 1000 Oe. The ZFC

93
and FC curves show irreversible trend throughout the temperature range. Wide
bifurcation between FC and ZFC curves for x=0.0 and 0.1 samples represent a strong
competitive interaction between FM and AFM interfaces which also indicates spin
glass behaviour in these materials [25, 13] However bifurcation initially increased for
x =0.1 concentration which is then suppressed for higher concentrations. This
decrease in separation of FC-ZFC curves suggest that anisotropy at the interfaces is
reduced.
It is observed that the FC-ZFC magnetization for LaFeO3, LaFe0.7Cr0.3O3 and
LaFe0.6Cr0.4O3 is greater than LaFe0.9Cr0.1O3. This shows that LaFe0.9Cr0.1O3 has very
weak interaction between Cr-O-Cr where Cr3+
(d3) weaken the AFM (Fe-O-Fe (d
5))
matrix which attributed towards reduced magnetization [13]. For LaFeO3 sample
magnetization increases throughout the complete temperature exhibiting a
ferromagnetic behaviour while for x=0.1 magnetization decreases slowly from 300 K
down to about 30 K showing an AFM behaviour. Similar behaviour was observed for
x=0.3 sample also. Further decreasing the temperature, a rapid increase in
magnetization is observed for both samples showing FM behaviour respectively. For
x=0.4 compound, gradual increase throughout the temperature range is observed
showing a weak ferromagnetic behaviour. Whereas for x=0.5 sample very interesting
results are observed for FC magnetization. For ZFC magnetization value increase
slowly showing weak FM nature, while for FC, negative magnetization value was
observed after compensation temperature (Tcomp) of 177 K. The zero magnetization at
Tcomp means that magnitude of effective magnetization is equal to the applied
magnetic field where both are also opposite in direction. At a temperature greater or
lower than Tcomp, magnetization exhibited by any one type of sub lattice dominates so
magnitude of magnetization is taken as positive or negative accordingly.
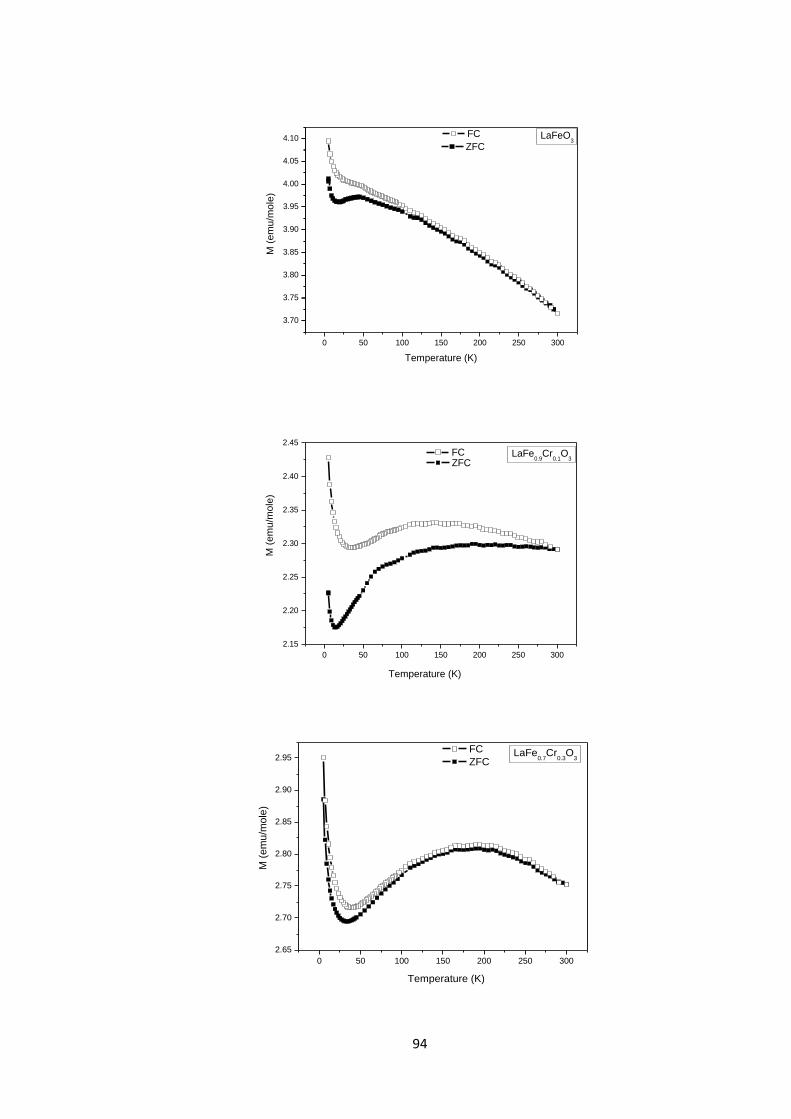
94
0 50 100 150 200 250 300
3.70
3.75
3.80
3.85
3.90
3.95
4.00
4.05
4.10
ZFC
M (
em
u/m
ole
)
Temperature (K)
FC LaFeO3
0 50 100 150 200 250 300
2.15
2.20
2.25
2.30
2.35
2.40
2.45
ZFC
Temperature (K)
M (
em
u/m
ole
)
FC
LaFe0.9
Cr0.1
O3
0 50 100 150 200 250 300
2.65
2.70
2.75
2.80
2.85
2.90
2.95 ZFC
LaFe0.7
Cr0.3
O3
M (
em
u/m
ole
)
Temperature (K)
FC
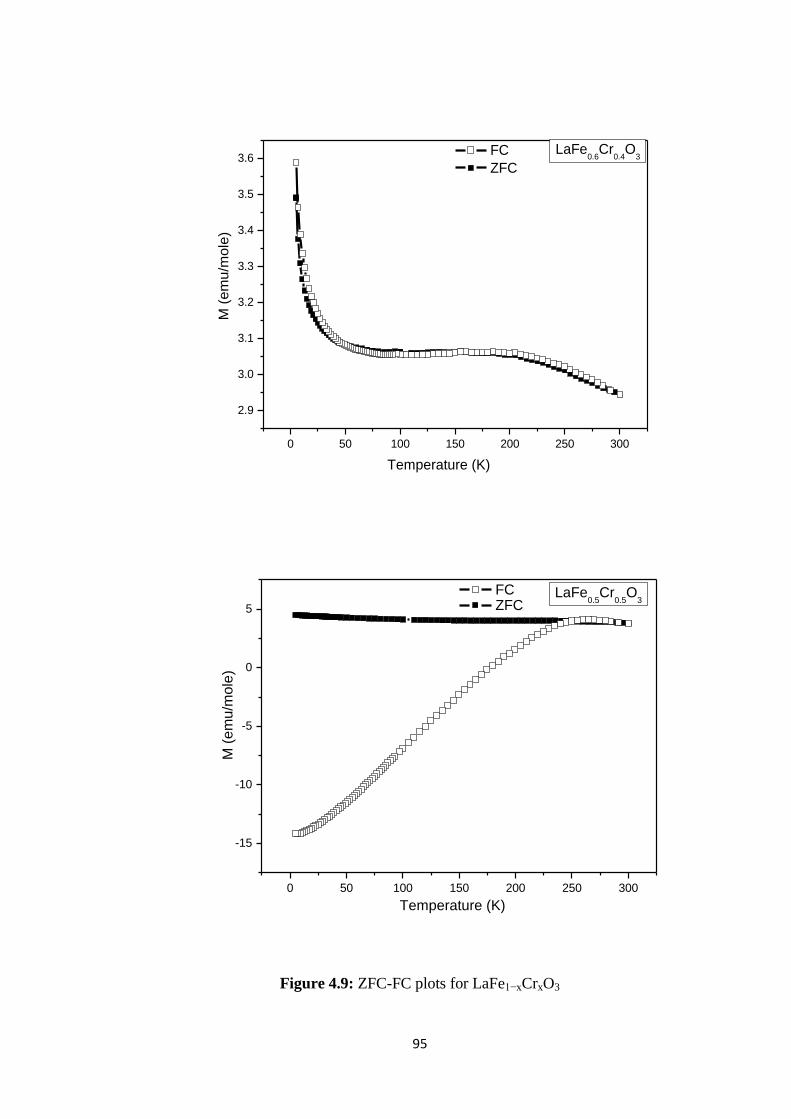
95
0 50 100 150 200 250 300
2.9
3.0
3.1
3.2
3.3
3.4
3.5
3.6 ZFC
M (
em
u/m
ole
)
Temperature (K)
LaFe0.6
Cr0.4
O3
FC
0 50 100 150 200 250 300
-15
-10
-5
0
5 ZFCLaFe
0.5Cr
0.5O
3
Temperature (K)
M (
em
u/m
ole
)
FC
Figure 4.9: ZFC-FC plots for LaFe1−xCrxO3

96
This magnetization reversal in LaFe0.5Cr0.5O3 can be explained as a result of
the competition between DM and isotropic superexchange interactions [26].
4.5 Electrical Resistivity
Temperature dependent electrical resistivity has been measured for
LaFe1−xCrxO3 (x = 0.1, 0.2, 0.3, 0.4, 0.5) in the temperature range 293-423 K in order
to study the conduction process in these compounds as shown in Figure 4.10.
2.2 2.4 2.6 2.8 3.0 3.2 3.4
5
6
7
8
9
10
log
1000/T K-1
x=0.0
x=0.1
x=0.2
x=0.3
x=0.4
x=0.5
Figure 4.10: Variation of Resistivity (ρ) with temperature for LaFe1−xCrxO3.
The ρ decreases exponentially with increase in temperature suggesting a
typical semiconducting behaviour. This temperature induced change in the ρ may be
due to thermally activated drift mobility of charge carriers which suggests a hopping
conduction mechanism. The electrical resistivity of the material is decreased
significantly because of the low resistivity of the material phase [27]. The Arrhenius

97
relation ρ/T = ρoexp(Ea/kBT), where ρ is the resistivity, ρo the constant, Ea
activation energy and kB is the Boltzmanns constant, gives a linear logρ versus
1000/T plot for small polaron conduction as shown in Figure 4.10. Activation energy
calculated from slope of logρ versus 1000/T is tabulated in Table 4.3. For pure LFO
activation energy value is comparable with those reported in literature [5].
Table:4.3: Activation energy Vs Cr+3
concentration for LaFe1-xCrxO3
Cr+3
concentration Activation Energy (eV)
0.0 0.477
0.1 0.456
0.2 0.436
0.3 0.403
0.4 0.368
0.5 0.348
0.8 0.333
ABO3 compounds are generally considered as electronic conductors because
close packed nature of perovskite structure restricts ionic conduction and activation
energy for oxide ion conductors is mostly >0.9 eV. For n-type polaronic conduction
their value is less than 0.2 eV and greater than 0.2 eV for p-type polaronic
conduction of holes [28]. So the calculated activation energy suggests a p-type
polaronic conduction in the Cr+3
substituted LFO system above room temperature.
4.6 Summary
In this work antiferromagnetic LaFeO3 material was focused and with Cr
substitution at B-site its multiferroic properties were explored. Single phase Cr
substituted LaFe1-xCrxO3 compounds were successfully prepared by sol-gel method
and found that gradual substitution of Cr has no effect on the structure. On Cr
substitution, the drastic change observed in dielectric behaviour is attributed to a
98
phase transition from antiferromagnetic to paramagnetic above room temperature. The
Cr substitution results in decrease of Neel temperature which may be caused by the
intrinsic contribution due to activation of domain walls. Ferroelectric P-E curves show
paraelectric behaviour in doped samples with small ferroelectric response at 77 K.
Activation energy values calculated from DC electrical resistivity data reflects a p-
type polaronic conduction in the system above room temperature. MH and MT loops
confirmed the weak FM nature of the compound. Magnetism was enhanced by
gradual substitution of Cr. Negative shift in HC in MH loops confirmed the presence
of exchange biased phenomenon in the material. Further core/shell structure, where
particles have FM like shell and AFM type core, is assumed to be the cause of weak
FM response of the material.

99
References
[1] S. Acharya, J. Mondal, S. Ghosh, S.K.Roy, P.K. Chakrabarti, Material letters, 64,
415 (2010).
[2] W. Hu, Y. Chen, H. Yuan, G. Zhang, G. Li, G. Pang, S. Feng, Journal of Solid
State Chemistry, 183, 1582 (2010).
[3] H. Taguchi, Journal of Solid State Chemistry, 131, 108 (1997).
[4] K.K. Patankar, P.D. Dombale, V.L. Mathe, S.A. Patil, R.N. Patil, Material
Science Engineering B, 87, 53 (2001).
[5] M. Idrees, M. Nadeem, M. Atif, M. Siddique, M. Mehmood, M.M. Hassan,
Acta Materialia, 59, 1338 (2011).
[6] L. J. Berchmans, R. Sindhu, S. Angappan, C.O. Augustin, Journal of Materials
Processing Technology, 207, 301 (2008).
[7] M. Kumar, K. L. Yadav, Applied Physics Letters, 91, 242901 (2007).
[8] C-H. Yang, T. Y. Koo, Y. H. Jeong, Solid State Communication, 134, 299 (2005).
[9] M.B. Mohamed, H. Wang, H. Fuess, Journal of Physics D: Applied Physics, 43,
455407 (2010).
[10] R.S. Devan, S.B. Deshpande, B.K. Chougule, Journal of Physics D: Applied
Physics, 40, 1864 (2007).
[11] H-Y Guo, J.I.L. Chen, Z-G.Ye, Journal of Materials Research, 22, 2081 (2007).
[12] J.R. Sahu, C.R. Serrao, N. Ray, U.V. Waghmarae, C.N.R. Rao, Journal of
Materials Chemistry, 17, 42 (2007).
[13] A. P. B. Selvadurai, V. Pazhanivelu, C. Jagadeeshwaran, R. Murugaraj, I. P.
Muthuselvam, F.C. Chou, Journal of Alloys and Compdounds, 646, 924 (2015).
[14] J.B. Good enough, Physical Review, 100, 564 (1955).
[15] J. Kanamori, Journal of Physics and Chemistry of Solids, 10(2), 87 (1959).
[16] T. Bora, S. Ravi, Journal of Applied Physics, 114, 033906 (2013).
[17] Z.M. Tian, S.L. Yuan, X.L. Wang, X.F. Zheng, S.Y. Yin, C.H. Wang, L. Liu,
Journal of Applied Physics, 106, 103912 (2009).

100
[18] R.S. Bhalerao-Panajkar, M.M. Shirolkar, R. Dasd, T. Maityd, P. Poddard, S.K.
Kulkarni, Solid State Communications, 151, 55 (2011).
[19] R.D. Zyslera, H. Romerob, C.A. Ramosa, E. De Biasia, D. Fioranic, Journal of
Magnetism and Magnetic Materials, 266, 233 (2003).
[20] A. Hernando, Journal of Physics: Condensed Matter, 11, 9455 (1999).
[21] E. Winkler, R.D. Zysler, M. Vasquez Mansilla, D. Fiorani, D. Rinaldi, M.
Vasilakaki, K.N. Trohidou, Nanotechnology, 19, 185702 (2008).
[22] J. Nogues, J. Sort, V. Langlais, V. Skumryev et al. Physics Reports, 65, 422
(2005).
[23] H. Ahmadvand, H. Salamati, P. Kameli, A. Poddar, M. Acet, K. Zakeri Journal of
Physics D: Applied Physics, 43, 245002 (2010).
[24] Y. Qiu, Y. S. Luo, Z. J. Zou, Z. M. Tian , S. L. Yuan, Y. Xi, L. Z. Huang, Journal
of Material Science: Materials in Electronics, 25, 760 (2014).
[25] S. Phokha, S. Pinitsoontorn, S. Maensiri, S. Rujirawat, Journal of Sol-Gel
Science and Technology, 71, 333 (2014).
[26] N. Dasari1, P. Mandal, A. Sundaresan, N. S. Vidhyadhiraja, Europhysics Letters,
99,17008 (2012).
[27] J. Ryu, S. Priya, K. Uchino, H-E. Kim, Journal of Electroceramics 8, 107 (2002).
[28] M. Idrees, M. Nadeem, M.M. Hassan, Journal of Physics D: Applied Physics, 43,
155401 (2010).
101
Chapter No. 5
Effect of K1+
substitution on electric and magnetic
properties of La1-xKxFeO3
102
5 Effect of K1+
substitution on electric and magnetic properties of La1-xKxFeO3
Among perovskite multiferroics, LaFeO3 is very well known canted
antiferromagnetic material [1, 2]. Although it is used in fuel cells and sensor
technology at large scale but due to weak electric and magnetic properties, its
practical use in electric and magnetic fields is limited. There are many ways to
enhance its multiferroics properties as discussed earlier in previous chapter including
one to enhance these properties by substitution of La3+
by ions of relatively larger
ionic size and low oxidation state such as K1+
. Charge disproportion created by
doping of aliovalent ion (as K+, Ba
+2) at A site can be compensated in three ways; (a)
creation of mixed valency i.e. changing Fe+3
into Fe+4
to compensate the positive
charge deficiency (b) creation of oxygen vacancies (c) combination of both mixed
valency and oxygen vacancies. If material is prepared in air environment then
combination of both mixed valency and oxygen vacancies is most likely to be
obtained [3]. These mixed valence states play a significant role in affecting the
magnetic as well as other physical properties.
In this study an attempt has been made to improve its electric and magnetic
properties by K+ substitutions keeping in view its comparatively larger ionic size and
low oxidation state. To study physical properties, La1-xKxFeO3 material was
synthesized by wet chemical co-precipitation method. Analytical grade (≥ 99 %
purity) pre-cursors from Sigma Aldrich were used as starting materials. In this chapter
structural, dielectric, ferroelectric and magnetic response of the aforesaid material is
discussed in detail.
5.1 Structural Analysis
Perovskite oxides with composition La1-xKxFeO3 (x≤0.5) were prepared by co-
precipitation method.

103
Figure 5.1: Powder XRD patterns of La1-xKxFeO3 (x ≤ 0.5)
The single phase of the compound was determined by XRD using Cu Kα
radiation. Figure 5.1 shows the x-ray diffraction (XRD) pattern used to investigate the
phase purity of prepared samples La1-xKxFeO3 for x=0, 0.1, 0.2, 0.3, 0.4 & 0.5.
Table 5.1.
Grain size calculated from XRD graphs La1-xKxFeO3 samples.
K concentration (x) Grain size (nm)
0.0 173
0.1 107
0.2 111
0.3 100
0.4 70
0.5 66

104
It has been found that the XRD pattern for all the compositions is in good
agreement with the crystalline structure of LaFeO3 (JCPDS No. 37-1493). All
corresponding diffraction peaks appear at the same 2θ values predicting no shift in
peaks with reference to 2θ values. This indicates no signified change in the structure
of the system on K-substitution as ionic radius of K+ (1.38
Å) is very close to La
3+
(1.36 Å) in twelve coordinated geometry. However broadening of peaks is observed
gradually with the increase in K+ substitution, which may possibly be due to the
decrease in grain size as already reported in literature during synthesis by chemical
route [4].
Figure 5.2: AFM images for La1-xKxFeO3 for x=0, 0.1, 0.2, 0.3, 0.4 & 0.5
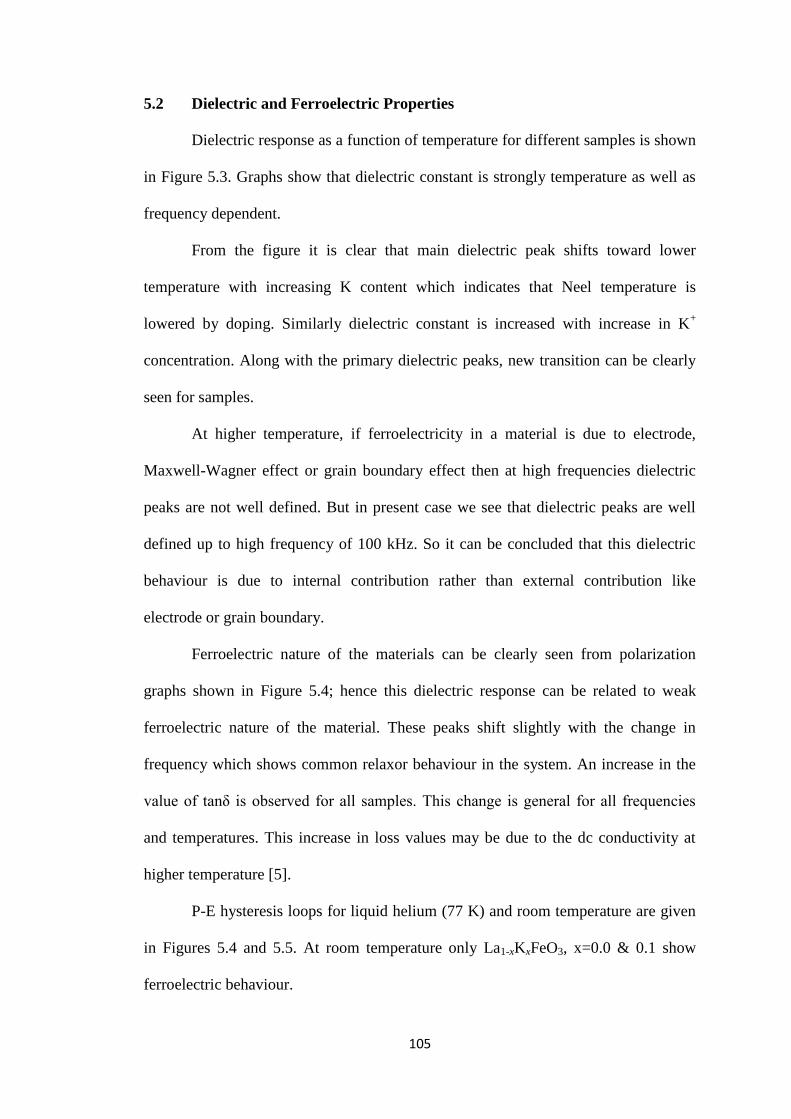
105
5.2 Dielectric and Ferroelectric Properties
Dielectric response as a function of temperature for different samples is shown
in Figure 5.3. Graphs show that dielectric constant is strongly temperature as well as
frequency dependent.
From the figure it is clear that main dielectric peak shifts toward lower
temperature with increasing K content which indicates that Neel temperature is
lowered by doping. Similarly dielectric constant is increased with increase in K+
concentration. Along with the primary dielectric peaks, new transition can be clearly
seen for samples.
At higher temperature, if ferroelectricity in a material is due to electrode,
Maxwell-Wagner effect or grain boundary effect then at high frequencies dielectric
peaks are not well defined. But in present case we see that dielectric peaks are well
defined up to high frequency of 100 kHz. So it can be concluded that this dielectric
behaviour is due to internal contribution rather than external contribution like
electrode or grain boundary.
Ferroelectric nature of the materials can be clearly seen from polarization
graphs shown in Figure 5.4; hence this dielectric response can be related to weak
ferroelectric nature of the material. These peaks shift slightly with the change in
frequency which shows common relaxor behaviour in the system. An increase in the
value of tanδ is observed for all samples. This change is general for all frequencies
and temperatures. This increase in loss values may be due to the dc conductivity at
higher temperature [5].
P-E hysteresis loops for liquid helium (77 K) and room temperature are given
in Figures 5.4 and 5.5. At room temperature only La1-xKxFeO3, x=0.0 & 0.1 show
ferroelectric behaviour.

106
0 50 100 150 200 250 300 350
100
200
300
400
500
600
700
0 50 100 150 200 250 300 350
0
50
100
150
200
250
300
350
400
Temp (C
o)
tan
r
a: LaFeO3
Temp (Co)
10KHz
20
30
40
50
60
71.4
80
85.7
100
50 100 150 200 250 300 350
100
200
300
400
500
600
700
50 100 150 200 250 300
0
1000
2000
3000
4000
5000
Temp (Co)
tan
b: La0.9
K0.1
FeO3
r
Temp (Co)
10
20
30
40
50
60
71.4
80
85.7
100
50 100 150 200 250 300 350
100
200
300
400
500
600
700
50 100 150 200 250 300 350
0
500
1000
1500
2000
2500
Temp (Co)
tan
c: La0.8
K0.2
FeO3
Temp (Co)
r
10KHz
20
30
40
50
60
71.4
80
85.7
100

107
50 100 150 200 250 300 350
100
200
300
400
500
600
700
50 100 150 200 250 300 350
0
500
1000
1500
2000
2500
Temp (Co)
tan
Temp (Co)
d: La0.7
K0.3
FeO3
r
10
20
30
40
50
60
71.4
80
85.7
100
50 100 150 200 250 300 350
100
200
300
400
500
600
700
50 100 150 200 250 300 350
0
500
1000
1500
2000
Temp (Co)
tan
Temp (Co)
e: La0.6
K0.4
FeO3
r
10
20
30
40
50
60
71.4
80
85.7
100
50 100 150 200 250 300 350
100
200
300
400
500
600
700
50 100 150 200 250 300 350
0
100
200
300
400
500
600
Temp (Co)
tan
Temp (Co)
10
20
30
40
50
60
71.4
80
85.7
100
f: La0.5
K0.5
FeO3
r
Figure 5.3: Dielectric constant as function of temperature for different frequencies for
La1-xKxFeO3. Inset shows the dielectric loss as a function of temperature. (a) to (f) for
x = ≤ 0.5
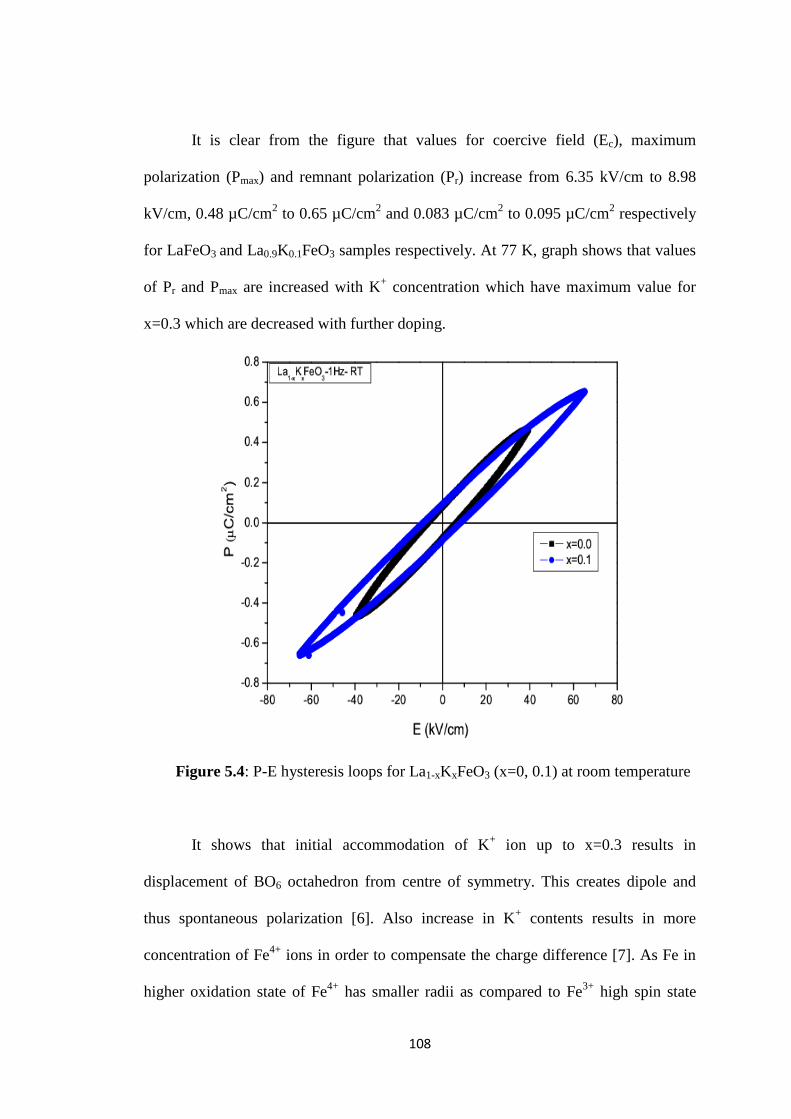
108
It is clear from the figure that values for coercive field (Ec), maximum
polarization (Pmax) and remnant polarization (Pr) increase from 6.35 kV/cm to 8.98
kV/cm, 0.48 µC/cm2 to 0.65 µC/cm
2 and 0.083 µC/cm
2 to 0.095 µC/cm
2 respectively
for LaFeO3 and La0.9K0.1FeO3 samples respectively. At 77 K, graph shows that values
of Pr and Pmax are increased with K+ concentration which have maximum value for
x=0.3 which are decreased with further doping.
Figure 5.4: P-E hysteresis loops for La1-xKxFeO3 (x=0, 0.1) at room temperature
It shows that initial accommodation of K+ ion up to x=0.3 results in
displacement of BO6 octahedron from centre of symmetry. This creates dipole and
thus spontaneous polarization [6]. Also increase in K+ contents results in more
concentration of Fe4+
ions in order to compensate the charge difference [7]. As Fe in
higher oxidation state of Fe4+
has smaller radii as compared to Fe3+
high spin state
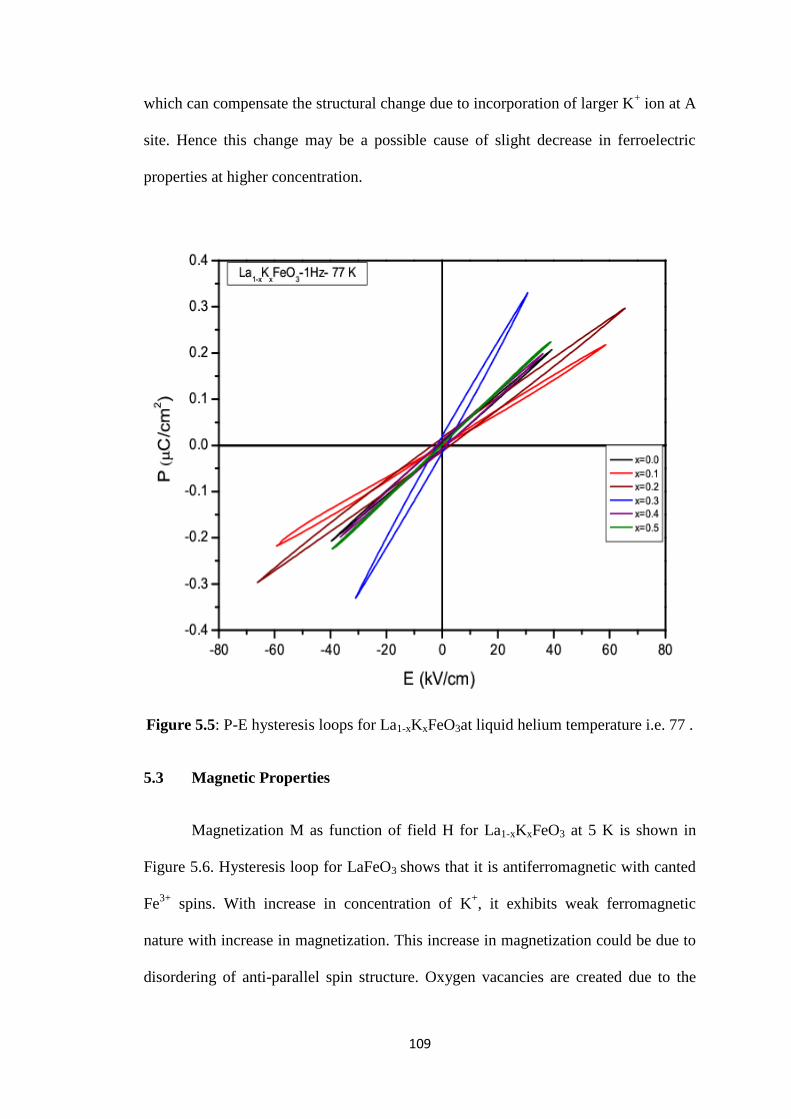
109
which can compensate the structural change due to incorporation of larger K+ ion at A
site. Hence this change may be a possible cause of slight decrease in ferroelectric
properties at higher concentration.
Figure 5.5: P-E hysteresis loops for La1-xKxFeO3at liquid helium temperature i.e. 77 .
5.3 Magnetic Properties
Magnetization M as function of field H for La1-xKxFeO3 at 5 K is shown in
Figure 5.6. Hysteresis loop for LaFeO3 shows that it is antiferromagnetic with canted
Fe3+
spins. With increase in concentration of K+, it exhibits weak ferromagnetic
nature with increase in magnetization. This increase in magnetization could be due to
disordering of anti-parallel spin structure. Oxygen vacancies are created due to the

110
charge difference in K+ and La
3+ which disturb anti-parallel spin ordering in Fe
3+-O-
Fe3+
linkages in G-type antiferromagnetic structure [8].
Coupling of magnetic moments of transition metal ions in oxides with
intervening oxygen is called super exchange interaction which is negative for
orthorhombic LaFeO3. Decrease in Fe3+
-O2-
distance increases this exchange
interaction. Gradual replacement of La3+
with K+
results in decrease of bond lengths
and bond angle. So FeO6 octahedron is also influenced by these changes [9]. This
accounts for increased magnetization with K+ doping.
Figure 5.6: M-H hysteresis loops for La1-xKxFeO3at 5 K
This increase can also be linked to net magnetic moment of Fe. Pure LaFeO3
exhibits G-type canted antiferromagnetic behaviour. Canting of Fe3+
spins at small
angle results in µnet ≈ 0. Substitution of K+ in LaFeO3 compound results in charge
instability. To maintain charge neutrality, some of Fe3+
ions are changed to Fe4+

111
oxidation sate accordingly. With the increase in amount of Fe4+
ions, the difference in
magnetic moment between Fe3+
(S=5/2) and Fe4+
(S=2) becomes, µ1cosθ1-µ2cosθ2.
(where µ1= 5.85 µB, µ2=4.5 µB are effective magnetic moments and θ1,θ2 are small
angles of deviation for Fe3+
and Fe4+
magnetic spins respectively) [7]. It shows that
net magnetic moment is increased in K-doped sample. So with the increase in ratio of
K+ substitution, number of Fe
4+ ions in the material increase which results in
enhancement in magnetization subsequently. This can be seen from values of remnant
magnetization (MR) and coercive field (HC) values as shown in Table 5.1. Values
confirm gradual enhancement in magnetization with increasing K contents.
Also small EB effect was also observed in the system. Negative values for HC
given in Table 5.1 are the indicative of the fact that system exhibits EB effect.
Exchange field HEB is defined as HEB = (HC1+HC2)/2 where HC2 and HC1 represent the
negative and positive values of coercive fields. Vertical shift is calculated as MEB =
(MR1+MR2)/2 where MR2 and MR1 are the values of magnetization at negative and
positive points of intersection where H=0 in the hysteresis loop. Exchange interaction
between FM shell and AFM core interface in the material are considered as the reason
behind this EB effect [10].
Temperature dependence of magnetization for La1-xKxFeO3 is shown in Figure
5.7. The zero field cooled (ZFC) and field cooled (FC) measurements of the samples
were made at a magnetic field of 1000 Oe in temperature range from 5 K to 300 K.
The ZFC and FC curves show irreversible trend throughout the temperature
range in this study for all samples. The separation becomes widened with increase in
K contents. This wide separation between FC and ZFC curves shows a strong
competitive interaction between AFM and FM interfaces which also signifies
presence of spin glass behaviour in these compounds [11, 12].

112
0 50 100 150 200 250 300
3.70
3.75
3.80
3.85
3.90
3.95
4.00
4.05
4.10
ZFC
M (
em
u/m
ole
)
Temperature (K)
FCLaFeO
3
0 50 100 150 200 250 300
2.2
2.4
2.6
2.8
3.0
3.2
0 50 100 150 200 250 300
2.2
2.4
2.6
2.8
3.0
3.2 ZFC
M (
em
u/m
ole
)
Temperature (K)
La0.9
K0.1
FeO3
FC
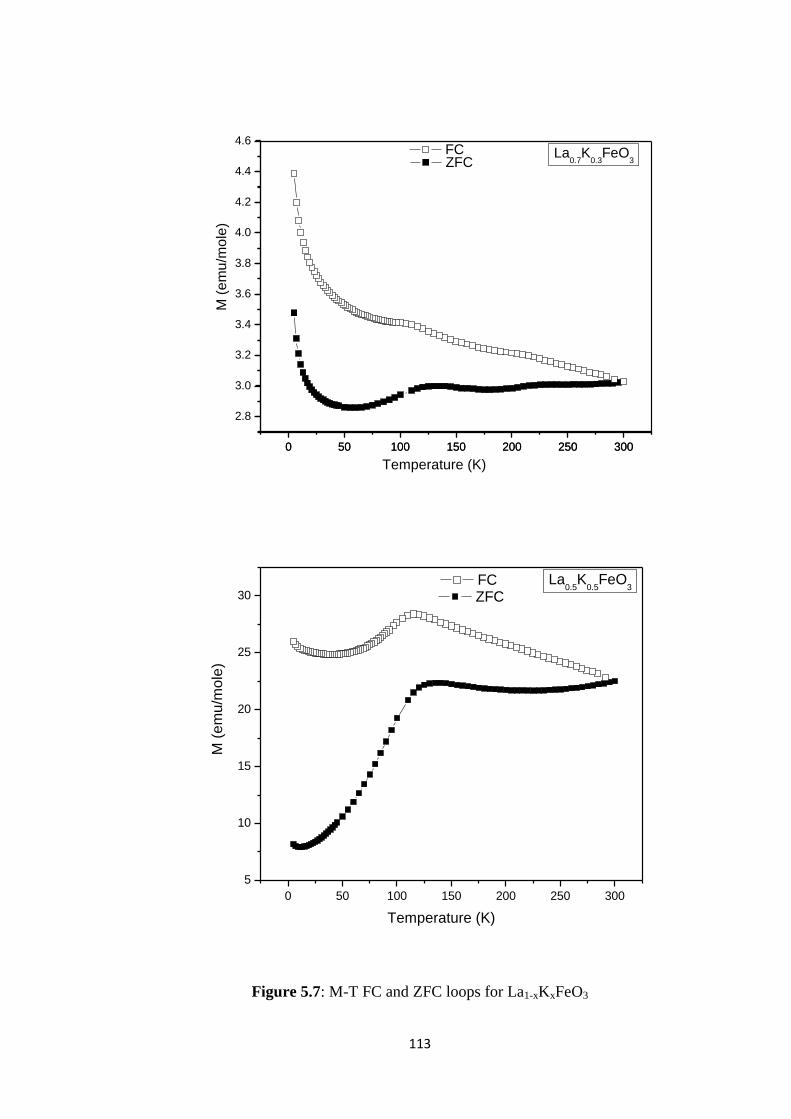
113
0 50 100 150 200 250 300
2.8
3.0
3.2
3.4
3.6
3.8
4.0
4.2
4.4
4.6
0 50 100 150 200 250 300
ZFCLa
0.7K
0.3FeO
3
M (
em
u/m
ole
)
Temperature (K)
FC
0 50 100 150 200 250 300
5
10
15
20
25
30
M (
em
u/m
ole
)
Temperature (K)
ZFCLa
0.5K
0.5FeO
3 FC
Figure 5.7: M-T FC and ZFC loops for La1-xKxFeO3

114
For all samples, magnetization is observed to be increasing throughout the
temperature range which indicates weak ferromagnetic property of the material. Close
to the minimum temperature, rapid increase in magnetization is observed exhibiting a
ferromagnetic response. With the substitution of K+ in place of La
3+, a charge
disproportion is developed in the material which has two effects, one Fe3+
is changed
to Fe4+
to maintain charge neutrality and secondly oxygen vacancies are produced.
Oxygen vacancies perturb antiparallel spin ordering in Fe3+
-O-Fe3+
known as
superexchange interaction and resultantly magnetism is increased due to disturbance
in G-type spin arrangement [3].
A small cusp in ZFC and FC curves is observed in LaFeO3 about 17 K
temperature which is strongly suppressed by substitution of K in the material.
Table 5.2.
Parameters calculated from M-H curves for La1-xKxFeO3 samples.
X MR1
(emu/mole)
MR2
(emu/mole)
MEB
(emu/mole)
2MR
(emu/mole)
Hc1
(Oe)
Hc2
(Oe)
HEB
(Oe)
0.0 2.44 - 0.03 1.20 2.47 3 -1170 -584
0.1 1.02 - 0.74 0.14 1.76 251 -351 -50
0.3 4.70 - 4.16 0.27 8.86 1165 -1322 -79
0.5 111.39 -110.50 0.44 221.89 10483 -10872 -195
Furthermore it is shifted towards higher temperature with K substitution, for
x=0.5, it is observed at 126 K. This cusp is also another indication of spin glass like
response in the material [13]. The bifurcation in the FC-ZFC curves can be explained
according to core-shell nature of the material particles. As in pure antiferromagnetic
(AFM) materials, no separation between FC-ZFC curves takes place. But continuation

115
of bifurcation up to ∼300 K along with hysteresis behaviour strongly indicates the
AFM-FM interactions between the material interfaces. According to core/shell model,
FM type surface spins of the particles interact with AFM spins of the core of the
materials resulting in increase in magnetism [14].
5.4 Summary
It is concluded that La1-xKxFeO3 (x≤0.5) belong to orthorhombic structure and
gradual substitution of K+ possessing little bigger ionic radii does not affect the
structure. Temperature dependent dielectric constant has well defined peaks with
values of order of 102 which are supposed due to ferroelectric nature of the material.
Non-centrosymmetry due to substitution of K+ results in slight increase in
ferroelectric behaviour of the material. Charge disproportion caused due to different
oxidation state of K+ and La
+3, change in oxidation state from Fe
+3 to Fe
+4 is the cause
of enhancement of magnetic properties. Spin glass behaviour can be expected in the
material as indicated by a small cusp in the graph. Moreover core/shell model is used
to explain the increase in magnetization.

116
References
[1] A. Scholl, J. Stohr, J. Luning, J.W.Seo, J.Fompeyrine, H.Siegwart et al.
Science 287, 1014 (2000).
[2] M.R.Todd, L.C.Gary, M.A.James, Physical Review B, 48, 224 (1993).
[3] H. Yamamura, H. Haneda, S. I. Shirasaki, Journal of Solid State Chemistry, 36, l
(1981).
[4] X. Meng, F. He, X. Shen, J. Xiang, P. Wang, Industrial and Engineering
Chemistry Research, 50, 11037 (2011).
[5] G. Anjum, R. Kumar, S. Mollah, D. K. Shukla, S. Kumar, C. G. Lee
Journal of Applied Physics, 107, 1033916 (2010).
[6] N Ramadass, Materials Science and Engineering, 36, 231 (1978).
[7] M. A. Ahmed, S. I. El-Dek, Materials Science and Engineering B, 128, 30 (2006).
[8] W. C. Koehler, E. O. Wollan, Journal of Physics and Chemistry of Solids, 2, 100
(1957).
[9] M B Bellakki, V Manivannan, Bulletin of Materials Science, 33, 611 (2010).
[10] Y. Qiu, Y. S. Luo, Z. J. Zou, Z. M. Tian , S. L. Yuan, Y. Xi, L. Z. Huang, Journal
of Materials Science: Materials in Electronics, 25, 760 (2014)
[11] S. Phokha, S. Pinitsoontorn, S. Maensiri, S. Rujirawat, Journal of Sol-Gel
Science and Technology, 71, 333 (2014).
[12] A. P. B. Selvadurai, V. Pazhanivelu, C. Jagadeeshwaran, R. Murugaraj, I. P.
Muthuselvam, F.C. Chou, Journal of Alloys and Compounds, 646, 924 (2015).
[13] Z. Zhou, L. Guo, H. Yang, Q. Liu, F. Ye, Journal of Alloys and Compounds,
583, 21 (2014).
[14] R.S. Bhalerao-Panajkar, M.M. Shirolkar, R. Dasd, T. Maityd, P. Poddard, S.K.
Kulkarni, Solid State Communications, 151, 55 (2011).

117
Chapter No. 6
Effect of Mn3+
substitution on electrical and magnetic
properties of Bi0.8La0.15Ho0.05Fe1-xMnxO3

118
6 Effect of Mn3+
substitution on electrical and magnetic
properties of Bi0.8La0.15Ho0.05Fe1-xMnxO3
In current chapter physical properties of Bi0.8La0.15Ho0.05Fe1-xMnxO3 samples
are explained and analysed. BFO is a potential material for use in practical appliances
but few drawbacks such as high leakage current, high dielectric loss and weak
antiferromagnetic character hinder its use at room temperature. To overcome these
drawbacks, substitution is a commonly used and remarkable effective method to
modulate the basic properties of perovskite oxides. RE substitution is expected to
distort the cations spacing between the oxygen octahedra and alter the long-range
ferroelectric order, which can enhance magnetic properties [1-2]. Similarly
substitution of La and Ho element at Bi site can stabilize the perovskite system and is
also beneficial for reducing the oxygen vacancies.
Manganese is a particularly interesting element for substitution, because it
easily changes its oxidation state, furthermore, the ionic radii of Fe3+
and Mn3+
are
practically identical with ionic radius approximately equal to 0.645 A˚ [3]. The
number of d electrons and effective magnetic moments, however, are different for
Fe3+
and Mn3+
. There are five 3d electrons and an effective magnetic moment of µeff
equal to 5.9 µB for Fe3+
and four 3d electrons and effective magnetic moment of µeff
equal to 4.9 µB for Mn3+
. Thus even though Fe3+
and Mn3+
have equivalent ionic radii
the magnetic interaction is affected by the substitution [3,4].
Material was synthesized by doping Manganese (Mn) in different ratios (x = 0,
0.05, 0.1, 0.2 and 0.3) by rapid phase sintering solid state reaction method. Doping
was made at B-site to replace Fe3+
cations. Different properties as XRD, SEM,
dielectric constant, P-E, MH and MT loops were measured to explore the doping
effect of Mn in the material. Properties are discussed in detail hereafter.
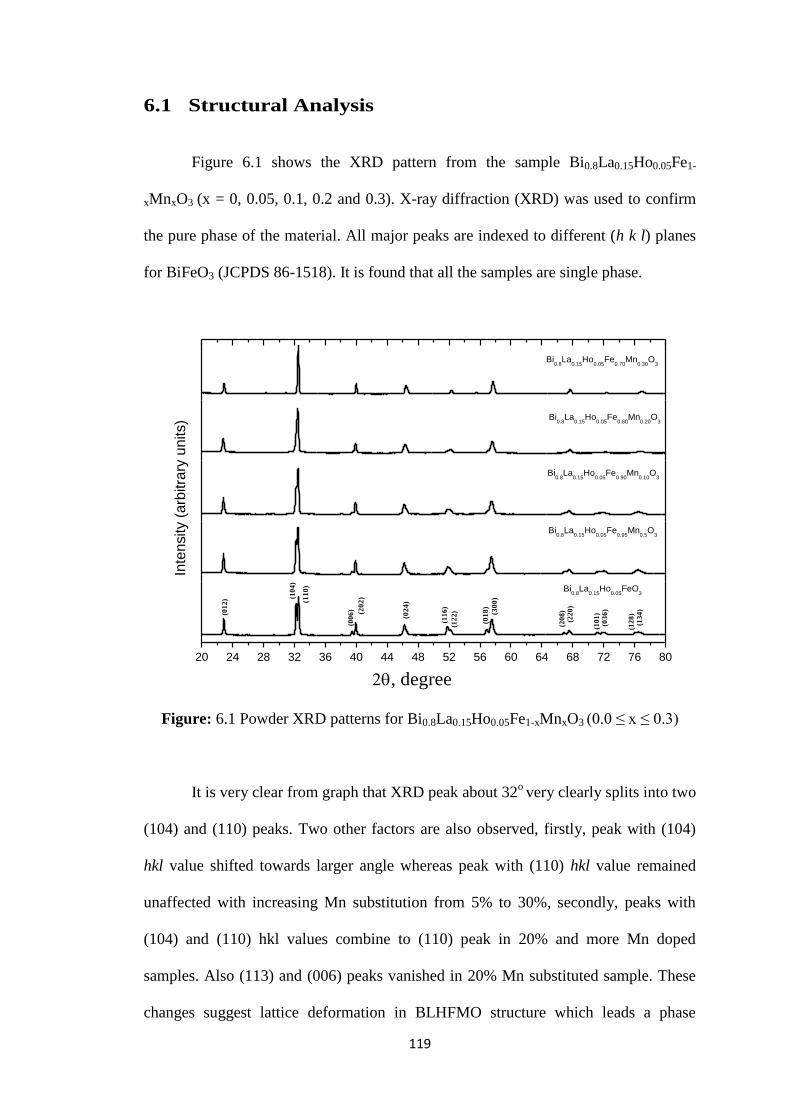
119
6.1 Structural Analysis
Figure 6.1 shows the XRD pattern from the sample Bi0.8La0.15Ho0.05Fe1-
xMnxO3 (x = 0, 0.05, 0.1, 0.2 and 0.3). X-ray diffraction (XRD) was used to confirm
the pure phase of the material. All major peaks are indexed to different (h k l) planes
for BiFeO3 (JCPDS 86-1518). It is found that all the samples are single phase.
20 24 28 32 36 40 44 48 52 56 60 64 68 72 76 80
(01
2)
(13
4)
(12
8)
(03
6)
(10
1)
(22
0)
(20
8)(3
00
)
(01
8)
(12
2)
(11
6)
(02
4)
(20
2)
(00
6)
(11
0)
(10
4)
, degree
Bi0.8
La0.15
Ho0.05
FeO3
Bi0.8
La0.15
Ho0.05
Fe0.95
Mn0.5
O3
In
tensity (
arb
itra
ry u
nits)
Bi0.8
La0.15
Ho0.05
Fe0.90
Mn0.10
O3
Bi0.8
La0.15
Ho0.05
Fe0.80
Mn0.20
O3
Bi0.8
La0.15
Ho0.05
Fe0.70
Mn0.30
O3
Figure: 6.1 Powder XRD patterns for Bi0.8La0.15Ho0.05Fe1-xMnxO3 (0.0 ≤ x ≤ 0.3)
It is very clear from graph that XRD peak about 32o very clearly splits into two
(104) and (110) peaks. Two other factors are also observed, firstly, peak with (104)
hkl value shifted towards larger angle whereas peak with (110) hkl value remained
unaffected with increasing Mn substitution from 5% to 30%, secondly, peaks with
(104) and (110) hkl values combine to (110) peak in 20% and more Mn doped
samples. Also (113) and (006) peaks vanished in 20% Mn substituted sample. These
changes suggest lattice deformation in BLHFMO structure which leads a phase
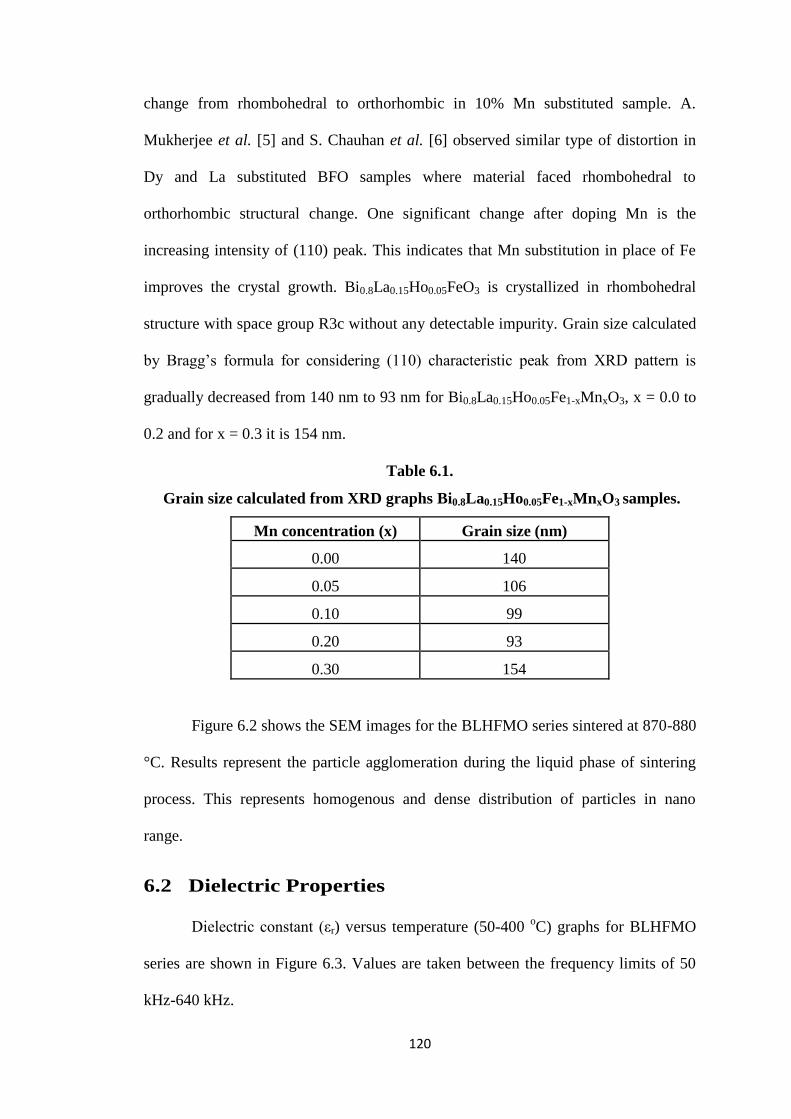
120
change from rhombohedral to orthorhombic in 10% Mn substituted sample. A.
Mukherjee et al. [5] and S. Chauhan et al. [6] observed similar type of distortion in
Dy and La substituted BFO samples where material faced rhombohedral to
orthorhombic structural change. One significant change after doping Mn is the
increasing intensity of (110) peak. This indicates that Mn substitution in place of Fe
improves the crystal growth. Bi0.8La0.15Ho0.05FeO3 is crystallized in rhombohedral
structure with space group R3c without any detectable impurity. Grain size calculated
by Bragg‟s formula for considering (110) characteristic peak from XRD pattern is
gradually decreased from 140 nm to 93 nm for Bi0.8La0.15Ho0.05Fe1-xMnxO3, x = 0.0 to
0.2 and for x = 0.3 it is 154 nm.
Table 6.1.
Grain size calculated from XRD graphs Bi0.8La0.15Ho0.05Fe1-xMnxO3 samples.
Mn concentration (x) Grain size (nm)
0.00 140
0.05 106
0.10 99
0.20 93
0.30 154
Figure 6.2 shows the SEM images for the BLHFMO series sintered at 870-880
°C. Results represent the particle agglomeration during the liquid phase of sintering
process. This represents homogenous and dense distribution of particles in nano
range.
6.2 Dielectric Properties
Dielectric constant (εr) versus temperature (50-400 oC) graphs for BLHFMO
series are shown in Figure 6.3. Values are taken between the frequency limits of 50
kHz-640 kHz.

121
Figure 6.2: SEM image for Bi0.8La0.15Ho0.05Fe1-xMnxO3 (a) x=0.0 (b) x=0.1 (c) x=0.3
(a)
(b)
(c)

122
It obviously shows that εr increases at any fixed frequency and temperature for
substitution of Mn in BLHFMO samples. Maximum value observed for εr is 14950.
This maximum value is obtained at 50 kHz frequency and 220 °C temperature.
Dielectric constant value at above mentioned temperature and frequency is 186 for
x=0.0 composition. So it is confirmed that εr value changes with temperature and
composition. The dielectric constant exhibits a step like increase with increase in
temperature. If temperature is fixed then it has highest value at smallest frequency
which is decreased with increasing frequency.
Such type of response can be explained according to process of dipole
relaxation. For small frequencies (∼50KHz), the dipoles have enough time to follow
the field applied whereas at large frequencies (∼0.6 MHz), they are unable to follow
the field and undergo relaxation.
Graph shown in Figure 6.3 exhibits peaks at 394-410 oC for
Bi0.8La0.15Ho0.05FeO3. These temperature versus εr graphs show peaks shift to higher
temperatures with increasing frequency. This type of response is an evidence of
existence of the thermally activated relaxation in the material. Similar response is also
seen for loss tangent (tanδ) in the complete temperature range from 50 °C to 400 °C.
Its value is found to vary from ~ 3×10⁻³
to ~ 589 at 50 kHz during above mentioned
temperature range. Increased conductivity in the sample is considered as the reason
for increase in loss tangent consistent with the literature [7-9].
Value for εr don‟t vary during certain temperature range starting from lower
temperature; this temperature gets decreased with increase in Mn doping. Moreover as
a result of Mn substitution main dielectric peaks are shifted toward lower temperature
and in the end a new transition is observed along with primary dielectric peak for
x=0.4 concentration. Anjum, Kumar and Yang et al. [8, 10-11] observed the similar
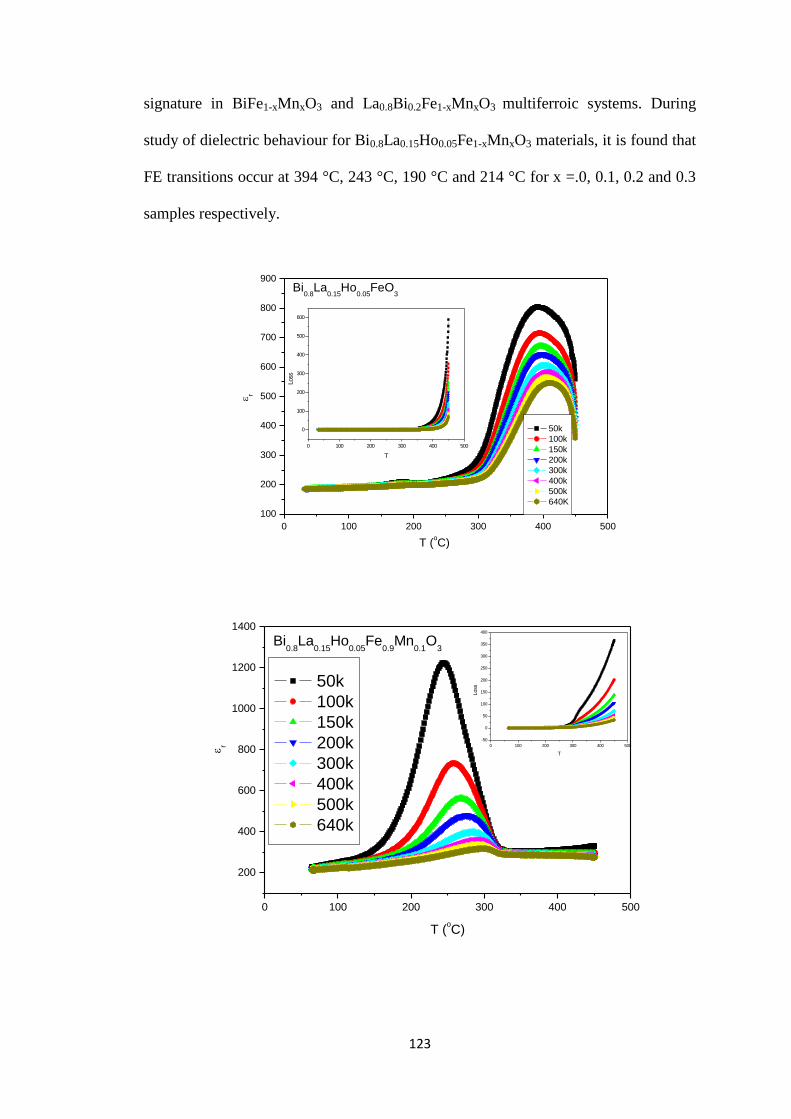
123
signature in BiFe1-xMnxO3 and La0.8Bi0.2Fe1-xMnxO3 multiferroic systems. During
study of dielectric behaviour for Bi0.8La0.15Ho0.05Fe1-xMnxO3 materials, it is found that
FE transitions occur at 394 °C, 243 °C, 190 °C and 214 °C for x =.0, 0.1, 0.2 and 0.3
samples respectively.
0 100 200 300 400 500
100
200
300
400
500
600
700
800
900
r
0 100 200 300 400 500
0
100
200
300
400
500
600
Loss
T
Bi0.8
La0.15
Ho0.05
FeO3
T (oC)
50k
100k
150k
200k
300k
400k
500k
640K
0 100 200 300 400 500
200
400
600
800
1000
1200
1400
r 0 100 200 300 400 500
-50
0
50
100
150
200
250
300
350
400
Loss
T
Bi0.8
La0.15
Ho0.05
Fe0.9
Mn0.1
O3
T (oC)
50k
100k
150k
200k
300k
400k
500k
640k

124
0 50 100 150 200 250 300 350
0
1000
2000
3000
4000
5000
r
0 50 100 150 200 250 300 350
-1000
0
1000
2000
3000
4000
5000
6000
7000
8000
Loss
T
Bi0.8
La0.15
Ho0.05
Fe0.8
Mn0.2
O3
T (oC)
50k
100k
150k
200k
300k
400k
500k
640k
0 100 200 300 400
2000
4000
6000
8000
10000
12000
14000
16000
r
0 100 200 300 400
0
100
200
300
400
500
600
Loss
T
Bi0.8
La0.15
Ho0.05
Fe0.7
Mn0.3
O3
T (oC)
50K
100K
150K
200K
300K
400K
500K
640K
Figure 6.3: Dielectric constant as a function of temperature at different frequencies
for Bi0.8La0.15Ho0.05Fe1-xMnxO3 (0.0 ≤ x ≤ 0.3). Inset shows the tanδ.
Transition peaks discussed above are well defined even at high frequency of
0.64 MHz. Slight shift in peak position towards higher temperature is observed with
change in frequency. If the ferroelectricity in the system is due to Maxwell-Wagner
effect, electrode or grain boundary effect then generally at higher frequencies,

125
transition peaks are not well defined. This effect also supports the reality that
dielectric behaviour is basically due to weak FE nature of these samples.
New peak observed about 350 oC for BLHFMO with x=0.4 concentration may
be linked with magnetic phase transition. As Neel temperature (TN) for BFO is about
370 oC, so this irregularity near antiferromagnetic (AFM) Neel temperature shows
coupling among magnetic and ferroelectric order parameters. Landau-Devonshire
theory of phase transition in magnetically ordered systems explains this dielectric
anomaly. According to theory such dielectric anomaly is expected as the effect of
diminishing of magnetic order over the electric order [12]. This prominent anomaly
can be very clearly observed near magnetic transition temperature in Figure 6.3.
Significant frequency dispersion for TN related to the peaks is also observed in the
graph. At any transition temperature, it moves from lower to higher temperature with
increasing frequency. This dispersion accompanies a corresponding decrease in peak
value of dielectric constant at TN resembling ferroelectric relaxor behaviour [13, 14].
Considering dielectric loss (inset of Figure 6.3), it shows similar behaviour as
like dielectric constant. It also exhibits loss peaks according to the transition curves
shown in dielectric constant versus temperature graphs.
Minor shift in peak position with increasing frequency represents relaxor
behaviour in materials. In general, at any frequency and temperature, overall increase
in dielectric loss is observed for Mn-substituted samples which are considered due to
increase in dc conductivity by substitution of Mn in the material.
6.3 Magnetic Properties
Figure 6.4 presents the change in magnetic moment with reference to
temperature (5-300 K) for different samples under both field-cooled (FC) and zero-
field-cooled (ZFC) conditions with an applied field of 1000 Oe.

126
0 50 100 150 200 250 300
0
20
40
60
80
100
Temperature (K)
M(e
mu
/mo
le)
ZFC
Bi0.8
La0.15
Ho0.05
FeO3
FC
0 50 100 150 200 250 300
0
20
40
60
80
100
120
140 ZFC Bi
0.8La
0.15Ho
0.05Fe
0.9Mn
0.1O
3
Temperature (K)
M(e
mu
/mo
le)
FC
127
0 50 100 150 200 250 300
0
10
20
30
40
50
60
70
Temperature (K)
ZFC
M(e
mu
/mo
le)
Bi0.8
La0.15
Ho0.05
Fe0.7
Mn0.3
O3
FC
Figure 6.4: M-T hysteresis loops for Bi0.8La0.15Ho0.05Fe1-xMnxO3 (0.0 ≤ x ≤ 0.3)
Table 6.1 gives the values of magnetization at 5 K for different samples. A
significant increase in magnetic moment for the said materials is observed with
substitution of Mn. BiFeO3 behaves as an antiferromagnetic material because in it,
iron ion‟s spin is arranged in (111) direction. Possibly, there may be two reasons for
the origin and increase in spontaneous magnetization: one, when the size of particles
is reduced to about 62 nm then periodicity of the spin cycloid structure can be broken.
Second, Mn and Fe have different magnetic moments, so development of local
ferrimagnetic spin configuration can be supposed by replacement of iron atoms with
manganese at B site [15-16]. The prospective reasons for increase in macroscopic
magnetization can be underlying inhomogeneous spin structure, increase in canting
angle due to co-doping and creation of Fe2+
ions. It is also well known that during
high temperature annealing process, coexistence of Fe2+
and Fe3+
is inevitable [17].
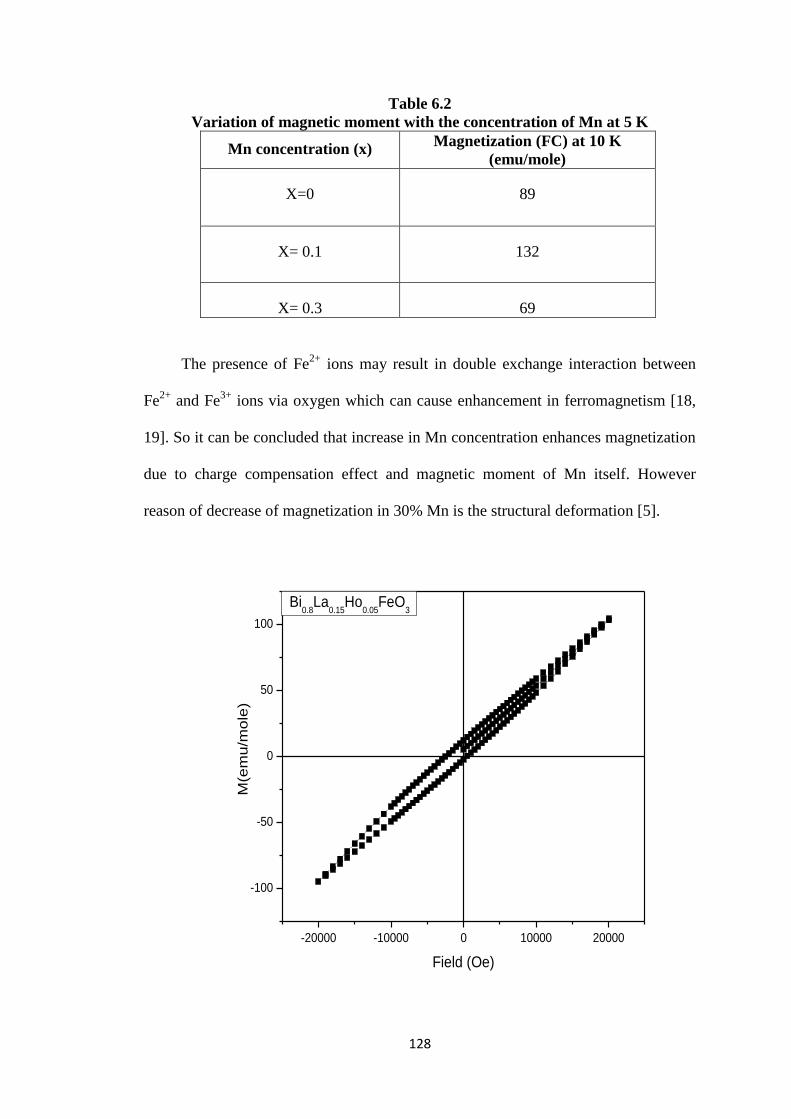
128
Table 6.2
Variation of magnetic moment with the concentration of Mn at 5 K
Mn concentration (x) Magnetization (FC) at 10 K
(emu/mole)
X=0 89
X= 0.1 132
X= 0.3 69
The presence of Fe2+
ions may result in double exchange interaction between
Fe2+
and Fe3+
ions via oxygen which can cause enhancement in ferromagnetism [18,
19]. So it can be concluded that increase in Mn concentration enhances magnetization
due to charge compensation effect and magnetic moment of Mn itself. However
reason of decrease of magnetization in 30% Mn is the structural deformation [5].
-20000 -10000 0 10000 20000
-100
-50
0
50
100
Field (Oe)
M(e
mu
/mo
le)
Bi0.8
La0.15
Ho0.05
FeO3

129
-20000 -10000 0 10000 20000
-150
-100
-50
0
50
100
150
M(e
mu
/mo
le)
Field (Oe)
Bi0.8
La0.15
Ho0.05
Fe0.9
Mn0.1
O3
-20000 -10000 0 10000 20000
-150
-100
-50
0
50
100
150
M(e
mu
/mo
le)
Field (Oe)
Bi0.8
La0.15
Ho0.05
Fe0.7
Mn0.3
O3
Figure 6.5: Room temperature M-H hysteresis loops for Bi0.8La0.15Ho0.05Fe1-xMnxO3
(0.0 ≤ x ≤ 0.3)
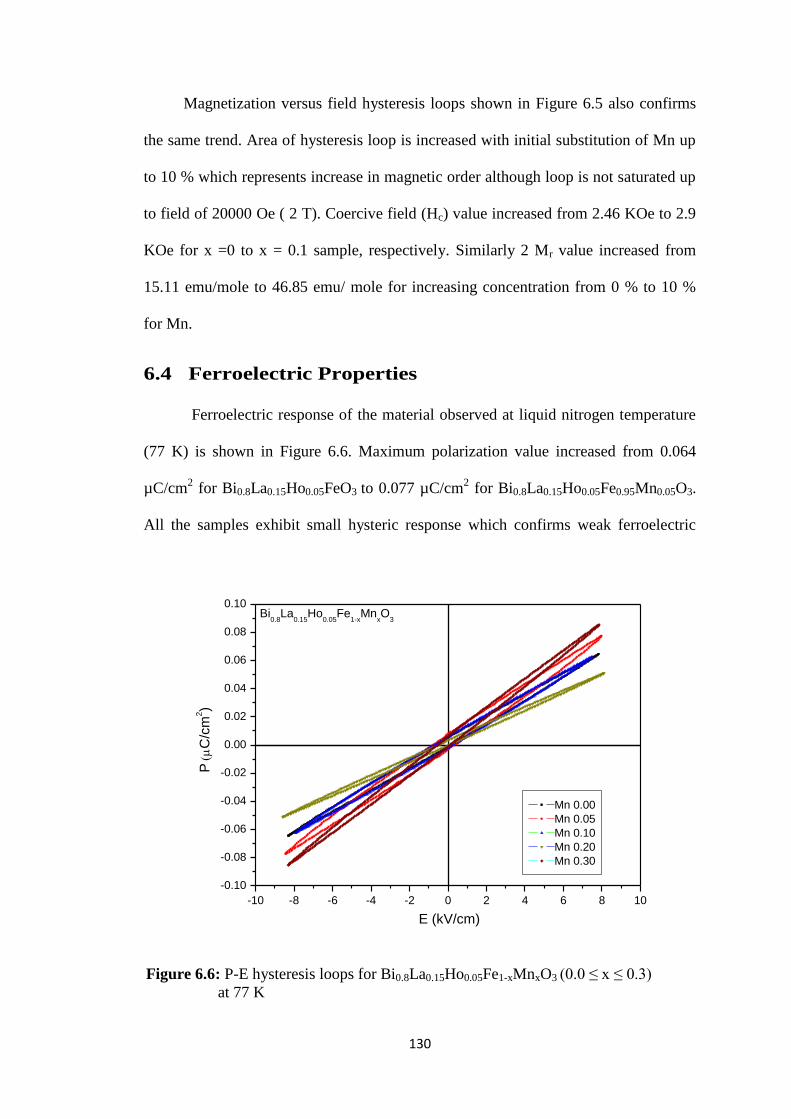
130
Magnetization versus field hysteresis loops shown in Figure 6.5 also confirms
the same trend. Area of hysteresis loop is increased with initial substitution of Mn up
to 10 % which represents increase in magnetic order although loop is not saturated up
to field of 20000 Oe ( 2 T). Coercive field (Hc) value increased from 2.46 KOe to 2.9
KOe for x =0 to x = 0.1 sample, respectively. Similarly 2 Mr value increased from
15.11 emu/mole to 46.85 emu/ mole for increasing concentration from 0 % to 10 %
for Mn.
6.4 Ferroelectric Properties
Ferroelectric response of the material observed at liquid nitrogen temperature
(77 K) is shown in Figure 6.6. Maximum polarization value increased from 0.064
µC/cm2 for Bi0.8La0.15Ho0.05FeO3 to 0.077 µC/cm
2 for Bi0.8La0.15Ho0.05Fe0.95Mn0.05O3.
All the samples exhibit small hysteric response which confirms weak ferroelectric
Figure 6.6: P-E hysteresis loops for Bi0.8La0.15Ho0.05Fe1-xMnxO3 (0.0 ≤ x ≤ 0.3)
at 77 K
-10 -8 -6 -4 -2 0 2 4 6 8 10
-0.10
-0.08
-0.06
-0.04
-0.02
0.00
0.02
0.04
0.06
0.08
0.10
Bi0.8
La0.15
Ho0.05
Fe1-x
MnxO
3
PC
/cm
2)
E (kV/cm)
Mn 0.00
Mn 0.05
Mn 0.10
Mn 0.20
Mn 0.30
131
behaviour of the material. Maximum and remnant polarization values initially
increase for Mn=0.05 and decreasing trend is observed for higher concentrations.
Finally maximum values are obtained for x=0.30 sample.
6.5 Summary
Single phase Bi0.8La0.15Ho0.05Fe1-xMnxO3 (x = 0, 0.05, 0.1, 0.2 and 0.3)
samples were prepared by conventional solid state reaction method. Rhombohedral to
orthorhombic phase transition was observed for x ≥ 0.2 samples. Increased value of
dielectric constant was obtained with Mn doping in the material. The temperature
dependant peaks observed in dielectric response of different samples demonstrate
ferroelectric phase transition. Transition temperature is decreased with increasing
ratio of Mn contents. Mn substitution also enhanced the magnetization in the material.
Double exchange interaction due to different oxidation states of Fe as a consequence
of oxygen vacancies and magnetic moment of Mn are considered the reason behind
this enhancement. Structural phase transition is considered as the reason for decrease
of magnetization in x=0.3 sample. P-E loops show weak ferroelectric behaviour of the
material.

132
References
[1] Y Liu, J Qi, Y Zhang, Y Wang, M Feng, J Zhang, M Wei, J Yang, Applied
Surface Science, 427, 745 (2018)
[2] J. Zhu, W.B. Luo, Y.R. Li, Applied Surface Science, 255, 3466 (2008).
[3] R.D. Shannon, Acta Crystallographica, A 32, 751 (1976).
[4] M. Bakr Mohamed, H. Fuess, Journal of Magnetism and Magnetic Materials, 323,
2090 (2011)
[5] A. Mukherjee, M. Banerjee, S. Basu, N.T.K. Thanh, L.A.W. Green, M. Pal,
Physica B, 448,199 (2014).
[6] S. Chauhan, M. Kumar, S. Chhoker, S.C. Katyal, H. Singh, M. Jewariya, K.L.
Yadav, Solid State Communications, 152, 525 (2012).
[7] G. Anjum, S. Mollah, D.K. Shukla, R. Kumar, Materials Letters, 64, 2003 (2010).
[8] G. Anjum, R. Kumar, S. Mollah, D. K. Shukla, S. Kumar, C. G. Lee, Journal of
Applied Physics, 107, 103916 (2010).
[9] C.C. Wang, Y.M. Cui, L.W. Zhang, Applied Physics Letters, 90, 012904 (2007).
[10] M. Kumar, K. L. Yadav, Applied Physics Letters, 91, 242901 (2007).
[11] C. H. Yang, T. Y. Koo, Y. H. Jeong, Solid State Communications, 134, 299
(2005).
[12] W. Eerenstein, N.D. Mathur, J.F. Scott, Nature, 442, 759 (2006).
[13] A. Singh, V. Panday, R.K. Kotnala, D. Panday, Physical Review Letters, 101,
247602 (2008).
[14] S. Bhattacharjee, V. Panday, R.K. Kotnala, D. Panday, Applied Physics Letters,
94, 012906 (2009).
[15] T.-J. Park, G.C. Papaefthymiou, A.J. Viescas, A.R. Moodenbough, S.S. Wong,
Nano Letters, 7, 766 (2007).

133
[16] S. Basu, SK. M. Hossain, D. Chakravorty, M. Pal, Current Applied Physics, 11,
976 (2011).
[17] Y. Wang, Q.H. Jiang, H.C. He, C.W. Nan, Applied Physics Letters, 88, 142503
(2006).
[18] J. Wang, A. Scholl, H. Zheng, S.B. Ogale et al., Science, 307, 1203b (2005).
[19] F. Huang, X. Lu, W. Lin, X. Wu, Y. Kan, J. Zhu, Applied Physics Letters, 89,
242914 (2006).

134
Chapter No. 7
General Conclusion and Future Work

135
General Conclusion
The thesis focuses on to develop, explore and increase the multiferroic
properties of different perovskite materials. In this regard, Cr and K doped LaFeO3
and co-doped BiFeO3 perovskite material, were successfully prepared.
In this work LaFeO3 AFM material was focused and with Cr substitution at B-
site its multiferroic properties were explored. Single phase Cr substituted LaFe1-
xCrxO3 compounds were successfully prepared by sol-gel method and found that
gradual substitution of Cr has no effect on the structure. On Cr substitution, the drastic
change observed in dielectric behaviour is attributed to a phase transition from
antiferromagnetic to paramagnetic above room temperature. The Cr substitution
results in decrease of Neel temperature which may be caused by the intrinsic
contribution by the activation of domain walls. Ferroelectric P-E curves show
paraelectric behaviour in doped samples with small ferroelectric response at 77 K.
Activation energy values calculated from DC electrical resistivity data reflects a p-
type polaronic conduction in the system above room temperature. MH and MT loops
confirmed the weak FM nature of the compound. Magnetism was enhanced by
gradual substitution of Cr. Negative shift in HC in MH loops confirmed the presence
of exchange biased phenomenon in the material. Further core/shell structure where
particles have FM like shell and AFM type core were assumed to be the cause of
weak FM response of the material.
To enhance the multiferroic properties of LaFeO3, samples with aliovalent
doping of K at A site were prepared. It is concluded that La1-xKxFeO3 (x≤0.5) belongs
to orthorhombic structure and gradual substitution of K+ having bigger ionic radii
does not affect the structure. Temperature dependent dielectric constant has well
defined peaks with values of order of 102 which are supposed due to ferroelectric
nature of the material. Non-centrosymmetry due to substitution of K+ results in slight
136
increase in ferroelectric behaviour of the material. Charge disproportion caused due to
different oxidation state of K+ and La
3+, change in oxidation state from Fe
3+ to Fe
4+ is
the cause of enhancement of magnetic properties. Spin glass behaviour can be
expected in the material as indicated by a small cusp in the graph. Moreover
core/shell model is used to explain the increase in magnetization.
Due to interesting physics exhibited by the BiFeO3 compound and being only
material having both magnetic and ferroelectric properties above room temperature,
this material was focused to improve its properties by co-doping. Single phase
Bi0.8La0.15Ho0.05Fe1-xMnxO3 (x = 0, 0.05, 0.1, 0.2 and 0.3) samples were prepared by
conventional solid state reaction method. Rhombohedral to orthorhombic phase
transition was observed for x ≥ 0.2 samples. Increased value of dielectric constant was
obtained with Mn doping in the material. The temperature dependant peaks observed
in dielectric response of different samples demonstrate ferroelectric phase transition.
Transition temperature is decreased with increasing ratio of Mn contents. Mn
substitution also enhanced the magnetization in the material. Double exchange
interaction due to different oxidation states of Fe as a consequence of oxygen
vacancies and magnetic moment of Mn are considered the reason behind this
enhancement. Structural phase transition is considered as the reason for decrease of
magnetization in x=0.3 sample. P-E loops show weak ferroelectric behaviour of the
material.
Future Work
As significant improvement in electrical and magnetic properties of LaFeO3 is
observed by K+ and Cr
3+ substitutions; similarly co-doping both at A and B site
improved magnetic properties of BiFeO3. So substitution of other cations with same

137
or different oxidation states at both cationic sites may be useful to further enhance
these properties.
The dielectric data for the synthesized samples was analyzed at and above
room temperature. Low temperature measurements may be useful to observe the
electric response from grains by locking various scattering processes. Similarly to
analyze the ferroelectric behaviour of the material by observing P-E loops, highly
resistive samples may be synthesized. As multiferroic properties depend on the
morphology of the materials; so growing these samples in single crystal and thin film
form may significantly improve the multiferroic properties.