ba3b and ba1 activate in a serial fashion after median ... · ba3b and ba1 activate in a serial...
TRANSCRIPT
NeuroImage 54 (2011) 60–73
Contents lists available at ScienceDirect
NeuroImage
j ourna l homepage: www.e lsev ie r.com/ locate /yn img
BA3b and BA1 activate in a serial fashion after median nerve stimulation: Directevidence from combining source analysis of evoked fields and cytoarchitectonicprobabilistic maps
Christos Papadelis a,b,⁎, Simon B. Eickhoff c,d,e, Karl Zilles c, Andreas A. Ioannides a,f
a Laboratory for Human Brain Dynamics, Brain Science Institute (BSI), RIKEN, Saitama, Japanb Laboratory of Functional Neuroimaging (LNiF), Center for Mind/Brain Sciences (CIMeC), University of Trento, TN, Italyc Institut für Neurowissenschaften und Medizin (INM-2), Forschungszentrum Jülich, Jülich, Germanyd Klinik für Psychiatrie und Psychotherapie, Universitätsklinikum RWTH Aachen, Aachen, Germanye Jülich-Aachen Research Alliance (JARA-Brain), Jülich, Germanyf Laboratory for Human Brain Dynamics, AAI Scientific Cultural Services Ltd., Nicosia, Cyprus
Abbreviations: BA1, Brodmann area 1; BA3b, Brodmcurrent dipole; ECG, Electrocardiogram; EEG, Electroenoculogram; fMRI, Functional magnetic resonance imagIndependent component analysis; ITS, Intertrial synchroerror; MEG, Magnetoencephalography; MFT, MagnMontreal Neurological Institute; MTH, Motor thresholditectonic maps; PET, Positron emission tomography; S1SEF, Somatosensory evoked field; SEP, Somatosensorynoise-ratio; ST, Single trial; STH, Sensory threshold; V1,⁎ Corresponding author. Center for Mind/Brain Sci
Functional Neuroimaging (LNiF), Via delle Regole 101Fax: +39 0461 882521.
E-mail address: [email protected] (C. Papa
1053-8119/$ – see front matter © 2010 Elsevier Inc. Adoi:10.1016/j.neuroimage.2010.07.054
a b s t r a c t
a r t i c l e i n f oArticle history:Received 6 April 2010Revised 20 July 2010Accepted 25 July 2010Available online 4 August 2010
Keywords:Somatosensory evoked fieldsSerial processingMedian nerveCytoarchitectonic probabilistic maps
This study combines source analysis imaging data for early somatosensory processing and the probabilisticcytoarchitectonicmaps (PCMs). Human somatosensory evoked fields (SEFs) were recorded by stimulating leftand right median nerves. Filtering the recorded responses in different frequency ranges identified the mostresponsive frequency band. The short-latency averaged SEFs were analyzed using a single equivalent currentdipole (ECD) model and magnetic field tomography (MFT). The identified foci of activity were superimposedwith PCMs. Two major components of opposite polarity were prominent around 21 and 31 ms. A weakcomponent around 25 ms was also identified. For the most responsive frequency band (50–150 Hz) ECD andMFT revealed one focal source at the contralateral Brodmann area 3b (BA3b) at the peak of N20. Thecomponent ~25 ms was localised in Brodmann area 1 (BA1) in 50–150 Hz. By using ECD, focal generatorsaround 28–30 ms located initially in BA3b and 2 ms later to BA1. MFT also revealed two focal sources— one inBA3b and one in BA1 for these latencies. Our results provide direct evidence that the earliest cortical responseafter median nerve stimulation is generated within the contralateral BA3b. BA1 activation few millisecondslater indicates a serial mode of somatosensory processing within cytoarchitectonic SI subdivisions. Analysis ofnon-invasive magnetoencephalography (MEG) data and the use of PCMs allow unambiguous and quantitative(probabilistic) interpretation of cytoarchitectonic identity of activated areas following median nervestimulation, even with the simple ECD model, but only when the model fits the data extremely well.
ann area 3b; ECD, Equivalentcephalography; EOG, Electro-ing; GOF, Goodness of fit; ICA,nization index; LE, Localisationetic field tomography; MNI,; PCMs, Probabilistic cytoarch-, Primary somatosensory area;evoked potential; SNR, Signal-Primary visual area.ences (CIMeC), Laboratory of, 38100 Mattarello (TN), Italy.
delis).
ll rights reserved.
© 2010 Elsevier Inc. All rights reserved.
Introduction
The somatosensory evoked responses have long been used in thestudy of physiology and pathophysiology of the human somatosen-sory system. They represent measurements of brain activity elicited
by stimulation of peripheral nerves, and can be recorded noninva-sively using either electroencephalography (EEG) or magnetoence-phalography (MEG) that provide a millisecond temporal resolution.Bipolar transcutaneous electrical stimuli, that are technically lessdemanding than vibratory or tactile stimuli, are usually applied on theskin over the trajectory of the median nerve producing strong andwell-defined MEG and EEG waveforms. The putative superiority ofMEG to EEG is largely based on MEG being practically unaffected bythe detailed structure and conductivity of the skull and scalp.
The recorded SEFs following median nerve stimulation aregenerally classified by their post-stimulus latencies, as short-latencyresponses (less than 40 ms after stimulus onset), and long-latencyresponses (40–300 ms after stimulus onset). The morphology of theshort-latency SEFs has been consistently reported as two prominentpeaks of opposite polarity, one around 20±1 ms (N20) and thesecond at 32±3 ms (P30) (Hari et al., 1984; Kawamura et al., 1996;Mauguière et al., 1997 Mima et al., 1998; Rossini et al., 1996; Tecchioet al., 1997). Secondary, masked, short-latency responses have been

61C. Papadelis et al. / NeuroImage 54 (2011) 60–73
observed at 25 ms (P25) and 35 ms after subtracting the neuralactivity that is responsible for the two prominent components N20and P30 from the recorded waveforms (Inui et al., 2004).
In addition to the millisecond temporal resolution that allows us toexplore the timing of basic neural processes at the level of cellassemblies, MEG offers a very good localisation accuracy of a fewmillimeters especially for superficial cortical sources such as thoselocated in the primary somatosensory cortex. It has thus beensuccessfully used for the localisation of neural sources activated duringsomatosensory processing after median nerve stimulation (Inui et al.,2004; Kakigi, 1994; Kawamura et al., 1996; Tecchio et al., 2000; Tiihonenet al., 1989). The good localisation accuracy of MEG has been confirmedby realistically head-shaped phantom studies (Leahy et al., 1998;Papadelis et al., 2009). In these studies, superficial sourceswere localisedwith an accuracy of 2–3 mm by using different inverse methods.
The anatomic generators of short-latency human somatosensoryresponses have been the subject of considerable debate. Although thereis a general agreement that some portion of the spatio-temporal SEFsoriginates in the somatosensory cortex on the postcentral gyrus, there isdisagreement about the specific regions involved. The earliest corticalresponse component after median nerve stimulation (N20) is consid-ered tobegenerated in area3b contralateral to the stimulated armbasedon itsmacroanatomical location (Allison et al., 1989; Baumgartner et al.,1991; Buchner et al., 1994; Hari et al., 1984;Wood et al., 1985). Corticalsurface and laminar recordings inmacacamonkeys support further thisnotion (McCarthy et al., 1991). The origin of the following restrictedreflection P25 is debated. It is generally considered to be located in BA1(Inui et al., 2004; Kakigi, 1994), though other studies considered it ofprecentral (motor cortical) originbecause the sources are typicallymoreanterior compared toN20(Kawamura et al., 1996; Tiihonenet al., 1989).Huttunen (1997), however, argued that this finding resulted from amodeling error rather than from an additional generator in theprecentral motor cortex. The P30 component seems to be generatedin the contralateral SI (Wikström et al., 1996), most probably reflectingearly inhibitory postsynaptic potentials, while more recent reportslocate it in BA3b (Inui et al., 2004). It is important to stress that theresults from these earlier human studies were reached on the basis ofgross landmarks and expectations derived from invasive recordings inanimals (McCarthy et al., 1991).
Spatial normalization of individual anatomical images and follow upreference to a common anatomical space such as the MNI referencesystem (Evans et al., 1992) is practiced widely despite its approximatenature because of considerable intersubject variability and absence of agenuinemicrostructural foundation on the examined subjects (Eickhoffet al., 2005). Alternatively, the use of macroanatomical landmarksprovides in some cases a reliable framework for establishing structure–function relationships (Amiez andPetrides, 2009;Dumoulin et al., 2000;Tootell et al., 1995; Zeki et al., 1991). Reference to macroanatomicallandmarks, however, is not quantitative and for the borders of mostcortical areas there are simply no such landmarks, because the sulcaland gyral pattern is highly variable across subjects (Amunts et al., 1999,2000; Amunts and Zilles, 2001). Only in the visual system preciseretinotopic mapping provides a reliable and quantitative guide ofcytoarchitectonic identity of areas (cf. Wilms et al., 2005, 2010), asalready exploited in many fMRI studies and our earlier study of MEG/fMRI localisation accuracy (Moradi et al., 2003).
A quantitative cytoarchitectonic reference for regionally specificactivations observed in functional imaging studies is provided bymicrostructurally defined areas (Bodegård et al., 2000, 2003; Amunts etal., 2004; Eickhoff et al., 2005, 2007, 2008; Wohlschläger et al., 2005;Zilles andAmunts 2010). PCMs provide thismicrostructural stereotacticinformation onMNI reference spacewhile allowing for the variability ofcortical areas across subjects (Amunts and Zilles, 2001; Mohlberg et al.,2003; Zilles et al., 2002). This approach provides characterization atspecific location while overcoming many of the problems of classicalcytoarchitectonic maps (e.g., Brodmann, 1909; Zilles and Amunts,
2010). Such maps have been published for various brain regions,including the primary (Geyer et al., 1999, 2000; Grefkes et al., 2001) andsecondary (Eickhoff et al., 2006a,b) somatosensory cortex. The PCMs arebased on the observer independent analysis of the cytoarchitecture in asample of tenhumanpost-mortembrains (Schleicher et al., 2005). In thelast few years, PCMs have been successfully applied in functionalimaging studies usingpositron emission tomography (PET) (Geyer et al.,1996, 2001;Horwitz et al., 2003; Younget al., 2003), functionalmagneticresonance imaging (fMRI) (Amunts et al., 2004; Binkofski et al., 2000;Bodegård et al., 2000, 2003; Eickhoff et al., 2006b, 2008; Heim et al.,2005; Jakobs et al., 2009;Wohlschläger et al., 2005), andMEG (Barnikolet al., 2006; Dammers et al., 2007; Prieto et al., 2007). These applicationsnot only demonstrated the feasibility of the probabilistic integration ofanatomical and functional data but moreover demonstrated theadditional level of structure–function inference permitted by it.
The main goal of this study is to relate focal generators identified inthe localisation analysis of short-latency SEFs to the cytoarchitectonicorganization of the somatosensory cortex as described by the PCMs. Thestudy is confined to the analysis of averaged MEG data, filtered indifferent frequency bands. SEFs elicited by median nerve stimulationwere recorded in humans. The single ECD was used for modeling theaveraged data, since it is widely used and produces good fits to theaverage data when a single focal generator is primarily responsible forthe generation of the MEG signal (Papadelis et al., 2009). The identifiedfoci of activity were transformed onto the MNI space and then weresuperimposed with cytoarchitectonic probability maps. It was hypoth-esized that the cortically evoked responses will involve excitation ofwell-defined cytoarchitectonic areas and would thus lead to focalactivations. We assumed that in general the activity in differentcytoarchitectonic areas may overlap in time, but in some time-pointsthe activity from one of these areas would dominate. At these time-points, the goodness of fit (GOF) of instantaneous ECD estimates ofcortical activitieswould be high, and the probabilistic assignment of thecytoarchitectonic area would have high probability to be in one of themain cytoarchitectonic areas. In order to verify the source localisationresults based on dipole source analysis, MFT (Ioannides et al., 1990), atomographic imaging approach, was also applied. The MFT algorithmuses optimally information from the MEG sensors around the headrelying minimally on a priori assumptions about the nature of thegenerators. From the theoretical point of view, it was shown to localisedistributed sources and allow for sharp changes in the distributiondensity so that focal generators can be accommodated (Taylor et al.,1999); at the practical level it was also demonstrated in numerousapplications that MFT can deal effectively with both diffuse and focalcurrent densities in the brain (Ioannides 1995, 2006). It thereforefollows that at latencies corresponding to poor ECD solutions, MFTsolutions will be either more spread or the activity will be presentsimultaneously in different cytoarchitectonic areas. In contrast at thetime-points when ECD gives a good fit to the data and MFT identifies afocal solution (coinciding with the ECD location) the identifiedgenerator is likely to correspond to activation of a single cytoarchitec-tonic area. Someof the earlyMFT studies, usingMEGdata fromonly partof theheadhave suggested that theECDsolutionsare likely tobe reliableif the MEG data are fitted with a goodness of fit of 0.97 or higher(Ioannides et al., 1990, 1993a,b). The question to be addressed in thispaper is how this translates to the better quality data frommodern full-headMEG systemsandwhether or not anaccurate ECDestimatewhenasingle focal generator is present is reflected in a higher probability forone cytoarchitectonic area in the PCM.
Material and methods
Subjects and measurements
Six healthy right-handed subjects (five males and one female; age:30.83±6.58 years) participated in a somatosensory experiment. Ethical

62 C. Papadelis et al. / NeuroImage 54 (2011) 60–73
committee approval was obtained from the RIKEN Ethics Committeeand subjects gavewritten informed consent before the experiment. Themedian nerve was electrically stimulated transcutaneously on the rightand left wrists. Two electrodes (cathode proximal) were connecteddirectly to the photoelectric stimulus isolation unit of our electricalstimulator (Grass Model S8800). Before the experiment, the motorthreshold (MTH, the minimal stimulus intensity required to producethumb movement), and the sensory threshold (STH, the minimalstimulus intensity corresponding to the level at which the subject wasjust able to feel a train of stimulus pulses, repeated four times) weredetermined for each wrist. MTH and STH stimuli were 6.8±2.1 mA(mean±S.D.) and 2.3±1.9 mA respectively. During the experiment,the subjectwas comfortably seated under theMEG helmet keeping his/her head still. The arms were well covered to prevent coolingthroughout the recording session. Constant current stimuli with aduration of 0.2 ms, and pseudo-randomized inter-stimulus interval of600±100 mswere used. Four data runswere collected for each subject,with 120 stimuli delivered in each run. The stimuliwere delivered to theright wrist in two runs and to the left in the other two. The stimulusintensity was M = MTH + 0:25⋅Δ, where Δ = MTH−STH (Ioannideset al., 2002), sufficient to provoke a painless thumb twitch. A groundbandwas placed round the forearm above the stimulating electrodes inorder tominimize the artifactualmagnetic fields caused by the stimuluscurrent. The subjects kept their eyes open and fixated on a small crossduring the experiment.
SEFs were recorded using the CTF (VSMMedTech Ltd) whole headsystem (151 channels) at a sampling rate of 1250 Hz, together withthe vertical and horizontal electrooculogram (EOG), and electrocar-diogram (ECG). The CTF system uses radial gradiometers as primarysensors. Hardware filters were adjusted to band-pass the MEG signal,0–400 Hz. Standard CTF software was used offline to process the datadigitally by using a 3rd order gradient filter, a 50 Hz notch filter (andits harmonics), and by removing the DC.
SEFs data preprocessing and virtual channels
The recordedMEGsignalwasvisually inspected for possible artifacts.The INFOMAX algorithm (Lee et al., 1999) for independent component
Fig. 1. Time-frequency representation map for virtual channel estimated by SEFs (right wrisband (0–250 Hz). Left upper panel — the virtual channel was estimated at the peak of N20 bentering the head (three sensors here) and exiting the head (four sensors here). Right uppervirtual channel signal (in dB). Right lower panel — the time-frequency map (frequency ran
analysis (ICA) in conjunction with the EOG and ECG data was used toremove eye blink and cardiac artifacts. The recorded responses wereinitiallyfilteredoffline (butterworth, 4thorder) in the frequencybandof0–250 Hz (whole-band). The filtered 120 trials were then averaged foreach separate run from −20 to 100 ms relative to the stimulus onset.
A virtual channel was defined for each run from the contour map ofeach subject's averaged data showing the iso-magnetic field during theN20 peak (see Fig. 1, upper left panel). The virtual channel wasestimated by the difference between the MEG signals from sensorscovering the peakmagnetic flux entering the head and exiting the head.In general the reduced dimension of virtual channel is less sensitive tonoise that is uncorrelated among channels (Gross and Ioannides, 1999).This is due to the linear transformation, which is essentially a weightedaveraging of the original channel signals, so that uncorrelated noiseis reduced. For details of the definition of virtual channel and itsapplications see Liu et al (1998).
Signal-noise-ratio (SNR)
Two standard measures of reproducibility across trials, the signal-noise-ratio (SNR) and the intertrial synchronization index (ITS)(Laskaris et al., 2003), were calculated for the virtual channel ofeach run. Each of thesemeasures was computed for a moving windowthus providing a time-dependent quantification of the signal contentof the ensemble of single trials (STs). The SNR for this window isdefined as follows (Laskaris and Ioannides, 2001):
SNR= SPNP
;
where the SP = 1p ‖ x̄‖
2L2− 1
N NP is the signal power (SP) and the
NP =∑N
i=1‖ x̄−xi t;pð Þ‖2L2p N−1ð Þ is the noise power (NP) of the averaged signal
x̄ =∑N
i=1xi t;pð ÞN . The x̄ is the ensemble average ofN STpatterns, eachwithp
samples and time between samples t. The NP is the ensemble average ofST deviations from x̄, computed with the L2 norm. The SP is the noise-corrected L2 norm of x̄. The SNR can be thought of as the ratio of the
t stimulation, one subject, averaged data among the two runs) for the whole frequencyy the difference between the MEG signals from sensors covering the peak magnetic fluxpanel— the virtual channel (in fT). Left lower panel— the energy spectral density of thege from 0 to 250 Hz).

63C. Papadelis et al. / NeuroImage 54 (2011) 60–73
“energy” in the reproducible part of the signal divided by the “energy” ofthe residual signal across STs.
Time-frequency analysis
Time-frequency representation maps were estimated for the SEFsof each subject by computing the spectrogram distribution of thevirtual channel (averaged data between the two runs of each side).The spectrogram distribution corresponds to the squared modulus ofthe short-time Fourier transform:
Sx t; vð Þ = j∫+∞−∞
�x uð Þ⋅h⁎ u−tð Þe−j2πvuduj2
where h is the smoothing window function (here Hamming window),and x is the ensemble average of N ST patterns of the virtual channel.The analysis was performed in Matlab by using the Time-FrequencyToolbox (http://tftb.nongnu.org/). In most runs, the energy spectraldensity of the virtual channel signal for the early latency responses(during the first 100 ms after stimulus onset) separated into twocomponents. The first component was brief lasting only about 10–15 ms centered around 20 ms; this component showed the expectedsuppression of low rhythms (below 15 Hz) and had high energycontent in the frequency range from 50 to 150 Hz. The secondcomponent was stronger around 30–40 ms (extending from about 25to 90 ms) and it was dominated by low frequencies with little energyfor frequencies above 50 Hz (see Fig. 1).
Filtering
In order to increase the SNRof theMEG signal and hereby to improvethe accuracy of subsequent dipole localisation, we digitally filtered(butterworth, 4th order) the recorded responses offline in threedifferent frequency bands: (a) 0–50 Hz (low-band), (b) 50–150 Hz(medium-band), and (c) 150–250 Hz (high-band). The selection of thefrequency bands was based on the results of our time-frequencyanalysis and the unavoidable effect of the 50 Hz notch filter (and itsharmonics). Since our main interest was the short-latency responses tothe median nerve stimulation, we tried to improve the SNR within thistime window by filtering the data. The high-band was included in theanalysis in order to capture possible high-frequency oscillations thathave been previously observed to superimpose on the N20 componentin this frequencyband (Haueisen et al., 2001; Papadelis et al., 2009). Thefiltered data of each separate frequency band were then averaged foreach run from −20 to 100 ms relative to the stimulus onset.
Peak amplitudes and latencies were measured on the averagedMEG signals for each run and each frequency band including thewhole-band. The components that showed a latency with standarddeviation b4 ms and identified in at least three subjects were retainedfor further analysis.
The time-frequency analysis results suggest that for transitionswithin and close to SI for the early responses the frequency range from50 to 150 Hz provides the best view on early interchanges of activitybetween areas. By filtering the MEG data in this frequency band, wereduced both ambient field noise and brain activity that is uncorrelatedwith the stimulus. We thus increased the SNR of the recorded MEGsignal using the applied filters (see details later in the Results section).High values of SNR then allow better localisation of the underlyingneural sources (Moradi et al., 2003; Poghosyan and Ioannides 2008).
Source analysis
The single ECD model was used to analyze the averaged data. Thismethod allows the spatio-temporal modeling of neural sources overdefined intervals assuming that one focal source generates the observedmagnetic activity. The source is describedby an infinitesimally small line
element (Hämäläinen et al., 1993). The location, orientation, andmoment of the dipole were calculated by an iterative least-square fit.The GOF indicates the percentage of the data that can be explained bythemodel, andwas estimated asGOF (%)=100−Error. The Error value(%) was defined as follows:
Error %ð Þ = 100 ×∑N
i=1
Bi−B′j
� �2
Vari
N−Dð Þ
where Nwas the number of sensors, B the observed signal at sensor i,B′ the calculated signal at sensor i, Vari the variance, andD the numberof free parameters. We considered ECD models with error valueslower than 10%. The ECD modeling was performed at each timeslice(in steps of 0.8 ms) from 10 to 40 ms. To describe the headconductivity, the multiple local spheres model was used. It uses adifferent local sphere for each MEG sensor to fit the curvature of theinner skull surface just below the sensor. For the ECD analysis, thelatest version (Version 5.4.0 — linux-20061212) of the CTF (VSMMedTech Ltd, BC, Canada) software was used.
We usedMFT (Ioannides et al., 1990; Taylor et al., 1999) to obtain amore general description of the generators than what the ECD modelprovides. MFT relies on a non-linear algorithm with optimalproperties for tomographic analysis of the MEG signal so that thedetails in the data determine whether a solution is focal or not. MFTcomputes the 3D distribution of primary current density vectorsthroughout the brain at each timeslice (in our case every 0.8 ms). Inthe present study, MFT solutions were calculated for the averagedMEG data of each run at each timeslice from 10 to 40 ms. For the MFTanalysis, an in-house software was used.
Monte-Carlo simulations
In order to quantify the confidence regions of our ECD localisationresults, we estimated the confidence volume (ellipsoid) of the ECD fitsat the peak of N20 component for each run and each subject. Theconfidence volume was based on Monte-Carlo simulations and itscalculation was performed by the standard CTF software. Monte-Carlosimulations were performed only on the whole-band averaged data.As nominal dipole configuration was used the single dipole fit at thepeak of N20. Gaussian distributed noise with given variance wasadded to the MEG of each sensor i:
noisei = k⋅ffiffiffiffiffiffiffiffiVar
pi
where Vari is the variance of the MEG signal at sensor i, and k is arandom number from−0.5 to 0.5. Then a dipole fit was performed onthe noisy data. Because of the added noise, the resulting dipolesolution is slightly shifted relative to the localisation without theadded noise. This procedure was repeated 500 times, producing a‘dipole cloud’ for each case. For each dipole cloud, we computed thecenter of gravity of all points in the cloud, and determined anellipsoid, with origin the center of gravity, that encompass 95% of theestimated dipole points.
Simulation data
The ECD is expected to work well for superficial focal sources asthose that might be activated at early latencies during somatosensoryprocessing; at these latencies high values of GOF are expected.Conversely, high GOF values indicate that the MEG signal isdominated by the contribution from a single focal source; at thesetime-points, other possibly simultaneously active sources are eitheruncorrelated with the stimulus and thus reduced by averaging or theyare long-lasting and therefore more likely to overlap with compo-nents that have been removed by filtering.
64 C. Papadelis et al. / NeuroImage 54 (2011) 60–73
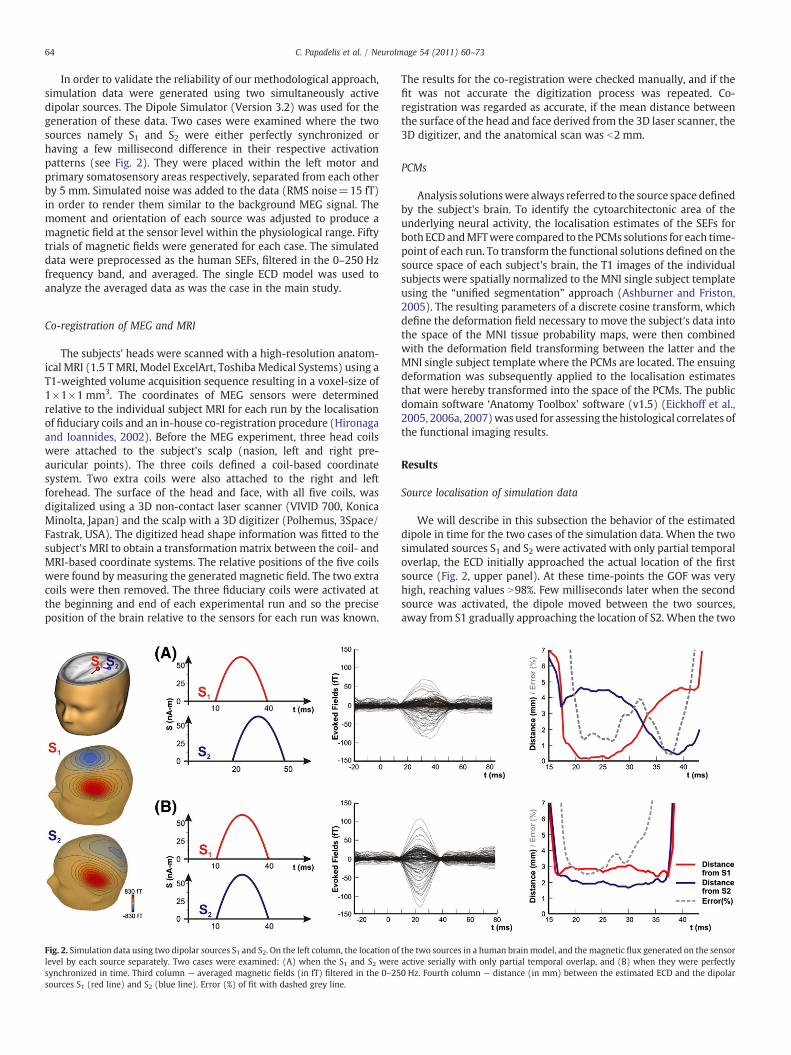
In order to validate the reliability of our methodological approach,simulation data were generated using two simultaneously activedipolar sources. The Dipole Simulator (Version 3.2) was used for thegeneration of these data. Two cases were examined where the twosources namely S1 and S2 were either perfectly synchronized orhaving a few millisecond difference in their respective activationpatterns (see Fig. 2). They were placed within the left motor andprimary somatosensory areas respectively, separated from each otherby 5 mm. Simulated noise was added to the data (RMS noise=15 fT)in order to render them similar to the background MEG signal. Themoment and orientation of each source was adjusted to produce amagnetic field at the sensor level within the physiological range. Fiftytrials of magnetic fields were generated for each case. The simulateddata were preprocessed as the human SEFs, filtered in the 0–250 Hzfrequency band, and averaged. The single ECD model was used toanalyze the averaged data as was the case in the main study.
Co-registration of MEG and MRI
The subjects' heads were scanned with a high-resolution anatom-ical MRI (1.5 T MRI, Model ExcelArt, ToshibaMedical Systems) using aT1-weighted volume acquisition sequence resulting in a voxel-size of1×1×1 mm3. The coordinates of MEG sensors were determinedrelative to the individual subject MRI for each run by the localisationof fiduciary coils and an in-house co-registration procedure (Hironagaand Ioannides, 2002). Before the MEG experiment, three head coilswere attached to the subject's scalp (nasion, left and right pre-auricular points). The three coils defined a coil-based coordinatesystem. Two extra coils were also attached to the right and leftforehead. The surface of the head and face, with all five coils, wasdigitalized using a 3D non-contact laser scanner (VIVID 700, KonicaMinolta, Japan) and the scalp with a 3D digitizer (Polhemus, 3Space/Fastrak, USA). The digitized head shape information was fitted to thesubject's MRI to obtain a transformation matrix between the coil- andMRI-based coordinate systems. The relative positions of the five coilswere found by measuring the generated magnetic field. The two extracoils were then removed. The three fiduciary coils were activated atthe beginning and end of each experimental run and so the preciseposition of the brain relative to the sensors for each run was known.
Fig. 2. Simulation data using two dipolar sources S1 and S2. On the left column, the location oflevel by each source separately. Two cases were examined: (A) when the S1 and S2 weresynchronized in time. Third column — averaged magnetic fields (in fT) filtered in the 0–25sources S1 (red line) and S2 (blue line). Error (%) of fit with dashed grey line.
The results for the co-registration were checked manually, and if thefit was not accurate the digitization process was repeated. Co-registration was regarded as accurate, if the mean distance betweenthe surface of the head and face derived from the 3D laser scanner, the3D digitizer, and the anatomical scan was b2 mm.
PCMs
Analysis solutionswere always referred to the source space definedby the subject's brain. To identify the cytoarchitectonic area of theunderlying neural activity, the localisation estimates of the SEFs forboth ECDandMFTwere compared to the PCMs solutions for each time-point of each run. To transform the functional solutions defined on thesource space of each subject's brain, the T1 images of the individualsubjects were spatially normalized to the MNI single subject templateusing the “unified segmentation” approach (Ashburner and Friston,2005). The resulting parameters of a discrete cosine transform, whichdefine the deformation field necessary to move the subject's data intothe space of the MNI tissue probability maps, were then combinedwith the deformation field transforming between the latter and theMNI single subject template where the PCMs are located. The ensuingdeformation was subsequently applied to the localisation estimatesthat were hereby transformed into the space of the PCMs. The publicdomain software ‘Anatomy Toolbox’ software (v1.5) (Eickhoff et al.,2005, 2006a, 2007)was used for assessing the histological correlates ofthe functional imaging results.
Results
Source localisation of simulation data
We will describe in this subsection the behavior of the estimateddipole in time for the two cases of the simulation data. When the twosimulated sources S1 and S2 were activated with only partial temporaloverlap, the ECD initially approached the actual location of the firstsource (Fig. 2, upper panel). At these time-points the GOF was veryhigh, reaching values N98%. Few milliseconds later when the secondsource was activated, the dipole moved between the two sources,away from S1 gradually approaching the location of S2. When the two
the two sources in a human brain model, and the magnetic flux generated on the sensoractive serially with only partial temporal overlap, and (B) when they were perfectly0 Hz. Fourth column — distance (in mm) between the estimated ECD and the dipolar
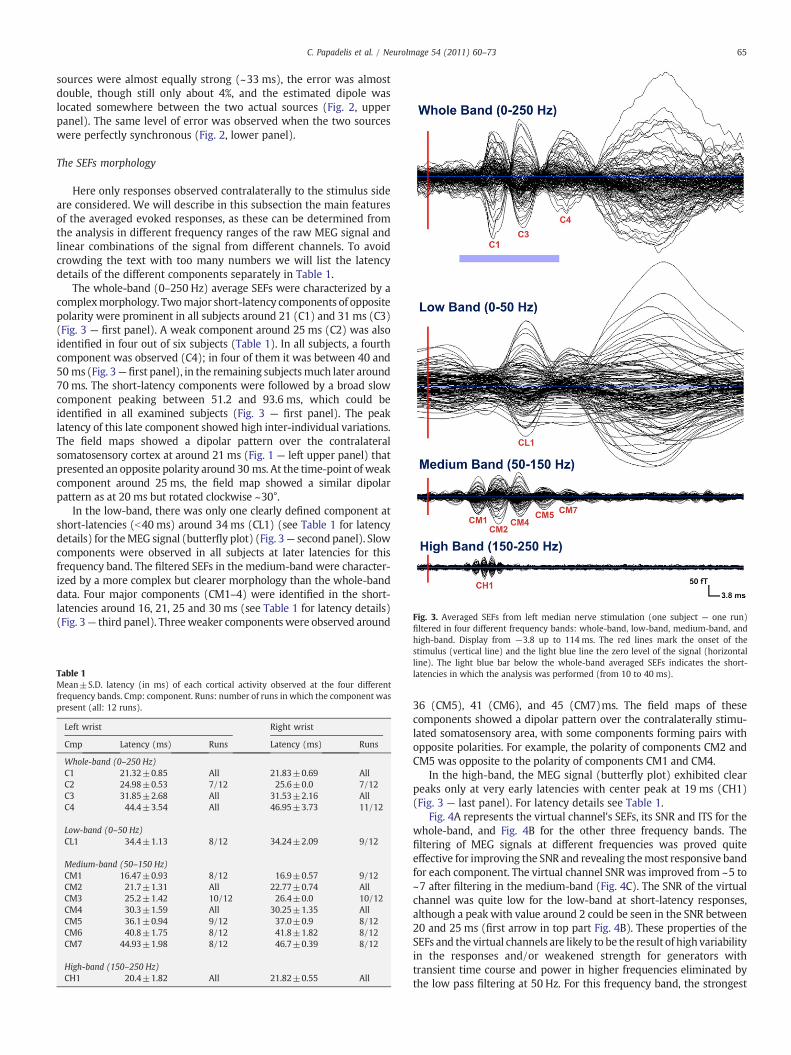
Fig. 3. Averaged SEFs from left median nerve stimulation (one subject — one run)filtered in four different frequency bands: whole-band, low-band, medium-band, and
65C. Papadelis et al. / NeuroImage 54 (2011) 60–73
sources were almost equally strong (~33 ms), the error was almostdouble, though still only about 4%, and the estimated dipole waslocated somewhere between the two actual sources (Fig. 2, upperpanel). The same level of error was observed when the two sourceswere perfectly synchronous (Fig. 2, lower panel).
The SEFs morphology
Here only responses observed contralaterally to the stimulus sideare considered. We will describe in this subsection the main featuresof the averaged evoked responses, as these can be determined fromthe analysis in different frequency ranges of the raw MEG signal andlinear combinations of the signal from different channels. To avoidcrowding the text with too many numbers we will list the latencydetails of the different components separately in Table 1.
The whole-band (0–250 Hz) average SEFs were characterized by acomplexmorphology. Twomajor short-latency components of oppositepolarity were prominent in all subjects around 21 (C1) and 31 ms (C3)(Fig. 3 — first panel). A weak component around 25 ms (C2) was alsoidentified in four out of six subjects (Table 1). In all subjects, a fourthcomponent was observed (C4); in four of them it was between 40 and50 ms (Fig. 3—first panel), in the remaining subjectsmuch later around70 ms. The short-latency components were followed by a broad slowcomponent peaking between 51.2 and 93.6 ms, which could beidentified in all examined subjects (Fig. 3 — first panel). The peaklatency of this late component showed high inter-individual variations.The field maps showed a dipolar pattern over the contralateralsomatosensory cortex at around 21 ms (Fig. 1 — left upper panel) thatpresented an opposite polarity around 30 ms. At the time-point of weakcomponent around 25 ms, the field map showed a similar dipolarpattern as at 20 ms but rotated clockwise ~30°.
In the low-band, there was only one clearly defined component atshort-latencies (b40 ms) around 34 ms (CL1) (see Table 1 for latencydetails) for theMEG signal (butterfly plot) (Fig. 3— second panel). Slowcomponents were observed in all subjects at later latencies for thisfrequency band. The filtered SEFs in the medium-band were character-ized by a more complex but clearer morphology than the whole-banddata. Four major components (CM1–4) were identified in the short-latencies around 16, 21, 25 and 30 ms (see Table 1 for latency details)(Fig. 3— third panel). Threeweaker componentswere observed around
Table 1Mean±S.D. latency (in ms) of each cortical activity observed at the four differentfrequency bands. Cmp: component. Runs: number of runs in which the component waspresent (all: 12 runs).
Left wrist Right wrist
Cmp Latency (ms) Runs Latency (ms) Runs
Whole-band (0–250 Hz)C1 21.32±0.85 All 21.83±0.69 AllC2 24.98±0.53 7/12 25.6±0.0 7/12C3 31.85±2.68 All 31.53±2.16 AllC4 44.4±3.54 All 46.95±3.73 11/12
Low-band (0–50 Hz)CL1 34.4±1.13 8/12 34.24±2.09 9/12
Medium-band (50–150 Hz)CM1 16.47±0.93 8/12 16.9±0.57 9/12CM2 21.7±1.31 All 22.77±0.74 AllCM3 25.2±1.42 10/12 26.4±0.0 10/12CM4 30.3±1.59 All 30.25±1.35 AllCM5 36.1±0.94 9/12 37.0±0.9 8/12CM6 40.8±1.75 8/12 41.8±1.82 8/12CM7 44.93±1.98 8/12 46.7±0.39 8/12
High-band (150–250 Hz)CH1 20.4±1.82 All 21.82±0.55 All
high-band. Display from −3.8 up to 114 ms. The red lines mark the onset of thestimulus (vertical line) and the light blue line the zero level of the signal (horizontalline). The light blue bar below the whole-band averaged SEFs indicates the short-latencies in which the analysis was performed (from 10 to 40 ms).
36 (CM5), 41 (CM6), and 45 (CM7)ms. The field maps of thesecomponents showed a dipolar pattern over the contralaterally stimu-lated somatosensory area, with some components forming pairs withopposite polarities. For example, the polarity of components CM2 andCM5 was opposite to the polarity of components CM1 and CM4.
In the high-band, the MEG signal (butterfly plot) exhibited clearpeaks only at very early latencies with center peak at 19 ms (CH1)(Fig. 3 — last panel). For latency details see Table 1.
Fig. 4A represents the virtual channel's SEFs, its SNR and ITS for thewhole-band, and Fig. 4B for the other three frequency bands. Thefiltering of MEG signals at different frequencies was proved quiteeffective for improving the SNR and revealing themost responsive bandfor each component. The virtual channel SNR was improved from ~5 to~7 after filtering in the medium-band (Fig. 4C). The SNR of the virtualchannel was quite low for the low-band at short-latency responses,although a peak with value around 2 could be seen in the SNR between20 and 25 ms (first arrow in top part Fig. 4B). These properties of theSEFs and the virtual channels are likely to be the result of high variabilityin the responses and/or weakened strength for generators withtransient time course and power in higher frequencies eliminated bythe low pass filtering at 50 Hz. For this frequency band, the strongest

Fig. 4. SEFs (in fT), SNR, and ITS of virtual channel (right wrist stimulation, one subject) for the whole frequency band (0–250 Hz) (A), and the low-band (0–50 Hz), medium-band(50–150 Hz), and high-band (150–250 Hz) (B) for two runs. The virtual channel was defined from the field map during the peak of N20. (C) Displays derived from the same virtualchannel at the peak of M20 of peak-to-peak SEFs values (in fT) on the left and SNR on the right (averages between two runs). In each case the values displayed are in turn for thewhole-band, the low-band, the medium-band and the high-band following the colors for each band as appear in (B). Note that the medium-band produces the highest SNR for theM20.
Fig. 5. Correspondence of estimated generators at the peak of N20 to cytoarchitectonic areas for all subjects. For each subject the results for the two runs with left wrist stimulationare displayed. The ECD source estimates are shown by the cross-hair on each subject's MRI and over-plotted with the color-coded PCM for BA3b. The percentage value at the bottomof each subfigure is the probability for BA3b allocation at the MNI coordinate corresponding to the ECD (cross-hair) location. The number on the left upper corner of each pair ofsubfigure is the difference in source localisation between the two runs. The far right figures show the ECD estimates for the source in each hemisphere for all 12 runs (two for eachsubject) with the mean and S.D. of the separation of the ECD estimates in the two runs.
66 C. Papadelis et al. / NeuroImage 54 (2011) 60–73
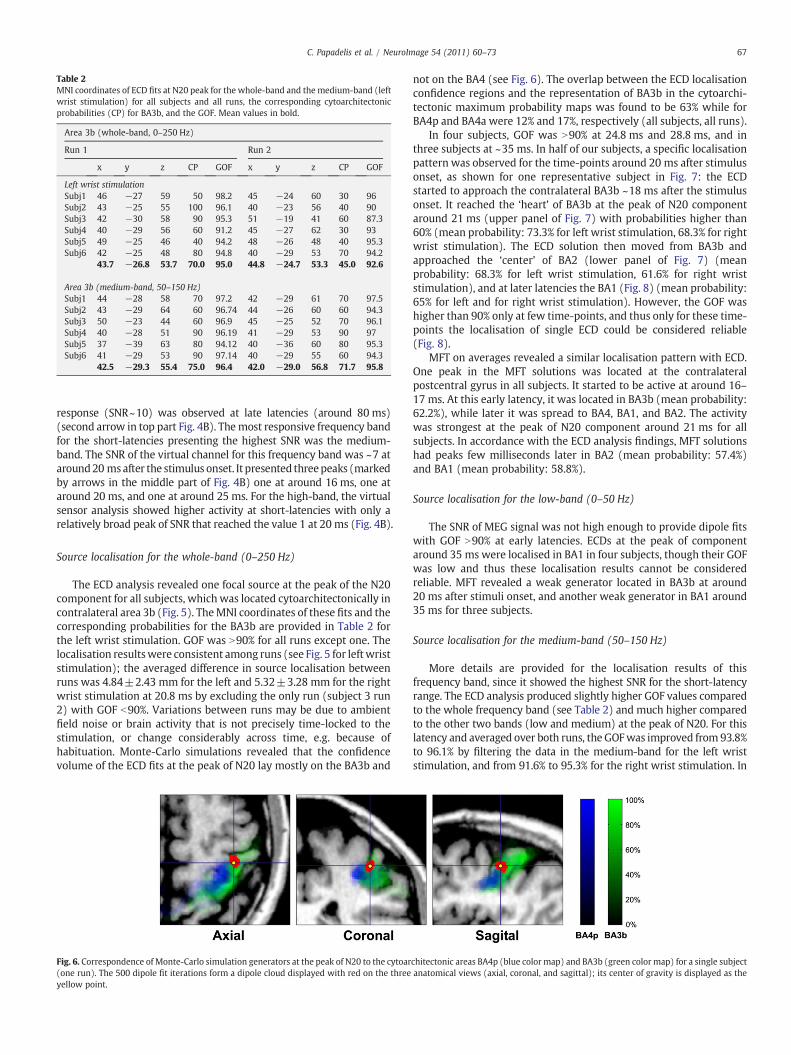
Table 2MNI coordinates of ECD fits at N20 peak for the whole-band and the medium-band (leftwrist stimulation) for all subjects and all runs, the corresponding cytoarchitectonicprobabilities (CP) for BA3b, and the GOF. Mean values in bold.
Area 3b (whole-band, 0–250 Hz)
Run 1 Run 2
x y z CP GOF x y z CP GOF
Left wrist stimulationSubj1 46 −27 59 50 98.2 45 −24 60 30 96Subj2 43 −25 55 100 96.1 40 −23 56 40 90Subj3 42 −30 58 90 95.3 51 −19 41 60 87.3Subj4 40 −29 56 60 91.2 45 −27 62 30 93Subj5 49 −25 46 40 94.2 48 −26 48 40 95.3Subj6 42 −25 48 80 94.8 40 −29 53 70 94.2
43.7 −26.8 53.7 70.0 95.0 44.8 −24.7 53.3 45.0 92.6
Area 3b (medium-band, 50–150 Hz)Subj1 44 −28 58 70 97.2 42 −29 61 70 97.5Subj2 43 −29 64 60 96.74 44 −26 60 60 94.3Subj3 50 −23 44 60 96.9 45 −25 52 70 96.1Subj4 40 −28 51 90 96.19 41 −29 53 90 97Subj5 37 −39 63 80 94.12 40 −36 60 80 95.3Subj6 41 −29 53 90 97.14 40 −29 55 60 94.3
42.5 −29.3 55.4 75.0 96.4 42.0 −29.0 56.8 71.7 95.8
67C. Papadelis et al. / NeuroImage 54 (2011) 60–73
response (SNR~10) was observed at late latencies (around 80 ms)(second arrow in top part Fig. 4B). Themost responsive frequency bandfor the short-latencies presenting the highest SNR was the medium-band. The SNR of the virtual channel for this frequency band was ~7 ataround20 msafter the stimulus onset. It presented threepeaks (markedby arrows in the middle part of Fig. 4B) one at around 16 ms, one ataround 20 ms, and one at around 25 ms. For the high-band, the virtualsensor analysis showed higher activity at short-latencies with only arelatively broad peak of SNR that reached the value 1 at 20 ms (Fig. 4B).
Source localisation for the whole-band (0–250 Hz)
The ECD analysis revealed one focal source at the peak of the N20component for all subjects, which was located cytoarchitectonically incontralateral area 3b (Fig. 5). TheMNI coordinates of these fits and thecorresponding probabilities for the BA3b are provided in Table 2 forthe left wrist stimulation. GOF was N90% for all runs except one. Thelocalisation resultswere consistent among runs (see Fig. 5 for leftwriststimulation); the averaged difference in source localisation betweenruns was 4.84±2.43 mm for the left and 5.32±3.28 mm for the rightwrist stimulation at 20.8 ms by excluding the only run (subject 3 run2) with GOF b90%. Variations between runs may be due to ambientfield noise or brain activity that is not precisely time-locked to thestimulation, or change considerably across time, e.g. because ofhabituation. Monte-Carlo simulations revealed that the confidencevolume of the ECD fits at the peak of N20 lay mostly on the BA3b and
Fig. 6. Correspondence of Monte-Carlo simulation generators at the peak of N20 to the cytoar(one run). The 500 dipole fit iterations form a dipole cloud displayed with red on the threeyellow point.
not on the BA4 (see Fig. 6). The overlap between the ECD localisationconfidence regions and the representation of BA3b in the cytoarchi-tectonic maximum probability maps was found to be 63% while forBA4p and BA4a were 12% and 17%, respectively (all subjects, all runs).
In four subjects, GOF was N90% at 24.8 ms and 28.8 ms, and inthree subjects at ~35 ms. In half of our subjects, a specific localisationpattern was observed for the time-points around 20 ms after stimulusonset, as shown for one representative subject in Fig. 7: the ECDstarted to approach the contralateral BA3b ~18 ms after the stimulusonset. It reached the ‘heart’ of BA3b at the peak of N20 componentaround 21 ms (upper panel of Fig. 7) with probabilities higher than60% (mean probability: 73.3% for left wrist stimulation, 68.3% for rightwrist stimulation). The ECD solution then moved from BA3b andapproached the ‘center’ of BA2 (lower panel of Fig. 7) (meanprobability: 68.3% for left wrist stimulation, 61.6% for right wriststimulation), and at later latencies the BA1 (Fig. 8) (mean probability:65% for left and for right wrist stimulation). However, the GOF washigher than 90% only at few time-points, and thus only for these time-points the localisation of single ECD could be considered reliable(Fig. 8).
MFT on averages revealed a similar localisation pattern with ECD.One peak in the MFT solutions was located at the contralateralpostcentral gyrus in all subjects. It started to be active at around 16–17 ms. At this early latency, it was located in BA3b (mean probability:62.2%), while later it was spread to BA4, BA1, and BA2. The activitywas strongest at the peak of N20 component around 21 ms for allsubjects. In accordance with the ECD analysis findings, MFT solutionshad peaks few milliseconds later in BA2 (mean probability: 57.4%)and BA1 (mean probability: 58.8%).
Source localisation for the low-band (0–50 Hz)
The SNR of MEG signal was not high enough to provide dipole fitswith GOF N90% at early latencies. ECDs at the peak of componentaround 35 ms were localised in BA1 in four subjects, though their GOFwas low and thus these localisation results cannot be consideredreliable. MFT revealed a weak generator located in BA3b at around20 ms after stimuli onset, and another weak generator in BA1 around35 ms for three subjects.
Source localisation for the medium-band (50–150 Hz)
More details are provided for the localisation results of thisfrequency band, since it showed the highest SNR for the short-latencyrange. The ECD analysis produced slightly higher GOF values comparedto the whole frequency band (see Table 2) and much higher comparedto the other two bands (low and medium) at the peak of N20. For thislatency and averaged over both runs, the GOFwas improved from 93.8%to 96.1% by filtering the data in the medium-band for the left wriststimulation, and from 91.6% to 95.3% for the right wrist stimulation. In
chitectonic areas BA4p (blue color map) and BA3b (green color map) for a single subjectanatomical views (axial, coronal, and sagittal); its center of gravity is displayed as the
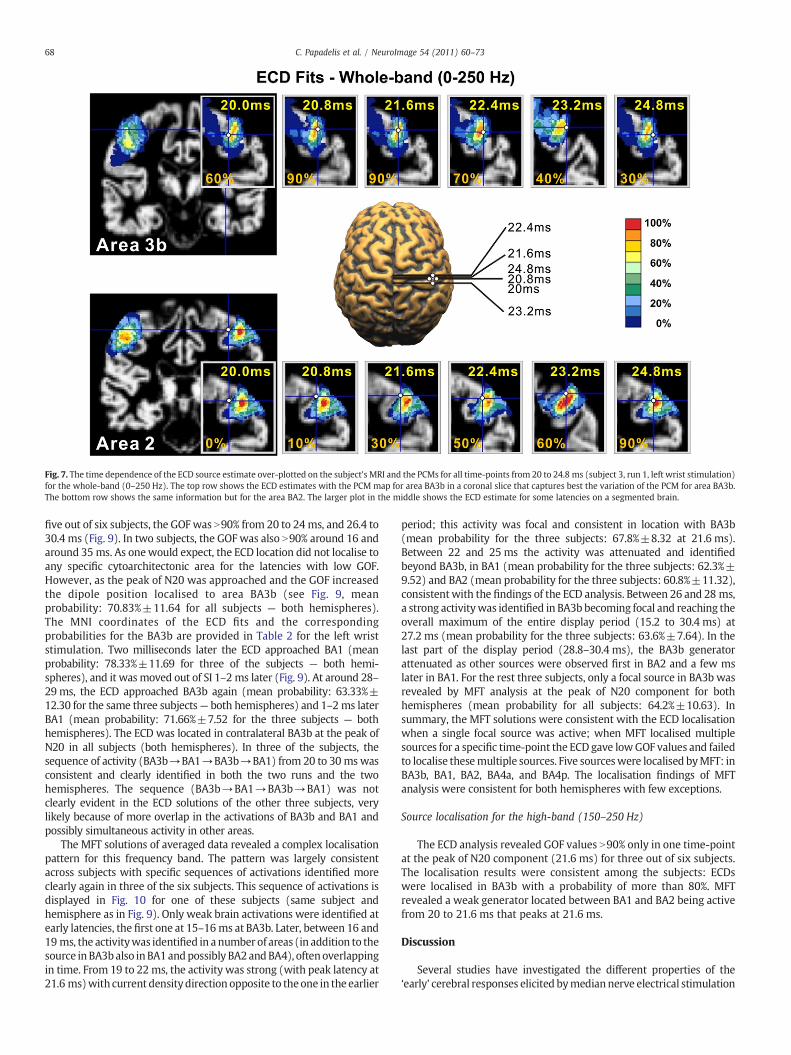
Fig. 7. The time dependence of the ECD source estimate over-plotted on the subject's MRI and the PCMs for all time-points from 20 to 24.8 ms (subject 3, run 1, left wrist stimulation)for the whole-band (0–250 Hz). The top row shows the ECD estimates with the PCM map for area BA3b in a coronal slice that captures best the variation of the PCM for area BA3b.The bottom row shows the same information but for the area BA2. The larger plot in the middle shows the ECD estimate for some latencies on a segmented brain.
68 C. Papadelis et al. / NeuroImage 54 (2011) 60–73
five out of six subjects, the GOF was N90% from 20 to 24 ms, and 26.4 to30.4 ms (Fig. 9). In two subjects, the GOF was also N90% around 16 andaround 35 ms. As onewould expect, the ECD location did not localise toany specific cytoarchitectonic area for the latencies with low GOF.However, as the peak of N20 was approached and the GOF increasedthe dipole position localised to area BA3b (see Fig. 9, meanprobability: 70.83%±11.64 for all subjects — both hemispheres).The MNI coordinates of the ECD fits and the correspondingprobabilities for the BA3b are provided in Table 2 for the left wriststimulation. Two milliseconds later the ECD approached BA1 (meanprobability: 78.33%±11.69 for three of the subjects — both hemi-spheres), and it wasmoved out of SI 1–2 ms later (Fig. 9). At around 28–29 ms, the ECD approached BA3b again (mean probability: 63.33%±12.30 for the same three subjects— both hemispheres) and 1–2 ms laterBA1 (mean probability: 71.66%±7.52 for the three subjects — bothhemispheres). The ECD was located in contralateral BA3b at the peak ofN20 in all subjects (both hemispheres). In three of the subjects, thesequence of activity (BA3b→BA1→BA3b→BA1) from 20 to 30 ms wasconsistent and clearly identified in both the two runs and the twohemispheres. The sequence (BA3b→BA1→BA3b→BA1) was notclearly evident in the ECD solutions of the other three subjects, verylikely because of more overlap in the activations of BA3b and BA1 andpossibly simultaneous activity in other areas.
The MFT solutions of averaged data revealed a complex localisationpattern for this frequency band. The pattern was largely consistentacross subjects with specific sequences of activations identified moreclearly again in three of the six subjects. This sequence of activations isdisplayed in Fig. 10 for one of these subjects (same subject andhemisphere as in Fig. 9). Only weak brain activations were identified atearly latencies, the first one at 15–16ms at BA3b. Later, between 16 and19 ms, the activitywas identified in anumber of areas (in addition to thesource in BA3balso inBA1andpossibly BA2andBA4), oftenoverlappingin time. From 19 to 22 ms, the activity was strong (with peak latency at21.6 ms)with current densitydirection opposite to theone in the earlier
period; this activity was focal and consistent in location with BA3b(mean probability for the three subjects: 67.8%±8.32 at 21.6 ms).Between 22 and 25 ms the activity was attenuated and identifiedbeyond BA3b, in BA1 (mean probability for the three subjects: 62.3%±9.52) and BA2 (mean probability for the three subjects: 60.8%±11.32),consistentwith the findings of the ECD analysis. Between 26 and 28 ms,a strong activitywas identified in BA3b becoming focal and reaching theoverall maximum of the entire display period (15.2 to 30.4 ms) at27.2 ms (mean probability for the three subjects: 63.6%±7.64). In thelast part of the display period (28.8–30.4 ms), the BA3b generatorattenuated as other sources were observed first in BA2 and a few mslater in BA1. For the rest three subjects, only a focal source in BA3b wasrevealed by MFT analysis at the peak of N20 component for bothhemispheres (mean probability for all subjects: 64.2%±10.63). Insummary, the MFT solutions were consistent with the ECD localisationwhen a single focal source was active; when MFT localised multiplesources for a specific time-point the ECD gave lowGOF values and failedto localise thesemultiple sources. Five sourceswere localised byMFT: inBA3b, BA1, BA2, BA4a, and BA4p. The localisation findings of MFTanalysis were consistent for both hemispheres with few exceptions.
Source localisation for the high-band (150–250 Hz)
The ECD analysis revealed GOF values N90% only in one time-pointat the peak of N20 component (21.6 ms) for three out of six subjects.The localisation results were consistent among the subjects: ECDswere localised in BA3b with a probability of more than 80%. MFTrevealed a weak generator located between BA1 and BA2 being activefrom 20 to 21.6 ms that peaks at 21.6 ms.
Discussion
Several studies have investigated the different properties of the‘early’ cerebral responses elicited bymediannerve electrical stimulation

Fig. 8. (A) Averaged SEFs (in fT) from left median nerve stimulation (subject 3, run 1, leftwrist stimulation) filtered in the whole frequency band of 0–250 Hz. Contour map showsiso-magneticfieldsduring theN20peak (indicatedwith an arrow), a single dipolar patternover the right somatosensory area. Shaded areas indicate the time-rangesatwhich theECDresults are displayed on the lower panel. Asterisks indicate the time-points at which theECD was fitted with GOF b90%. (B) For each ECD solution the estimated location isrepresented inMNI coordinates and the probability (%) of the PCMmaps for that locationto belong to specific cytoarchitectonic areas is computed and displayed in the diagram forBA3b (blue), BA1 (green) and BA2 (red). The grey shaded areas show the values oflocalisation error (%)=100−GOF for the ECD at each time-point. It is evident that highGOF (low error) is correlated with activity in one cytoarchitectonic area.
Fig. 9. The PCM and GOF variation of the ECD solutions, fitted to the data filtered in themedium-band, for each time-point from 15.2 to 31.2 ms (subject 3, run 1, right wriststimulation). For each latency, the ECD location is transferred to the MNI coordinatesystem and the probability (%) of the PCM is computed and displayed for areas BA3b,BA1 and BA2. The same conventions as for the lower part of Fig. 5. Note again that highgoodness of fit corresponds either to cases where one area dominates (e.g. BA3b around21 ms) or two nearby areas (transitions between 21 and 24 ms and 27 and 29 ms).
69C. Papadelis et al. / NeuroImage 54 (2011) 60–73
including the latency-amplitude, topographic distribution, and equiv-alent source location during selective stimulation of different bodyparts. Despite this, there are still considerable uncertainties as to whichcortical areas are activated, or at least which of the areas activated bythis type of stimulation can be unambiguously identified from non-invasive macroscopic measures like EEG and MEG. The traditional viewposits that themain generator is located primarily in the posterior bankof the central sulcus, corresponding to BA3b (Inui et al., 2004; Mima etal., 1998; Tiihonen et al., 1989; Yang et al., 1993). An alternative viewassumes a near simultaneous activation of an extended cortical region,which includes all subdivisions of SI (Papakostopoulos and Crow, 1980)and extends both anterior to the precentral gyrus (BA4) and posterior inthe parietal lobe (Forss et al., 1994). Other weaker sources have alsobeen reported to be active within the same short-latency range:ipsilateral SI (Korvenoja et al., 1995), contralateral SII (Karhu andTesche, 1999), and cerebellum (Tesche and Karhu, 1997).
The conclusions about the generators of SEFs drawn in earlier studieswere based on macroanatomical landmarks and analogies withactivations identified during intraoperative recordings in humansundergoing neurosurgery (Allison et al., 1989), or direct recordings inanimals (McCarthy et al., 1991). As commented earlier, inference onactivated cortical areas drawn by comparison to the surrounding gyraland sulcal landmarks should be considered plausible suggestions, atbest.
Invasive methods such as cortical surface, transcortical, and depthprobe recordings are regarded as the gold standard for localising thegenerators of short-latency somatosensory responses. This is indeed thecase provided certain conditions are satisfied: all aspects of themeasurement are very precise; the local anatomy is not too distorteddue to pathology; and histological analysis of the area is available. Inpractice, real invasive measurements in humans have clinical prioritieswith research needs having a minor significance and as a result theyoften fall far short in meeting the above criteria. For example, spatialresolution is limited because the inter-electrode spacing is usually ~5–6 mm for cortical surface recordings (Allison et al., 1989; Wood et al.,1988) and the measurements provide only a partial view in the strictlocality where the needle has ended (i.e. in transcortical or depth proberecordings). In addition, expansive lesions in human patients may leadto functional reorganization altering the topographic organization of thecortex (Wunderlich et al., 1998; Vates et al., 2002). The methods usedfor localising the cortical generators are also biased towards clinicalrequirements that usually require a more macroscopic view, forexample assessing the polarity and gradient of potentials recordedfrom the cortical surface and white matter. A polarity inversion andsharp potential gradient from surface to white matter are regarded asproviding strong evidence that the potentials are generated in cortexbetween or adjacent to the recordings electrodes (Allison et al., 1991a;Wood et al., 1988). These limitations are minimized in invasive animalstudies, but here evolutionary issues caution against confidentgeneralization to humans.
Our methodology is a first step towards an attractive alternativebased on direct reference to the cytoarchitectonic information instereotaxic space given by the PCMs. It makes use of the MEG signalthat is a direct macromeasure of the underlying neuronal activity —
the signal reflects instantaneous changes in electrical activity andpropagates from the point of generation in the brain to the sensorswith the speed of light. The neuronal activity can be localised with anaccuracy of 2–3 mm when strong enough and located in superficialsites such as during short-latency somatosensory responses.
The findings of the present study confirm the hypothesis that theearliest cortical response after median nerve stimulation (the earlypart of N20) is generated within the contralateral cytoarchitectonicarea BA3b. Both inverse methods (ECD and MFT) identified a focal
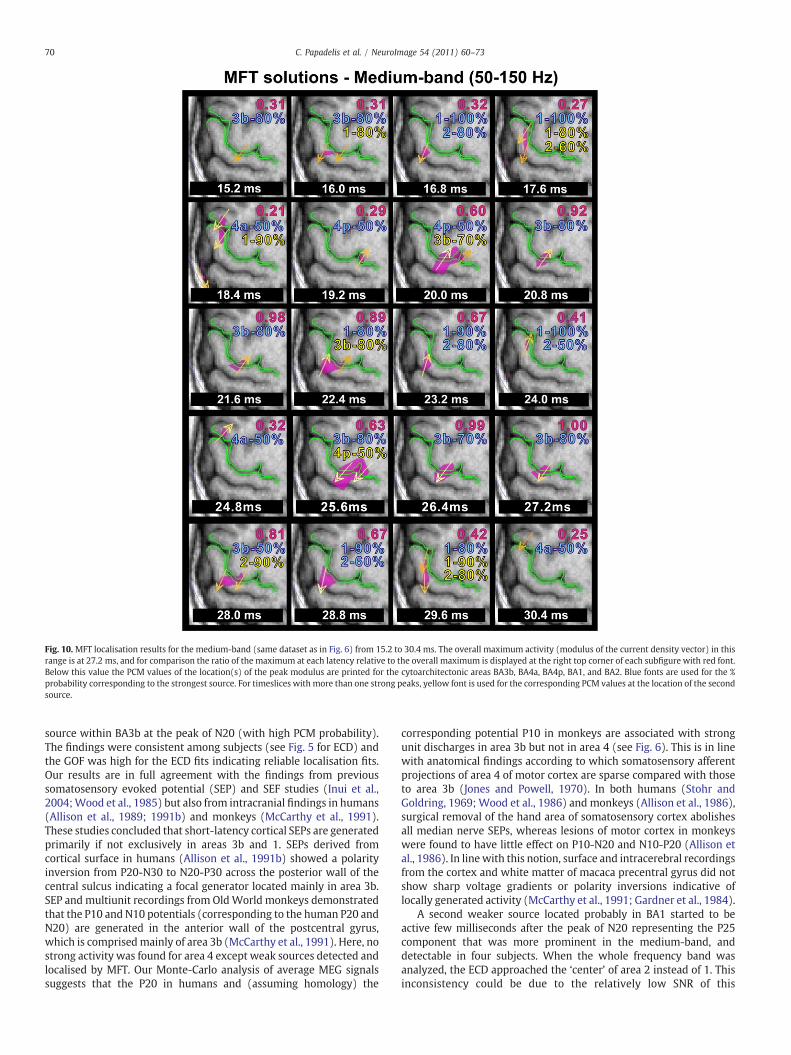
Fig. 10. MFT localisation results for the medium-band (same dataset as in Fig. 6) from 15.2 to 30.4 ms. The overall maximum activity (modulus of the current density vector) in thisrange is at 27.2 ms, and for comparison the ratio of the maximum at each latency relative to the overall maximum is displayed at the right top corner of each subfigure with red font.Below this value the PCM values of the location(s) of the peak modulus are printed for the cytoarchitectonic areas BA3b, BA4a, BA4p, BA1, and BA2. Blue fonts are used for the %probability corresponding to the strongest source. For timeslices with more than one strong peaks, yellow font is used for the corresponding PCM values at the location of the secondsource.
70 C. Papadelis et al. / NeuroImage 54 (2011) 60–73
source within BA3b at the peak of N20 (with high PCM probability).The findings were consistent among subjects (see Fig. 5 for ECD) andthe GOF was high for the ECD fits indicating reliable localisation fits.Our results are in full agreement with the findings from previoussomatosensory evoked potential (SEP) and SEF studies (Inui et al.,2004;Wood et al., 1985) but also from intracranial findings in humans(Allison et al., 1989; 1991b) and monkeys (McCarthy et al., 1991).These studies concluded that short-latency cortical SEPs are generatedprimarily if not exclusively in areas 3b and 1. SEPs derived fromcortical surface in humans (Allison et al., 1991b) showed a polarityinversion from P20-N30 to N20-P30 across the posterior wall of thecentral sulcus indicating a focal generator located mainly in area 3b.SEP and multiunit recordings from OldWorld monkeys demonstratedthat the P10 and N10 potentials (corresponding to the human P20 andN20) are generated in the anterior wall of the postcentral gyrus,which is comprisedmainly of area 3b (McCarthy et al., 1991). Here, nostrong activity was found for area 4 except weak sources detected andlocalised by MFT. Our Monte-Carlo analysis of average MEG signalssuggests that the P20 in humans and (assuming homology) the
corresponding potential P10 in monkeys are associated with strongunit discharges in area 3b but not in area 4 (see Fig. 6). This is in linewith anatomical findings according to which somatosensory afferentprojections of area 4 of motor cortex are sparse compared with thoseto area 3b (Jones and Powell, 1970). In both humans (Stohr andGoldring, 1969; Wood et al., 1986) and monkeys (Allison et al., 1986),surgical removal of the hand area of somatosensory cortex abolishesall median nerve SEPs, whereas lesions of motor cortex in monkeyswere found to have little effect on P10-N20 and N10-P20 (Allison etal., 1986). In line with this notion, surface and intracerebral recordingsfrom the cortex and white matter of macaca precentral gyrus did notshow sharp voltage gradients or polarity inversions indicative oflocally generated activity (McCarthy et al., 1991; Gardner et al., 1984).
A second weaker source located probably in BA1 started to beactive few milliseconds after the peak of N20 representing the P25component that was more prominent in the medium-band, anddetectable in four subjects. When the whole frequency band wasanalyzed, the ECD approached the ‘center’ of area 2 instead of 1. Thisinconsistency could be due to the relatively low SNR of this

71C. Papadelis et al. / NeuroImage 54 (2011) 60–73
component at the whole frequency band (see Fig. 4) that wasmarkedly increased by filtering the signal in the medium-band. Thearea 1 is located in the crown of the postcentral gyrus and it thereforecorresponds to a nearly radial generator. Thus, it is to be expected thata weak MEG signal would be generated that is difficult to be detected.The activation of BA1 is in agreement with cortical surface andintraoperative recordings during neurosurgery and recordings fromchronically implanted depth probes in epileptic patients (Allison et al.,1989). These studies found the P25 component as a distinct entity in30% of the cases. Allison et al. (1989) reported its latency 3 ms afterthe N20 peak, corresponding to ~22 ms after stimulus onset. Theyfound that the P25-N35 component was largest in the anteromedialportion of the hand area of somatosensory cortex, while its potentialdistribution suggested a radially oriented generator in area 1, which inhumans and Old World monkeys is located primarily in the anteriorcrown of the postcentral gyrus (Powell and Mountcastle, 1959). Inanimals, the P12-N25 component (corresponding to the human P25-N35) has also been recorded overmost of the crown of somatosensorycortex indicating a partial activation of area 1 and maybe area 2.
Our results support the notion of a serial mode of somatosensoryprocessing through the postcentral gyrus from BA3b to BA1. The serialactivation in areas 3b and 1 is also supported by previous MEG studies(Inui et al., 2004; Kakigi, 1994), intracranial SEP studies in monkeys(Allison et al., 1991b; Garraghty et al., 1990), and anatomical findinginmonkeys according to which the area 3 projects predominantly intoarea 1 (Vogt and Pandya, 1978). The component C3 at ~30 ms seemsto represent a second wave of reactivations of areas 3b and 1. This isclearer in the most responsive medium frequency band, where theECD fits have higher GOFs (see Fig. 9). Our results suggest that thepositive and the negative phases of the P20-N30 component at ~20and ~30 ms are actually generated by the same neural source. Thesame may also be for the positive and negative phases of the P25-N35component peaking at ~25 and ~35 ms. This is in accordance withprevious transcortical SEPs data which were well accounted for by amodel having two generators with different time courses (shifted by~5 ms) and with fixed locations and orientations in the BA3b and BA1(Allison et al., 1989). These positive–negative sequences are oftencalled the primary evoked responses (Towe, 1966) and have beenrecorded from visual, auditory, and somatosensory cortex (Mitzdorf,1985; Schlag, 1973; Towe, 1966). Whether the reoccurrence of BA3bactivity is a “second wave” or a feedback from the area 1 cannot beconcluded by the findings of the present study.
The first cortical activation was observed firstly at around 15–16 ms(see Fig. 4) after stimulus onset. MFT and ECD localised this source inareas 3b and 1, with a hint of an earlier onset in BA3b. The rather lowGOF (b90%) of the ECD solution (see Fig. 9) can be understood as aconsequence of the relative weakness of this early activation, collabo-rated also by the relatively low source strength of theMFT solution (seeFig. 10). This early cortical activity is likely to overlap with activity indeep subcortical areas along thalamocorticalfibers (Kimura et al., 2008),and this might be why it was not identified in some subjects.
Methodological issues
From a more methodological point of view, the results of bothsimulation and human data confirm the hypothesis outlined in theIntroduction. The analysis of MEG data and the use of PCMs allowunder preconditions (very high values of GOF for the single ECDmodel) unambiguous interpretation of cytoarchitectonic identity ofactivated areas following median nerve stimulation. In the presentstudy, the measured brain activity was modeled using a single ECD ateach time-point. Only ECD fittings with very high GOF were assumedreliable. In the other time-points where the GOF was low, therecorded magnetic activity could be attributed to many differentgenerators simultaneously active or distributed over a significantbrain area and thus the ECDmodel may perform poorly (Phillips et al.,
1997). This was confirmed by MFT showing that more than onegenerator were active within SI.
According to the simulation data, the GOF is a good indicator of thereliability of the ECD solution. ECD solutions with very high GOF(above 96%) indicate that the MEG signal is dominated by either asingle focal source, or a couple of sources within a few millimeters ofeach other. On the basis of our simulation data (Fig. 2), the ECDmodelreliably identifies the location of a single focal source (with anaccuracy of ~1 mm and a GOF ofN98%). These results are in fullagreement with earlier MFT studies performed with data providingonly partial head coverage (Ioannides et al., 1993a,b) andmore recentstudies with realistically head-shaped phantoms (Papadelis et al.,2007, 2009). The results from the present study show that the overlayof functional solutions of high GOF on the PCMs can provideunambiguous identification of the active cytoarchitectonic area.When more than one source was simultaneously active and almostequally strong, the GOF was decreased below ~96% indicating that asingle ECD model is not an appropriate description of the measuredactivity. In summary we find that, ECD solutions with GOF N95% arenecessary for the corresponding location to be close enough to a truesource and thus allow histological allocation by the PCMs. This isparticularly evident for the ECD results in the most responsivemedium-band. Periods with high GOF and assignment with highprobability to one or other cytoarchitectonic area were interspersedbetween periods with low GOF and the ECD “wandering” in the spacein between well-defined cytoarchitectonic areas. During periods ofECD solutions with high GOF, the MFT analysis showed focal activityin the same cytoarchitectonic areas as the ECD. In the other periods,when the GOF of the ECD solutions was low, MFT showed activity ofsimilar magnitude in different areas (some captured in the slicesdisplayed in Fig. 10). A multiple dipole approach may provide evenmore accurate localisation results when multiple generators aresimultaneously active, a topic that is now under further investigationin our laboratories.
Our results also showed that filtering can determine what historyemerges from the ECD analysis. By definition, low frequency filteringwill only allow through slow components, so each one of the brief earlyactivations will be largely eliminated, or at least greatly reduced andspread so the identity of each source will be lost as their signals overlapwith each other. It is therefore not surprising that the low frequencyanalysis did not produce well-differentiated early focal activations. Thehigh-frequency range of 150 to 250 Hz leads to ECD solutions only closeto the peak of the N20, suggesting that the activity at the other latenciescontained significant power at the eliminated lower frequencies below150 Hz. Our results suggest that for transitionswithin and close to SI forthe early responses the frequency range from 50 to 150 Hz provides thebest view of the early interchanges of activity between areas.
Conclusions
In summary, we have demonstrated that the earliest responses aregenerated in area 3b and provided evidence for serial processingwithin cytoarchitectonic SI subdivisions. Using the well-establishedECD analysis we could account for the major spatial and temporalfeatures of SEFs in the most responsive frequency band (medium-band of 50–150 Hz) with a model having two main generators withslightly different time courses one in cytoarchitectonic area 3b and theother in area 1. A possible contribution from other sources cannot beruled out and MFT analysis produced some evidence for activity inareas 2, 4a and 4p. These results show that ECD analysis of MEG dataare reliable enough to determine which cytoarchitectonic area isactivated on the basis of PCMs, but only at latencies where thesolutions have very high GOF, at least 95% but better still above 97%.Under these conditions the MEG measurements and their simple ECDanalysis offer a non-invasive and easy to use tool to localise theunderlying neural generators of SEFs.
72 C. Papadelis et al. / NeuroImage 54 (2011) 60–73
Acknowledgments
We thank all the staff of the Laboratory for Human Brain Dynamics(1999–2009) at the Brain Science Institute, RIKEN and especially Mr.Kenji Haruhana for the assistance with the experiment. Theexperiment and data analysis were performed at RIKEN and thework was continued by the authors at their new posts in Italy andCyprus. Following the closing of the MEG laboratory at RIKEN inSeptember 2009, the contribution from AAI was supported by CyprusResearch Promotion Foundation grants (upgrade/info/0308/02 andhuman/sociol/0308/BE). SBE was supported by the Human BrainProject (R01-MH074457-01A1), and SBE and KZ by the HelmholtzInitiative on Systems Biology “The Human Brain Model”.
References
Allison, T., Wood, C.C., McCarthy, G., 1986. Somatosensory evoked potentials followingsurgical excision of somatosensory or motor cortex in the monkey. Soc. Neurosci.Abstr. 12, 1432.
Allison, T., McCarthy, G., Wood, C.C., Jones, S.J., 1991a. Potentials evoked in human andmonkey cerebral cortex by stimulation of the median nerve. A review of scalp andintracranial recordings. Brain 114 (Pt 6), 2465–2503.
Allison, T., Wood, C.C., McCarthy, G., Spencer, D.D., 1991b. Cortical somatosensoryevoked potentials. II. Effects of excision of somatosensory or motor cortex inhumans and monkeys. J. Neurophysiol. 66 (1), 64–82.
Allison, T., McCarthy, G., Wood, C.C., Darcey, T.M., Spencer, D.D., Williamson, P.D., 1989.Human cortical potentials evoked by stimulation of the median nerve. I.Cytoarchitectonic areas generating short-latency activity. J. Neurophysiol. 62 (3),694–710.
Amiez, C., Petrides, M., 2009. Anatomical organization of the eye fields in the humanand non-human primate frontal cortex. Progr. Neurobiol. 89, 220–230.
Amunts, K., Schleicher, A., Bürgel, U., Mohlberg, H., Uylings, H.B.M., Zilles, K., 1999.Broca's region revisited: cytoarchitecture and intersubject variability. J. Comp.Neurol. 412, 319–341.
Amunts, K., Malikovic, A., Mohlberg, H., Schormann, T., Zilles, K., 2000. Brodmann'sareas 17 and 18 brought into stereotaxic space — where and how variable?Neuroimage 11, 66–84.
Amunts, K., Zilles, K., 2001. Advances in cytoarchitectonic mapping of the humancerebral cortex. Neuroimaging Clin. N. Am. 11 (2), 151–169.
Amunts, K., Weiss, P.H., Mohlberg, H., Pieperhoff, P., Eickhoff, S., Gurd, J.M., Marshall, J.C.,Shah, J.N., Fink, G.R., Zilles, K., 2004. Analysis of the neural mechanisms underlyingverbal fluency in cytoarchitectonically defined stereotaxic space — the roles ofBrodmann areas 44 and 45. Neuroimage 22, 42–56.
Ashburner, J., Friston, K.J., 2005. Unified segmentation. Neuroimage 26 (3), 839–851.Barnikol, U.B., Amunts, K., Dammers, J., Mohlberg, H., Fieseler, T., Malikovic, A., Zilles, K.,
Niedeggen, M., Tass, P.A., 2006. Pattern reversal visual evoked responses of V1/V2and V5/MT as revealed by MEG combined with probabilistic cytoarchitectonicmaps. Neuroimage 31 (1), 86–108.
Baumgartner, C., Sutherling, W.W., Di, S., Barth, D.S., 1991. Spatiotemporal modeling ofcerebral evoked magnetic fields to median nerve stimulation. Electroencephalogr.Clin. Neurophysiol. 79 (1), 27–35.
Binkofski, F., Amunts, K., Stephan, K.M., Posse, S., Schormann, T., Freund, H.J., Zilles, K.,Seitz, R.J., 2000. Broca's region subserves imagery of motion: a combinedcytoarchitectonic and fMRI study. Hum. Brain Mapp. 11 (4), 273–285.
Bodegård, A., Geyer, S., Naito, E., Zilles, K., Roland, P.E., 2000. Somatosensory areas in manactivated by moving stimuli. Cytoarchitectonic mapping and PET. NeuroReport 11,187–191.
Bodegård, A., Geyer, S., Herath, P., Grefkes, C., Zilles, K., Roland, P.E., 2003.Somatosensory areas engaged during discrimination of steady pressure, springstrength and kinaesthesia. Hum. Brain Mapp. 20, 103–115.
Brodmann, K., 1909. Vergleichende Lokalisationslehre der Großhirnrinde. Barth,Leipzig.
Buchner, H., Fuchs, M., Wischmann, H.A., Dössel, O., Ludwig, I., Knepper, A., Berg, P.,1994. Source analysis of median nerve and finger stimulated somatosensoryevoked potentials: multichannel simultaneous recording of electric and magneticfields combined with 3D-MR tomography. Brain Topogr. 6 (4), 299–310.
Dammers, J., Mohlberg, H., Boers, F., Tass, P., Amunts, K., Mathiak, K., 2007. A newtoolbox for combining magnetoencephalographic source analysis and cytoarchi-tectonic probabilistic data for anatomical classification of dynamic brain activity.Neuroimage 34, 1577–1587.
Dumoulin, S.O., Bittar, R.G., Kabani, N.J., Baker Jr., C.L., Le Goualher, G., Bruce Pike, G.,Evans, A.C., 2000. A new anatomical landmark for reliable identification of humanarea V5/MT: a quantitative analysis of sulcal patterning. Cereb. Cortex 10 (5),454–463.
Eickhoff, S.B., Stephan, K.E., Mohlberg, H., Grefkes, C., Fink, G.R., Amunts, K., Zilles, K.,2005. A new SPM toolbox for combining probabilistic cytoarchitectonic maps andfunctional imaging data. Neuroimage 25 (4), 1325–1335.
Eickhoff, S.B., Heim, S., Zilles, K., Amunts, K., 2006a. Testing anatomically specifiedhypotheses in functional imaging using cytoarchitectonic maps. Neuroimage 32(2), 570–582.
Eickhoff, S.B., Lotze, M., Wietek, B., Amunts, K., Enck, P., Zilles, K., 2006b. Segregation ofvisceral and somatosensory afferents: an fMRI and cytoarchitectonic mappingstudy. Neuroimage 31 (3), 1004–1014.
Eickhoff, S.B., Paus, T., Caspers, S., Grosbras, M.H., Evans, A., Zilles, K., Amunts, K., 2007.Assignment of functional activations to probabilistic cytoarchitectonic areasrevisited. Neuroimage 36 (3), 511–521.
Eickhoff, S.B., Grefkes, C., Fink, G.R., Zilles, K., 2008. Functional lateralisation of face,hand and trunk representation in anatomically defined human somatosensoryareas. Cereb. Cortex 18, 2820–2830.
Evans, A.C., Marrett, S., Neelin, P., Collins, L., Worsley, K., Dai, W., Milot, S., Meyer, E.,Bub, D., 1992. Anatomical mapping of functional activation in stereotacticcoordinate space. Neuroimage 1, 43–53.
Forss, N., Hari, R., Salmelin, R., Ahonen, A., Hämäläinen, M., Kajola, M., Knuutila, J.,Simola, J., 1994. Activation of the human posterior parietal cortex by median nervestimulation. Exp. Brain Res. 99 (2), 309–315.
Gardner, E.P., Hämäläinen, H.A., Warren, S., Davis, J., Young, W., 1984. Somatosensoryevokedpotentials (SEPs) andcortical singleunit response elicitedbymechanical tactilestimuli in awake monkeys. Electroencephalogr. Clin. Neurophysiol. 58, 537–552.
Garraghty, P.E., Florence, S.L., Kaas, J.H., 1990. Ablations of areas 3a and 3b of monkeysomatosensory cortex abolish cutaneous responsivity in area 1. Brain Res. 528 (1),165–169.
Geyer, S., Ledberg, A., Schleicher, A., Kinomura, S., Schormann, T., Burgel, U., Klingberg,T., Larsson, J., Zilles, K., Roland, P.E., 1996. Two different areas within the primarymotor cortex of man. Nature 382, 805–807.
Geyer, S., Schleicher, A., Zilles, K., 1999. Areas 3a, 3b, and 1 of human primarysomatosensory cortex: 1. Microstructural organization and interindividual variability.NeuroImage 10, 63–83.
Geyer, S., Schormann, T., Mohlberg, H., Zilles, K., 2000. Areas 3a, 3b, and 1 of humanprimary somatosensory cortex. 2. Spatial normalization to standard anatomicalspace. Neuroimage 11, 684–696.
Geyer, S., Schleicher, A., Schormann, T., Mohlberg, H., Bodegård, A., Roland, P.E., Zilles,K., 2001. Integration of microstructural and functional aspects of humansomatosensory areas 3a, 3b, and 1 on the basis of a computerized brain atlas.Anat. Embryol. (Berl) 204 (4), 351–366.
Grefkes, C., Geyer, S., Schormann, T., Roland, P., Zilles, K., 2001. Human somatosensory area2: observer-independent cytoarchitectonic mapping, interindividual variability, andpopulation map. Neuroimage 14, 617–631.
Gross, J., Ioannides, A.A., 1999. Linear transformations of data space in MEG. Phys. Med.Biol. 44, 2081–2097.
Hämäläinen, M., Hari, R., Ilmoniemi, R.J., Knuutila, J., Lounasmaa, O.V., 1993.Magnetoencephalography — theory, instrumentation, and applications to nonin-vasive studies of the working human brain. Rev. Mod. Phys. 65 (2), 413–497.
Hari, R., Reinikainen, K., Kaukoranta, E., Hämäläinen, M., Ilmoniemi, R., Penttinen, A.,Salminen, J., Teszner, D., 1984. Somatosensory evoked cerebral magnetic fieldsfrom SI and SII in man. Electroencephalogr. Clin. Neurophysiol. 57 (3), 254–263.
Haueisen, J., Schack, B., Meier, T., Curio, G., Okada, Y., 2001. Multiplicity in the high-frequency signals during the short-latency somatosensory evoked cortical activityin humans. Clin. Neurophysiol. 112 (7), 1316–1325.
Heim, S., Alter, K., Ischebeck, A.K., Amunts, K., Eickhoff, S.B., Mohlberg, H., Zilles, K., Yvesvon Cramon, D., Friederici, A.D., 2005. The role of the left Brodmann's areas 44 and45 in reading words and pseudowords. Cognit. Brain Res. 25, 982–993.
Hironaga, N., Ioannides, A.A., 2002. Accurate co-registration for MEG reconstructions.In: Nowak, H., Haueisen, J., Giessler, F., Huonker, R. (Eds.), Proceedings of the 13th
International Conference on Biomagnetism. Berlin, VDE Verlag, pp. 931–933.Horwitz, B., Amunts, K., Bhattarchayya, R., Patkin, D., Jeffries, K., Zilles, K., Braun, A.R., 2003.
Activation of Broca's area during the production of spoken and signed language: Acombined cytoarchitectonic mapping and PET analysis. Neuropsychologia 41,1868–1876.
Huttunen, J., 1997. Does the P35m SEF deflection really come from the motor cortex?Electroencephalogr. Clin. Neurophysiol. 104 (1), 101–102.
Ioannides, A.A., 1995. Estimates of 3D brain activity ms byms from biomagnetic signals:method (MFT), results and their significance. In: Eiselt, E., Zwiener, U., Witte, H.(Eds.), Quantitative and Topological EEG and MEG analysis. UniversitatsverlagDruckhaus-Maayer GmbH, Jena, pp. 59–68.
Ioannides, A.A., 2006. Magnetoencephalography as a research tool in neuroscience:State of the art. Neuroscientist 12, 524–544.
Ioannides, A.A., Bolton, J.P.R., Clarke, C.J.S., 1990. Continuous probabilistic solutions tothe biomagnetic inverse problem. Inverse problem 6, 523–542.
Ioannides, A.A., Hellstrand, E., Abraham-Fuchs, K., 1993a. Point and distributed currentdensity analysis of interictal epileptic activity recorded bymagnetoencephalography.Physiol. Meas. 14, 121–130.
Ioannides, A.A., Singh, K.D., Hasson, R., Baumann, S.B., Rogers, R.L., Guinto, F.C.,Papanicolaou, A.C., 1993b. Comparison of current dipole and magnetic fieldtomography analyses of the cortical response to auditory stimuli. Brain Topogr. 6,27–34.
Ioannides, A.A., Kostopoulos, G.K., Laskaris, N.A., Liu, L.C., Shibata, T., Schellens, M.,Poghosyan, V., Khurshudyan, A., 2002. Timing and connectivity in the humansomatosensory cortex from single trial mass electrical activity. Hum. Brain Mapp.15, 231–246.
Inui, K., Wang, X., Tamura, Y., Kaneoke, Y., Kakigi, R., 2004. Serial processing in thehuman somatosensory system. Cereb. Cortex 14 (8), 851–857.
Jakobs, O., Wang, L.E., Dafotakis, M., Grefkes, C., Zilles, K., Eickhoff, S.B., 2009. Effects oftiming and movement uncertainty implicate the temporo-parietal junction in theprediction of forthcoming motor actions. Neuroimage 47 (2), 667–677.
Jones, E.G., Powell, T.P.S., 1970. Connexions of the somatic sensory cortex of the rhesusmonkey. III. Thalamic connexions. Brain 93, 37–56.

73C. Papadelis et al. / NeuroImage 54 (2011) 60–73
Kakigi, R., 1994. Somatosensory evoked magnetic fields following median nervestimulation. Neurosci. Res. 20 (2), 165–174.
Karhu, J., Tesche, C.D., 1999. Simultaneous early processing of sensory input in humanprimary (SI) and secondary (SII) somatosensory cortices. J. Neurophysiol. 81 (5),2017–2025.
Kawamura, T., Nakasato, N., Seki, K., Kanno, A., Fujita, S., Fujiwara, S., Yoshimoto, T.,1996. Neuromagnetic evidence of pre- and post-central cortical sources ofsomatosensory evoked responses. Electroencephalogr. Clin. Neurophysiol. 100(1), 44–50.
Kimura, T., Ozaki, I., Hashimoto, I., 2008. Impulse propagation along thalamocorticalfibers can be detected magnetically outside the human brain. J. Neurosci. 28 (47),12535–12538.
Korvenoja, A., Wikstrom, H., Huttunen, J., Virtanan, J., Laine, P., Aronen, H.J.,Seppalainen, A.M., Ilmoniemi, R.J., 1995. Activation of ipsilateral primarysensorimotor cortex bymedian nerve stimulation. NeuroReport 6 (18), 2589–2593.
Laskaris, N.A., Ioannides, A.A., 2001. Exploratory data analysis of evoked response singletrials based on minimal spanning tree. Clin. Neurophysiol. 112 (4), 698–712.
Laskaris, N.A., Liu, L.C., Ioannides, A.A., 2003. Single-trial variability in early visualneuromagnetic responses: an explorative study based on the regional activationcontributing to the N70m peak. Neuroimage 20 (2), 765–783.
Leahy, R.M., Mosher, J.C., Spencer, M.E., Huang, M.X., Lewine, J.D., 1998. A study ofdipole localization accuracy for MEG and EEG using a human skull phantom.Electroencephalogr. Clin. Neurophysiol. 107 (2), 159–173.
Lee, T.W., Girolami, M., Sejnowski, T.J., 1999. Independent component analysis using anextended INFOMAX algorithm for mixed sub-Gaussian and super-Gaussiansources. Neural Comput. 11, 606–633.
Liu, L.C., Ioannides, A.A., Mueller-Gaertner, H.W., 1998. Bi-hemispheric study of singletrial MEG signals of the human auditory cortex. Electroenceph. Clin. Neurophysiol106, 64–78.
Mauguière, F., Merlet, I., Forss, N., Vanni, S., Jousmäki, V., Adeleine, P., Hari, R., 1997.Activation of a distributed somatosensory cortical network in the human brain. Adipole modelling study of magnetic fields evoked by median nerve stimulation.Part I: Location and activation timing of SEF sources. Electroencephalogr. Clin.Neurophysiol. 104 (4), 281–289.
McCarthy, G., Wood, C.C., Allison, T., 1991. Cortical somatosensory evoked potentials. I.Recordings in the monkey Macaca fascicularis. J. Neurophysiol. 66 (1), 53–63.
Mima, T., Nagamine, T., Nishitani, N., Mikuni, N., Ikeda, A., Fukuyama, H., Takigawa, T.,Kimura, J., Shibasaki, H., 1998. Cortical myoclonus: sensorimotor hyperexcitability.Neurology 50 (4), 933–942.
Mitzdorf, U., 1985. Current source-density method and application in cat cerebralcortex: investigation of evoked potentials and EEG phenomena. Physiol. Rev. 65,37–100.
Mohlberg, H., Lerch, J., Amunts, K., Evans, A.C., Zilles, K., 2003. Probabilisticcytoarchitectonic maps transformed into MNI space. 9th International Conferenceon Functional Mapping of the Human Brain, June 19–22, 2003, New York. :NeuroImage, 19(2). Academic Press, San Diego.
Moradi, F., Liu, L.C., Cheng, K., Waggoner, R.A., Tanaka, K., Ioannides, A.A., 2003.Consistent and precise localization of brain activity in human primary visual cortexby MEG and fMRI. Neuroimage 18 (3), 595–609.
Papadelis, C., Poghosyan, V., Fenwick, P.B., Ioannides, A.A., 2009. MEG's ability to localiseaccurately weak transient neural sources. Clin. Neurophysiol. 120 (11), 1958–1970.
Papadelis, C., Poghosyan, V., Ioannides, A.A., 2007. Phantom study supports claim ofaccurate localization from MEG data. Int. J. Bioelectromagnetism 9 (3), 163–167.
Papakostopoulos, D., Crow, H.J., 1980. Direct recording of the somatosensory evokedpotentials from the cerebral cortex of man and the difference between precentraland postcentral potentials. In: Desmedt, J.E. (Ed.), Clinical Uses of Cerebral,Brainstem and Spinal Somatosensory Evoked Potentials. : Progr Clin Neurophysiol,vol. 7. Basel, Karger, pp. 15–26.
Phillips, J.W., Leahy, R.M., Mosher, J.C., 1997. MEG-based imaging of focal neuronalcurrent sources. IEEE Trans. Med. Imaging 16, 338–348.
Poghosyan, V., Ioannides, A.A., 2008. Attention modulates earliest responses in theprimary auditory and visual cortices. Neuron 58, 802–813.
Powell, T.P.S., Mountcastle, V.B., 1959. The cytoarchitecture of the postcentral gyrus ofthe monkey Macaca mulatta. Bull. Johns Hopkins Hosp. 105, 108–131.
Prieto, E.A., Barnikol, U.B., Soler, E.P., Dolan, K., Hesselmann, G., Mohlberg, H., Amunts,K., Zilles, K., Niedeggen, M., Tass, P.A., 2007. Timing of V1/V2 and V5+ activationsduring coherent motion of dots: an MEG study. Neuroimage 37 (4), 1384–1395.
Rossini, P.M., Deuschl, G., Pizzella, V., Tecchio, F., Pasquarelli, A., Feifel, E., Romani, G.L.,Lücking, C.H., 1996. Topography and sources of electromagnetic cerebral responsesto electrical and air-puff stimulation of the hand. Electroencephalogr. Clin.Neurophysiol. 100 (3), 229–239.
Schlag, J., 1973. Generation of brain evoked potentials. In: Thompson, R.F., Patterson, M.M.(Eds.), Bioelectric Recording Techniques: Cellular Processes and Brain Potentials, NewYork: Academic, part. A, pp. 273–316.
Schleicher, A., Palomero-Gallagher, N., Morosan, P., Eickhoff, S.B., Kowalski, T., de Vos,K., Amunts, K., Zilles, K., 2005. Quantitative architectural analysis: a new approachto cortical mapping. Anat. Embryol. (Berl) 210 (5–6), 373–386.
Stohr, P.E., Goldring, S., 1969. Origin of somatosensory evoked scalp responses inman. J.Neurosurg. 31, 117–127.
Taylor, J.G., Ioannides, A.A., Muller-Gartner, H.W., 1999. Mathematical analysis of leadfield expansions. IEEE Trans. Med. Imaging 18, 151–163.
Tecchio, F., Pasqualetti, P., Pizzella, V., Romani, G., Rossini, P.M., 2000. Morphology ofsomatosensory evoked fields: inter-hemispheric similarity as a parameter forphysiological and pathological neural connectivity. Neurosci. Lett. 287 (3), 203–206.
Tecchio, F., Rossini, P.M., Pizzella, V., Cassetta, E., Romani, G.L., 1997. Spatial propertiesand interhemispheric differences of the sensory hand cortical representation: aneuromagnetic study. Brain Res. 767 (1), 100–108.
Tesche, C.D., Karhu, J., 1997. Somatosensory evoked magnetic fields arising fromsources in the human cerebellum. Brain Res. 744 (1), 23–31.
Tiihonen, J., Hari, R., Hämäläinen, M., 1989. Early deflections of cerebral magneticresponses to median nerve stimulation. Electroencephalogr. Clin. Neurophysiol. 74(4), 290–296.
Tootell, R.B., Reppas, J.B., Kwong, K.K., Malach, R., Born, R.T., Brady, T.J., Rosen, B.R.,Belliveau, J.W., 1995. Functional analysis of human MT and related visual corticalareas using magnetic resonance imaging. J. Neurosci. 15 (4), 3215–3230.
Towe, A.L., 1966. On the nature of the primary evoked response. Exp. Neurol. 15, 113–139.Vates, G.E., Lawton, M.T., Wilson, C.B., McDermott, M.W., Halbach, V.V., Roberts, T.P.,
Rowley,H.A., 2002.Magnetic source imagingdemonstrates altered cortical distributionof function in patients with arteriovenous malformations. Neurosurgery 51 (3),614–623.
Vogt, B.A., Pandya, D.N., 1978. Cortico-cortical connections of somatic sensory cortex(areas 3, 1 and 2) in the rhesus monkey. J. Comp. Neurol. 177 (2), 179–191.
Wikström, H., Huttunen, J., Korvenoja, A., Virtanen, J., Salonen, O., Aronen, H.,Ilmoniemi, R.J., 1996. Effects of interstimulus interval on somatosensory evokedmagnetic fields (SEFs): a hypothesis concerning SEF generation at the primarysensorimotor cortex. Electroencephalogr. Clin. Neurophysiol. 100 (6), 479–487.
Wilms, M., Eickhoff, S.B., Specht, K., Amunts, K., Shah, N.J., Malikovic, A., Fink, G.R., 2005.Human V5/MT+: comparison of functional and cytoarchitectonic data. Anat.Embryol. (Berl) 210, 485–495.
Wilms, M., Eickhoff, S.B., Hömke, L., Rottschy, C., Kujovic, M., Amunts, K., Fink, G.R.,2010. Comparison of functional and cytoarchitectonic maps of human visual areasV1, V2, V3d, V3v, and V4(v). Neuroimage 49 (2), 1171–1179.
Wohlschläger, A.M., Specht, K., Lie, C.-H., Mohlberg, H., Wohlschläger, A., Bente, K.,Pietrzyk, U., Stöcker, T., Zilles, K., Amunts, K., Fink, G.R., 2005. Linking retinotopicfMRI mapping and anatomical probability maps of human occipital areas V1 andV2. Neuroimage 26, 73–82.
Wood, C.C., Cohen, D., Cuffin, B.N., Yarita, M., Allison, T., 1985. Electrical sources inhuman somatosensory cortex: identification by combined magnetic and potentialrecordings. Science 227 (4690), 1051–1053.
Wood, C.C., Allison, T., McCarthy, G., Spencer, D.D., Williamson, P.D., 1986. Somatosen-sory evoked potentials following surgical excision of human somatosensory ormotor cortex. Soc. Neurosci. Abstr. 12, 1432.
Wood, C.C., Spencer, D.D., Allison, T., McCarthy, G., Williamson, P.D., Goff, W.R., 1988.Localization of human sensorimotor cortex during surgery by cortical surfacerecording of somatosensory evoked potentials. J. Neurosurg. 68 (1), 99–111.
Wunderlich, G., Knorr, U., Herzog, H., Kiwit, J.C., Freund, H.J., Seitz, R.J., 1998. Precentralglioma location determines the displacement of cortical hand representation.Neurosurgery 42 (1), 18–26.
Yang, T.T., Gallen, C.C., Schwartz, B.J., Bloom, F.E., 1993. Noninvasive somatosensoryhomunculus mapping in humans by using a large-array biomagnetometer. Proc.Natl Acad. Sci. 90 (7), 3098–3102.
Young, J.P., Geyer, S., Grefkes, C., Amunts, K., Morosan, P., Zilles, K., Roland, P.E., 2003.Regional cerebral blood flow correlations of somatosensory areas 3a, 3b, 1, and 2 inhumansduring rest: A PET andcytoarchitectural study.Hum. BrainMapp. 19, 183–196.
Zeki, S., Watson, J.D., Lueck, C.J., Friston, K.J., Kennard, C., Frackowiak, R.S., 1991. A directdemonstration of functional specialization in human visual cortex. J. Neurosci. 11(3), 641–649.
Zilles, K., Schleicher, A., Palomero-Gallagher, N., Amunts, K., 2002. Quantitative analysisof cyto- and receptor architecture of the human brain. In: Mazziotta, J., Toga, A.(Eds.), Brain Mapping, the Methods, Elsevier, pp. 573–602.
Zilles, K., Amunts, K., 2010. Centenary of Brodmann's map — conception and fate. Nat.Rev. Neurosci. 11 (2), 139–145.